Article

Satellite and Ground Remote Sensing Techniques to Trace the Hidden Growth of a Lava Flow Field: The 2014–2015 Effusive Eruption at Fogo Volcano (Cape Verde)

1
Istituto Nazionale di Geofisica e Vulcanologia, Osservatorio Etneo (INGV-OE), 95125 Catania, Italy
2
Faculdade de Ciências e Tecnologia (DCT), University of Cabo Verde (UNICV), CP 279 Praia, Santiago 279, Cape Verd
3
Instituto Tecnológico de Energias Renovábles de Tenerife (ITER), 38611 Granadilla de Abona, Tenerife, Spain
4
Instituto Volcanológico de Canarias (INVOLCAN), 38400 Puerto de la Cruz, Tenerife, Spain
5
Serviço Nacional de Proteção Civil de Cabo Verde, Praia, Santiago 279, Cape Verde
*
Author to whom correspondence should be addressed.
Remote Sens. 2018, 10(7), 1115; https://doi.org/10.3390/rs10071115
Submission received: 14 June 2018 / Revised: 3 July 2018 / Accepted: 6 July 2018 / Published: 12 July 2018

Abstract

:
Fogo volcano erupted in 2014–2015 producing an extensive lava flow field in the summit caldera that destroyed two villages, Portela and Bangaeira. The eruption started with powerful explosive activity, lava fountains, and a substantial ash column accompanying the opening of an eruptive fissure. Lava flows spreading from the base of the eruptive fissure produced three arterial lava flows. By a week after the start of the eruption, a master lava tube had already developed within the eruptive fissure and along the arterial flow. In this paper, we analyze the emplacement processes based on observations carried out directly on the lava flow field, remote sensing measurements carried out with a thermal camera, SO2 fluxes, and satellite images, to unravel the key factors leading to the development of lava tubes. These were responsible for the rapid expansion of lava for the ~7.9 km length of the flow field, as well as the destruction of the Portela and Bangaeira villages. The key factors leading to the development of tubes were the low topography and the steady magma supply rate along the arterial lava flow. Comparing time-averaged discharge rates (TADR) obtained from satellite and Supply Rate (SR) derived from SO2 flux data, we estimate the amount and timing of the lava flow field endogenous growth, with the aim of developing a tool that could be used for hazard assessment and risk mitigation at this and other volcanoes.

Graphical Abstract

1. Introduction

When an effusive eruption starts, the maximum distance that a flow can travel can be easily estimated based on the measured peak effusion rate [1,2,3,4]. However, when lava tubes develop within a flow, these prevent lava from cooling, increasing its ability to cover longer distances [3,5]. Lava tubes are normally hidden below tens to hundreds of meters of lava and thus it is not easy to detect them [3,6]. The increasing use of remote sensing techniques allows a more accurate and faster detection of lava tube formation [7], and is essential for hazard assessment and risk mitigation [4,8].
The general shape of a complex lava flow field is defined by a few arterial lava flows generally displaying aa (or rough) texture, with its outline modified by secondary lava flows normally having a pahoehoe (or smooth) surface [2,9,10]. Aa is the type of lava that in solidified form is characterized by a rough, jagged, spiny and generally clinkery surface and is erupted at high flow rates. Conversely, pahoehoe is characterized by a smooth, billowy, or ropy surface and is erupted at low flow rates. When lava tubes develop within complex lava flows, their hidden path is revealed by the distribution of ephemeral vents or breakouts [3,11,12]. Three types of ephemeral vents have been distinguished at Mt Etna [3], based on age and position with respect to the arterial flows and the tube system:
(1) first-order ephemeral vents open at the flow front and normally feed secondary flows with aa morphology, playing a major role in the formation and propagation of lava tubes because they are continuously supplied by lava;
(2) second-order ephemeral vents open on top of lava tubes and act as pressure release valves during periods of tube blockage, increase in the supply rate or inflation, and form aa or pahoehoe flow lobes; and
(3) third-order ephemeral vents are located at the flow margins around flows that are no longer fed, draining their interior and producing small pahoehoe or toothpaste flows. Thus, pahoehoe and toothpaste morphologies on Etna are common at the margins of aa lava flows and master tubes or in the proximal portion of aa flows that produced extensive lava tube systems [3,6,13].
The process of endogenous growth or inflation in pahoehoe lava flows was described [14] and quantified [15] a long time ago, as also its role in the formation of lava tubes within sheet flows. Since then, other studies have been devoted to recognizing inflation in active and past lava flows [5,16], describing its features [17,18,19], its importance in the growth of aa lava flow fields [3,13] and in the emplacement of flood basalts [20,21].
Inflation of a lava flow is often related to the formation of lava tubes. Preferred pathways develop in the older portions of the liquid-cored flow as the flow advances, and these pathways can evolve into lava tube systems within a few weeks [15]. Inflation combined with flow overlapping causes a slow and mostly undetected expansion of a complex lava flow field, and can result in sudden reactivation of previously stagnating lava flow fronts [3,6,15,22,23,24].
Quantitative measurements of the amount of magma intruded within a lava flow field and causing inflation are scant and normally carried out only on a portion of a compound lava flow field [21,23,24,25,26,27,28]. On pahoehoe flows from Kilauea, a volumetric growth of ten times the initial flow lobe by inflation has been documented [15]. However, to the best of our knowledge, there are no published data offering an estimate of the amount of endogenous growth for a whole lava flow field, although a previous study carried out on Kilauea evaluated the partitioning of lava between surface and tube flows but was limited by lava spilling into the ocean [29]. In this paper, we present for the first time an estimation of the total volume endogenously intruded within the lava flow field of the Fogo 2014–2015 eruption. We obtained this estimate by comparing results of time averaged discharge rate (TADR) from satellite measurements [30] and of magma supply rate (SR) from the source as retrieved from daily measurements of SO2 flux, which is related to the amount of degassing magma intruded within the system [31,32]. Given that satellite images only detect surface emplacement of lava, and that SO2 flux instead is related to the total magma volume stored in the source region [32] and feeding the eruption, the difference between the two should give an estimation of the magma intruded within the lava flow field and responsible for its inflation and supplying lava tubes. We compare these results with satellite and field data on the lava flow field growth as well as published erupted volumes, and explain the fast growth of the lava flow field at its northern end that caused the destruction of the villages of Portela and Bangaeira. Provided that routine SO2 flux measurements and fast calculation of TADR from satellite imagery can be carried out, these results could be applied during future eruptions to detect lava flow field inflation. This would help predict, hopefully well in advance, the formation of lava tubes that extend lava flow fields at this and other basaltic volcanoes.

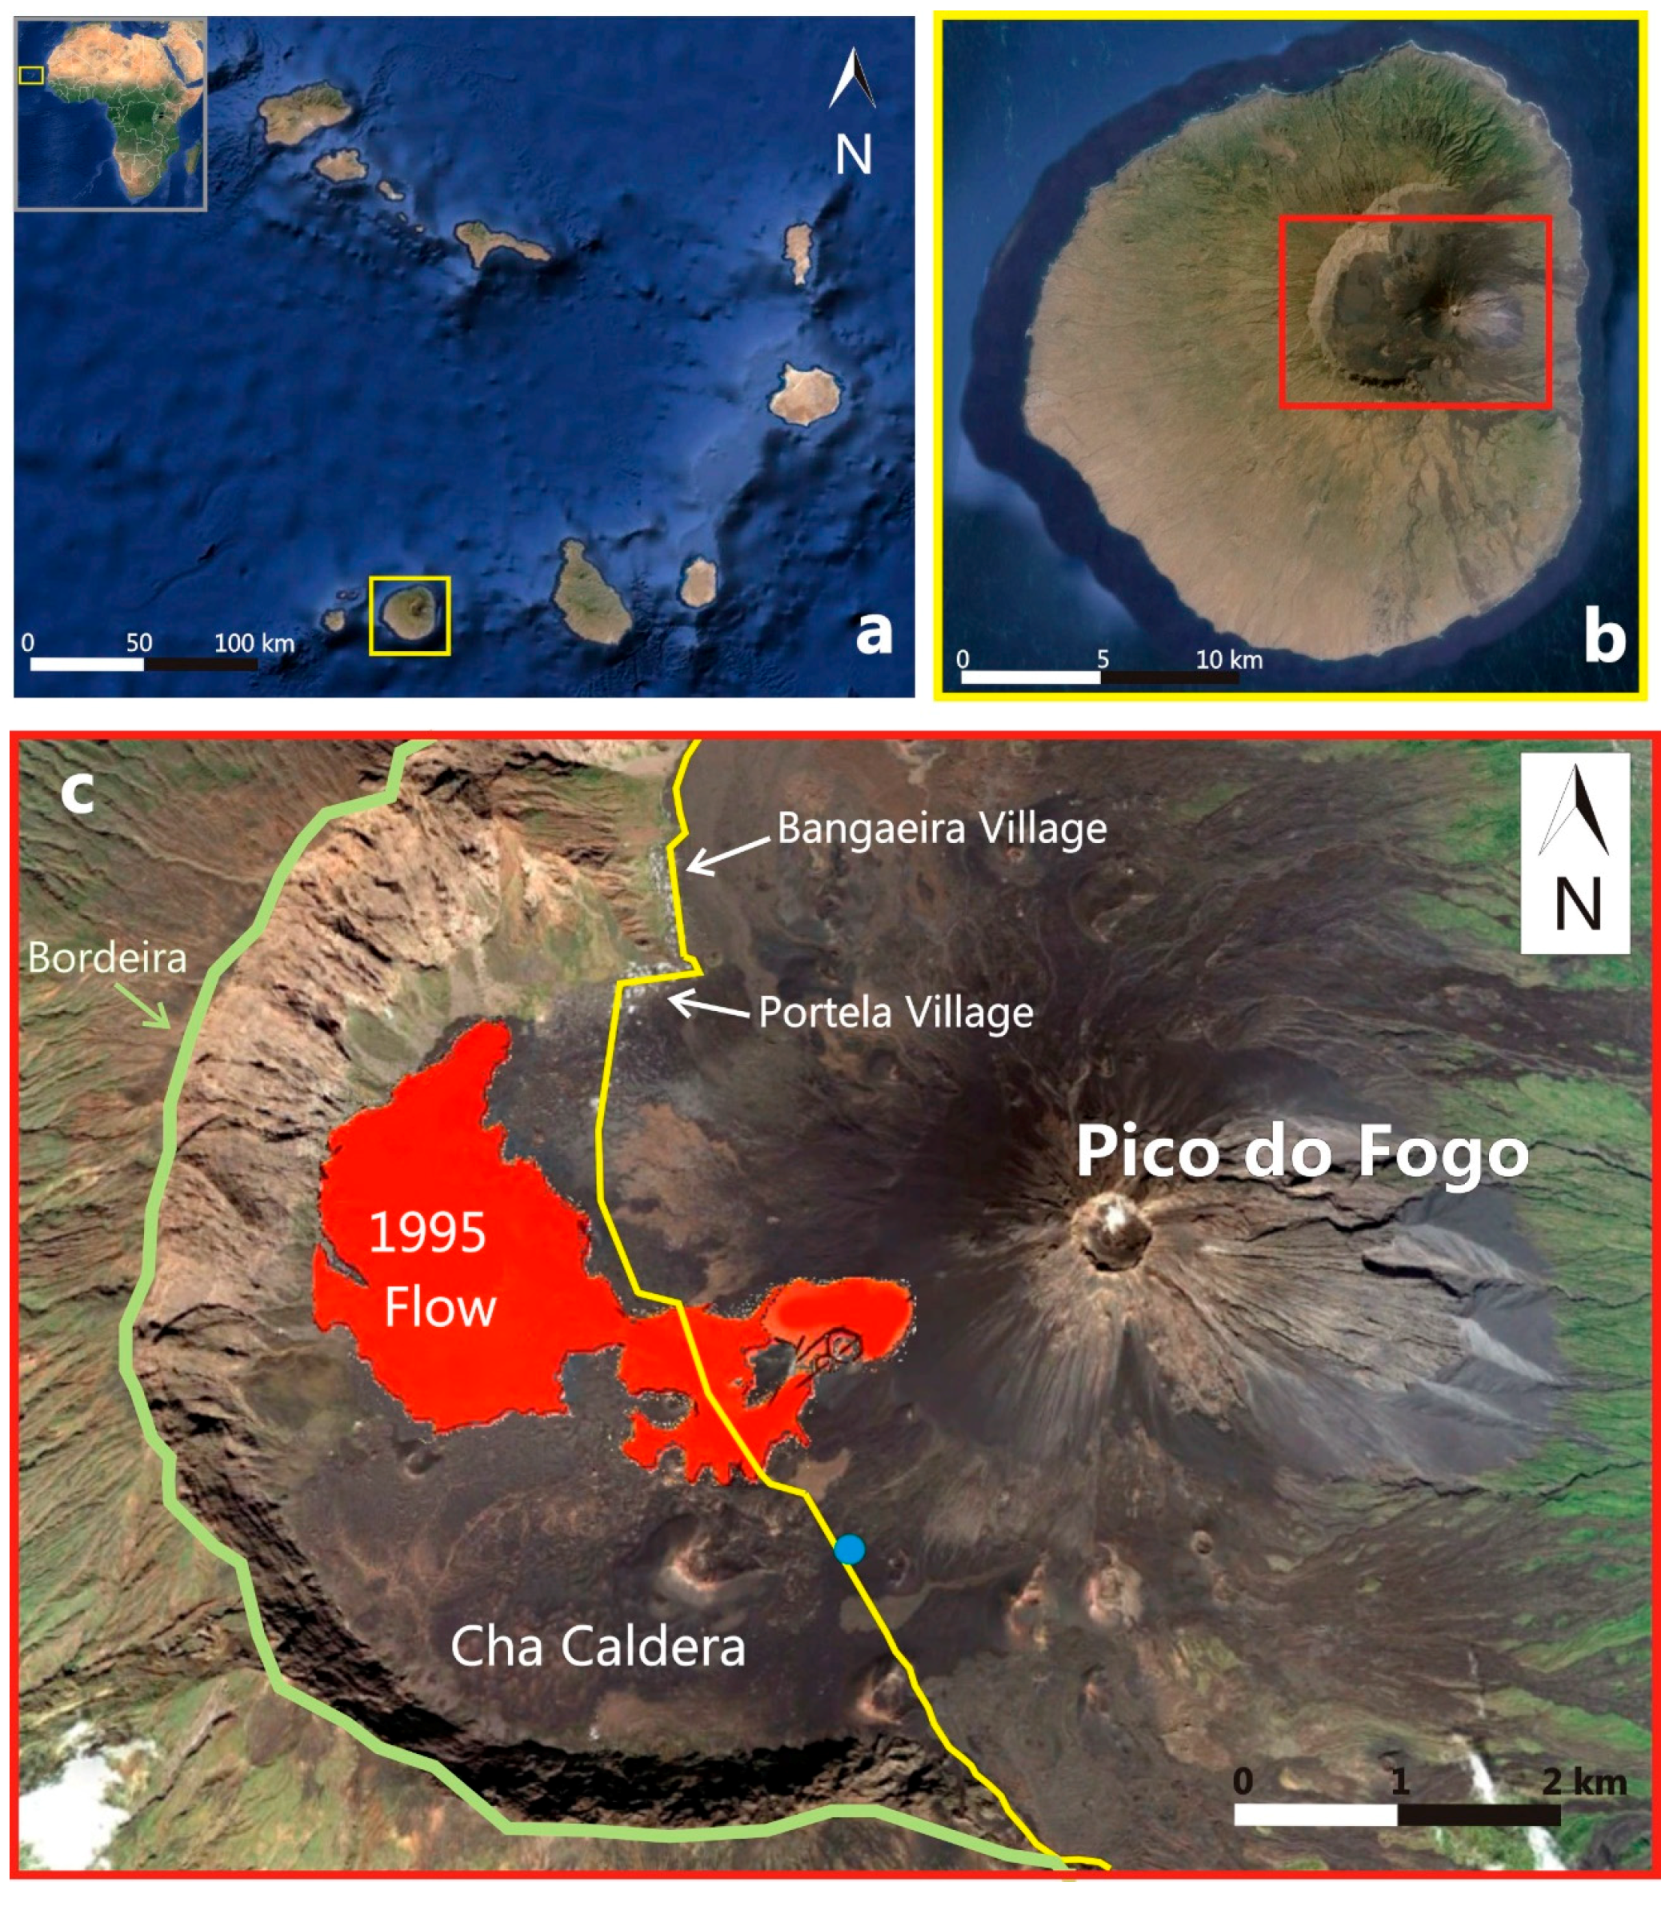
2. Geologic Background

Cape Verde Islands comprise a ~50 Ma old volcanic archipelago located ~700 km off West (W) Africa (Figure 1a). The archipelago lies on the African plate, which drifts at a velocity of ~0.9 cm/year above a hot spot mantle plume [33,34]. Fogo Island is located at the SW end of the archipelago (Figure 1a), and has a conical shape, with a diameter of ~25 km and an elevation of ~2829 m (Figure 1b). The summit is truncated at ~1700 m a.s.l. by the Cha Caldera (Figure 1c), a 9 km wide depression open to East (E) by a flank collapse scar [35] formed ~73 ka [36]. The upper part of this depression has a flat bottom, confined to the North (N), W and South (S) by the 1000 m high vertical cliff known as Bordeira (Figure 1c). The eastern boundary of the depression is occupied by the ~1100-m-high active volcano named Pico do Fogo (Figure 1c), which gave rise between 1500 and 1750 CE to several eruptions from its summit. After this lapse of time, ~9 eruptive events occurred from fissures at its base, with the last episode in 1995 [34] (Table S1 and Figure 1c). Eruptive activity at Fogo is fed directly from the mantle plume at depths greater than 16 km, with an estimated magma SR of 1.7 × 10⁶ m3 year−1 during the last three centuries [34]. No shallow magma storage has been found during the last effusive eruptions, and an estimated 16–24 km depth has been inferred for the magma storage that fed the 1995 eruption [37]. Erupted lavas range in composition from basanites, tephrites and nephelinites [38], with the 1995 eruption producing cogenetic basanites and phonotephrites [37].

3. Methods

Fogo volcano and the fumaroles located within the summit crater of Pico do Fogo (Figure 1c) have been monitored since 2008 by the Instituto Volcanológico de Canarias (INVOLCAN, Canary Islands, Spain [40,41,42]). The 2014–2015 eruption was jointly monitored by researchers from the University of Cape Verde (UNICV) and from INVOLCAN directly in field, and remotely by the Istituto Nazionale di Geofisica e Vulcanologia—Osservatorio Etneo (INGV-OE) of Italy through satellite images [30,43]. The amount and quality of data collected during the eruption allowed us to reconstruct the expansion of the lava flow field even during the phases of inflation and endogenous growth, leading to the identification of a master lava tube that was eventually responsible for the destruction of the villages of Portela and Bangaeira.
The chronology of the eruption described in this paper has been obtained through almost daily field surveys carried out by several authors of this manuscript using photos and thermal images, as well as through satellite images (i.e., Landsat-8 OLI, EO-1 ALI, Pléiades) and time-lapse frames recorded from a fixed monitoring camera. The fixed camera was installed by INVOLCAN on 27 November 2014 on a 4-m-high pole located at the S entrance of the Cha Caldera valley (Figure 1c), allowing a view from the S and from a distance of ~2 km away from the eruptive fissure and proximal lava flow field. It recorded frames every 4–5 s from 30 November 2014 to 27 January 2015, automatically turning to infrared at dusk. Camera failure caused a lack of image acquisition between 1 and 12 December 2014. The morphology of the lava flow field, with the aim of identifying the hidden path of lava tubes, has been analyzed using the images freely available in Google Earth and acquired on 2 March 2016 (Image c 2016 CNES/Astrium).

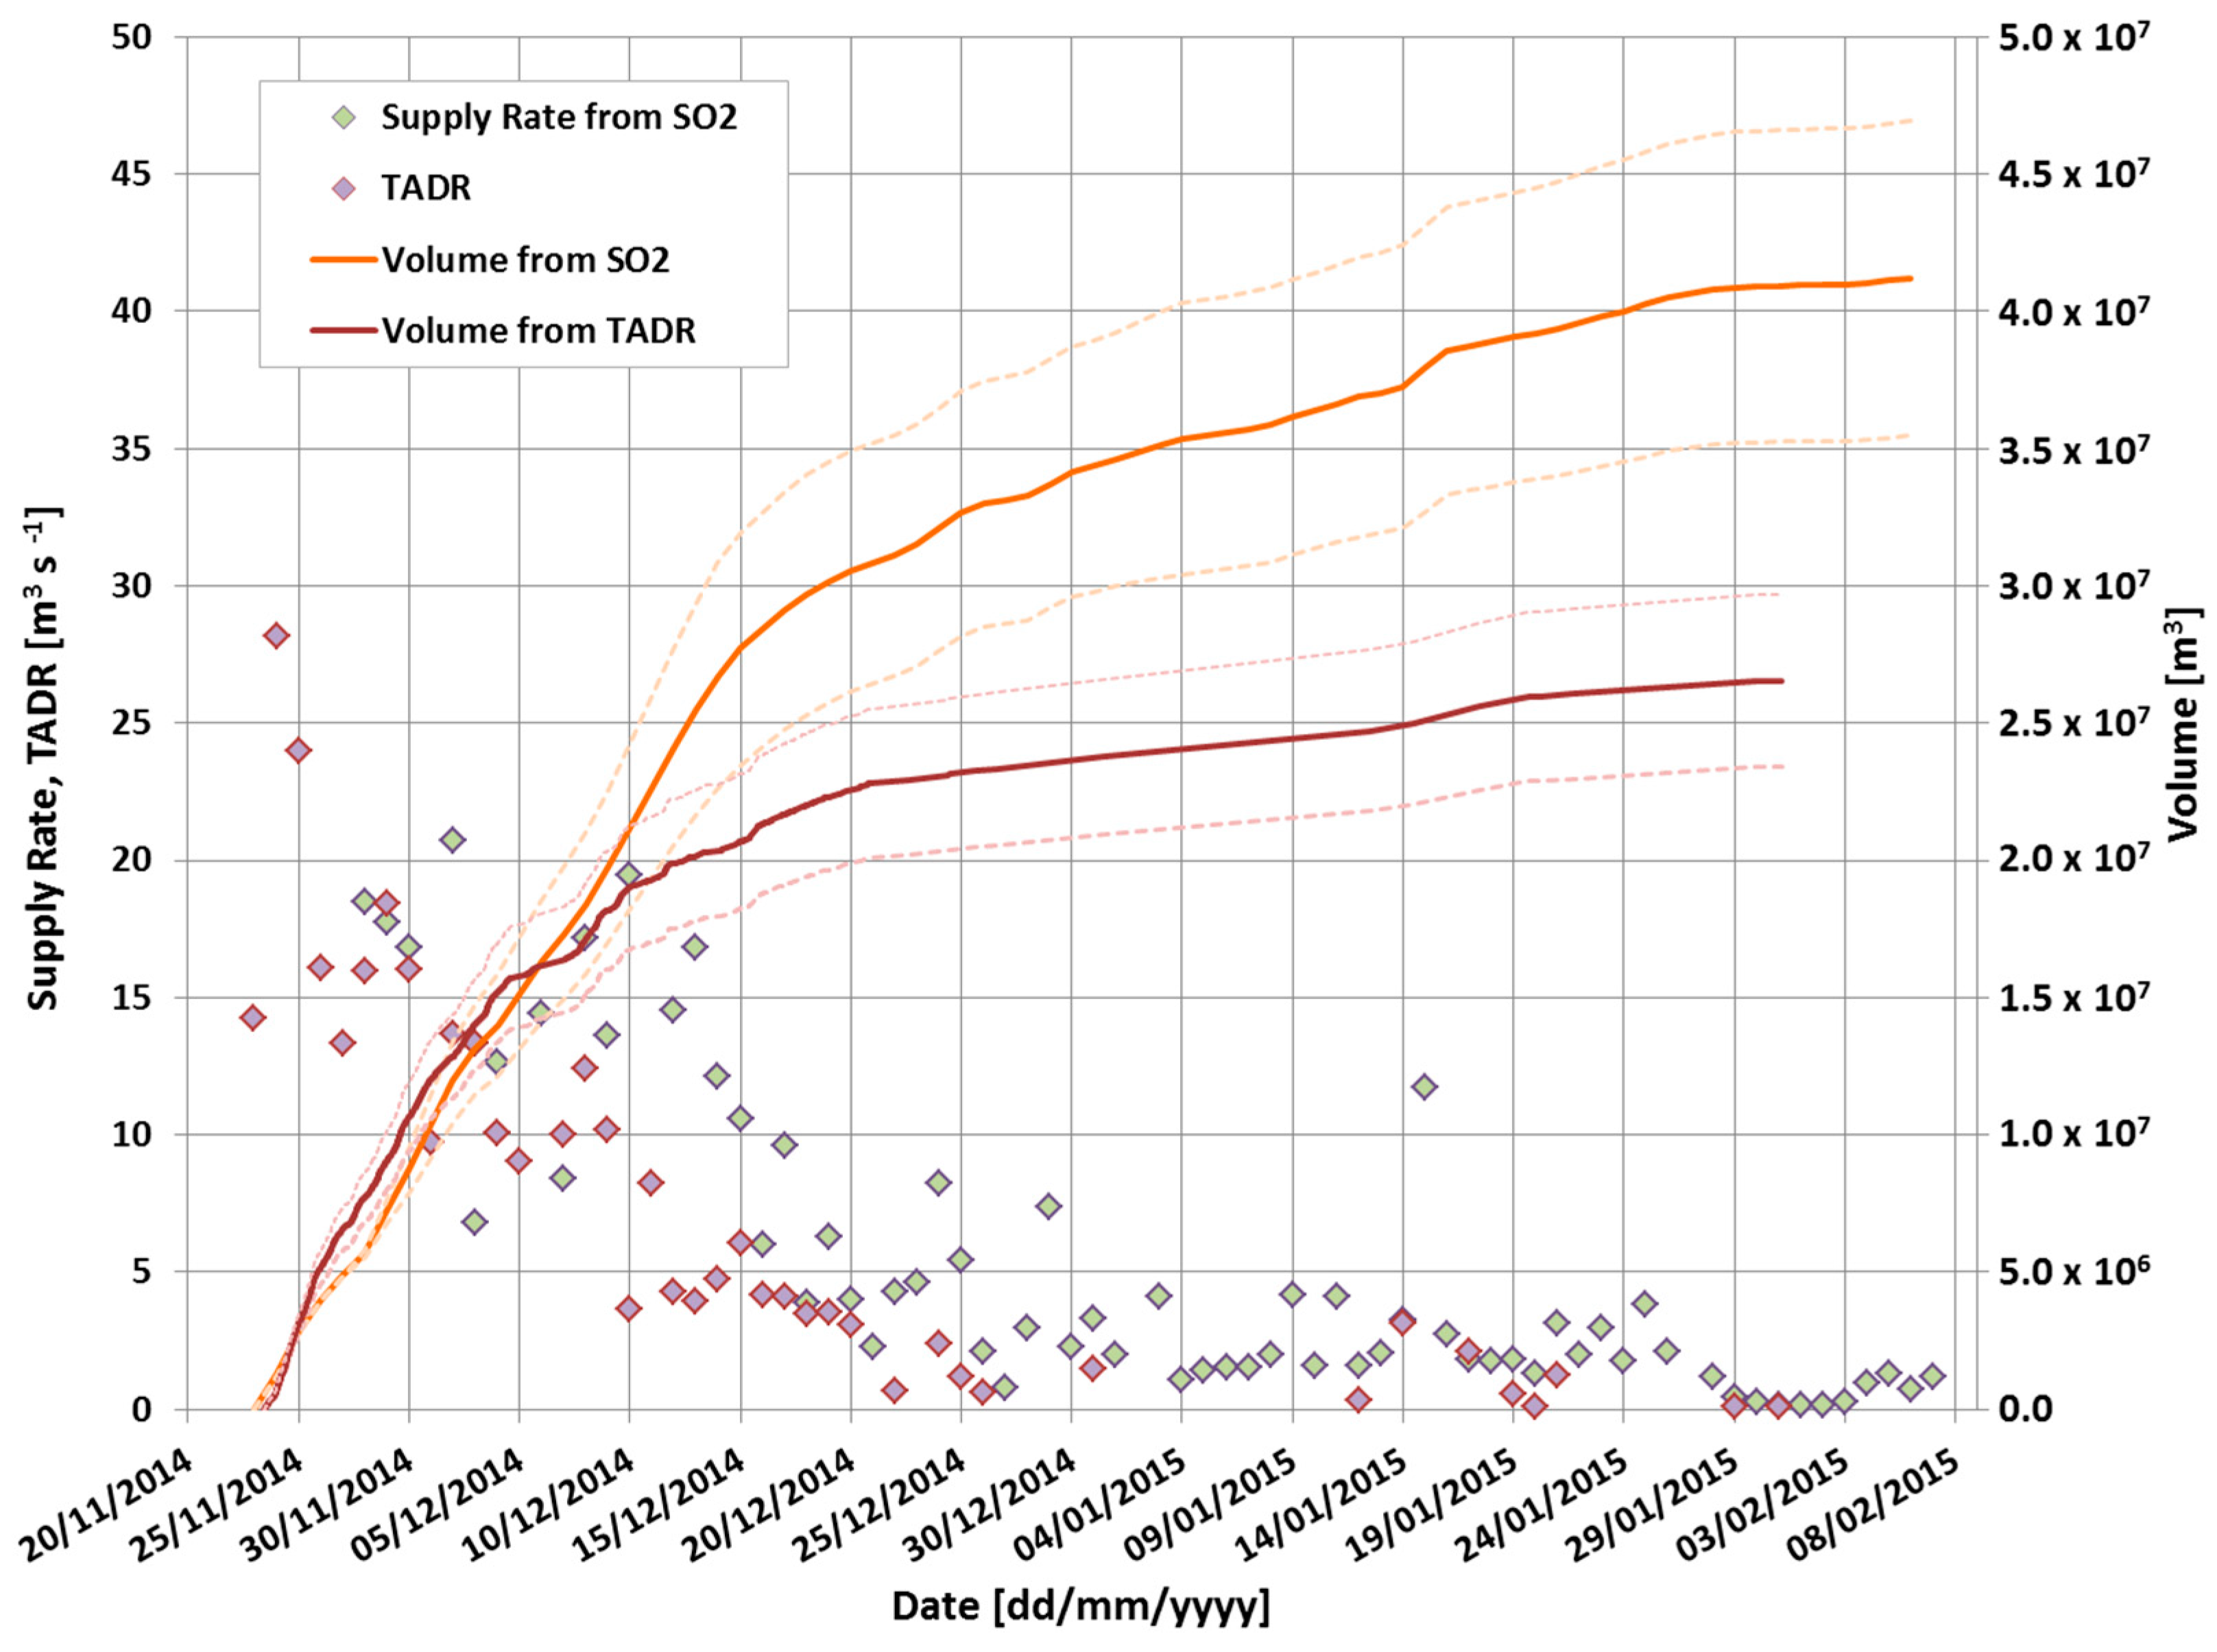
3.1. Magma Supply Rate

Two to twelve (average 5.5) daily plume SO2 flux measurements were performed along road traverses using a mini-DOAS. The mini-DOAS instrument is based on an Ocean Optics USB2000 UV spectrometer, which collects the UV radiation via an optical fiber coupled to a vertically pointing telescope [44,45]. The instrument position was tracked using a handheld Global Positioning System (GPS) receiver. The mini-DOAS measures the SO2 column density in parts per million per mass at every measurement point along the plume transect. Integrated path values were obtained by adding the products of the SO2 column density and perpendicular displacement for each segment along the path. The SO2 emission rate was obtained by multiplying the integrated path values by the average wind speed obtained using the Weather Research and Forecasting (WRF) model (http://www.wrf-model.org/index.php) [43].
Using the daily SO2 flux estimations, we calculated magma degassing rates and volumes of magma degassed in the period between 28 November 2014 and 7 February 2015. The total volume of degassed magma (Vd) was calculated using [32]:
  V d = V S 2 [ S ] ρ ( 1 x )  
where VS is the volume of elemental sulfur, [S] is the weight fraction of sulfur degassed per unit of magma, x is the crystal fraction and ρ is the density of magma. We used a value of 10% [46] as mean crystal fraction, 0.3 wt % as mean original sulfur content, and 2600 kg/m3 as density of magma, assimilating Fogo’s magma to Etna’s basalt [47].
Plume SO2 measurements were undertaken daily, allowing the degassed magma flux (in m3 s−1) to be calculated, and from the daily degassed magma volume we have obtained a time-averaged (daily) magma supply rate (SR) [48]. Given SR, we can integrate it through time to calculate the volume of degassed magma over the measurement period. Errors associated with the SO2 method have been shown to range between 20% and 30% [49].

3.2. TADR Estimation

The thermal activity at Fogo volcano was observed and quantified from multispectral-satellite data via the HOTSAT system [50]. This volcano monitoring system processes data acquired by the Moderate Resolution Imaging Spectroradiometer (MODIS, pixel nominal resolution: 1 km) as well as Spinning Enhanced Visible and Infrared Imager (SEVIRI, pixel resolution: 3 km at nadir) sensors to: (i) locate thermal anomalies; (ii) compute the associated radiant heat flux; and (iii) provide an estimation of the time averaged discharge rate (TADR [51]). Clouds in satellite data can alter or mask the thermal activity, thus they are retrieved by using a texton-based cloud detection algorithm [52], and a cloud index is provided to interpret the radiant heat flux signal. The hotspot detection algorithm is based on a contextual approach [53] and the radiant heat flux is computed following Wooster et al. [54]. Radiant heat flux curves provided by HOTSAT were compared against ground thermal camera data providing comparable results both for a small lava flow [55] and for the Nyiragongo lava lake [56]. TADR is computed from radiant heat flux by using:
  T A D R =   Q ρ ( C p Δ T + C L Δ φ )  
where Q is the total thermal flux obtained summing up the radiant heat flux computed for each hot spot pixel, ρ is the lava density, Cp is the specific heat capacity, ∆T is the eruption temperature minus temperature at which flow stops, CL is the latent heat of crystallization, and ∆ϕ is the volume percent of crystals that form while cooling through ∆T [57]. TADR were calculated by considering, in the variability range of each lava parameter, the largest values [30]. Moreover, for the percentage of crystals and temperature variations, we used the recent constrained values [46].
HOTSAT uses satellite images as soon as they are available, i.e., every 15 min in the case of SEVIRI full disk, up to 5 min in the case of SEVIRI Rapid Scanning for the northern third of Meteosat disc.

4. Results

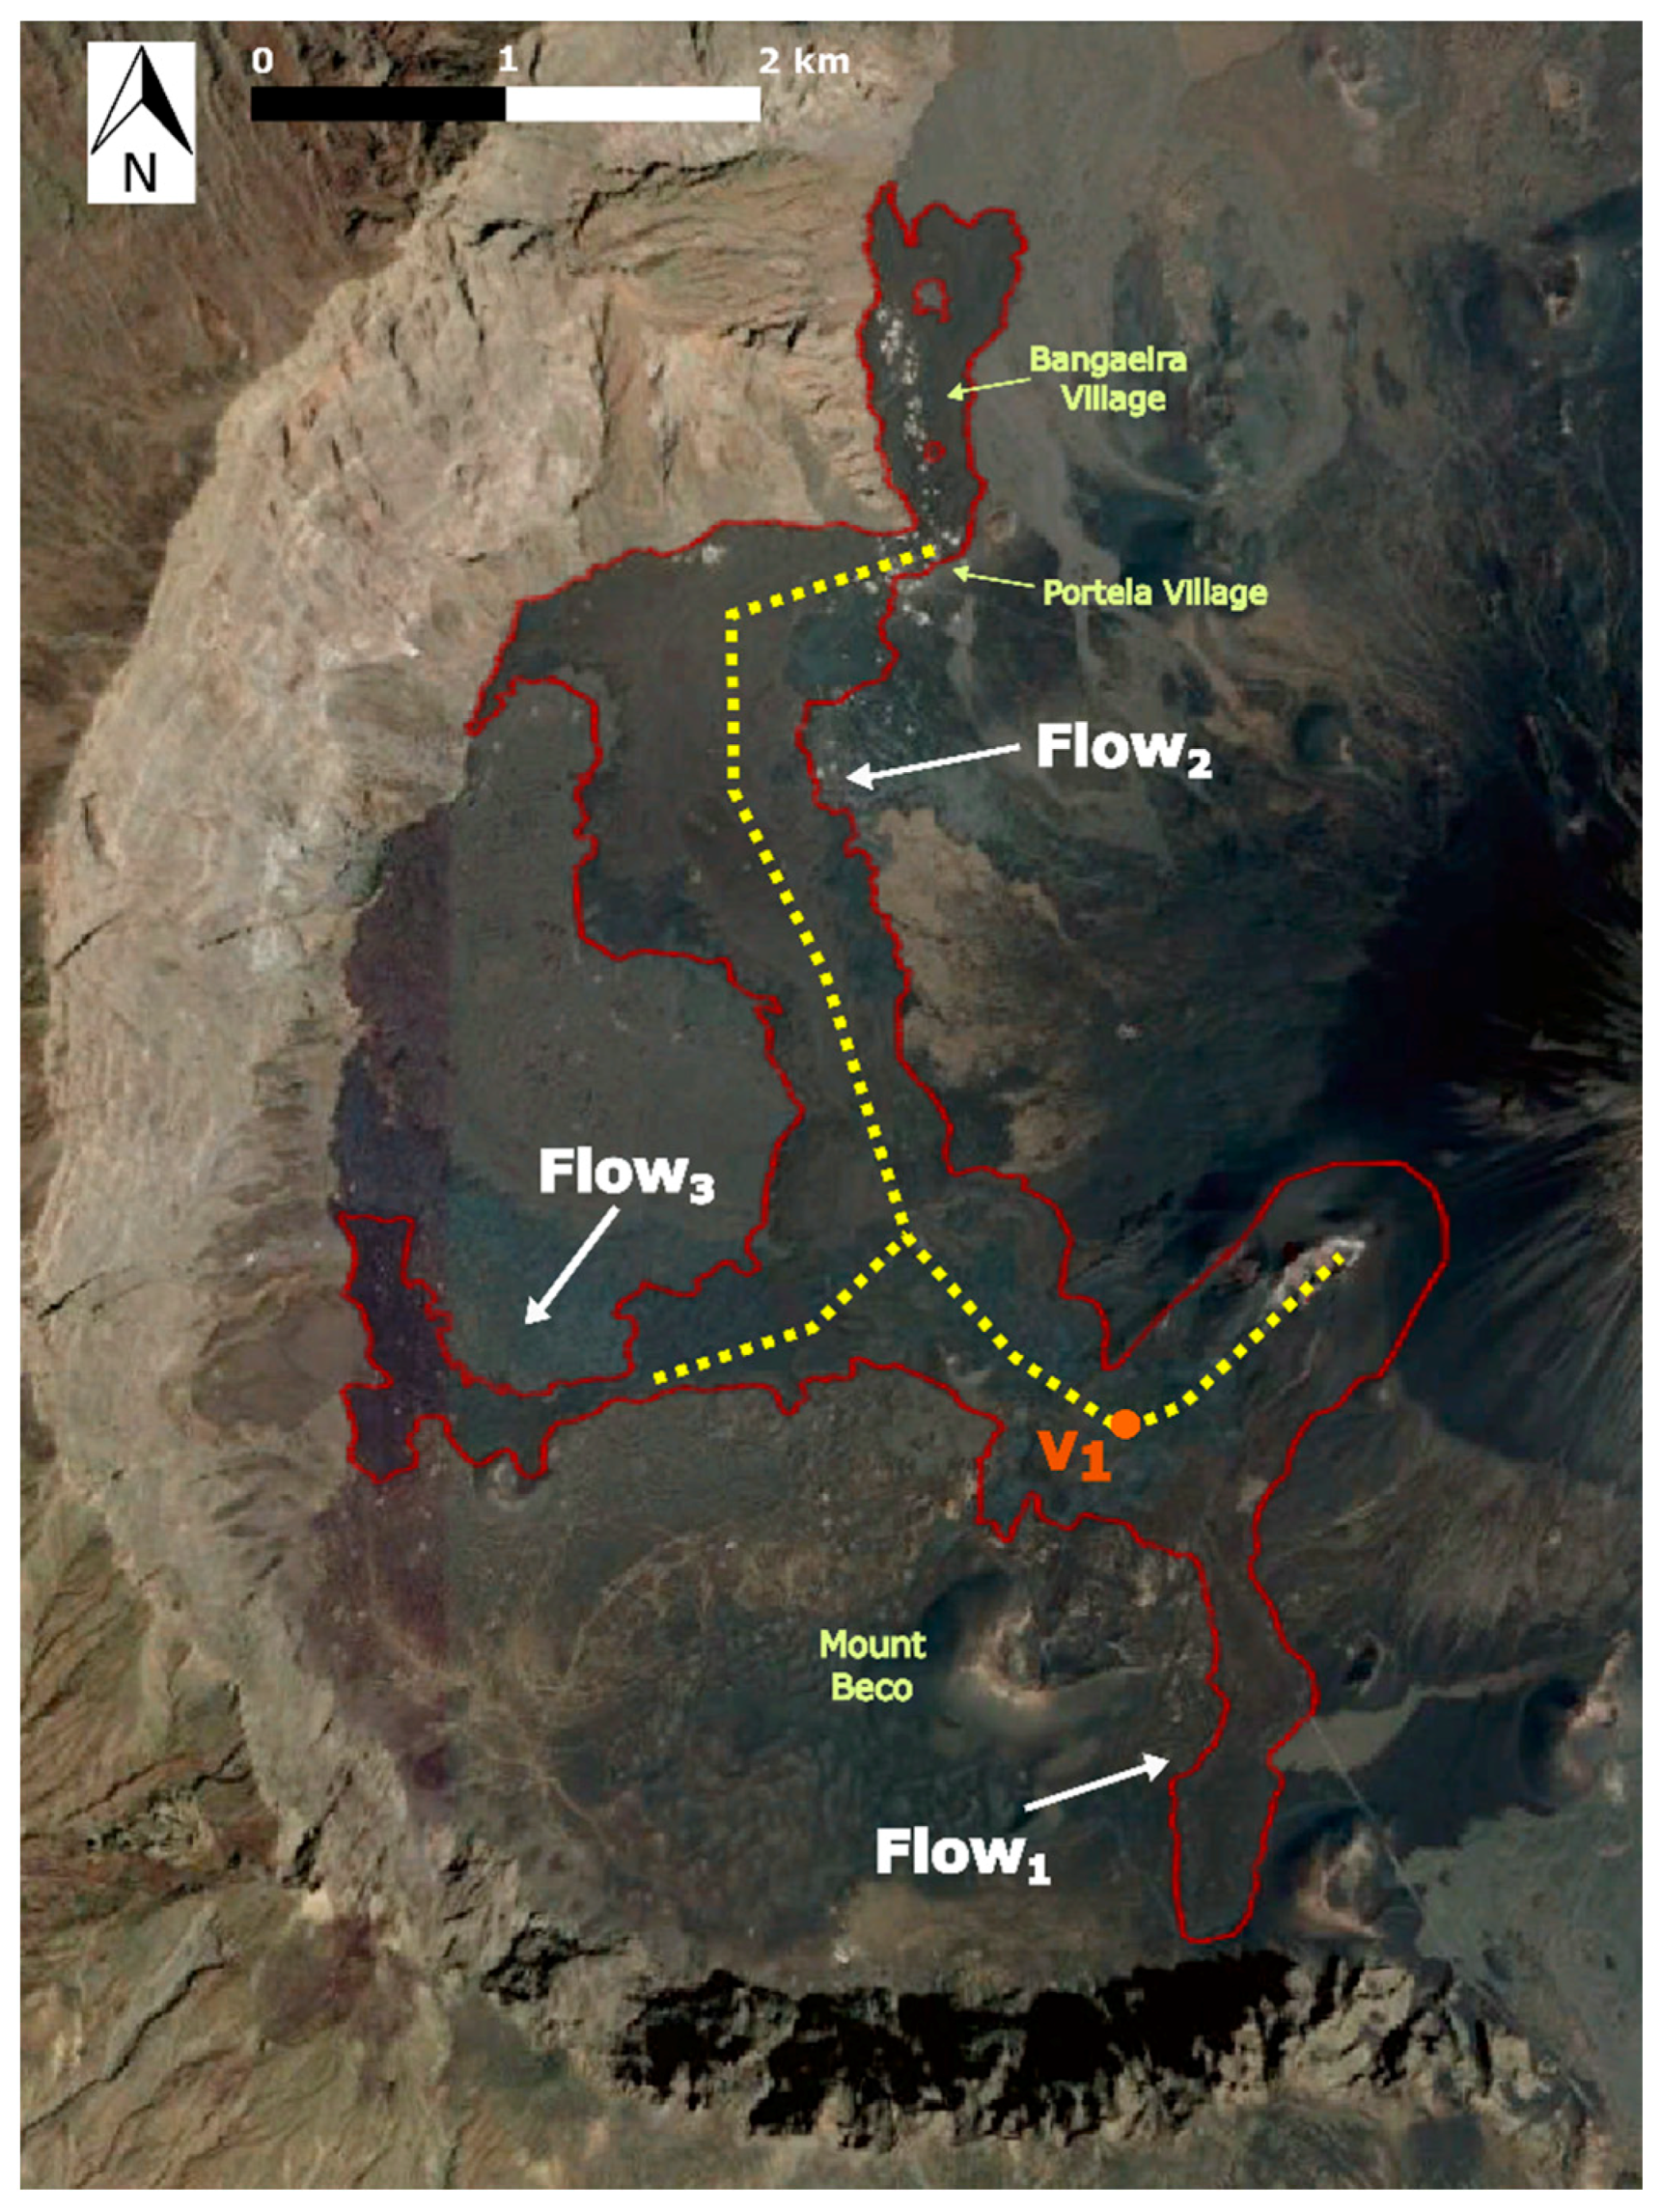
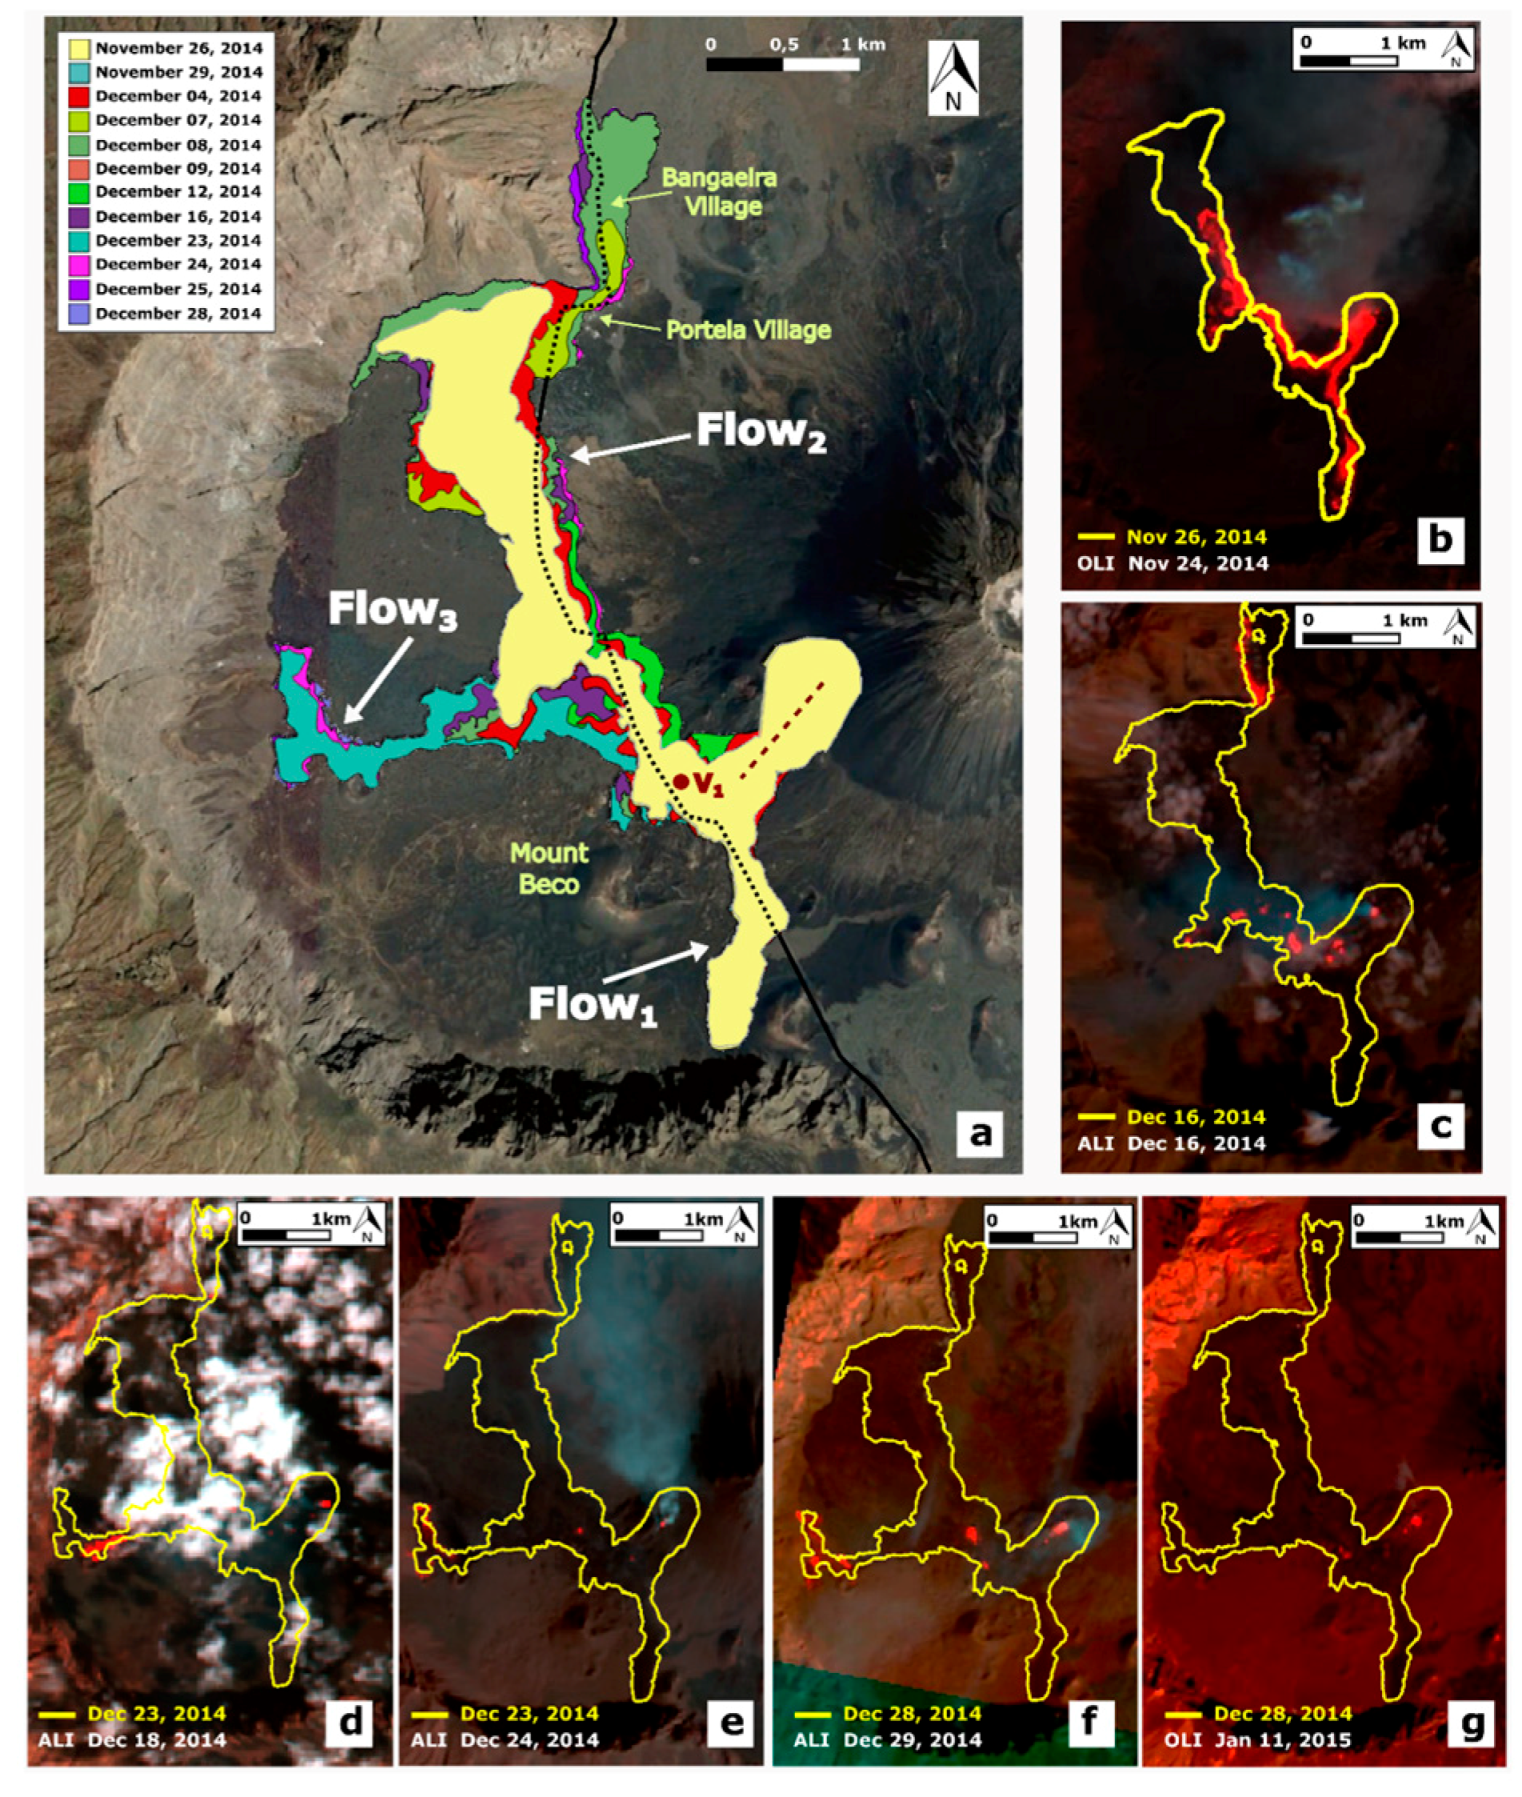
4.1. Chronology of the Eruption

The first few days of the eruption were characterized by sudden changes in the eruptive activity and fast growth of the lava flows. The main events are summarized in Table S1, and Figure 2a displays the key phases of growth of the lava flow field. Figure 2b–g shows the active portion of the lava flow field (in red) as observed by satellites, compared to the nearest lava flow field map (yellow outline).
The eruption started on 23 November 2014 at 09:45 LT (local time; all times in this paper are LT and given as hh:mm) within the Cha Caldera depression. It began with the opening of an east-northeast–west-southwest (ENE-WSW), ~700-m-long eruptive fissure at the southwest (SW) base of the Pico do Fogo cone between 2200 m and 1800 m above sea level (a.s.l.), close to the previous 1995 fissure (Figure 1 and Figure 2). Four eruptive vents opened along the fissure, giving rise to powerful Strombolian explosive activity that within a few hours became lava fountains, forming a ~6 km high ash plume (estimated by the Capo Verde Express pilots). At 10:00, lava flows erupted from a vent at ~2100 m a.s.l., spreading at first SW along the fissure, then splitting at its base in two directions: south (S) (Flow 1) and north-northwest (NNW, Flow 2), being divided by the hill of Mount Beco (Figure 2a,b), and then following the paved road that crossed the Cha Caldera from S to north (N) (Figure 1c), which was the only access to the villages of Portella and Bangaeira. Flow 1 travelled ~1.2 km during the first 2 h, and by 12:00 covered the Cha Caldera paved road (Figure 2a). Flow 2 was initially flowing parallel to Flow 1 along the fissure, expanding SW towards Mount Beco, and then it moved NNW, bounded by the high topography of Mount Beco and by the 1995 lava flow field (Figure 2a).
On 24 November, the eruptive fissure continued to open upslope, with up to seven active explosive vents along it (Table S1, Figure 2b). The two channel-fed arterial lava flows (Flows 1 and 2, Figure 2b) had aa surface and reached ~2 km in length. Flow 1 slowed down and became stagnated by dusk, while Flow 2 was spreading NNW. On 25 November morning, Flow 1 was again slowly spreading S, whereas Flow 2 was expanding N and approaching the Portela village. By the afternoon, Flow 2 became thicker and faster, and when on 26 November it encountered the N cliff, the flow front split into two branches directed east (E) to Portela and west (W) (Figure 2a,b). The flow front directed E began covering the building of the Fogo Natural Park, completed just a few months earlier. On 27 November, a new vent (Vent 1, Figure 2a and Figure 3a) opened at the base of the eruptive fissure, feeding a small ~30–40 m wide lava flow and expanding above Flow 2. While powerful Strombolian explosions from the upper part of the fissure were still building up two cinder cones (Figure 3a,b), several overflows occurred from the upper S rim of the fissure, breaching and eroding the still growing cinder cones and forming several lava branches overlapping Flow 1 (Figure 3b). This activity also continued the following days (Figure 3c,d), and lava emerging from Vent 1 gradually built a tumulus (Figure 3d). Vent 1 drained lava from the cinder cones on the upper fissure for three days before a significant decline of the explosive activity was observed at the summit vents, accompanied by a reduction of the surface temperature at the cones along the fissure and in the upper lava flow field (Figure 3d,e). On 30 November, most of the cinder cones along the eruptive fissure were already built up, and the uppermost tumulus and lava channel fed by Vent 1 began sealing over, forming several skylights along its path, and thus revealing the presence of a proximal lava tube (Figure 3e). Explosions and pulsating ash emission occurred along the uppermost fissure, indicating a lower magma level when compared to the previous lava fountain activity [58]. On 30 November, the time-lapse images from the fixed monitoring camera installed at the S end of the Cha Caldera became available (Figure 1c), showing a fast and continuous sealing of the upper lava tube and occasional overflows from Vent 1. In general, when explosive activity at the summit vents along the fissure was increasing, we observed a decrease in the explosive and degassing activity at the skylights along the upper tube, and vice versa, indicating that the two systems were connected at a shallow depth.
In early December, the front of Flow 2 reached the N cliff of Bordeira, where it slowed down and inflated (Figure 2a). At that time, most of the master tube within Flow 2 had already formed, and only ephemeral vents along the uppermost lava flow field were feeding small lava lobes on the flow surface (Figure 2c). At this stage, the lava flow field began expanding W through a second-order ephemeral vent, giving rise to initial Flow 3, whereas Flow 1 was already inactive, and most of the surface of Flow 2 between Vent 1 and Portela was crusted over (Figure 2c). On 7 December, two first-order ephemeral vents [3] opened at the E margin of the Flow 2 front and at the exit of the lava tube that was already ~5.7 km long. These vents were discharging lava towards Portela and Bangaeira at a high rate, thus expanding the lava flow field a further ~1 km by 16 December (Figure 2c). From this date to the end of December, the lava flow field widened by westward expansion of Flow 3 (Figure 2d,e). In addition, this flow stopped, widened and inflated as soon as it reached the W cliff, but did not expand further because its supply was eventually cut off. From the end of December (Figure 2f) to the end of the eruption (Figure 2g), only small third-order ephemeral vents [3] were observed along the lava flow field, causing thickening of the proximal lava flow field [59], drainage of the main flows, and slight changes in the outline of the lava flow field. The eruption eventually ended on 8 February 2015, after a gradual decline of the output rate [30].

4.2. Field Surveys and Observations of Lava Tubes

A survey along the 2014–2015 inactive lava flow field was carried out on 23 November 2015, one year after the start of the eruption. The first lava flow (Flow 1) emerging from the fissure had aa morphology (observed in the field while spreading), but this flow is not exposed. The topographic surface was then covered by a surge of lava that gave rise to a sheet flow of shining blue pahoehoe with a glassy surface, very similar to those observed at Kilauea [60]. This was covered by an aa flow that formed a channel but not a lava tube. The levees were ~1 m high outside the channel and above the pahoehoe sheet flow, and ~2 m high inside the channel. The aa surface inside the channel was 2 m lower than the levees, indicating drainage of the channel and possibly erosion of the base. In the lower portion of the channel, there was a break in slope where the inner coating was detached from the walls and collapsed within the channel. This inner coating was a mere 10-cm-thick layer, suggesting that the channel was not active for long (only one coating) and that lava feeding it was rather viscous (indicated by the thickness of the coating [13]). In fact, Flow 1 was only active for six days and intermittently fed by overflows from the S rim of the fissure (Figure 3b–d). Further down along the channel and a few meters below this site, the inner coating was jammed in the middle of the channel forming a significant obstruction, and the channel disappeared below aa flows coming from overflows both from the channel and from the fissure. The intermittent supply and fast drainage of the channel were apparently responsible for its instability and blockage, deactivation, and for the lack of a lava tube within this flow. As already observed [3,5], a steady supply is the key requirement for lava tube formation.
Further N, the eruptive fissure gave rise to several lava benches along the fissure crossing the cone. These benches were formed by lava stagnating at progressively lower levels while the fissure was propagating along the cone and down slope (Figure 4a). During this propagation, at the base of the cones, it formed 3–4 layers of overlapped bubbly grey lava ~30–50 cm thick suggesting a temporary lava pond, just where Vent 1 was located (Figure 4a). This pond eventually broke when the eruptive fissure propagated down slope, confirmed by a fracture crossing it. The dike emptied from the base of the fracture, giving rise to pahoehoe sheet flows spreading like a fan. We have found a lava pond about 20 m down slope from the base of the fissure that eventually drained completely forming a skylight (Figure 4a,b). At the base of this skylight, there was a lava tube ~2–3 m in diameter and located ~20 m below the topographic surface (Figure 4c). About 50 m down slope from this pit, a larger lava pond, ~50 m wide, drained forming a circular collapsed structure (“shatter ring” [5]). Along the path of the lava tube and further W, a 50 m wide tumulus elongated E-W suggested the prolonged feeding to a lava tube in this direction, possibly supplied by lava during the final stages of the eruption [59]. The last pahoehoe flows erupted in Portela were very black, compact and poorly vesiculated.

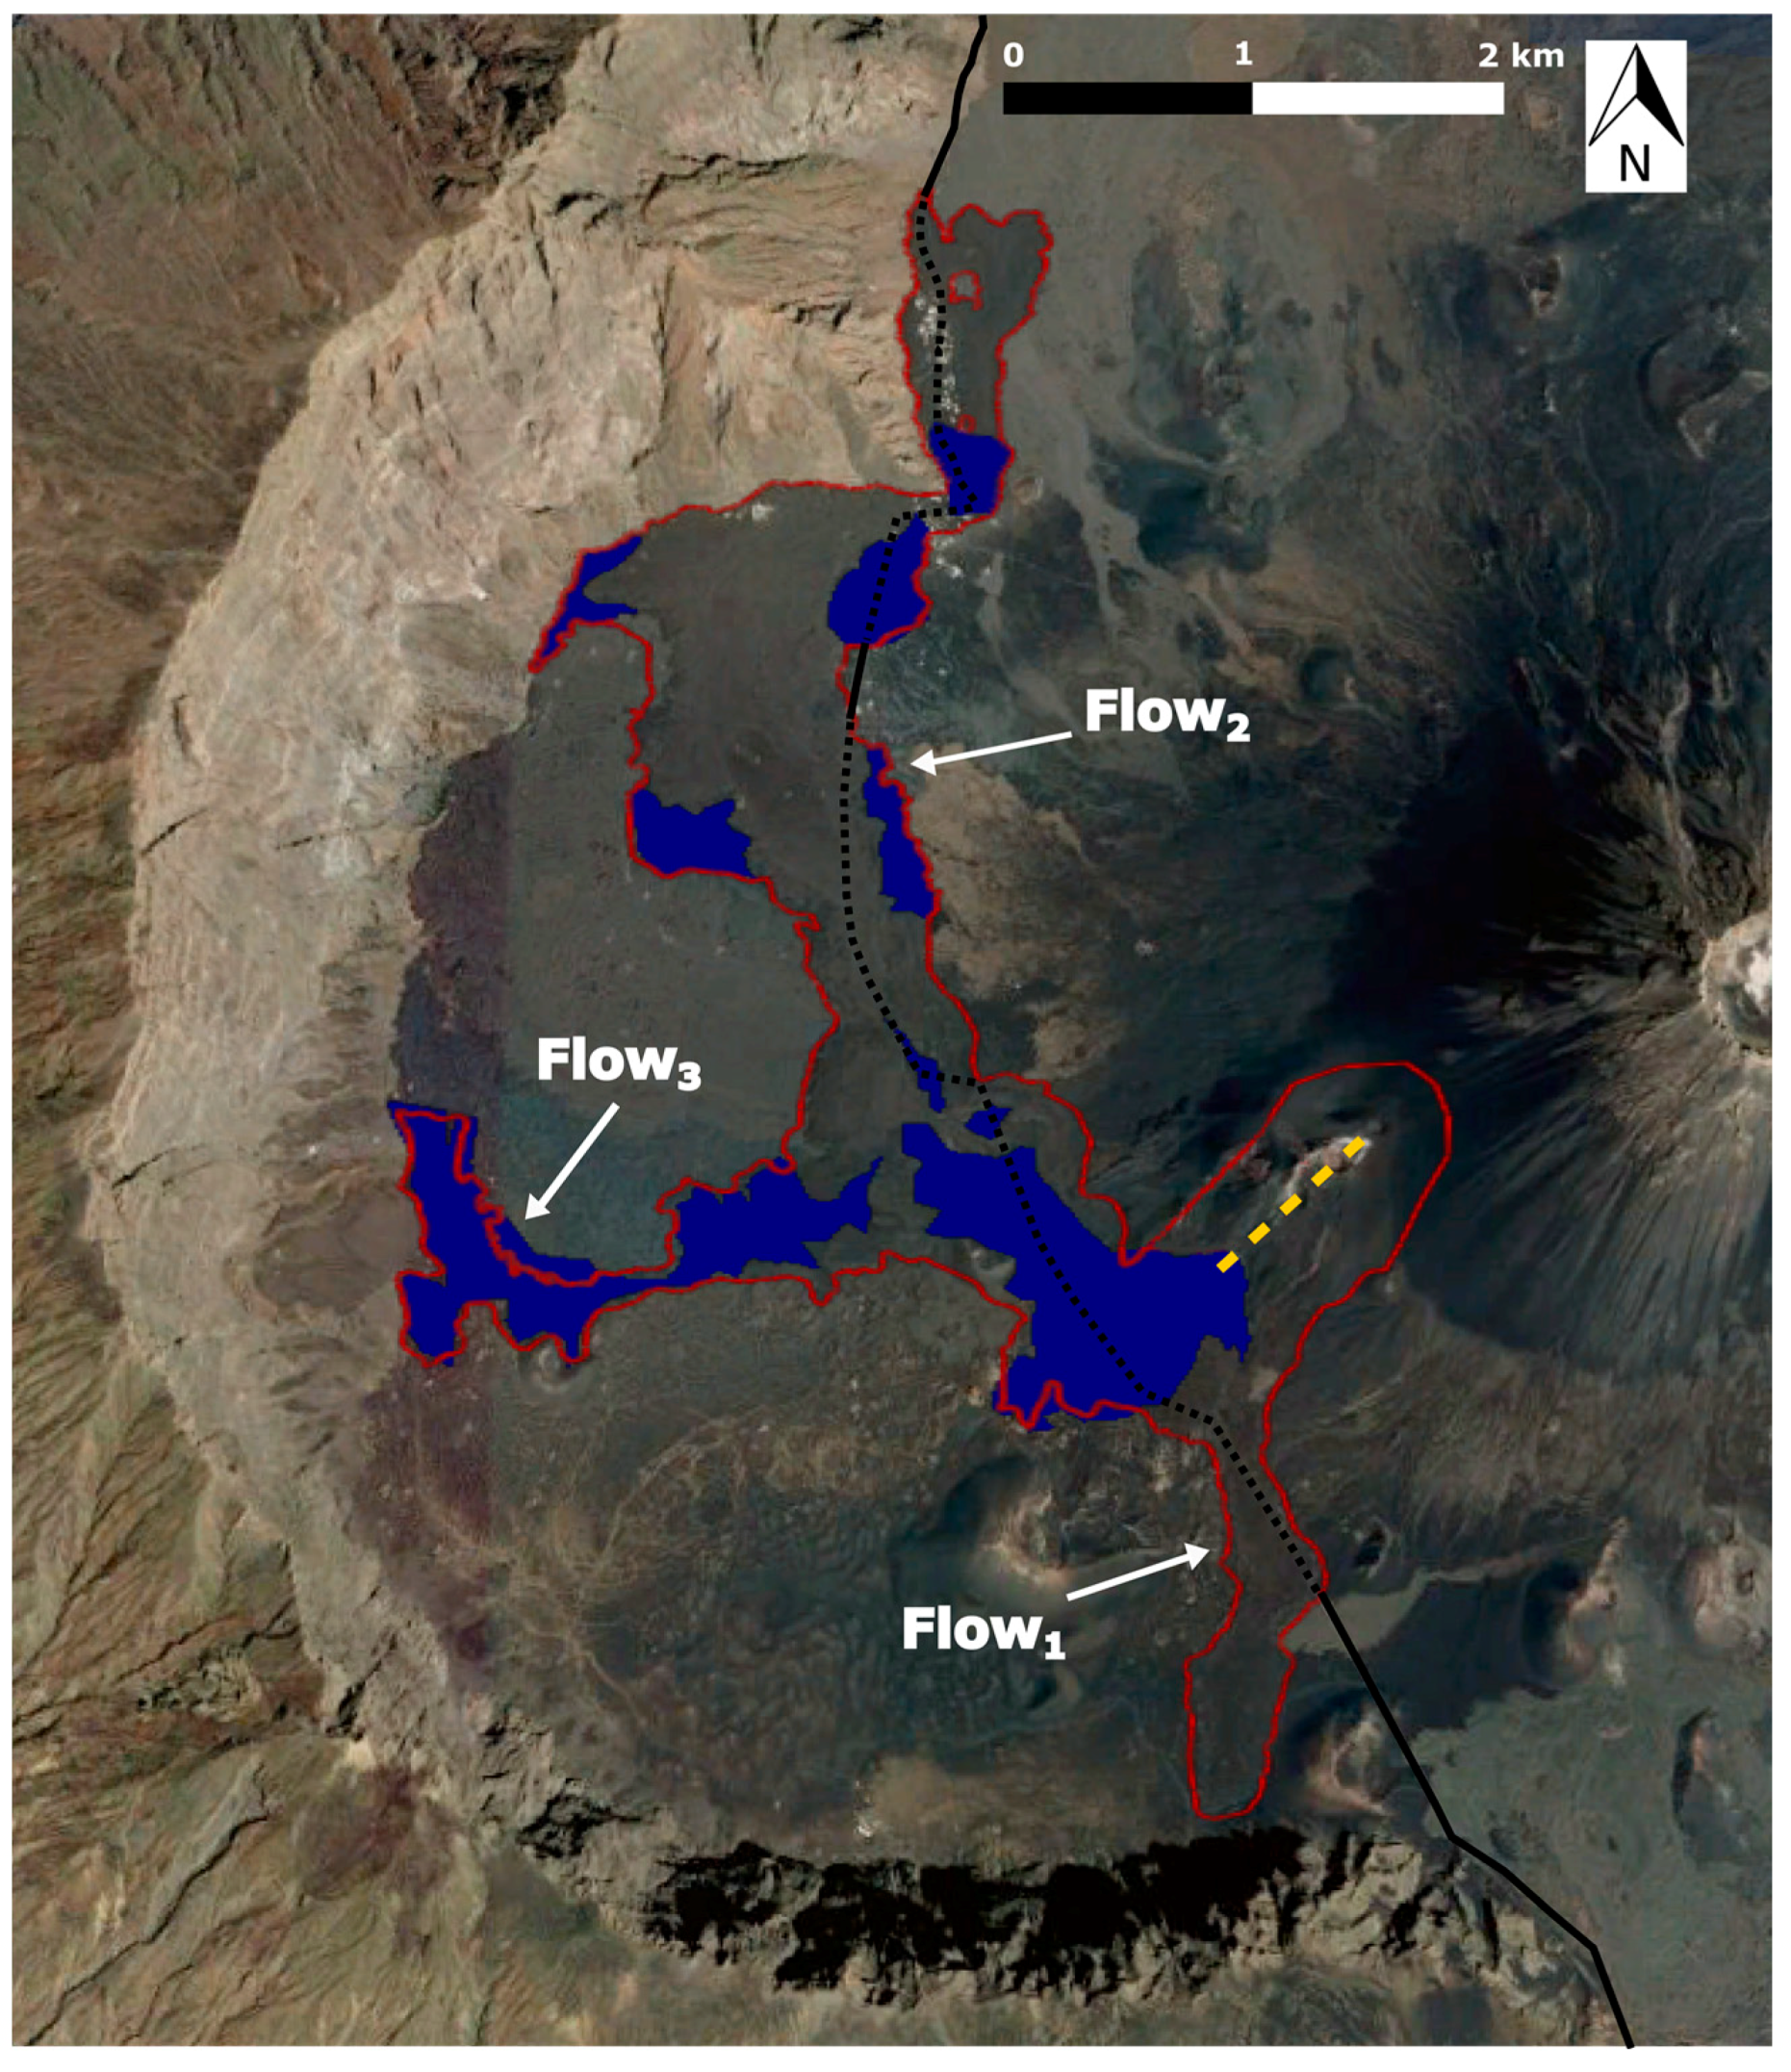
4.3. Lava Flow Field Morphology

With the aim of identifying the hidden path of lava tubes within the lava flow field, we analyzed the lava flow morphology from the images freely available in Google Earth. Figure 5 displays the portion of the lava flow field of mainly aa flow surfaces with the red outline, and with blue color the portions that are mainly pahoehoe flows. Flow 1 is essentially made up of aa flows, while Flow 3 is mostly pahoehoe. Flow 2, on the other hand, is the longest and most complex, characterized by pahoehoe surface at the base of the eruptive fissure and at the boundary of the flow, and by aa surface in the middle of the flow and at the flow front. Flow 1 comprises mainly overlapped sheet flows that were intermittently supplied by lava through overflows from the eruptive fissure (Figure 3b–d). It did not show any significant amount of inflation and its outline is not surrounded by pahoehoe flows. The proximal portion of the lava flow field at the base of the eruptive fissure and around Vent 1 is mainly of pahoehoe flows because this portion emplaced during the final stages of the eruption by drainage of degassed lava at low output rate through the skylight that replaced Vent 1 at the base of the eruptive fissure (Figure 2a and Figure 3e). Most of the surface of Flow 2 is made up of aa clinkers. It was emplaced as an arterial flow surrounded by late third-order ephemeral vents causing the partial drainage of the inflated flow interior and the emplacement of pahoehoe flow lobes all around it and especially at the exit of the two first-order ephemeral vents that covered the village of Portela with lava. Flow 3 is mostly formed by pahoehoe surface. It took place from a second-order ephemeral vent draining the middle portion of the inflated flow field when the front of Flow 2 was stopped and inflating against the N Bordeira wall.

4.4. Pyroclastic Cone

During the first week of the eruption, the explosive activity initially built up a spatter rampart and then above it two cinder cones elongated NE-SW along the eruptive fissure (Figure 2a). They eventually merged, forming a unique cinder cone that extended between 1950 m and 2200 m a.s.l., was ~125 m high and with a ~500 m wide base, and with a crater width of ~165 m (measured from the map [61]). This results in a vesiculated volume of ~11.8 × 10⁶ m3. Considering ~20% vesiculation for the deposit and ~30% for the magma typical of basaltic compositions [28,51,62,63], a volume of ~5.9 × 10⁶ m3 dense rock equivalent (DRE) is obtained for the pyroclastic cone built up during the explosive phase of the eruption.

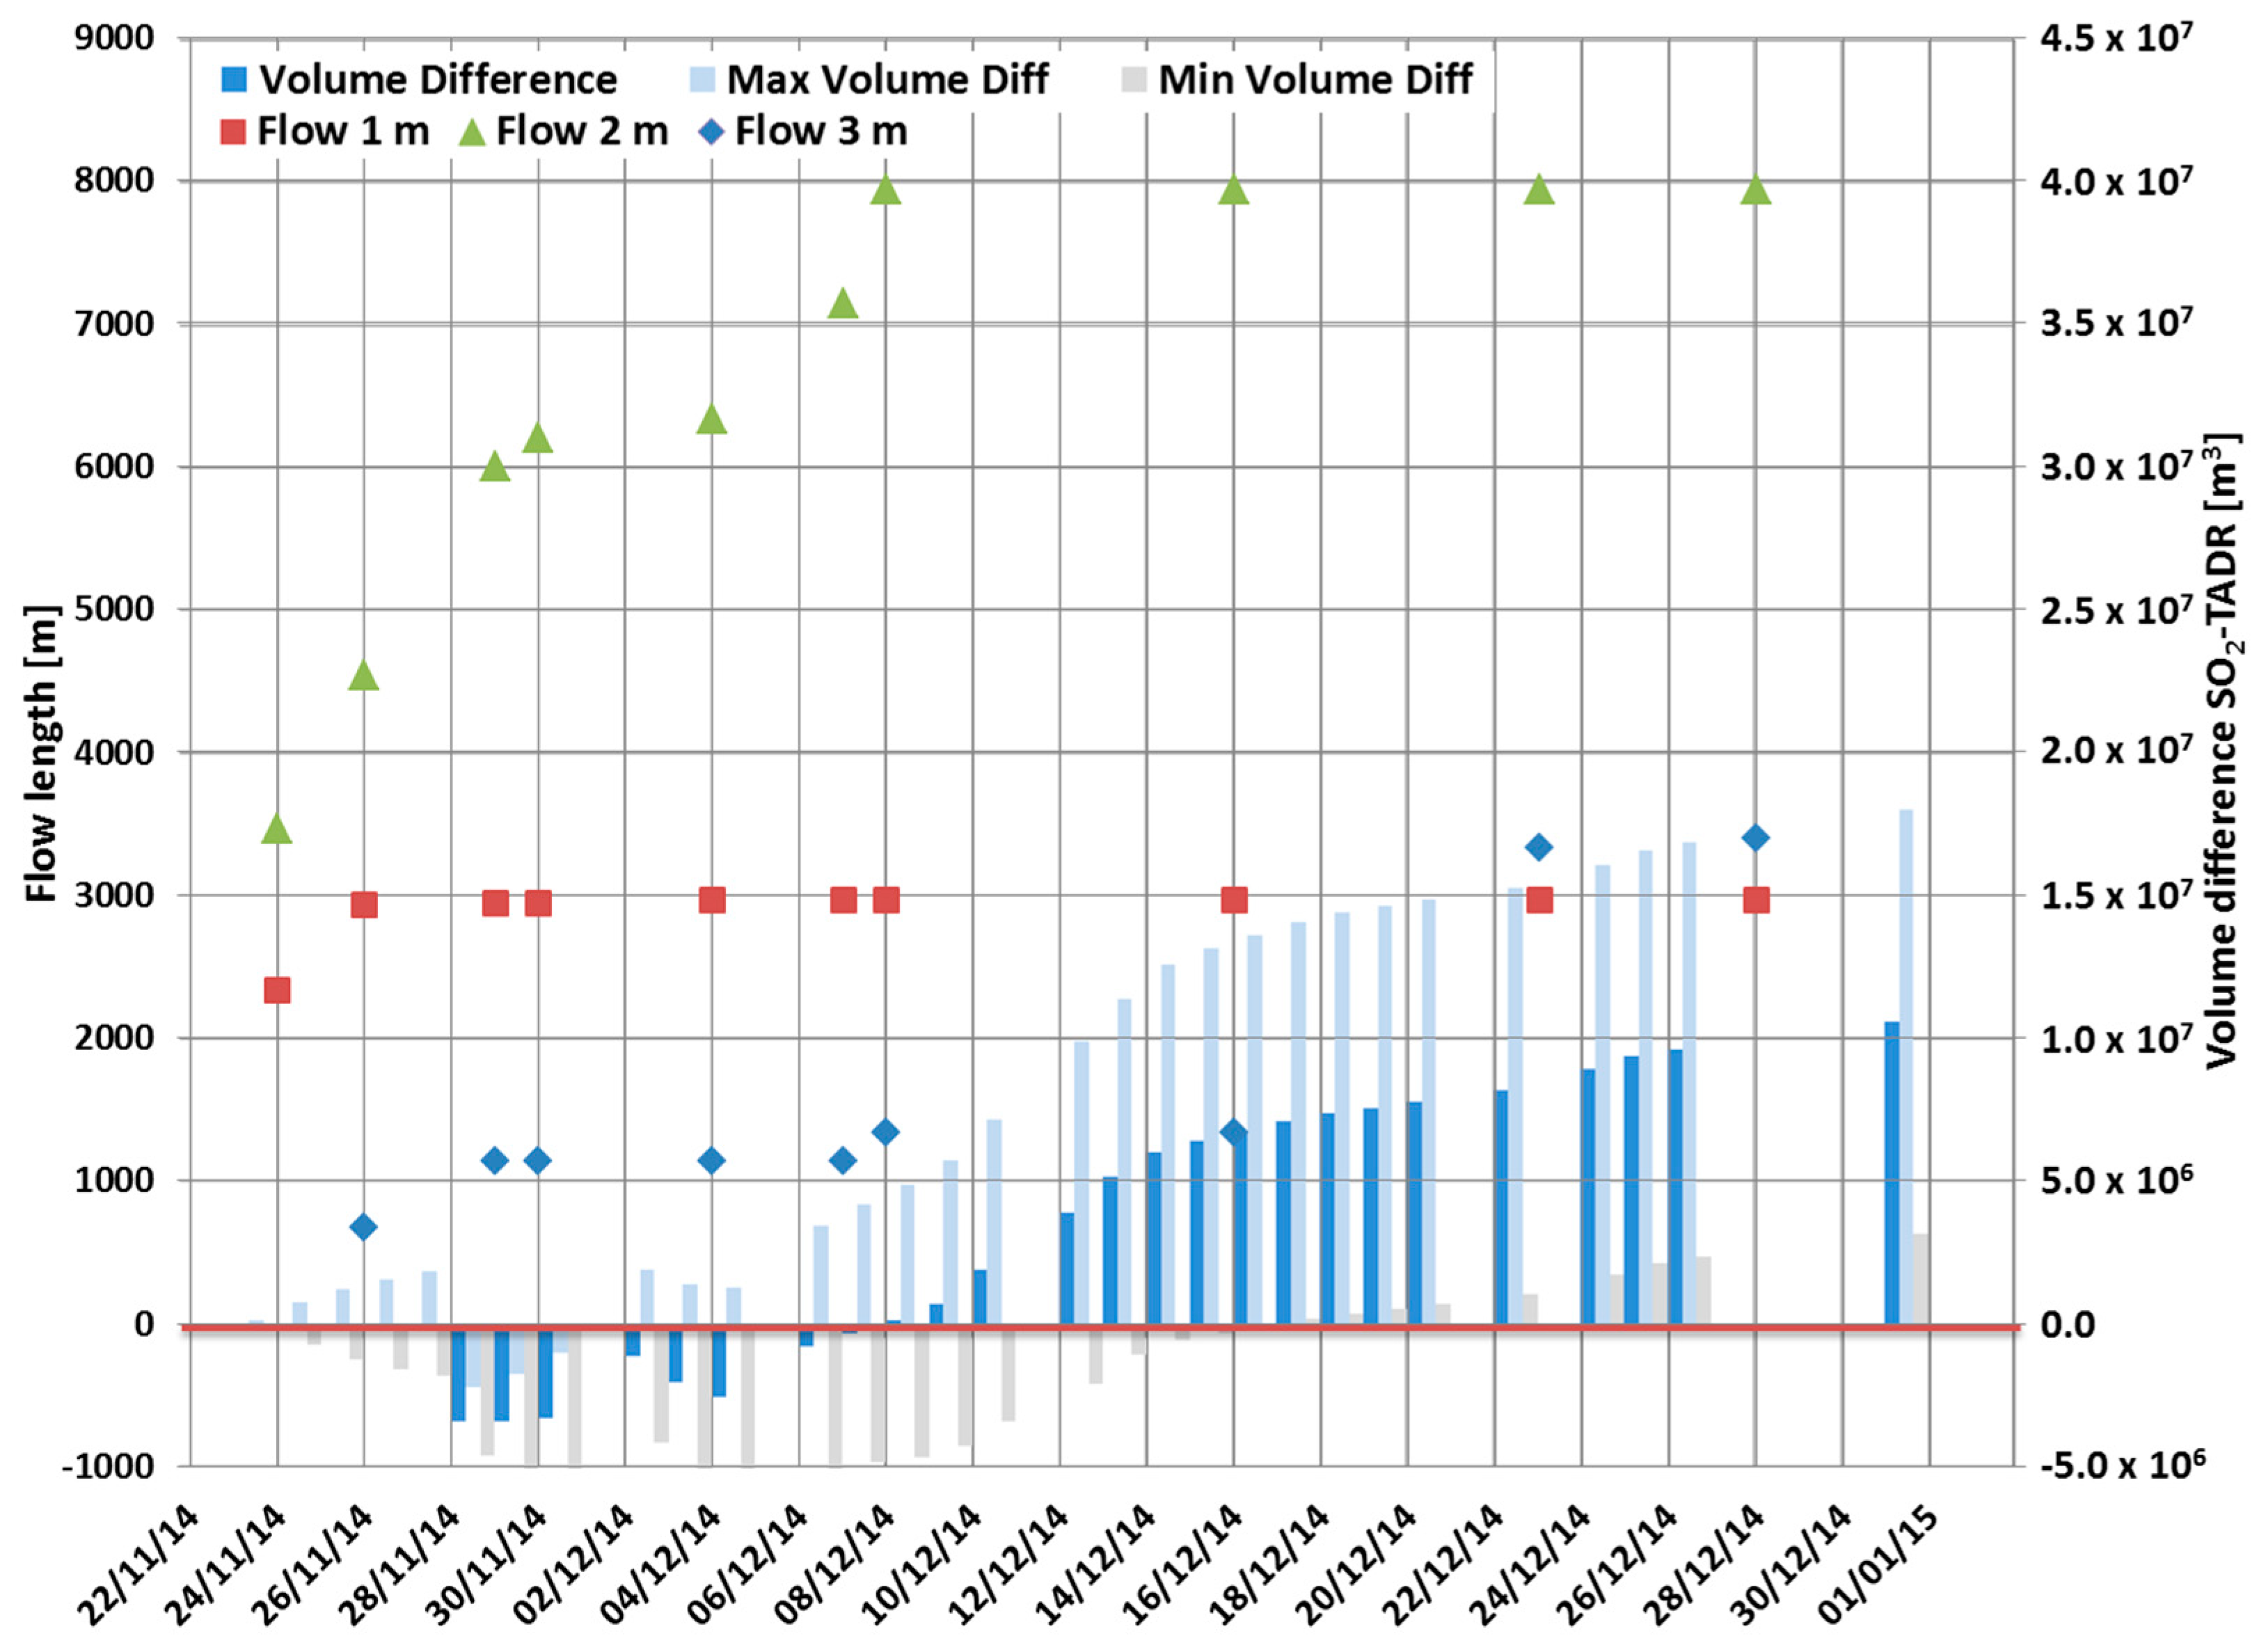
4.5. Lava Flow Field Growth

We have extracted the parameters of lava flow field growth, taking the maximum length of the three arterial flows measured along their main axes at different stages of the eruption. Figure 6 shows the expansion of Flow 1, Flow 2 and Flow 3 with time. Flow 1 displayed a significant growth only during the first two days of the eruption, expanding more than 2.0 km on the first day, but its length remained stable at 2.9 km after 26 November, when the lava was directed NNW along Flow 2. Flow 2 was the longest, reaching its maximum length of ~7.9 km on 8 December. Flow 3 formed after 26 November by a second-order ephemeral vent opened at the W margin of a partially roofed over lava channel, but its main expansion occurred mostly after 16 December when Flow 2 stopped, and caused a westward widening of the lava flow field. Flow 3 reached its maximum length of 3.4 km on 28 December. From December until the end of the eruption, only small secondary pahoehoe flows changed the outline of the lava flow field, causing a significant thickening and widening of the middle portion, but no more increase in length.

4.6. Lava Flow Field Volume

Figure 6 and Figure 7 show the difference in volume between the TADR measured by satellite (data from [30]) and the SR calculated here from SO2 flux measurements [43]. It is worth noting that SO2 flux measurements started on 27 November, thus the SR estimates are lacking for the first three days of eruption. The difference between intruded and erupted magma volume becomes greater than 2 × 10⁶ m3 in the second half of December, when the lava tube within Flow 2 was mostly sealed and started draining, thus feeding Flow 3 with mostly pahoehoe lava. The tube efficiency caused the lack of large surface aa flows (Figure 2c–g), thus the lava flow field was dotted with only small pahoehoe lobes. Figure 6 displays the difference between supplied (SR) and erupted (TADR) magma volumes during the whole eruption. The difference between SR and TADR increases from mid-December 2014 until the end of the eruption. The final difference between supplied and erupted magma is 14.7 ± 8.8 × 10⁶ m3 (Figure 7), and we suggest that this volume represents the magma causing inflation and endogenous growth of the lava flow field, undetected by satellite since it did not expand on the surface.

5. Discussion

Comparing this episode with lava fountains observed at Mt Etna, we assume that the cinder cone was mainly formed by proximal ballistic fallout during the lava fountain phase of the eruption [63,64,65]. Given that the cone built up in seven days (between 23 and 30 November 2014), the DRE TADR [49] for its growth is ~9.7 m3 s−1. This is much higher than the DRE 0.12 m3 s−1 measured for the growth of the cinder cone within Etna’s Bocca Nuova summit crater in 2012 [28] and than the DRE 1.5 m3 s−1 of the 2002 Laghetto cone on Etna’s S flank [63]. It is also lower than the 50 m3 s−1 that gave rise to the New SE Crater during powerful explosive episodes in 2011–2013 [64].
The direct observation of the eruption compared with thermal images collected from both the ground and satellite, as well as the morphology map distinguishing pahoehoe from aa surfaces, has allowed us to recognize the stages of formation and growth of the lava tubes within the lava flow field, their position and extension (Figure 8). The first sector of lava tube to become sealed was the uppermost portion within the eruptive fissure and up to Vent 1. This was ~1.1 km long and sealed in ~7 days. In fact, as shown in Figure 3e, on 30 November the eruptive fissure was mostly roofed over, there was a tumulus at its base above Vent 1, and several skylights along the upper tube. This caused a significant cooling of the flow surface, as shown by the comparison between Figure 3b–d and Figure 3e. Tubes on steep slopes and along eruptive fissures form more rapidly, because local changes in discharge rate can easily trigger inward accretion of levees and roofing over of lava channels [3,5].
The second sector of lava tube to form was the longest, extending on the low slope between Vent 1 and the N cliff of Bordeira, in the middle portion of Flow 2. This tube was the down slope continuation of the proximal portion; it was about ~4.8 km long and formed in about 10 days (Figure 2c). It led to the destruction of the two villages of Portela and Bangaeira by fast-spreading lava flows erupted from first-order ephemeral vents at the E margin of Flow 2 front. Indeed, on 16 December (Figure 2c), only small pahoehoe lobes were spreading along the upper flow field, most of the lava being carried within the ~5.9 km master tube to the N end of the lava flow field.
The third sector of lava tube to form was the ~1.1 km branch that fed Flow 3. It formed much more slowly than the previous, because it started on 26 November but then stopped between 29 November and 7 December. It was only after the halting of the Flow 2 front that the middle portion of the lava field inflated, and a second-order ephemeral vent opened on the W margin of the lava flow field, acting as a pressure-release valve [3]. It drained the flow field interior feeding Flow 3 with mostly pahoehoe lava. The supply to Flow 3 ended by 23 December, and no further expansion of Flow 3 was observed after this date. No evidence of lava tubes has been found within Flow 1.
The distribution of pahoehoe and aa flow surfaces has important implications for recognizing the hidden path of lava tubes. In fact, Flow 1, which is mainly made up of aa surfaces, did not show any evidence of lava tubes in the field. It was characterized by a drained channel obstructed by its collapsed inner coating, indicating complete drainage of the channel and successive lack of supply. Flow 1 was intermittently fed by overflows from the fissure, a condition that does not enable lava tube development [3,5]. Flow 2, which mainly comprises aa surfaces and pahoehoe at the margins of the flow, has been characterized by a long lava tube extending from the eruptive fissure down to V1 (~1.1 km), and from here all along the flat surface of Cha Caldera up to the N boundary of Bordeira (~4.8 km), for a total of ~5.9 km length. Another small sector of lava tube, ~1.1 km long, formed during the second half of December as a lateral branch of the master tube that fed Flow 2. This fed Flow 3, made up almost entirely by pahoehoe surface. The presence of the tube system was confirmed in the proximal lava flow field by the skylight observed during the field survey (Figure 4c), displaying a ~2–3 m wide lava tube located ~20 m below the flow surface. The skylight inner wall was coated by pahoehoe lava congealed while dribbling inwards and showing final drainage of fluid lava within the upper tube (Figure 4a,b).
Thus, based on the data here described, a master tube developed within the eruptive fissure and along Flow 2 after just one week from the start of the eruption, and its growth completed within about 10 days from the start of the eruption. This tube was responsible for the fast lengthening of Flow 2, and formed a short branch to the W as soon as Flow 2 slowed down when encountering the N cliff of Bordeira. The magma inside the tube then accumulated upslope inflating the lava field and eventually feeding Flow 3. The path of Flow 2 was dictated by the line of maximum steepness [57], but its expansion was probably favored also by the smooth surface of the paved road crossing the Cha Caldera from S to N, given that most of the road had been covered by lava, as already happened also during the 1995 eruption [39].
To estimate the quantity of magma intruding the lava flow field and causing its inflation, we have compared the measurements of SR derived from SO2 flux measurements [43], and the TADR derived from satellite [30]. Although the measurements of SO2 flux, and then of SR, are lacking for the first three days of the eruption, we can assume that at that time there was no difference between supplied and erupted magma, given that the lava flows were spreading with no significant surface cooling (Figure 2b), and that there was no inflation or endogenous growth of the lava flow field. The difference between SR and TADR increased significantly after 9 December, as soon as Flow 2 stopped advancing (Figure 6 and Figure 7), and this is when Flow 3 increased its length. Once Flow 2 reached its maximum length allowed by surface crust cooling [9], the magma flowing within the master tube accumulated to the rear and upslope, inflating the middle portion of the flow field. This triggered an expansion of the tube towards the W for ~1.1 km, feeding Flow 3. Flow 3 was mostly pahoehoe, and fed by part of the degassed interior causing the inflation of the lava flow field.
Another significant increase in the difference between SR and TADR occurred after 21 December when also Flow 3 stopped advancing (Figure 6 and Figure 7), and only small pahoehoe flow lobes were observed on the proximal lava flow field (Figure 2e). Flow 3 stopped after coming up against the W Bordeira wall and following a significant decline in the output rate [30]. At this stage, the supply of lava was not sufficient to keep the ~5.9 km long tube active. Lava thus poured out from the base of the eruptive fissure [59], thickening the proximal lava flow field with a pahoehoe fan of lava from the skylight that eventually drained at the end of the effusive episode (Figure 8). This is the second major inflation stage of the lava flow field, not followed by major lava flow expansion. This is probably due to the confining effect of the lava crustal growth [9]. By the end of the eruption, the erupted volume estimated by satellite measurements is 26.5 ± 3.2 × 10⁶ m3 DRE (Figure 7) corresponding only to surface lava, while mass volume obtained from SO2 flux measurements is 46.9 ± 5.74 × 10⁶ m3. Considering the respective uncertainty associated to each estimation, a total difference of 14.7 ± 8.8 × 10⁶ m3 DRE was obtained between SR and TADR. We argue that this differential volume, which is about 31% of the total erupted volume, caused inflation of the lava flow field and endogenous growth.
Published bulk values (i.e., including voids) obtained from differential digital elevation models (DEMs; 45.83 ± 0.02 × 10⁶ m3 [66] and 43.7 ± 5.2 × 10⁶ m3, [59]) are in agreement with mass estimation derived from SO2 flux measurements.
Differences between published bulk and DRE volumes can be also ascribed to voids from the tubes, drained flows and empty spaces between crust and flow. The amount of voids within the flow field is testified by the vertical displacement by cooling and contraction measured using spaceborne synthetic aperture radar interferometry ~9 months after the end of the eruption [64], and observed also at other volcanoes [67]. It is noteworthy that the greatest contraction affected the thickest zones of the flow field, these being the eruptive fissure and the middle line of Flow 2, following the path of the master tube that fed the lava flow field (Figure 8).
The comparison between SR and TADR highlighted a growing difference between the two values from early December 2014 onwards. This is consistent with surface cooling and inflation of the lava field, and with the endogenous accumulation of lava. It is worth noting that the main destruction of Portela and Bangaeira occurred at this very stage of the eruption, when there was enough magma available within the inflated flow field to feed fast-spreading secondary flows from the exit of the master tube.
Codes such as MAGFLOW [68,69] and DOWNFLOW [70,71] have been developed to provide near-real-time prediction of lava flow paths. These and other models have generally been shown to provide a good match with the true path of supply-limited lava flows governed by underlying topography. However, the evolution of more complex cooling-limited flow fields may be much harder to predict, especially where far-field breakouts are developing [12,72,73]. In these latter cases, inflation of the flow front has been a key precursor to breakout formation and attendant hazards. Thus, an observed mismatch between SR and TADR measurements on an actively emplacing lava flow could be used to inform predictive modeling and hazard identification. If there is no discrepancy between the SR and TADR, then well-established codes could effectively predict the path of the flow. However, if a discrepancy emerges, then inflation is occurring and hazards may be concentrated at stagnant flow fronts.
The development of lava tubes within the Fogo lava flow field was favored by a stable supply of lava along Flow 2, and by the flat topography on which lava was spreading. We suggest that any time lava flow spreads on a flat surface, the early comparison between TADR estimated by satellite and SR obtained from SO2 flux measurements might allow recognizing if endogenous growth is occurring, leading to lava tube expansion and to potentially much greater length and destructive power of the lava flow field.
The 2014–2015 effusive eruption at Fogo was very similar to the previous 1995 eruption. The effusive vents of both eruptions were located in the same zone, i.e., at the W base of Pico do Fogo cone (Figure 1), sharing the same NE-SW orientation. The duration and erupted volume of both eruptions is similar, with 54 days of eruption and 46 × 106 m3 lava erupted in 1995 [33] and 77 days and ~46 × 106 m3 erupted magma in 2014–2015. Given that the last two lava flow fields affected the same flat ground of Cha Caldera, and that this area is the most prone to lava invasion [59], should a new eruption occur in the same zone, we suggest measuring and comparing the calculated SR from SO2 flux measurements and the TADR obtained by satellite as soon as possible. This would enable the detection of major phases of inflation of the lava flow field in good time to prevent damage.

6. Conclusive Remarks

The 2014–2015 eruption at Fogo volcano developed a ~5.9 km long lava tube system that started from the eruptive fissure that became sealed in just six days after the start of the eruption. The master tube soon propagated within the arterial Flow 2, following the line of maximum slope and probably also the smooth paved road of access to the Cha Caldera. When Flow 2 stopped against the N Bordeira cliff, the lava flow field inflated and eventually led to vent opening at the E margin of its front with lava flows that destroyed the villages of Portela and Bangaeira. At this stage, further lengthening of the lava flow field was probably prevented by surface crust cooling. Thus, the lava feeding the eruption accumulated upslope, inflating the proximal flow field and causing a fast spreading of Flow 3 during the second half of December. This is also when the difference between SR and TADR increased significantly (Figure 5 and Figure 6), causing inflation and endogenous growth of the lava flow field. When Flow 3 also halted, we recorded a growing difference between SR and TADR and a significant inflation of the lava flow field. However, the low SR of this stage and the containment offered by the cooling crust did not allow further expansion of the lava flow field, and only proximal minor pahoehoe lobes increased the thickness of the lava flow field. We have estimated that, by the end of the eruption, ~31% of the lava emplaced endogenously. We suggest that early detection of flow field inflation might be invaluable for recognizing the development of potentially devastating flows in time to mitigate their destructive effects.

Supplementary Materials

The following are available online at https://www.mdpi.com/2072-4292/10/7/1115/s1, Table S1: List of main eruptive events occurring during the 2014–2015 Fogo eruption.

Author Contributions

S.C. conceived the idea and wrote the manuscript with contributions from all authors. G.G. processed satellite data to retrieve lava flow field area and volume, and computed the associated uncertainty. S.S.V., V.A., P.A.H., N.M.P., N.C., J.M.P., P.F., J.B., S.D. and G.M. performed field surveys and thermal camera measurements on the lava flow field during the eruption, S.C. and S.S.V. carried out the field survey after the end of the eruption. J.C. and H.S. assisted during field surveys. P.A.H., N.M.P., G.P. and F.R. acquired and analyzed SO2 fluxes. All authors contributed to the ideas, writing, and discussion.

Funding

This research received no external funding.

Acknowledgments

We would like to thank the following institutions that gave us support and helped monitor the eruptive activity and perform the fieldwork at Fogo: Universidade de Cabo Verde (UNICV), Praia, Santiago, Cape Verde; Instituto Tecnológico de Energias Renovábles (ITER); Instituto Volcanológico de Canarias (INVOLCAN); Serviço Nacional de Proteção Civil, Cabo Verde; Ministério de Desenvolvimento Rural, Cabo Verde; Câmara Municipal de São Filipe, Ilha do Fogo, Cabo Verde; Parque Natural do Fogo, Direcção Nacional do Ambiente, Cabo Verde; Associação dos Guias Turísticos da Ilha do Fogo, Cabo Verde; Nuno Coelho, ESRI Portugal; Cabildo Insular de Tenerife-Acción Exterior; Forças Armadas de Cabo Verde; and Policia Nacional de Cabo Verde. Thanks are due to European Organisation for the Exploitation of Meteorological Satellites (EUMETSAT) for SEVIRI data (www.eumetsat.int) and to National Aeronautics and Space Administration (NASA) for MODIS data (modis.gsfc.nasa.gov). Landsat 8 OLI and Eo-1 ALI images are courtesy of the U.S. Geological Survey (earthexplorer.usgs.gov). We are grateful to the Copernicus emergency management service (emergency.copernicus.eu/mapping/list-of-components/EMSR111) for mapping the actual lava flow field by Cosmo-SkyMed and Pleiades images. The authors would like to thank M. James and M. Patrick who produced thoughtful reviews that helped clarify and improve a previous version of the manuscript, as well as three anonymous reviewers for their helpful and constructive comments and appreciation of our work. The English style has been reviewed by Stephen Conway. Data are available from the figures and references.

Conflicts of Interest

The authors declare no conflict of interest.

References

  1. Walker, G.P.L. Lengths of lava flows. Philos. Trans. R. Soc. Lond. 1973, 274, 107–118. [Google Scholar] [CrossRef]
  2. Kilburn, C.R.J.; Lopes, R.M.C. The growth of aa lava flow fields on Mount Etna, Sicily. J. Geophys. Res. Solid Earth 1988, 93, 14759–14772. [Google Scholar] [CrossRef]
  3. Calvari, S.; Pinkerton, H. Formation of lava tubes and extensive flow field during the 1991–1993 eruption of Mount Etna. J. Geophys. Res. Solid Earth 1998, 103, 27291–27302. [Google Scholar] [CrossRef]
  4. Bonaccorso, A.; Calvari, S.; Boschi, E. Hazard mitigation and crisis management during major flank eruptions at Etna volcano: Reporting on real experience. In Detecting, Modelling and Responding to Effusive Eruptions; Harris, A.J.L., De Groeve, T., Garel, F., Carn, S.A., Eds.; Geological Society: London, UK, 2015; Volume 426, pp. 447–461. ISBN 978-1-86239-736-1. [Google Scholar] [CrossRef]
  5. Kauahikaua, J.; Cashman, K.V.; Mattox, T.N.; Heliker, C.C.; Hon, K.A.; Mangan, M.T.; Thornber, C.R. Observations on basaltic lava streams in tubes from Kilauea Volcano, island of Hawaii. J. Geophys. Res. Solid Earth 1998, 103, 27303–27323. [Google Scholar] [CrossRef]
  6. Calvari, S.; Coltelli, M.; Neri, M.; Pompilio, M.; Scribano, V. The 1991–1993 Etna eruption: Chronology and lava flow field evolution. Acta Vulcanol. 1994, 4, 1–14. [Google Scholar]
  7. Harris, A.J.L. Thermal Remote Sensing of Active Volcanoes; Cambridge University Press: Cambridge, UK, 2013; p. 728. ISBN 978-0-521-85945-5. [Google Scholar]
  8. Solana, M.C.; Calvari, S.; Kilburn, C.R.J.; Gutierrez, H.; Chester, D.; Duncan, A. Supporting the Development of Procedures for Communications During Volcanic Emergencies: Lessons Learnt from the Canary Islands (Spain) and Etna and Stromboli (Italy). Adv. Volcanol. 2017. [Google Scholar] [CrossRef]
  9. Guest, J.E.; Kilburn, C.R.J.; Pinkerton, H.; Duncan, A.M. The evolution of lava flow fields: Observations of the 1981 and 1983 eruptions of Mount Etna, Sicily. Bull. Volcanol. 1987, 49, 527–540. [Google Scholar] [CrossRef]
  10. Kilburn, C.R.J.; Lopes, R.M.C. General Patterns of Flow Field Growth: Aa and Blocky Lavas. J. Geophys. Res. Solid Earth 1991, 96, 19721–19732. [Google Scholar] [CrossRef]
  11. Guest, J.E.; Underwood, J.R.; Greeley, R. Role of lava tubes in flows from the Observatory Vent, 1971 eruption on Mount Etna. Geol. Mag. 1980, 117, 601–606. [Google Scholar] [CrossRef]
  12. Mattox, T.N.; Heliker, C.; Kauahikaua, J.; Hon, K. Development of the 1990 Kalapana Flow Field, Kilauea Volcano, Hawaii. Bull. Volcanol. 1993, 55, 407–413. [Google Scholar] [CrossRef]
  13. Calvari, S.; Pinkerton, H. Lava tube morphology on Etna and evidence for lava flow emplacement mechanisms. J. Volcanol. Geotherm. Res. 1999, 90, 263–280. [Google Scholar] [CrossRef]
  14. Walker, G.P.L. Structure, and origin by injection under surface crust, of tumuli, “lava rises”, “lava-rise pits”, and “lava inflation clefts” in Hawaii. Bull. Volcanol. 1991, 53, 546–558. [Google Scholar] [CrossRef]
  15. Hon, K.; Kauahikaua, J.; Denlinger, R.; Mackay, K. Emplacement and inflation of pahoehoe sheet flows: Observations and measurements of active lava flows on Kilauea Volcano, Hawaii. Geol. Soc. Am. Bull. 1994, 106, 351–370. [Google Scholar] [CrossRef]
  16. Rossi, M.J.; Gudmundsson, A. The morphology and formation of flow-lobe tumuli on Icelandic shield volcanoes. J. Volcanol. Geotherm. Res. 1996, 72, 291–308. [Google Scholar] [CrossRef]
  17. Cashman, K.V.; Kauahikaua, J.P. Reevaluation of vesicle distributions in basaltic lava flows. Geology 1997, 25, 419–422. [Google Scholar] [CrossRef]
  18. Keszthelyi, L.; Self, S. Some physical requirements for the emplacement of long basaltic lava flows. J. Geophys. Res. Solid Earth 1998, 103, 27447–27464. [Google Scholar] [CrossRef] [Green Version]
  19. Self, S.; Keszthelyi, L.; Thordarson, T. The importance of pahoehoe. Annu. Rev. Earth Planet. Sci. 1998, 26, 81–110. [Google Scholar] [CrossRef]
  20. Self, S.; Thordarson, T.; Keszthelyi, L.; Walker, G.P.L.; Hon, K.; Murphy, M.T. A new model for the emplacement of Columbia River basalts as large, inflated pahoehoe lava flow fields. Geophys. Res. Lett. 1996, 23, 2689–2692. [Google Scholar] [CrossRef]
  21. Thordarson, T.; Self, S. The Roza Member, Columbia River Basalt Group: A gigantic pahoehoe lava flow field formed by endogenous processes? J. Geophys. Res. Solid Earth 1998, 103, 27411–27445. [Google Scholar] [CrossRef] [Green Version]
  22. Applegarth, L.J.; Pinkerton, H.; James, M.R.; Calvari, S. Lava flow superposition: The reactivation of flow units in compound flow fields. J. Volcanol. Geotherm. Res. 2010, 194, 100–106. [Google Scholar] [CrossRef]
  23. Favalli, M.; Harris, A.J.L.; Fornaciai, A.; Pareschi, M.T.; Mazzarini, F. The distal segment of Etna’s 2001 basaltic lava flow. Bull. Volcanol. 2010, 72, 119–127. [Google Scholar] [CrossRef]
  24. Favalli, M.; Fornaciai, A.; Mazzarini, F.; Harris, A.J.L.; Neri, M.; Behncke, B.; Pareschi, M.T.; Tarquini, S.; Boschi, E. Evolution of an active lava flow field using a multitemporal LIDAR acquisition. J. Geophys. Res. Solid Earth 2010, 115. [Google Scholar] [CrossRef] [Green Version]
  25. Umino, S.; Nonaka, M.; Kauahikaua, J. Emplacement of subaerial pahoehoe lava sheet flows into water: 1990 Kaimū flow of Kilauea volcano at Kaimu Bay, Hawaii. Bull. Volcanol. 2006, 69, 125–139. [Google Scholar] [CrossRef]
  26. James, M.R.; Applegarth, L.J.; Pinkerton, H. Lava channel roofing, overflows, breaches and switching: Insights from the 2008–2009 eruption of Mt. Etna. Bull. Volcanol. 2012, 74, 107–117. [Google Scholar] [CrossRef]
  27. Hamilton, C.W.; Glaze, L.S.; James, M.R.; Baloga, S.M. Topographic and stochastic influences on pahoehoe lava lobe emplacement. Bull. Volcanol. 2013, 75, 756. [Google Scholar] [CrossRef]
  28. Slatcher, N.; James, M.R.; Calvari, S.; Ganci, G.; Browning, J. Quantifying effusion rates at active volcanoes through integrated time-lapse laser scanning and photography. Remote Sens. 2015, 7, 14967–14987. [Google Scholar] [CrossRef] [Green Version]
  29. Koeppen, W.C.; Patrick, M.; Orr, T.; Sutton, A.J.; Dow, D.; Wright, R. Constraints on the partitioning of Kīlauea’s lavas between surface and tube flows, estimated from infrared satellite data, sulfur dioxide emission rates, and field observations. Bull. Volcanol. 2013, 75, 716. [Google Scholar] [CrossRef]
  30. Cappello, A.; Ganci, G.; Calvari, S.; Perez, N.M.; Hernandez, P.A.; Silva, S.V.; Cabral, J.; Del Negro, C. Lava Flow Hazard Modeling during the 2014–2015 Fogo eruption, Cape Verde. J. Geophys. Res. Solid Earth 2016, 121, 2290–2303. [Google Scholar] [CrossRef]
  31. Sutton, A.J.; Elias, T.; Kauahikaua, J. Lava-Effusion Rates for the Puu Oo-Kupaianaha Eruption derived from SO2 Emissions and Very Low Frequency (VLF) Measurements. USGS Prof. Pap. 2003, 1676, 137–148. [Google Scholar]
  32. Allard, P. Endogenous magma degassing and storage at Mount Etna. Geophys. Res. Lett. 1997, 24, 2219–2222. [Google Scholar] [CrossRef] [Green Version]
  33. Courtney, R.C.; White, R.S. Anomalous heat flow and geoid across the Cape Verde Rise: Evidence for dynamic support from a thermal plume in the mantle. Geophys. J. R. Astr. Soc. 1986, 87, 815–867. [Google Scholar] [CrossRef]
  34. Amelung, F.; Day, S. InSAR observations of the 1995 Fogo, Cape Verde, eruption: Implications for the effects of collapse events upon island volcanoes. Geophys. Res. Lett. 2002, 29, 47-1–47-4. [Google Scholar] [CrossRef] [Green Version]
  35. Day, S.J.; Heleno da Silva, S.I.N.; Fonseca, J.F.B.D. A past giant lateral collapse and present-day flank instability of Fogo, Cape Verde Islands. J. Volcanol. Geotherm. Res. 1999, 94, 191–218. [Google Scholar] [CrossRef]
  36. Ramalho, R.S.; Winckler, G.; Madeira, J.; Helffrich, G.R.; Hipolito, A.; Quartau, R.; Adena, K.; Schaefer, J.M. Hazard potential of volcanic flank collapses raised by new megatsunami evidence. Sci. Adv. 2015, 1, e1500456. [Google Scholar] [CrossRef] [PubMed] [Green Version]
  37. Hildner, E.; Klügel, A.; Hauff, F. Magma storage and ascent during the 1995 eruption of Fogo, Cape Verde Archipelago. Contrib. Mineral. Petrol. 2011, 162, 751–772. [Google Scholar] [CrossRef]
  38. Escrig, S.; Doucelance, R.; Moreira, M.; Allègre, C.J. Os isotope systematics in Fogo Island: Evidence for lower continental crust fragments under the Cape Verde Southern Islands. Chem. Geol. 2005, 219, 93–113. [Google Scholar] [CrossRef]
  39. Texier-Teixeira, P.; Chouraqui, F.; Perrillat-Collomb, A.; Lavigne, F.; Cadag, J.R.; Grancher, D. Reducing volcanic risk on Fogo Volcano, Cape Verde, through a participatory approach: Which outcome? Nat. Hazards Earth Syst. Sci. 2014, 14, 2347–2358. [Google Scholar] [CrossRef]
  40. Dionis, S.M.; Melian, G.; Rodriguez, F.; Hernandez, P.A.; Padron, E.; Perez, N.M.; Barrancos, J.; Padilla, G.; Sumino, H.; Fernandes, P.; et al. Diffuse volcanic gas emission and thermal energy release from the summit crater of Pico do Fogo, Cape Verde. Bull. Volcanol. 2015, 77, 10. [Google Scholar] [CrossRef]
  41. Dionis, S.M.; Perez, N.M.; Hernandez, P.A.; Melian, G.; Rodriguez, F.; Padron, E.; Sumino, H.; Barrancos, J.; Padilla, G.; Fernandes, P.; et al. Diffuse CO2 degassing and volcanic activity at Cape Verde islands, West Africa. Earth Plan. Space 2015, 67, 48. [Google Scholar] [CrossRef]
  42. Pérez, N.M.; Dionis, S.; Fernandes, P.; Barrancos, J.; Rodríguez, F.; Bandomo, Z.; Hernández, P.A.; Melián, G.V.; Silva, S.; Padilla, G.; et al. Precursory signals of the 2014–15 Fogo eruption (Cape Verde) detected by surface CO2 emission and heat flow observations. In Proceedings of the EGU General Assembly 2015, Vienna, Austria, 12–17 April 2015. [Google Scholar]
  43. Barrancos, J.; Dionis, S.; Quevedo, R.; Fernandes, P.; Rodríguez, F.; Pérez, N.M.; Silva, S.; Cardoso, N.; Hernández, P.A.; Melián, G.V.; et al. Sulphur dioxide (SO2) emissions during the 2014–15 Fogo eruption, Cape Verde. In Proceedings of the EGU General Assembly 2015, Vienna, Austria, 12–17 April 2015. [Google Scholar]
  44. Galle, B.; Oppenheimer, C.; Geyer, A.; McGonigle, A.; Edmonds, M.; Horrocks, L.A. A miniaturized ultraviolet spectrometer for remote sensing of SO2 fluxes: A new tool for volcano surveillance. J. Volcanol. Geotherm. Res. 2002, 119, 241–254. [Google Scholar] [CrossRef]
  45. Barrancos, J.; Roselló, J.I.; Calvo, D.; Padrón, E.; Melián, G.; Hernández, P.A.; Pérez, N.M.; Millán, M.M.; Galle, B. SO2 emission from active volcanoes measured simultaneously by COSPEC and mini-DOAS. Pure Appl. Geophys. 2008, 165, 115–133. [Google Scholar] [CrossRef]
  46. Mata, J.; Martins, N.; Mattielli, N.; Madeira, J.; Faria, B.; Ramalho, R.S.; Silva, P.; Moreira, M.; Caldeira, R.; Rodrigues, J.; et al. The 2014–15 eruption and the short-term geochemical evolution of the Fogo volcano (Cape Verde): Evidence for small-scale mantle heterogeneity. Lithos 2017, 288–289, 91–107. [Google Scholar] [CrossRef]
  47. Spilliaert, N.; Allard, P.; Metrich, N.; Sobolev, A.V. Melt inclusion record of the conditions of ascent, degassing, and extrusion of volatile-rich alkali basalt during the powerful 2002 flank eruption of Mount Etna (Italy). J. Geophys. Res. Solid Earth 2006, 111. [Google Scholar] [CrossRef] [Green Version]
  48. Steffke, A.M.; Harris, A.J.L.; Burton, M.; Caltabiano, T.; Salerno, G.G. Coupled use of COSPEC and satellite measurements to define the volumetric balance during effusive eruptions at Mt. Etna, Italy. J. Volcanol. Geotherm. Res. 2010, 205, 47–53. [Google Scholar] [CrossRef]
  49. Caltabiano, T.; Burton, M.; Giammanco, S.; Allard, P.; Bruno, N.; Muré, F.; Romano, R. Volcanic gas emissions from the summit craters and flanks of Mt. Etna, 1987–2000. In Mt. Etna: Volcano Laboratory; Bonaccorso, A., Calvari, S., Coltelli, M., Del Negro, C., Falsaperla, S., Eds.; American Geophysical Union: Washington, DC, USA, 2004; Volume 143, pp. 111–128. ISBN 0-87590-408-4. [Google Scholar] [CrossRef]
  50. Ganci, G.; Bilotta, G.; Cappello, A.; Hérault, A.; Del Negro, C. HOTSAT: A multiplatform system for the satellite thermal monitoring of volcanic activity. In Detecting, Modelling and Responding to Effusive Eruptions; Harris, A.J.L., De Groeve, T., Garel, F., Carn, S.A., Eds.; Geological Society: London, UK, 2015; Volume 426, pp. 207–222. ISBN 978-1-86239-736-1. [Google Scholar]
  51. Harris, A.J.L.; Dehn, J.; Calvari, S. Lava effusion rate definition and measurement: A review. Bull. Volcanol. 2007, 70, 1. [Google Scholar] [CrossRef]
  52. Ganci, G.; Vicari, A.; Bonfiglio, S.; Gallo, G.; Del Negro, C. A texton-based cloud detection algorithm for MSG-SEVIRI multispectral images. Geomat. Nat. Hazards Risk 2011, 2, 279–290. [Google Scholar] [CrossRef] [Green Version]
  53. Ganci, G.; Vicari, A.; Fortuna, L.; Del Negro, C. The HOTSAT volcano monitoring system based on combined use of SEVIRI and MODIS multispectral data. Ann. Geophys. 2011, 54, 544–550. [Google Scholar] [CrossRef]
  54. Wooster, M.; Zhukov, B.; Oertel, D. Fire radiative energy release for quantitative study of biomass burning: Derivation from the BIRD experimental satellite and comparison to MODIS fire products. Remote Sens. Environ. 2003, 86, 83–107. [Google Scholar] [CrossRef]
  55. Ganci, G.; James, M.R.; Calvari, S.; Del Negro, C. Separating the thermal fingerprints of lava flows and simultaneous lava fountaining using ground-based thermal camera and SEVIRI measurements. Geophys. Res. Lett. 2013, 40, 5058–5063. [Google Scholar] [CrossRef] [Green Version]
  56. Spampinato, L.; Ganci, G.; Hernández, P.A.; Calvo, D.; Tedesco, D.; Pérez, N.M.; Calvari, S.; Del Negro, C.; Yalire, M.M. Thermal insights into the dynamics of Nyiragongo lava lake from ground and satellite measurements. J. Geophys. Res. Solid Earth 2013, 118, 5771–5784. [Google Scholar] [CrossRef] [Green Version]
  57. Harris, A.; Blake, S.; Rothery, D.; Stevens, N. A chronology of the 1991 to 1993 Mount Etna eruption using advanced very high resolution radiometer data: Implications for real-time thermal volcano monitoring. J. Geophys. Res. Solid Earth 1997, 102, 7985–8003. [Google Scholar] [CrossRef] [Green Version]
  58. Patrick, M.R.; Harris, A.J.L.; Ripepe, M.; Dehn, J.; Rothery, D.A.; Calvari, S. Strombolian explosive styles and source conditions: Insights from thermal (FLIR) video. Bull. Volcanol. 2007, 69, 769–784. [Google Scholar] [CrossRef]
  59. Richter, N.; Favalli, M.; Zeeuw-van Dalfsen, E.; Fornaciai, A.; da Silva Fernandes, R.M.; Perez Rodriguez, N.; Levy, J.; Silva, S.V.; Walter, T.R. Lava flow hazard at Fogo Volcano, Cape Verde, before and after the 2014–2015 eruption. Nat. Hazards Earth Syst. Sci. Discuss. 2016, 16, 1925–1951. [Google Scholar] [CrossRef]
  60. Oze, C.; Winter, J.D. The occurrence, vesiculation, and solidification of dense blue glassy pahoehoe. J. Volcanol. Geotherm. Res. 2005, 142, 285–301. [Google Scholar] [CrossRef]
  61. Gonzales, A.R.; Pérez Torrado, F.J.; Carracedo Gómez, J.C.; Medina, C.J.M.; Garcia, A.B.; de la Torre, E.G.; Cigala, A.N.; Paris, R.; Rodrigues, A.N.; Dinis, H.A.; et al. Carta Geológica Ilha do Fogo, Cabo Verde; D.L.: GC 372-2015; Mercurio Editorial: Madrid, Spain, 2015; ISBN 978-84-943863-8-1. [Google Scholar]
  62. Houghton, B.F.; Schmincke, H.-U. Rothenberg scoria cone, East Eifel: A complex Strombolian and phreatomagmatic volcano. Bull. Volcanol. 1989, 52, 28–48. [Google Scholar] [CrossRef]
  63. Calvari, S.; Pinkerton, H. Birth, growth and morphologic evolution of the “Laghetto” cinder cone during the 2001 Etna eruption. J. Volcanol. Geotherm. Res. 2004, 132, 225–239. [Google Scholar] [CrossRef]
  64. Behncke, B.; Branca, S.; Corsaro, R.A.; De Beni, E.; Miraglia, L.; Proietti, C. The 2011–2012 summit activity of Mount Etna: Birth, growth and products of the new SE crater. J. Volcanol. Geotherm. Res. 2014, 270, 10–21. [Google Scholar] [CrossRef]
  65. Bonaccorso, A.; Calvari, S.; Linde, A.; Sacks, S. Eruptive processes leading to the most explosive lava fountain at Etna volcano: The 23 November 2013 episode. Geophys. Res. Lett. 2014, 41, 4912–4919. [Google Scholar] [CrossRef] [Green Version]
  66. Bagnardi, M.; Gonzales, P.J.; Hooper, A. High-resolution digital elevation model from tri-stereo Pleiades-1 satellite imagery for lava flow volume estimates at Fogo Volcano. Geophys. Res. Lett. 2016, 43, 6267–6275. [Google Scholar] [CrossRef] [Green Version]
  67. Stevens, N.F.; Wadge, G.; Williams, C.A.; Morley, J.G.; Muller, J.-P.; Murray, J.B.; Upton, M. Surface movements of emplaced lava flows measured by synthetic aperture radar interferometry. J. Geophys. Res. Solid Earth 2001, 106, 11293–11313. [Google Scholar] [CrossRef] [Green Version]
  68. Del Negro, C.; Fortuna, L.; Herault, A.; Vicari, A. Simulations of the 2004 lava flow at Etna volcano using the magflow cellular automata model. Bull. Volcanol. 2008, 70, 805–812. [Google Scholar] [CrossRef] [Green Version]
  69. Herault, A.; Vicari, A.; Ciraudo, A.; Del Negro, C. Forecasting lava flow hazards during the 2006 Etna eruption: Using the MAGFLOW cellular automata model. Comput. Geosci. 2009, 35, 1050–1060. [Google Scholar] [CrossRef]
  70. Favalli, M.; Chirico, G.D.; Papale, P.; Pareschi, M.T.; Boschi, E. Lava flow hazard at Nyiragongo volcano, DRC. Bull. Volcanol. 2009, 71, 363–374. [Google Scholar] [CrossRef]
  71. Favalli, M.; Chirico, G.D.; Papale, P.; Pareschi, M.T.; Coltelli, M.; Lucaya, N.; Boschi, E. Computer simulations of lava flow paths in the town of Goma, Nyiragongo volcano, Democratic Republic of Congo. J. Geophys. Res. 2006, 111. [Google Scholar] [CrossRef] [Green Version]
  72. Farquharson, J.I.; James, M.R.; Tuffen, H. Examining rhyolite lava flow dynamics through photo-based 3D reconstructions of the 2011–2012 lava flow field at Cordón-Caulle, Chile. J. Volcanol. Geotherm. Res. 2015, 304, 336–348. [Google Scholar] [CrossRef]
  73. Magnall, N.; James, M.R.; Tuffen, H.; Vye-Brown, C. Emplacing a cooling-limited rhyolite lava flow: Similarities with basaltic lava flows. Front. Earth Sci. 2017, 5, 44. [Google Scholar] [CrossRef]
Figure 1. Google Maps with location of: (a) Fogo Island (yellow square/rectangle) at Cape Verde Archipelago, western Africa; (b) Cha Caldera and Pico do Fogo volcano (inside the red rectangle); and (c) Cha Caldera depression and the paved road (yellow line) that crosses it from SE to NW, Pico do Fogo volcano, and the Portela and Bangaeira villages. The blue dot shows the fixed camera location. The 1995 lava flow field is from [39].
Remotesensing 10 01115 g001
Figure 2. (a) Map displaying the most important stages of growth of the lava flow field. The legend shows in different colors the stages of growth of the lava flow field, as well as the eruptive fissure (red dotted line), Mount Beco, Portela, Bangaeira, Vent 1, and the names of the three arterial flows: Flow 1, Flow 2, and Flow 3. (bg) Satellite images showing in red the active portion of the lava flow field, with the outline of the lava flow field in yellow. The destroyed (dotted black line) and residual portion (black line) of the access road to the Cha Caldera is also shown.
Remotesensing 10 01115 g002
Figure 3. Lava tube formation and growth during the early stages of the eruption shown by photo and thermal images. (a) Photo taken from SW (Mt. Beco, see Figure 1) on 27 November 2014 showing the opening of Vent 1 at the base of the eruptive fissure; and (b) thermal image collected on the same day, showing lava overflows from the S crater rim feeding several branches overlapping Flow 1. Powerful Strombolian activity occurred from seven vents along the fissure. (c) Thermal image displaying a decreased explosive activity from two active vents within the cinder cone, several overflows from the S crater rim overlapping Flow 1, and Vent 1 at the base of the eruptive fissure. (d) Composition of two overlapped thermal images, displaying a significant erosion of the S crater rim by lava overflows (right of the image), and a small tumulus formed by lava accumulation around Vent 1 (left of the image). (e) Thermal image collected on 30 November 2014, displaying the inactive overflows from the crater rim, and Vent 1 at the base of the fissure forming a much higher tumulus than the previous day, with several skylights (white dots) displaying the path of the proximal lava tube. Note the much smaller range of the thermal scale (100–400 °C) to the right of this image when compared to the scales of previous thermal images (100–700 °C), suggesting a much cooler upper lava flow field.
Remotesensing 10 01115 g003
Figure 4. Photos of Fogo: (a) The 2014 eruptive fissure and cinder cone, taken from West on 23 November 2015, with at its base a frozen lava pond where Vent 1 was located. In the foreground is a skylight with a tube (visible in c)) at its base, about 20 m below the surface. Pico do Fogo is in the background. (b) View of the skylight as taken from east and looking down flow, with the pahoehoe surface coating the inner walls of the skylight, displaying final drainage of lava within the depression. (c) Lava tube, about 2–3 m wide, at the bottom of the skylight shown in a and b.
Remotesensing 10 01115 g004
Figure 5. Map with outline of the whole lava flow field (red line) mainly comprising aa lava flow surfaces, with the blue area indicating the distribution of pahoehoe lava flows. See text for further explanation. Flow 1 made of aa (arterial flow volume-controlled); Flow 3 made of pahoehoe (secondary flow fed by drainage of Flow 2); and Flow 2 complex flow made of aa (initial arterial flow) + pahoehoe (at the flow margins, mainly by emptying of the flow interior) + proximal pahoehoe by late stage (degassed) flow emplacement. The yellow dotted line indicates the eruptive fissure, the black line the access road to Cha Caldera (dotted where covered by the lava flows).
Remotesensing 10 01115 g005
Figure 6. Graph showing maximum lava flow lengths (in meters) vs. time (dd/mm/yyyy) for the three arterial lava flows that developed during the Fogo 2014–2015 effusive eruption, Flow 1, Flow 2, and Flow 3. Note that Flow 1 increased its length only until the end of November; Flow 2 had two major growing phases, at the end of November and in early December; Flow 3 was mainly active during the second half of December, when the other two flows had largely halted. The difference in volume between the TADR measured by satellite and the Supply Rate calculated based on the SO2 flux measurements (blue bar), with uncertainty bars (gray and pale blue bars), is also shown, with values increasing especially from early December onwards.
Remotesensing 10 01115 g006
Figure 7. Graph showing Time Averaged Discharge Rate (TADR, purple diamonds) retrieved by HOTSAT and Supply Rate derived from SO2 data (green diamonds) vs. time (dd/mm/yyyy) during the Fogo 2014–2015 effusive eruption. Red and orange solid lines and relative errors (dashed lines) show volumes obtained by integrating TADR and Supply Rate curves, respectively.
Remotesensing 10 01115 g007
Figure 8. Interpretative model. Outline of the final lava flow field (red line) with path of lava tubes (yellow dotted line). The position of V1 at the base of the eruptive fissure is also shown.
Remotesensing 10 01115 g008

