Article

Multi-Criteria Analysis of Electric Vans for City Logistics

by
Jarosław Wątróbski
1,
Krzysztof Małecki
1,*,
Kinga Kijewska
2,
Stanisław Iwan
2,
Artur Karczmarczyk
1 and
Russell G. Thompson
3
1
Faculty of Computer Science, West Pomeranian University of Technology, Żołnierska 52 Str., 71-210 Szczecin, Poland
2
Faculty of Economics and Engineering of Transport, Maritime University of Szczecin, Pobożnego 11 Str., 70-507 Szczecin, Poland
3
Department of Infrastructure Engineering, The University of Melbourne, Parkville 3010, Australia
*
Author to whom correspondence should be addressed.
Sustainability 2017, 9(8), 1453; https://doi.org/10.3390/su9081453
Submission received: 5 June 2017 / Revised: 8 August 2017 / Accepted: 14 August 2017 / Published: 17 August 2017
(This article belongs to the Special Issue Sustainable Electric Power Systems Research)

Abstract

:
Atmospheric emissions of anthropogenic origin are one of the most important problems in cities. A particularly discrete ecological footprint in urban environment is made by urban freight transport. This problem has become the key challenge for all stakeholder groups involved in freight transport in urban areas. Over the recent years, there has been a growing interest in using alternative fuel vehicles in urban logistics, including those equipped with electric drive systems. This paper presents a multi-criteria analysis (MCA) of selected electric vehicles (EVs) in the context of their application for the purposes of deliveries in cities. In methodological terms, we present a unique MCA-based approach for evaluation of Electric Freight Vehicles (EFVs). A successful attempt is made to build a multistep MCA procedure based on two carefully selected MCDA methods (PROMETHEE II and fuzzy TOPSIS) to handle both certain and uncertain data sets in a single decision process. In practical terms, we successfully demonstrate the usefulness of the proposed approach by creating a set of decision maker’s preference models (based on certain and uncertain data) of carefully selected EFVs and provide sensitivity and robustness analyses of the obtained solutions.

1. Introduction

Atmospheric emissions arising from human activities are a common problem in medium and large conurbations and urban transport is often a major source of emissions [1,2]. Apart from carbon dioxide emissions, the increase in the number of vehicles leads to a rise in emissions of nitrogen oxides as well as air pollution with fine dust resulting from abrasive wear of brake pads [3], tires [4,5] and road surfaces [6]. In addition, the consumption of non-renewable fuels translates directly into environmental pollution [7], comprising emissions of: carbon monoxide (CO), nitrogen oxides (NOx), sulphur dioxide (SO2), hydrocarbons (CHx, including polycyclic aromatic hydrocarbons (PAH)), dioxins and benzene, as well as particulate matter (PM, mainly carbon, cadmium, zinc, nickel, platinum and chromium) [8,9].
The particularly discrete ecological footprint in urban environment is made by urban freight transport [10,11]. Urban logistics involve various entities whose interests are often conflicting, which makes it more difficult to implement ecological solutions in this regard [12]. Crainic et al. [13] assert that this is mainly due to the fact that the urban sector of freight transport is private. Private shippers often pay less heed to generating negative effects that mainly include noise, environmental pollution, compromised traffic safety and deterioration of urban infrastructure [14]. A good example might be the problem with sustaining consolidation centres that often discontinue their activity as soon as the supporting project aimed at their establishing and start-up has expired [15]. To a significant extent, this is caused by disparity of interests within public–private partnerships.
In view of the above, the problem of urban logistics operations in the context of its impact on the environment has become the key challenge for all stakeholder groups involved in freight transport in urban areas [16,17,18]. Numerous initiatives have emerged in direct response to these problems, including international projects, such as BestUFS (BEST Urban Freight Solutions,), TRAILBLAZER (Transport and Innovation Logistics by Local Authorities with a Zest for Efficiency and Realisation), SUGAR (Sustainable Urban Goods logistics Achieved by Regional and local policies), C-LIEGE (Clean Last mile transport and logistics management for smart and Efficient local Governments in Europe), STRAIGHTSOL (Strategies and measures for smarter urban freight solutions), COFRET (Carbon Footprint of Freight Transport) and GRASS (Green And Sustainable freight transport Systems in cities). While local authorities and inhabitants are the ones most affected by the negative effects of urban freight transport, it is the private companies that are to a large extent able to increase the stability of solutions that reduce them. Dablanc describes it as a badly organized urban logistics system—when delivering goods, shippers adapt to the imposed restrictions, but, from the cities’ point of view, the deliveries could be much more optimized in terms of their destinations, which would help reduce the number of vehicles entering the cities [19]. Nevertheless, over the recent years there has been a growing interest in using alternative fuel vehicles in urban logistics, including those equipped with electric drive systems [20].
Since the 1970s, there has been a noticeable increase in interest in alternative fuels for cars [21,22]. Actions aimed at implementing new technologies were forced by the oil crises [23]: first in 1973, then shortly afterwards in 1979–1982 and in 1990. The result of those actions led to the development of alternative car fuels. Currently, the alternative propulsion systems for motor vehicles include mainly [24,25,26]: gas-powered drives-LPG (Liquefied Petroleum Gas) and CNG (Compressed Natural Gas) [27], biofuels, hydrogen-based technologies [28] and electric drives [29]. Gas-powered drives (LPG I CNG), compared to traditional fuels, produce 18% less greenhouse gas and generate ca. 3 dB less noise [26]. Their major drawbacks include greater fuel consumption and limited possibilities of filling up the tank [27]. Currently, it is the most popular alternative for vehicle powering; moreover, studies on gas fuels are at the most advanced level. Biofuels—in this case IC engines—are modified in such a way that instead of petrol or diesel they use ethanol, being the result of biomass fermentation [1]. Currently, the US is the leader in biofuels use [30], as half of the maize grown there is intended for bioethanol production. There are two major ways of obtaining energy in hydrogen drives, where the fuel is hydrogen [31]: hydrogen combustion taking place in a typical piston engine combustion chamber and using fuel cells that produce energy as a result of oxidizing the fuel constantly supplied from outside. Hybrid drives involve a traditional engine combined with an electric one [32]. Currently, the basic types of solutions used are, serial drives (IC engine operates all the time, driving the generator which in turn supplies power to the electric motor that propels the vehicle wheels, while any excess power is stored in the battery) and parallel drives (where both the IC engine and the electric one propel the wheels of the vehicle). Electric drives can use only battery powered electric engines [25]. They produce less pollution as well as operate more quietly [33]. Considering the restrictions that are more and more frequently imposed on freight vehicle traffic, as well as taxes and fees charged by local self-governments, application of electric vehicles may contribute to a reduction in delivery costs in cities, which may account for up to 40% of total transport costs [34].
One of the first research projects regarding the use of electric vehicles in urban freight transport was the ELCIDIS (Electric Vehicle City Distribution) project [35]. However, the costs of purchasing electric vehicles are still perceived to be a substantial barrier to their widespread use. Additionally, a substantial difficulty lies in selecting vehicles with operation parameters that fulfil the needs of the logistic processes they are to serve. Therefore, the key challenge is the optimization of the transport fleet while taking into account a multi-criteria evaluation of benefits. City logistics involves implementing schemes in cities for reducing the impacts and costs of freight [36]. There are a number of city logistic solutions that involve modifying freight vehicles including alternative fuels such as electric vehicles that can be implemented [37]. More and more effective measures have started to be implemented in cities in recent years [38,39].
Although it has been more than 100 years since an electric vehicle first exceeded a speed of 100 km/h [40], the fundamental difficulty still to be overcome is the problem of storing large amounts of energy in batteries with relatively small weight, as well as the problem of how to charge them rapidly [41]. The “Jamais Contente” electric vehicle developed by the designer Camille Jenatzy was equipped with 40 kM DC motor and a powerful acid battery bank that ensured the travel range of several kilometres. The problems encountered by Jenatzy have not yet been fully solved. Research on new electric motor designs is still underway, aiming at obtaining high operating parameters as well as advanced systems of drive control, supported by telematic solutions [42]. The EU transport policy stipulates—according to the intentions presented in the White Book—to reduce the number of IC engine vehicles to 50% by 2030, and phasing them out by 2060 [43]. Although EVs (Electric Vehicles) do not yet have a significant share in the European vehicle market, there is a noticeable, fast and continuous increase in the number of electric vehicles sold [34].
The application of electric vehicles in urban logistics is related to fundamental advantages of using this type of drives. However, it is important to underline some impediments and barriers that must be overcome in order to enable a significant increase in the interest in utilization of them in urban freight transport systems, especially considering the business stakeholders’ perspective. One of them is the proper choice of the vehicles. The technical parameters of electric vehicles in city logistics are strongly related to the specificity of the tasks, which are realized by the stakeholder, including type of deliveries, number of deliveries, distance, etc. [44,45]. Nowadays, no general method to help properly choose electric vehicles considers the needs of urban freight transport business’ stakeholders. Due to the many technical parameters related to the city logistics tasks, these decisions are based on a multi-criteria approach [46].
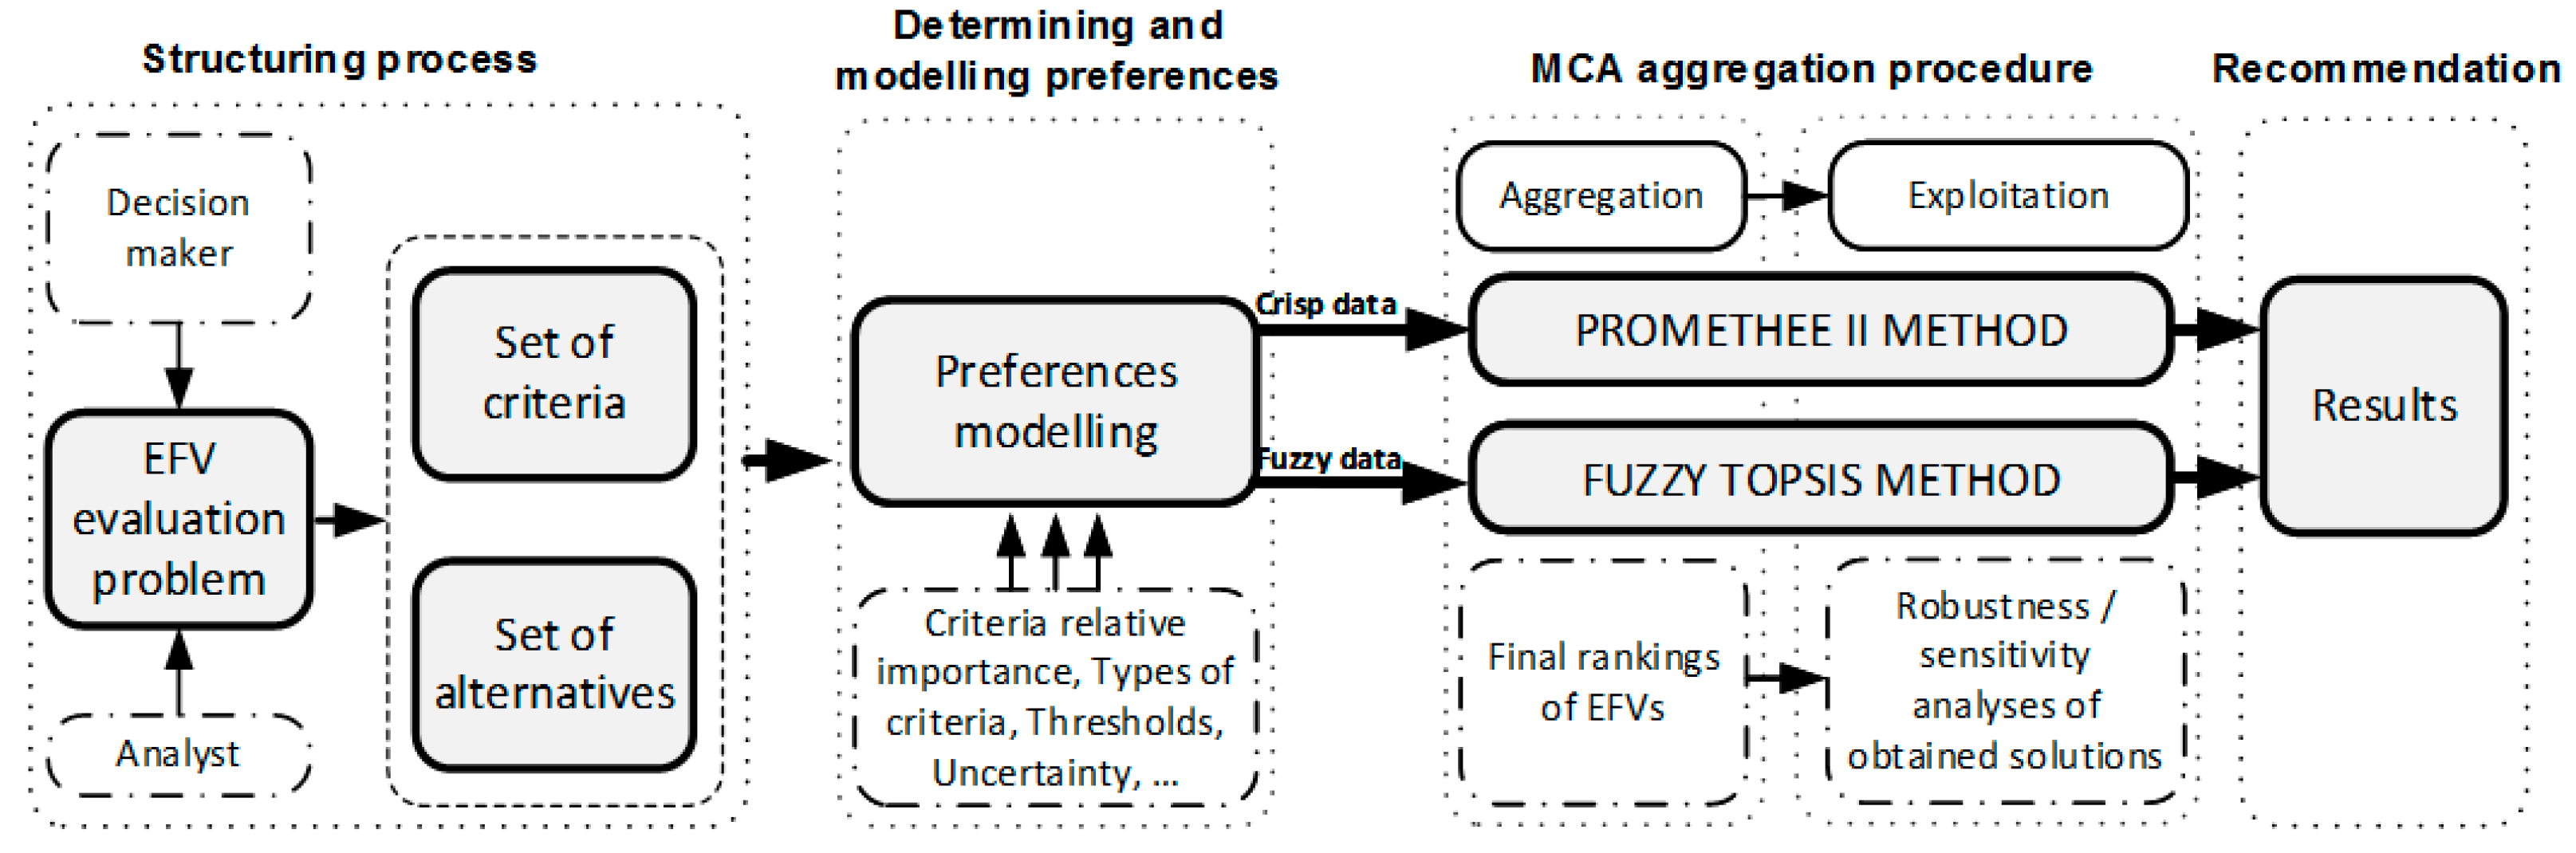
The general aim of the paper is to provide a multi-criteria analysis approach as a support for this kind of decision processes. The authors’ methodological contribution is an attempt to create a unique multistep approach based on MCA methods. This approach accommodates the analysis of certain data, as well as it provides recommendations in cases of both lacking or uncertain data in an integrated multistep decision model. Thus, it produces recommendations based on certain data, consistent with the decision maker’s (DM’s) preferences, as well as, concurrently, it allows including recommendations for the cases where the data are partially missing or uncertain. In practical terms, we apply the proposed framework in a future-proof problem of the choice of EFVs, for the purpose of deliveries in cities. In addition, generalized guidelines to facilitate effective selection of such solutions in urban logistics are provided. The article also presents the current state of knowledge regarding the extent to which electric vehicles are used in urban logistics and it describes the key parameters for determining the usability of electric vehicles in urban deliveries. Finally, based on the formulated assumptions, a multi-criteria model is presented to enable the selection, out of the defined vehicles catalogue, solutions that are optimal in terms of potential effectiveness.
The article does not discuss the use of passenger vehicles for the goods and passengers delivery at once, focusing exclusively on vehicles dedicated just to the cargo delivery. It is worth noting, however, that passenger vehicles are often used to carry loads and people at the same time. Considering this fact, it may be an interesting extension of our research but it would require expanding the database of electric vehicles with additional models and it requires the introduction of new decision criteria, such as a different payload than for freight vehicles, the number of people, etc.

2. Overview of the Current State of Knowledge Regarding Application of Electric Drives in Urban Logistics—Selected Examples

According to a report prepared by IHS Automotive, currently, the share of electric and hybrid vehicles registered in most countries worldwide does not exceed 1%. However, their number is growing rapidly, which is being confirmed by statistical data every year. Navigant Research predicts that by 2023 the share of electric vehicles in the global market will have risen to 2.4%.
According to the analyses prepared by Frost & Sullivan, the fastest growing sale markets for electric vehicles are Europe and China, and the number of such vehicles to be used worldwide is expected to approach 10 million within the next five years [47]. As for non-European countries, apart from China, the greatest interest in electric vehicles is observed in, inter alia, the USA and Japan. These countries have become leaders in electric automotive industry development. In Europe, a significant increase in electric vehicles sales was not seen until a few years ago. In 2009, as few as 700 electric vehicles were sold, while in 2017 more than 100,000 EVs were registered; this does not include all types of hybrids with the possibility of external charging. In terms of the number of electric vehicles purchased in Europe, the leaders are: Norway, France, Germany and Great Britain.
One of the vital arguments for e-transport is not only ecology, but also economic considerations. The electric power needed to charge traction batteries costs six times less than fuel combusted by IC engine vehicles, assuming similar distances covered by both types of vehicles. Besides, the insurance and servicing costs are also lower. An electric drive is not only more ecological, but also simpler and less susceptible to technical failures compared to IC engines. Despite the higher price of electric vehicles, the maintenance costs of large company fleets based on electric drives may be substantially lower compared to conventionally powered vehicles. However, the prerequisite for introducing e-mobility is a well-developed and well-managed EV charging infrastructure [47].

2.1. Applications of Electric Vehicles in Urban Logistics

Traffic generated by freight transport accounts for 20–30% of kilometres covered by vehicles in urban areas and for 16–50% of air pollution derived by all kinds of transport [19,48]. It would seem that the optimal solution should be a switchover to electric propulsion and replacing the conventional fleet with electric vehicles. Alas, shippers and drivers have bad experience related to initial implementation of electric vehicles. They primarily point out the lesser performance of electric vehicles (in comparison to the conventional ones) in terms of travel range, speed, acceleration and unreliability [49]. Many research studies in that respect date back at least 20 years, e.g., under projects financed by the EU, such as EVD-POST (Electric Vehicle Deliveries in Postal Services) [50]. The main conclusions highlighted the high costs of goods delivery, limited choice of vehicle models, lack of support with regard to vehicle sales and long lead time for spare parts, low capacity of batteries, limited travel range, relatively low speed and limited carrying capacity. In short, the authors of those studies indicated that the early versions of EFVs were far from perfect and they were not a serious alternative to conventional vehicles for the purposes of logistic operations in cities.
One of the first successes in terms of EV implementation is described in [51]. It pertained to using EFVs within a cooperative framework for the purposes of urban freight transport, wherein its main idea was to establish an EFVs depot in the centre of Osaka and enable their use by multiple distribution companies. The project involved 28 electric freight vehicles, and 79 companies volunteered to participate in the undertaking. As a result of the system implementation, the number of kilometres covered was reduced, which led to a decrease in congestion. Another implementation involved a three-year project described in [52] that was mainly aimed at long-term measurements of fuel and energy consumption, travel range when using an electric motor, drivability, lithium-ion battery capacity and durability. A van prototype was proposed, equipped with a parallel architecture of hybrid drive based on five-cylinder 2.7 L diesel engine. The electric drive system was based on a permanent magnet 90 kW motor and 15 kWh lithium-ion (Li-Ion) battery. Another attempt at developing a modular structure of electric light trucks or vans (ELTVs) was the OPTIBODY project [53]. This time, the new architecture was to contribute to improve the passive vehicle safety, in order to reduce the number of fatal accidents and injuries.
The authors of [54] provide a comparison of electric and fuel-powered urban freight vehicles in terms of life cycle, energy consumption, greenhouse gases (GHG) emissions and total cost of ownership (TCO). The authors engaged in studies using the New York City driving cycle that included frequent stopping and a low average speed, electric vehicles emitted 42–61% less greenhouse gas and consumed 32–54% less energy than freight vehicles equipped with diesel engines, depending on performance of individual vehicles. Table 1 presents selected EU projects implemented in 1998–2016, the main goals of those projects and involvement of twin cities. The analysis was based on [34] as well as final reports and web pages of the projects presented in Table 1.
Research studies focused on comparing three-wheel electric freight vehicles of small carrying capacity in relation to freight vehicles equipped with diesel engine were performed by Tipagornwong and Figliozzi [55]. The studies were undertaken in urban areas, and the vehicles in question were the so-called trikes, low-emission vehicles using a combination of human effort and an electric motor for propulsion.
Other studies, described in [48], pertained to Amsterdam, a city that for many years has been striving to improve the air quality, road traffic safety and capacity, as well as to reduce noise levels by means of applying intelligent delivery methods and ecological transport. The research found that the current generation of electric vehicles is capable of operating urban freight transport quite efficiently, at the same reducing the distance covered by the vehicles by 19% (when applying consolidation), concurrently improving the air quality and reducing CO2 emissions by 90%.
Taefi et al. [56] features an extensive analysis regarding the existing EFV initiatives in Denmark, Germany, Holland, Sweden and Great Britain. It concluded that there is a need for such research, as urban freight transport is thought to be one of the most promising areas of electric vehicles application.

2.2. Impediments to Application of Alternative Drive Vehicles in Urban Logistics Systems

Application of alternative drive vehicles—in particular electric vehicles—in urban logistics is related to fundamental advantages of using this type of drives. These involve the possibility to produce energy from any source, lack of gaseous or solid pollutant emissions into the atmosphere, lack of noise emissions, higher energy efficiency compared to traditional drives, cheaper production of drives, their maintenance and servicing, providing energy independence, low operation costs depending on the vehicle velocity and the price of 1 kWh. The existing electric power distribution network is the best developed part of the infrastructure. However, it is also important to stress the limitations and impediments which must be overcome in order to enable a significant increase in the interest in alternative drive vehicles. These may be broken down into three basic groups [57]: (a) economic difficulties including costs of purchasing such vehicles, costs of producing electric power for the vehicles, and costs of utilizing used-up batteries; (b) safety-related problems regarding the aspect of hardly audible operation of electric motor compared to conventional engines, which may consequently lead to collisions or accidents; but also potential risk of battery self-ignition; and (c) operational barriers, mainly connected with the fact that the full potential of alternative drives efficiency has not been fully achieved yet, long battery charging time, and limited cargo space in the case of electric vehicles.
What is important in terms of electric vehicles efficiency is the climate of the geographic area where such vehicles are used. It predominantly affects the vehicle’s travel range: in winter months, more energy is needed for heating the interior, whereas, in summer months, air-conditioning increases the power demand. An important factor to limit the efficiency of urban freight transport using EFVs is city topography. As indicated in [58], energy consumption was high when driving on motorways and uphill. On the other hand, EFVs did well in urban traffic. Undoubtedly, the greatest barrier is the still high price of purchasing electric vehicles. They are usually more expensive than their traditionally powered counterparts. On the other hand, we can expect that businesses will be able to use different forms of support in purchasing vehicles of this type. This may mean tax relief as well as subsidies from local governments. A good example in this respect is Norway experiencing a substantial increase, the highest in Europe, in the number of electric vehicles. In this context, it is worth noting the conclusion drawn from the studies published in [59] that EFVs will not become competitive until savings derived from the operating costs reduction are sufficient to cover the substantially higher initial costs of purchase.
The most costly component of EFVs is usually batteries, the cost of which accounts for circa half of EFV retail price. Manufacturers focus on the technical capacity of batteries and increasing the operation range while decreasing their weight and charging time. Electric vehicle batteries must feature high Ah capacity; besides, they must be characterized by high power-to-weight and energy-to-weight ratios, as well as high energy density. Research and development in this regard is still underway [60]. Currently, economic efficiency of EFVs is characterized by high purchasing costs of batteries, and lower costs of maintenance and fuel purchase. Over a short and medium term, EV costs are considerable, however, their advantages make them more competitive in a long run. The latest research has shown that TCO may be lower for electric vehicles compared to the conventional ones [54,61]. It should be noted that EV purchases are currently most often financed with public funds. Private operators will be inclined to replace their fleets if: they notice benefits for their companies, an appropriate number of alternative fuel stations is provided, there are marketing benefits for the company, the given company is in any way connected with environmental protection, appropriate vehicles are available [62]. Often, operators are forced to apply solutions of this kind by way of administrative decisions which prohibit in historic city centres or other specified areas vehicles other than those with alternative drives. The limited availability of information in model specifications and its operation is perceived as another factor to inhibit purchasing EFVs and using them in urban logistics. Source London reports that, “at the moment of purchase, there was not much information on basic elements i.e., screws and nuts or if the vehicle required water or oil”. Additionally, the impediments that inhibit the use of electric and hybrid vehicles include [62]: higher operating costs of applying electric vehicles, small capacity of batteries, lack of battery charging infrastructure, low reliability and a large number of defects during complicated operation of the vehicles.
Over the recent years, considerable progress has been made with regard to improving the performance of electric vehicles, and many problems identified in earlier attempts at EFVs implementation in urban logistics have been resolved. Unfortunately, many problems entered a new dimension, and solutions have not yet been developed, even though the new EFVs feature longer travel ranges, more carrying capacity, better batteries and it takes less time to charge them completely or partially. It should also be noted that it is not plausible to perform all freight operations by means of EFVs. This relates to particular situations calling for vehicles with a large carrying capacity or long time of effective operation, e.g., when the vehicle must be in continuous operation for more than 12 h.

2.3. Key Factors Determining the Usability of Electric Drives in City Logistics

Although today’s EFVs demonstrate better performance parameters: longer travel range and more capacious batteries and more carrying capacity, their actual usability in urban logistics still remains limited. The authors of the report [34] specified the challenges and factors that influence successful implementation of EFVs in everyday logistic operations in a city [57]: (a) Technical performance: travel range of EFVs usually does not exceed 100–150 km, even though the values specified by manufacturers tend to be higher. Potential stakeholders declare a greater interest in EFVs if they see improvement of operational parameters such as travel range, operation time with a battery, increasing the number of charging points and charging stations. (b) Operational performance: EFVs show both positive and negative features in comparison to IC engine vehicles. The positive features include the limited impact on the natural environment and decrease in noise level, which translates into their usability in city centres and time windows. At the same time, the charging, carrying capacity, maintenance and the need to adjust the logistic concepts to EFV application are perceived by operators to be the major operational challenges. (c) Economics: Purchase price and TCO still exceed corresponding values related to conventional vehicles. This results mainly from high costs of batteries and EFV small production limits. In the long run, these costs are expected to diminish, which will be connected with improving the operational parameters and efficiency, cutting the purchase prices, e.g., as a result of mass production. Resale value is highly unknown, which stops investors from making purchase on the primary market. (d) Environmental performance: EFVs cause less CO2 emissions compared to their conventional counterparts, however, their demand for energy as well as energy prices in a long run and energy capacities of individual countries require analyses and research studies. (e) Social and attitudinal impact: EFVs are less noisy and more environmentally friendly than conventional ones, therefore most of the public show a positive view on this direction of development. (f) Impact of local policy and governance structure: Governments of many European countries take up new directives aimed at increasing the use of EFVs while decreasing the use of conventional vehicles.
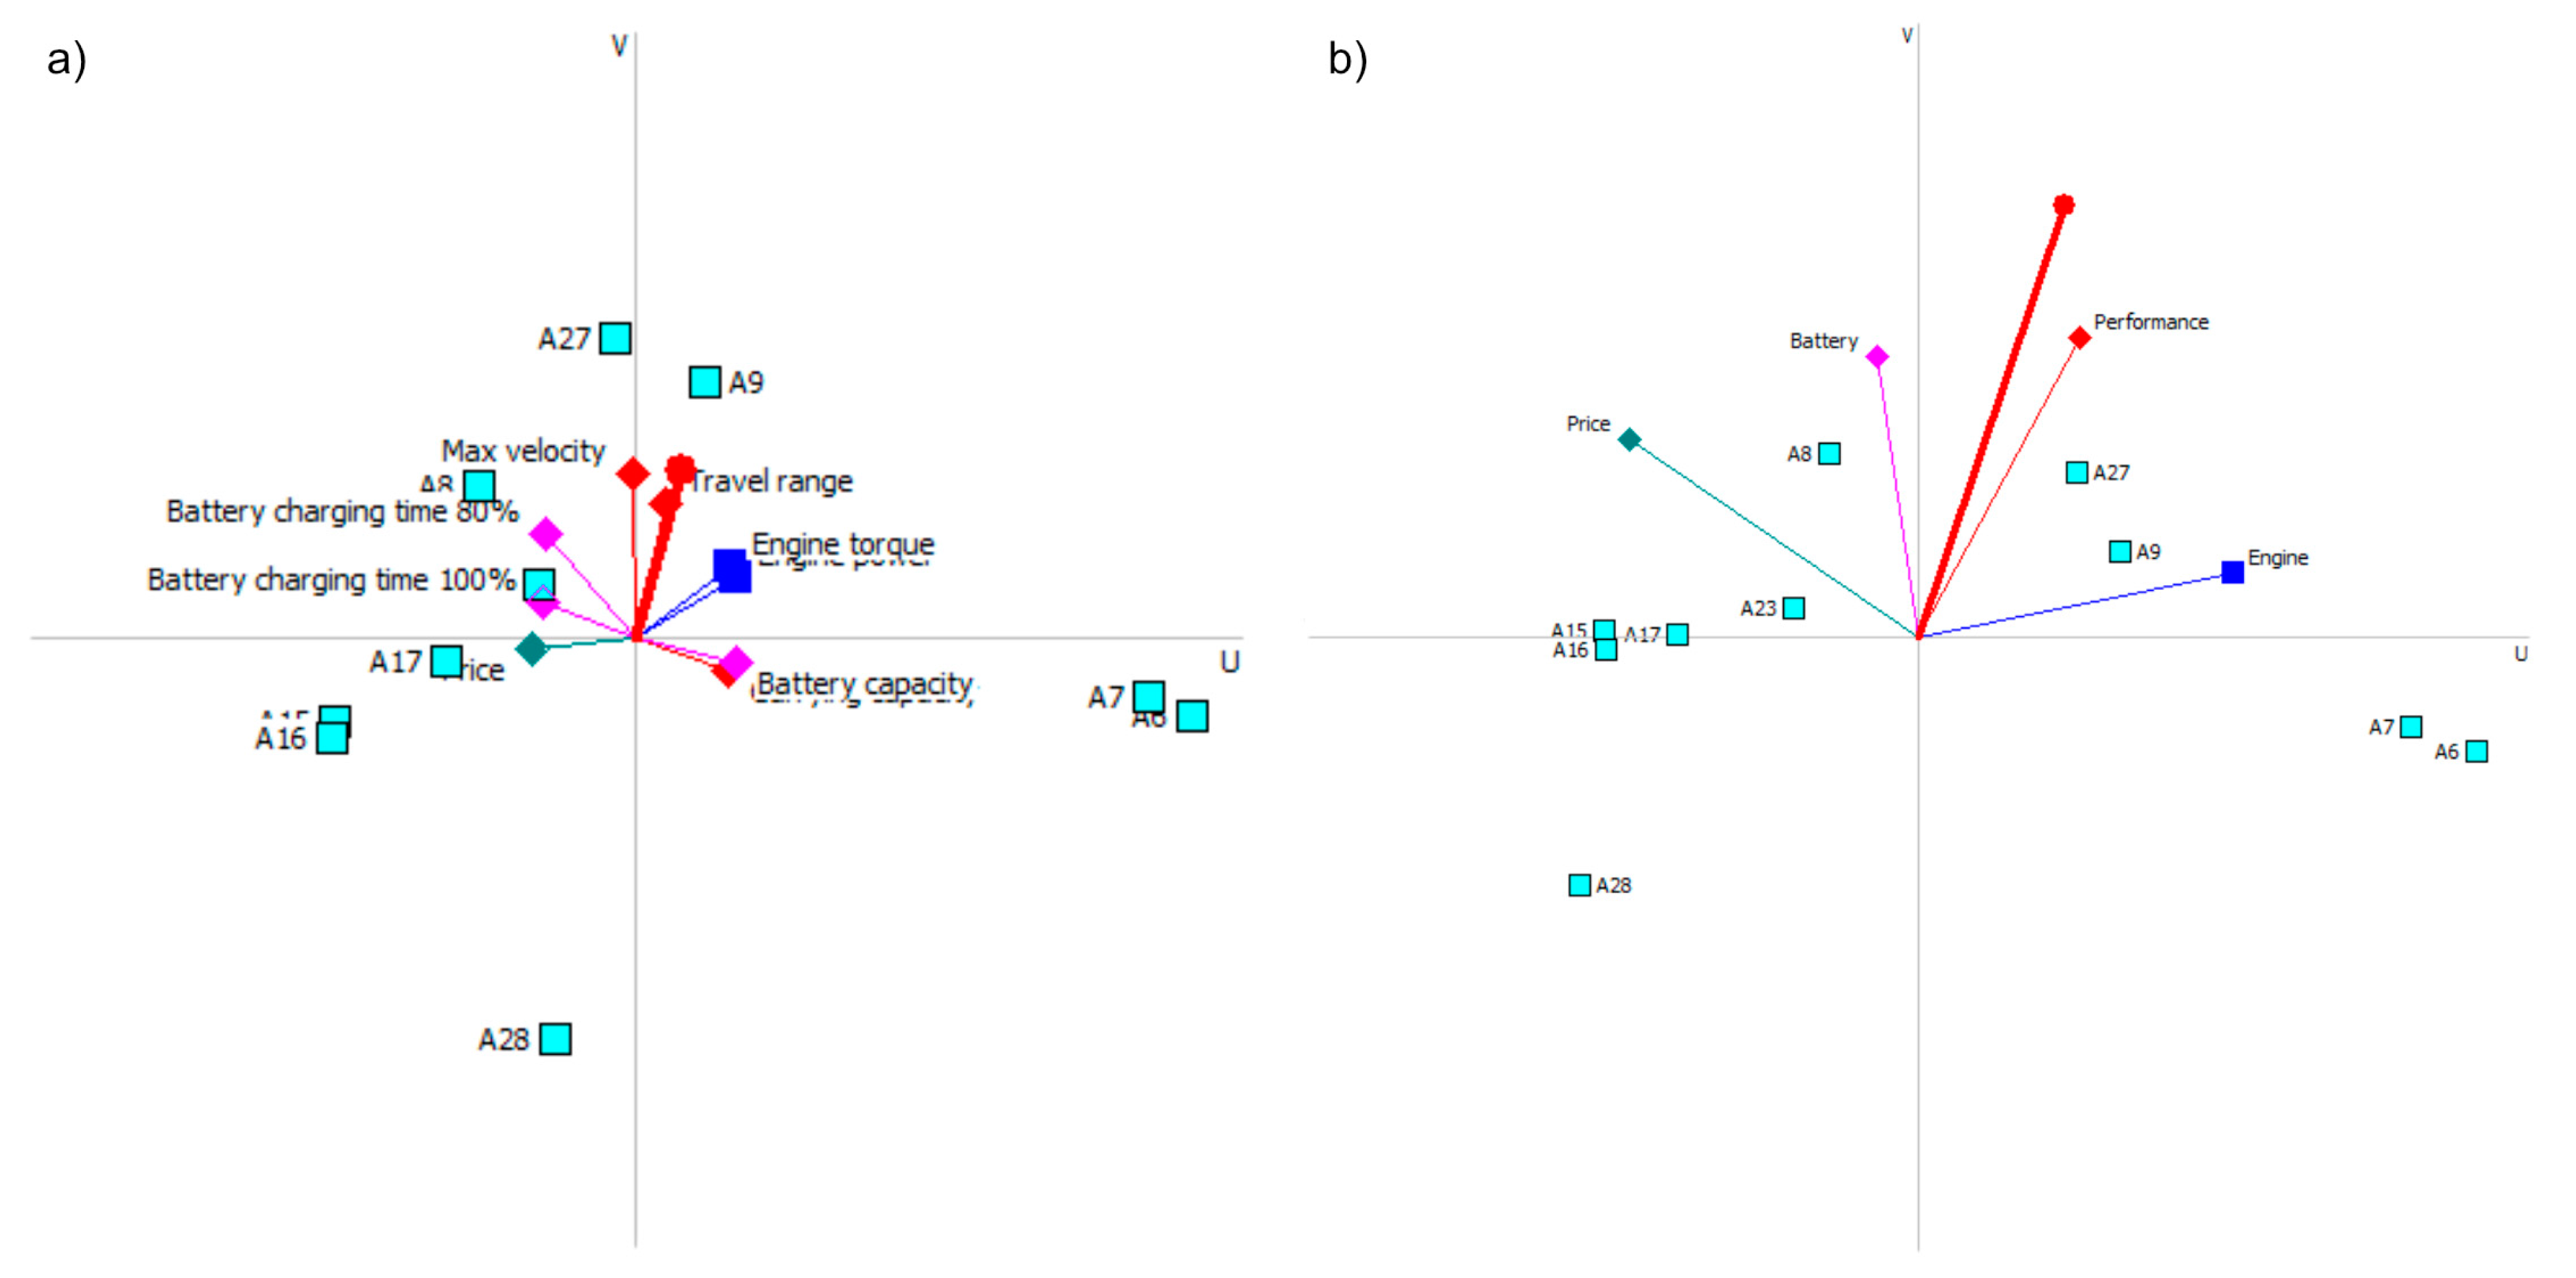
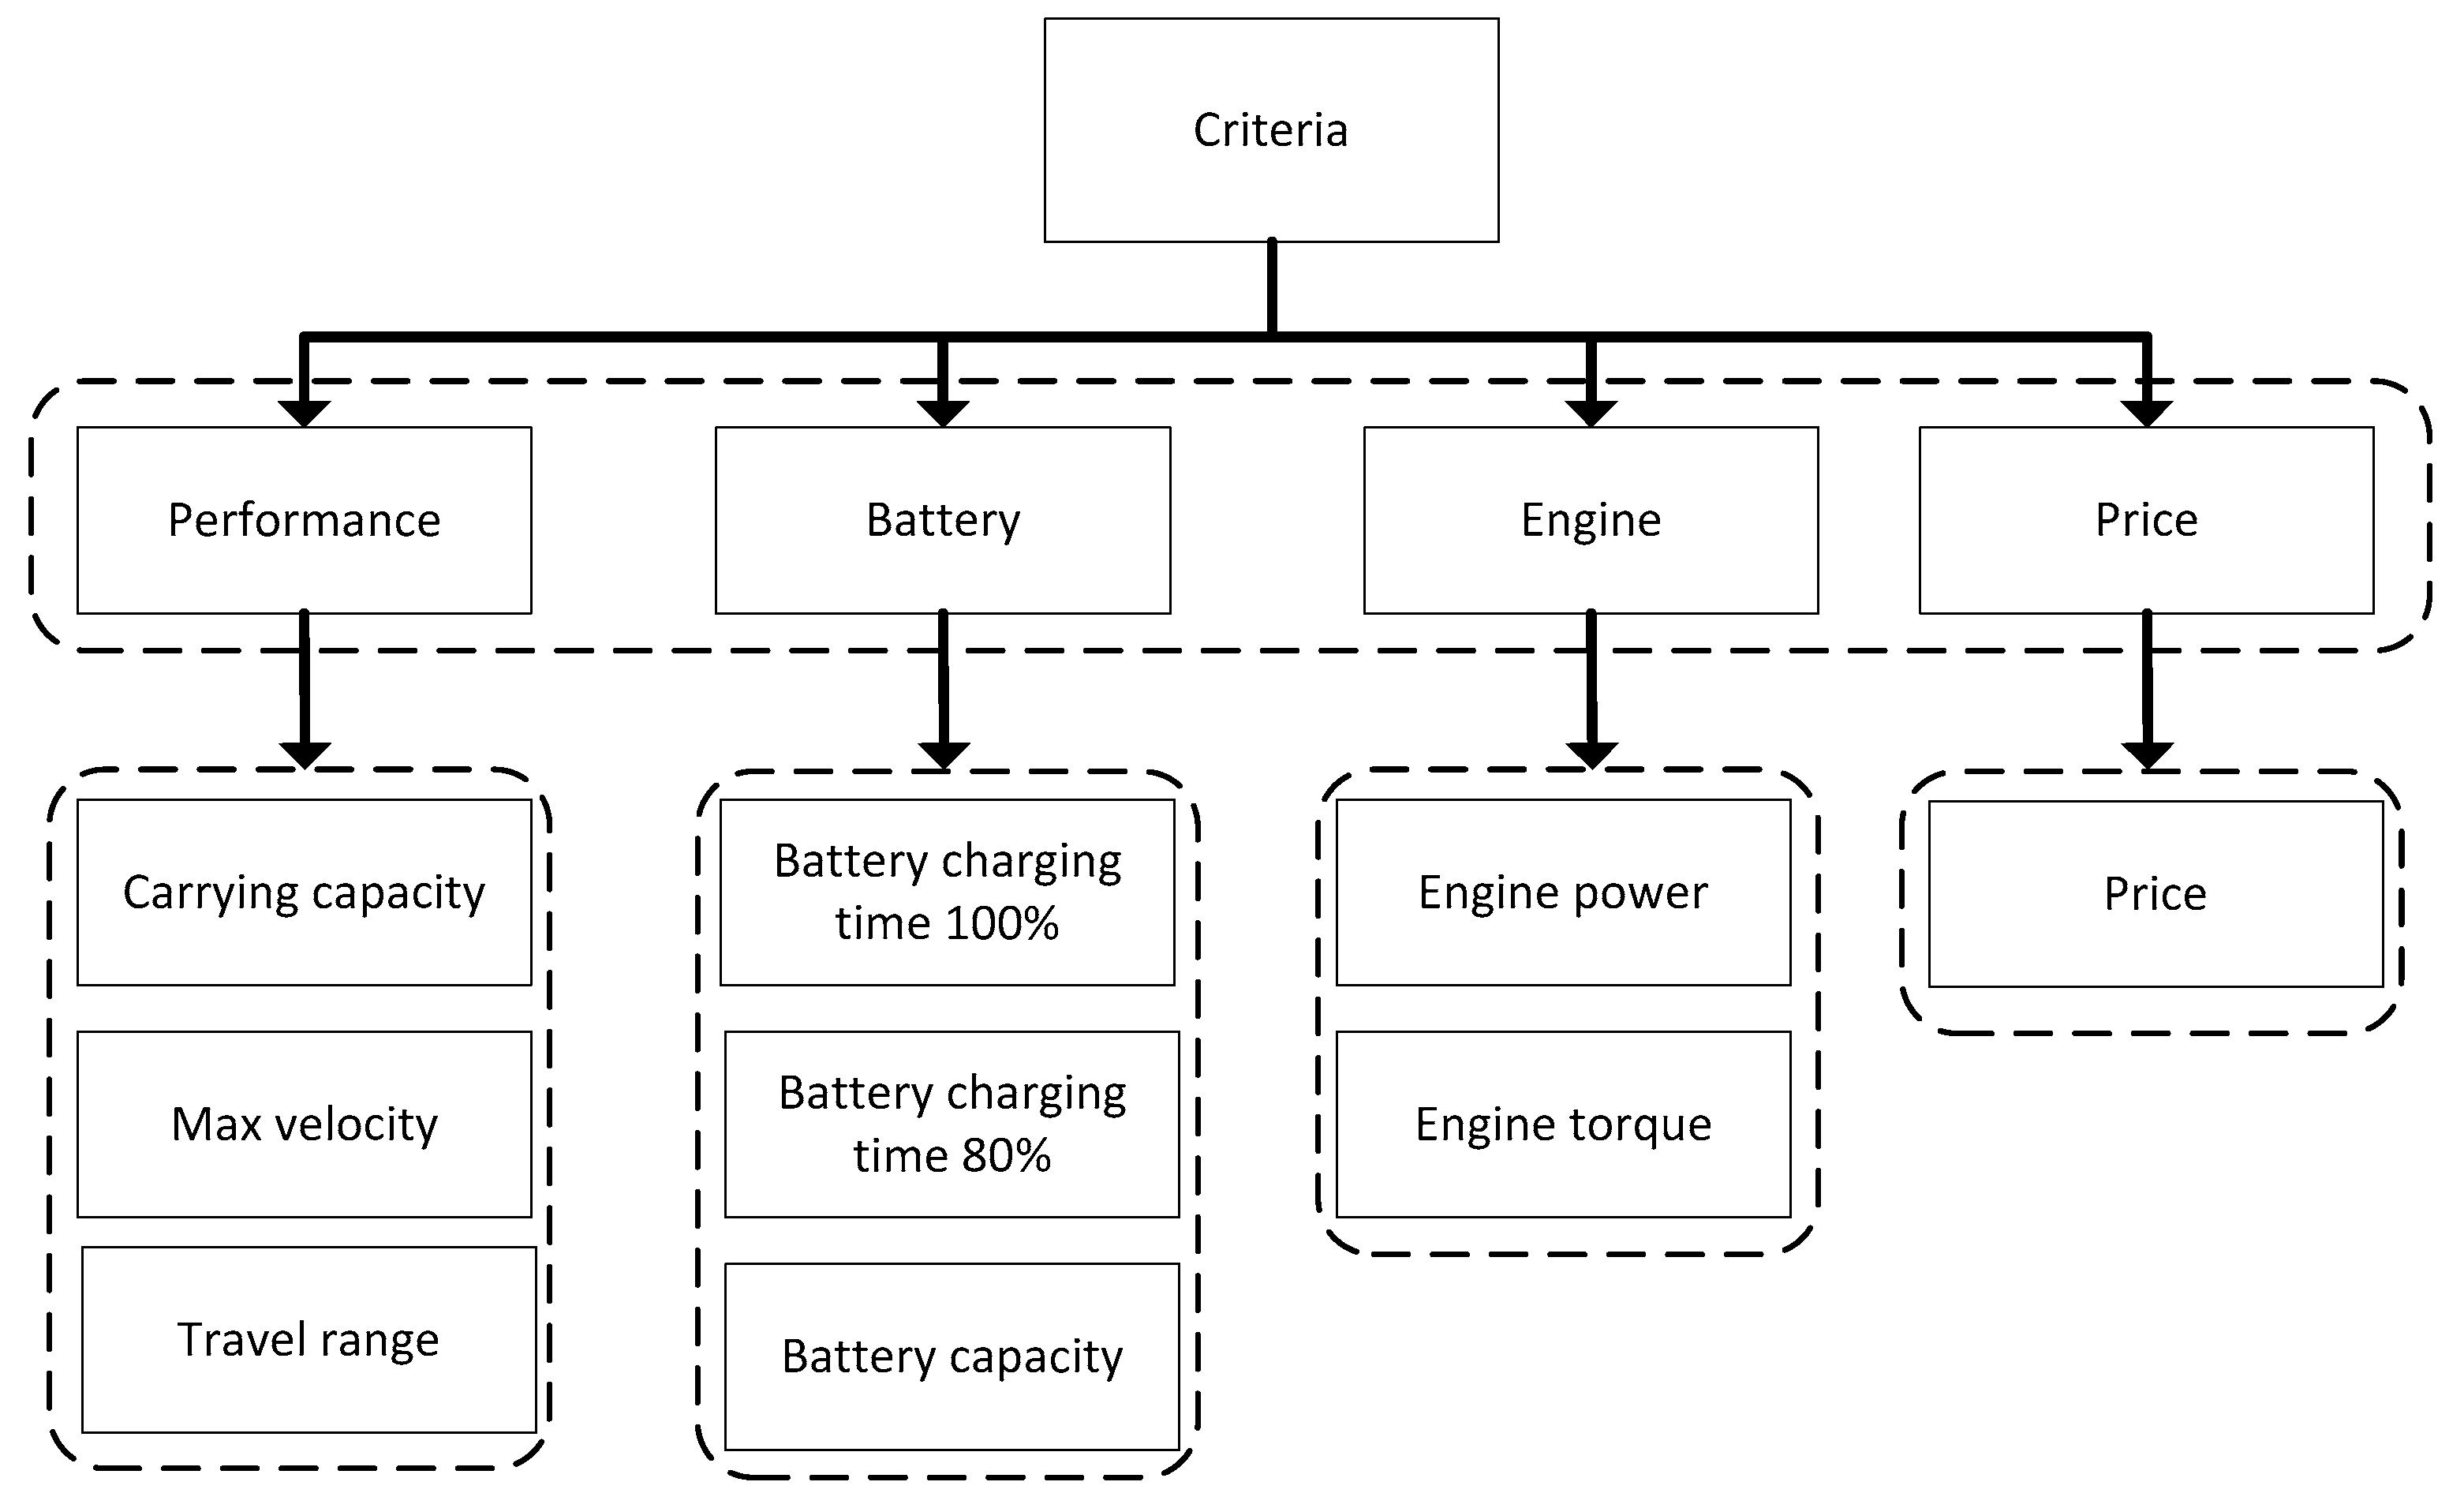
Technical performance of EFVs (within the scope discussed further on in this article, i.e., carrying capacity, maximum velocity, travel range, engine power, engine torque, battery charging time, battery capacity) is improving with every new design and model. In addition, the economic factor, i.e., price, is changing. This considerably contributes to the growing interest from potential investors who also pay attention to additional aspects that are already implemented in conventional vehicles, e.g., telematics solutions and applications related to safety of drivers, passengers and cargo.
The assumptions for the model introduced below are one of the results of the cooperation with city logistics stakeholders under the work of the Freight Quality Partnership in Szczecin. The partnership has been established as a major activity of international projects C-LIEGE. The activities have been continued under the next international project GRASS. The FQP in Szczecin was focused on identification of major problems and establishing of the proper actions to improve the functioning of urban freight transport in city. The utilization of electric vehicles was one of the most important potential measures. The meetings with UFT stakeholders helped to establish among others the general expectations regarding implementation of electric vehicles in Szczecin city logistics system.

3. Multi-Criteria Analysis of Available Solutions Regarding Electric Freight Vehicles

3.1. Proposed Conceptual Framework

The advantages and disadvantages enumerated in Section 2.3 with regard to the use of electric vehicles in urban deliveries are not decisive for their possible usability or effectiveness in everyday operation. Despite their undisputable ecological values and strong support with respect to sustainable growth, a separate analysis should be devoted to evaluation of technical performance of individual solutions in view of purchase costs.
The task of constructing a model for evaluating electric freight vehicles, as almost any actual decision-making problem, requires considering many decision alternatives, wherein each alternative should be investigated in view of many criteria. The proposed approach uses the classic MCA decision-making process assumptions. The conceptual framework presented below (see Figure 1) is in accordance with the classical guidelines formulated by Roy [63] or Guitonni [64]. The problem of EFVs evaluation was broken down into four successive steps: Structuring Process, Determining and Modelling Preferences, MCA Aggregation Procedure and, Recommendation.
In the first step (Structuring Process) of the procedure, the sets of criteria as well as the alternatives available for evaluation (here EFVs) are identified. For this purpose, scientific literature has been used as a reliable source of information and expertise. The construction of the hierarchical family of evaluation criteria was based on a detailed analysis of references that problematically and methodologically cover the decision problem studied in this research. Their detailed analysis was carried out in Section 2.2.
The next two steps (Determining and Modelling Preferences, and MCDA Aggregation Procedure), are related not only to the properties of the studied EFVs’ evaluation decision problem, but also to the utilised data aggregation techniques—MCA methods. A detailed analysis of the problem points to the need to analyse two types of data: certain and uncertain. In the above framework, two complementary data aggregation processes were proposed in a single decision support model. It was decided to extract the subset of options (alternatives) containing the full set of crisp data. For the remaining data and the data gaps, their fuzzy versions were developed. To provide a high certainty of the obtained solution, the analysis was performed in two steps. In the first step, the subset of the data with no gaps (crisp data) was analysed with the use of PROMETHEE II method (see Table A1). In the second step, a fuzzy variant of the TOPSIS method was used to evaluate the alternatives represented by fuzzy data (for two input subsets: with data gaps and full data set, respectively). It should be clarified that, while preparing the input data for the second step (fuzzy TOPSIS), it was decided that, for all values of criteria, their fuzzy representations would be developed in a trapezoidal form. It was also decided that the gaps would be filled with trapezoidal fuzzy numbers built based on the extreme domain values for the considered set. Technically, the minimum, maximum, mean and standard deviation values were used during the conversion process. For the remaining crisp values, their fuzzy developments were also prepared.
In both data aggregation scenarios, robustness and sensitivity analyses of the obtained set of decision solutions were performed. The analyses carried out together with their interpretation, as well as the comparison of the rankings obtained in both data aggregation procedures, are the basis for generating the final recommendations. This stage concludes the proposed authors’ approach. In the authors’ opinion, the individual data aggregation procedure, as well as the MCA numeric algorithms used in them (here PROMETHEE II and fuzzy TOPSIS) require a detailed explanation.
As already indicated, in the first of the two data aggregation runs in the model, PROMETHEE II method was used for the crisp data subset. The PROMETHEE methods are one of the best known and most popular outranking approaches used in sustainable energy planning [65]. They have a number of features that are not available in other MCA methods such as the AHP, ELECTRE or TOPSIS [66]. With the PROMETHEE method, the decision makers are assumed not to be fully aware of their preferences of the utility of different criteria. This is in contrast to approaches such as the AHP that assume that decision makers are aware of the utility of different criteria values and are able to express the relative importance of different criteria clearly. In addition, the GAIA plane provides a useful analytical tool for visualizing the decision problem that can be used for identifying conflicts between criteria and alternatives, allowing the most effective criteria to be determined. PROMETHEE II also has several other characteristics that make it suitable for evaluating electric freight vehicles such as providing a complete ranking of alternatives and allowing uncertainties in criteria performance values to be modelled. PROMETHEE also requires less input and little interaction with the decision makers, as well as being more transparent and easy to use and understand. The PROMETHEE II method enables a complete order of the resulting ranking of alternatives to be obtained, while in the case of the earlier version of this method, the resulting ranking was rather partial [67].
The PROMETHEE methods are used in determining a synthetic ranking of options. Depending on the implementation, they operate based on real or pseudo-criteria [68]. The decision-maker may choose from six preference functions applying: simple criterion, quasi-criterion, criterion with preference level, criterion with linear preference, criterion with linear preference and indifference area, and Gaussian criterion [67]. Subsequently, upon determining the compliance coefficients for each pair of options, dominance flows are determined for each of the options [69]:
  • Output dominance flow describing how much option ai outranks the other options:
    ϕ + ( a i ) = j = 1 n π ( a i , b j )
  • Input dominance flow informing how much option ai is dominated by the other options:
    ϕ ( a i ) = j = 1 n π ( b j , a i )
One by one, the decision-maker may establish the complete ranking of options. In the PROMETHEE II method, to establish a complete ranking of options, it is necessary to compute the net dominance flow according to Formula (3) [69]:
ϕ ( a i ) = ϕ + ( a i ) ϕ ( a i )
In this method, equivalence and preference relations are distinguished in a broad sense [67]:
  • option a i outranks option b j ( a i L b j ), when ϕ ( a i ) > ϕ ( b j ) ; and
  • option a i is equivalent to option b j ( a i I b j ), when ϕ ( a i ) = ϕ ( b j ) .
The second run of the data aggregation was realized in the proposed authors’ approach with the use of a fuzzy development of the TOPSIS method. The TOPSIS (Technique for Order Preference by Similarity to an Ideal Solution) method is based on the concept that the most preferable alternative should have the shortest distance from the ideal solution while, at the same time, be as far as possible from the negative-ideal solution [70]. The algorithm of the TOPSIS method is composed of six stages [71]. Initially, the decision maker chooses m alternatives and n criteria for use in the decision problem analysis. A decision matrix is created, where the rows represent alternatives and the columns represent the criteria. The data describing each criterion can be expressed in various units and scales; therefore, in the second step of the procedure, the decision matrix is normalized. In the third step, the normalized values are multiplied by the weight of each criterion, thus creating a weighted normalized decision matrix. In the fourth step, the Positive Ideal Solution (PIS) and the Negative Ideal Solution (NIS) are computed, by choosing respectively the best and the worst values from all alternatives describing each criterion. In the fifth step, Euclidean distances are calculated between the positive and negative ideal solutions and the alternative. Eventually, in the last step, the closeness coefficient CCi is calculated, which expresses the relative closeness of the alternative to the ideal solution. In the fuzzy version of the TOPSIS method, the numerical values are substituted by linguistic assessment. Instead of crisp numbers, trapezoidal fuzzy numbers (TFN) n ˜ = ( n 1 , n 2 , n 3 , n 4 ) are used to express both the attributes of the alternatives, as well as the weights. The TFN’s membership function μ n ˜ ( x ) is calculated as follows [72]:
μ n ˜ ( x ) = { 0 , x < n 1 x n 1 n 2   n 1 , n 1 x n 2 1 ,   n 2 x n 3 x n 4 n 4   n 4 0 , n 3 x n 4 x > n 4
The distance between the TFNs m ˜ = ( m 1 , m 2 , m 3 , m 4 ) and n ˜ = ( n 1 , n 2 , n 3 , n 4 ) can be obtained with the vertex method [73]:
d v ( m ˜ ,   n ˜ ) = 1 4 [ ( m 1 n 1 ) 2 + ( m 2 n 2 ) 2 + ( m 3 n 3 ) 2 + ( m 4 n 4 ) 2 ]
It was also decided that, during the second run of data aggregation (the part containing fuzzy data), the weights of criteria would be expressed by seven linguistic variables: very low, low, medium low, medium, medium high, high, and very high. The TFN representations of the weights are presented in Figure A1. On the other hand, the values of the decision attributes for each alternative and each criterion would be described by a trapezoidal fuzzy number n ˜ = ( n 1 , n 2 , n 3 , n 4 ) , based either on the precise data, if available, or on the aggregated values from all alternatives for each criterion. For the former, n 1 = n 2 = n 3 = n 4 and were equal to the precise value. Therefore, the TFN obtained a form of a singleton. For the latter, n 1 was equal to the minimum value of the aggregated data; n 4 was equal to the maximum value; and n 3 and n 4 were equal, respectively, to the sum and subtraction of the half of the standard deviation value and the mean value.

3.2. Structuring Process

3.2.1. The Set of Evaluation Criteria

MCA is a very popular methodology widely used in solving many real-life decision problems. It is one of the elemental tools allowing to obtain quantitative-based rankings and to generate decision recommendations on their basis, taking into account a multitude of often conflicting criteria. The literature review allows to identify a number of works using various MCA methods in solving the problems of evaluation or choice of electricity-powered vehicles for both logistic and passenger purposes.
For example, Barfod et al. developed a MCA/SWOT-based decision support system for analysing the challenges, opportunities and policy initiatives. The authors verified their approach in electric commercial vehicles market in Denmark [74]. Domingues et al. successfully applied Electre Tri method to the Life-Cycle Assessment of six different powertrains vehicles [75]. Oliveira et al. compared a conventional, hybrid and electric vehicles, addressing the Portuguese market and proposed an MCA-based approach during the evaluation process [76]. Schmale et al. [77] proposed an Integrated MCA-based Assessment Method for Sustainable Transport System Planning in a Middle Sized German City. The authors of [78] analysed Optimal Siting of Charging Stations for Electric Vehicles Based on Fuzzy Delphi and Hybrid Multi-Criteria Decision Making Approaches (fuzzy Grey relation analysis and fuzzy VIKOR methods) from an Extended Sustainability Perspective. Ki et al. used AHP method in the problem of Spatial evaluation of Carsharing Stations [79]. MA et al. built a Multi-Objective Optimization Model Considering Battery Degradation for a Multi-Mode Power-Split Electric Vehicle [80]. Cai et al. proposed hybrid MCA with life-cycle analysis framework to identify and evaluate sustainable strategies of taxi fleet in Beijing in terms of economic, policy, and environmental implications [81]. In the study by Pérez et al. [82], a broad state of the art analysis was performed on MCA approach in choice and evaluation of urban passenger problems.
As a result of a profound literature study, the authors chose nine evaluation criteria grouped into four clusters. Table 2 presents the selected criteria along with the abbreviations that were used in the following sections and references to other works justifying their choice. The criteria pertained to the vehicle performance in its broad sense: motor, batteries, and price. The structure of the criteria broken down into groups is presented in Figure A2.

3.2.2. The Set of EFVs Options

The market of vehicles is very diverse. One can enumerate the production of passenger cars, off-road vehicles, trucks, buses or special vehicles. These, in turn, can be broken down into the ones fuelled by internal combustion, electric and hybrid engines. The differentiation of vehicles is very large and is strongly associated to their intended purpose. For this reason, the authors focused on a single group of vehicles. The choice of the selected group of evaluated vehicles was determined by the purpose of the goods’ transport for urban logistics, i.e., vehicles with the ability to navigate inside cities and city centres. The determination of such group of vehicles allowed the selection of models with similar technical parameters which resulted in their description with the criteria presented in Figure A2. Based on the above facts, this study considered 36 decision options evaluated from the perspective of nine criteria.
Unfortunately, with regard to many of the considered options, it was not possible to obtain all information on the criteria (car manufacturers do not publish all data, making the selection process more difficult), therefore, there were numerous data gaps and consequently the decision problem was considered under uncertainty. The structure of the decision problem is presented in Table 3.
The evaluated vehicles were selected at the time of writing the article. Concept vehicles have been omitted from the list. Currently marketed or ready for sale vehicles have been chosen.

3.3. Detremining and Modeling Preferences, MCA Aggregation Procedure

3.3.1. Analyses of Crisp Data with the Use of PROMETHEE II Method

Initially, the set of preferences was identified and modelled. The weights of individual criteria were defined along with their preference direction, preference functions and thresholds values. In this study, equal criteria weights were assumed so that none of them had a greater impact on the decision problem solution. For criteria such as “profit”, the preference direction was “maximum”, whereas in the case of “cost”—“minimum”. The applied preference function was V-shape, so even small differences between the criteria efficiencies of options affected the determination of outranking relation between them. Concurrently, application of the p preference threshold made it possible to change the outranking value fluently. The p threshold was established as the two-fold value of the standard deviation for the option efficiency in relation to a given criterion. The full preference model is presented in Table 4.
In the first step of the analysis, a subset of ten alternatives, which contained no gaps in data, was extracted for evaluation from the original set, to assure high certainty of the obtained ranking. The new set was comprised of the alternatives A6, A7, A8, A9, A15, A16, A17, A23, A27 and A28. The solution obtained for this set of alternatives is presented in Table 5.
The data collected for this research did not consider how the battery capacity changes as its operating conditions, such as temperature, charging or discharging current or state of charge, as well as its service time vary [88,89,90]. Therefore, in the subsequent step of the analysis, three additional rankings were generated with the battery capacity reduced by 10%, 20% and 30% for all the considered alternatives to verify how such change would affect the final ranking. It should be noted that, in these cases, the p preference remained unchanged. The obtained rankings, along with the Phi net outranking values are presented in Table 6.
The sequence of options in the presented rankings correspond to the orders of options in the ranking with the original value of the battery capacity criterion. Only minor changes of the Phi net values are observed between the rankings. Thus, it can be assumed that the changes in the battery capacity caused by its operating conditions changes have a minor effect on the final solution of the decision problem.
In the third step of the analysis, the “Battery charging time 80%” criterion was excluded from the set of criteria. The obtained ranking is presented in Table 7. The comparison of the ranking with the one produced in the first step of the analysis is depicted in Figure 2.
The analysis of Figure 2 allows observing a considerable difference between both rankings. Only four of the ten studied alternatives remain on unchanged positions—A27 as the leading option, A23 on Position 6 and A16 and A28 as the worst alternatives. There was a swap of positions between the alternatives A15 and A17. A considerable change of ranks can be observed on Positions 2–5 among the alternatives A6, A7, A8 and A9. The aforementioned differences between rankings show that the “battery charging time 80%” criterion has a considerable impact on the final rankings.
Another step was the GAIA analysis (Geometrical Analysis for Interactive Assistance). The GAIA diagrams provide a graphical representation of the decision problem, which allows visually evaluating how good each alternative is, which criteria support each alternative, and in which areas the alternatives could be improved. The information regarding k criteria and their influence on the alternatives’ evaluation in the GAIA methodology, originally represented in k dimensions, undergoes a projection on the GAIA plane, as a result of which, part of the information is lost. The criteria are represented on the GAIA diagram by vectors, and the alternatives by points. The longer a criterion’s axis, the more discriminating it is. Criteria expressing similar preferences are oriented in a similar direction, whereas opposite vectors’ directions represent conflicting criteria. Orthogonal axes of the criteria symbolize criteria not related to each other in terms of preference.
Figure 3a shows the GAIA analysis of the studied decision problem, broken down into the individual criteria. As a result of projecting the decision problem solution onto the GAIA plane, the quality of 89.2% was obtained, therefore the interdependencies between the criteria and between the alternatives are depicted very reliably.
As a result of the GAIA analysis, it can be recognized that the Battery Capacity criterion is in conflict with the Battery Charging Time criteria. This means that the greater the Battery Capacity, the longer its charging time. On the contrary, the pairs of Carrying Capacity and Battery Capacity, as well as Engine torque and Engine power express similar preferences, i.e., the value of Engine Torque increases along with the Engine Power value and the Carrying Capacity grows together with the Battery Capacity. The Travel Range criterion is unrelated to the Battery Capacity and Carrying Capacity in terms of preferences. The leading alternatives A29, A9 and A8 are most supported by the Max Velocity and Travel Range criteria. On the other hand, the alternatives A15–A17 are supported by the Price and Battery Charging Time criteria. The alternatives A6 and A7 are supported by the Battery Capacity and Carrying Capacity criteria. An analogous analysis was carried out for criteria groups (Figure 3b).
In this case, as a result of projecting the solution onto the plane, only 5% of the information was lost. This analysis indicates that the Price criteria group is in slight conflict with the Engine group. On the other hand, the Engine group is not related to the Battery group, as well as the Performance group values grow independently from the Price group in terms of preference. The Engine group supports the alternatives A6 and A7, whereas the Price group has a positive effect on the ranking position of options A8, A15–A17 and A23.
Apart from the GAIA analysis, the sensitivity analysis of the rankings was performed. When the problem is observed from various perspectives (overall performance, engine, battery life, and economical aspects), the relevance of the different sets of criteria can be seen as different, therefore, the weights of the clusters of criteria were examined in this analysis. The results of the analysis are presented in Table 8 and Figure 4. It can be observed that the ranges of stability of the Performance and Battery clusters are much wider than the ranges of stability of the Engine and Price clusters. If the criteria from the Performance cluster were assigned much more important weight (over 65.73%), the A27 alternative would yield to A9, which would become the leading alternative. Furthermore, if the weight of the Engine cluster was above 43.09%, the A6 alternative would become the leading one. On the other hand, if the Engine cluster was considered less important and its weight would drop below 5.46%, the alternative A8 would be positioned on the top of the ranking.
The sensitivity analyses for distinct criteria are presented in Figure A3. It can be observed that, for the Battery Charging Time 100% (Bat6) criterion, the ranking remains stable only if the weight assigned to this criterion is in the range of 0–25.31%. On the other hand, for the Battery Charging Time 80% (Bat7), the alternative A27 remains the leading one regardless of the weight assigned to this criterion.

3.3.2. Analyses of Fuzzy Data with the Use of Fuzzy TOPSIS Method

Fuzzy TOPSIS Analysis of the Data Gaps Options Subset

The PROMETHEE II analysis of the data without uncertainty was followed by the analysis of the alternatives which had some gaps in the data. The analysed subset is presented in Table A2. The analysis was performed with the usage of a fuzzy variant of the TOPSIS method. The values of all criteria were represented by trapezoidal fuzzy numbers n ˜ = ( n 1 , n 2 , n 3 , n 4 ) . The gaps in the data were filled with trapezoidal fuzzy numbers built based on the minimum, maximum, mean and standard deviation values of all known values for each criterion. The values that were given were translated into trapezoidal fuzzy numbers where all the points had the same value, i.e., they were represented by singletons. All criteria were assigned a medium trapezoidal fuzzy number as their weight. A fragment of the obtained decision matrix is presented in Table A3. The ranking produced by the TOPSIS method, along with the CCi closeness coefficient values is presented in Table 9 and on the chart on Figure 5.
The analysis of the obtained ranking allows observing that the best alternatives, A25, A2 and A20, are approximately two-fold better than the worst alternative, A24. Some groups of alternatives with very similar values of CCi can be observed, i.e., A32 and A12, A26 and A21, and A31 and A33 in the middle of the ranking, as well as A19 and A4, and A35 and A10. The similarities of the CCi value in these pairs of alternatives mean that they can be used interchangeably.
A sensitivity analysis of the ranking was performed by changing the weight of a single criterion between very low and very high, while all the remaining criteria had the medium weight assigned. The results of the sensitivity analysis are charted on Figure 6 and Figure A4. It can be observed that, in the case of modification of the Per3, Eng4, Eng5, Bat7 and Bat8 criteria’s weights, the alternative A25 remains unchangeably in the lead position, and alternative A2 receives the second best rank. If criterion Per1 would have a slightly lower weight, i.e., medium low instead of medium, alternative A2 would be better. However, if the weight of this criterion were reduced to very low, A20 would advance to the first position. Similarly, if the weight of Per2 was high or greater, the A20 alternative would outrun the alternative A25. It should be noted, that if medium high to very high weight is assigned to the Pr9 criterion, a significant of the A2 alternative can be observed, from Rank 5 to Rank 1. Other significant rank changes include A13’s increase from Rank 9 to Rank 2 with the growth of Per1 criterion, A19’s drop from Rank 9 to Rank 19 with Per2 growth, A22’s advance from Rank 12 to Rank 4 with Per3 growth or A36’s drop from Rank 3 to Rank 13 when Eng4 grows. The rankings remain most stable for criteria Eng5 and Bat7, where, respectively, the first six and four positions remain unchanged.

Fuzzy TOPSIS Analysis of the Complete Options Set

In the third step of the analysis, fuzzy TOPSIS method was used to perform the analysis of the complete alternatives set. Again, the existing data were converted to singletons, and the data gaps were replaced with trapezoidal fuzzy numbers generated on the basis of the minimum, maximum, mean and standard deviation values of all known values for each criterion. A fragment of the decision matrix for solving the decision problem between all 36 alternatives is presented in Table A4. The solution ranking is presented in Table 9 and Figure 7.
From the analysis of the ranks and CCi values to which all alternatives were evaluated, it can be observed that the leading alternative A6 has a significant dominance over the second-to-best alternative A2. In addition, the first seven alternatives are at least three times more preferred than the worst alternative A16. The alternatives on Positions 4 and 5, as well as those on Positions 12–15 and 24–26 obtained very close CCi values, which means the difference between them in terms of preference is very minute.
Subsequently, the various weights possibly assigned to each of the criteria were analysed in a sensitivity analysis (see Figure 8 and Figure A5). The alternative A6 remains the leading one in regard to all criteria but Per2, Bat6 and Pr9. The changes of the weight assigned to Bat7 criterion appear to have the least influence on the position of the top alternatives in the ranking. If the weight of the Pr9 criterion grows from very low to very high, the alternative A2 advances from the Rank 8 to Rank 1. Other considerable changes of positions can be observed for A5 when the Eng5 criterion weight is changed (growth from Rank 27 to Rank 14), A7 when the Bat6 criterion changes from very low to very high (increase from Position 20 to 4) and A27 when the Bat7 criterion changes (change from Rank 21 to Rank 6). It should be noted, that though the alternative A7 undergoes a significant jump of 16 slots on the sensitivity analysis of the rankings for criterion Bat6, it changes only by two slots in the analysis of the Bat7 criterion. Similarly, although the alternative A27 rank changes by 15 steps for Bat7 stability analysis, in the case of Bat6 analysis it changes only by two slots. Therefore, although the criteria Bat6 and Bat7 express similar property of the analysed vehicles, their influence on the final rankings of preference differs.

3.3.3. Comparison of the Obtained Solutions

The analysis process was concluded by performing a comparison of the obtained solutions. All alternatives were once again divided into two categories: those which had complete data and those which had some gaps in the data. For the alternatives from the former group, the ranking from Section 3.3.1 was compared with the ranks of selected alternatives from Section 3.3.2. For the alternatives from the latter group, the ranking from the first subsection of Section 3.3.2 was compared to the ranks of selected alternatives from the second subsection of Section 3.3.2. Because the latter ranking contained all alternatives, two subsets of the results needed to be extracted in order to perform the comparisons. Table 10 demonstrates the alternatives and ranks used in each comparison.
The Pearson correlation coefficient for the rankings from the first group is equal to 0.5879, which implies some correlation between the rankings. This can be visually verified on the chart in Figure 9a. The horizontal axis of the chart represents the ranks obtained in the PROMETHEE II ranking. The vertical axis represents the ranks of the same alternatives, extracted from the fuzzy TOPSIS ranking containing all alternatives, regardless of the data completion. The closer to the line on the chart each alternative is, the more similarly it was evaluated in both rankings. In this case, only alternative A17 has the unchanged eighth position. However, although their exact position in the rankings differs, alternatives A6, A7, A8 and A27 remain the leaders of the both rankings. The differences in position are caused by the fact that different method was used to aggregate information in both rankings.
In the case of the alternatives where complete data were not available, the Pearson correlation coefficient is equal to 0.9876, which implies that the relationship between both rankings is almost linear. This can be visually confirmed on the chart in Figure 9b.
The analysis of Figure 9b allows observing that almost 30% of the alternatives have an unchanged position and that most of the alternatives are either directly on, or very close to the line. Some of the alternatives, such as A2 and A25, A13 and A20 or A26 and A36, have just swapped their very close positions. This is because the CCi values for the alternatives from each pair were very close, regardless of the ranking analysed. Alternatives A2, A13, A20 and A25 are the leading ones, and alternatives A3, A14, A24 and A34 are the worst ones in both rankings.
The results presented above clearly demonstrate that the combination of the certain and uncertain data in the integrated multistep decision approach provides a way to facilitate the decision problem solution process by expanding the set of alternatives with options where the comprehensive set of data is not always available.

4. Conclusions

This paper has presented a unique MCA-based approach to the evaluation of electric freight vehicles for use in urban areas. The key factor determining the increase in the number of alternative drive vehicles is adapting the infrastructure to meet their specific needs. This relates in particular to electric vehicles for which it is necessary to develop battery charging systems. Due to the discussed impediments, for alternative drive vehicles to be used in urban deliveries, it is first necessary to take specific actions and implement adjustment processes. However, on the other hand, benefits embodied by a reduction of negative impacts on urban environment make alternative drive vehicles increasingly attractive, all the more that their operational parameters make it already possible to use them effectively.
Undoubtedly, implementation of electric vehicles is the most problematic. For urban freight transport to use electric vehicles and function properly, it is necessary to provide integrated networks of charging terminals in cities, so that all places with limited access to power supply sources are eliminated. The report by Frost and Sullivan, entitled “The strategic analysis of EV charging stations infrastructure in Europe”, says that there has recently been a significant progress in that regard, and, in accordance with the forecasts, the number of public chargers provided on the initiative of the governments will exceed two million by 2017, while seven West European countries will spend ca. EUR 700 million over the next seven years [47]. The aforementioned report additionally emphasizes the possibilities of developing inductive systems of vehicle battery charging, which may play a key role for freight transport, providing possibilities of rapid charging during short stops connected with deliveries. Therefore, it seems that, as a result of the requirements of the European Union regarding sustainable transport development and the worldwide trends connected with popularization of alternative sources of energy, in the near future the dynamics of urban logistics development based on using alternatively powered vehicles, in particular using electric motors, will be growing and playing an increasingly more important role.
The results introduced in the paper are the first part of the work, realized in Poland. The second stage will focus on utilization of the model in the real business environment. However, nowadays the major obstacle for that is the very low level of development of electric vehicles in Poland, especially taking to the account the UFT systems. Nevertheless, a distinct and steady growth can be observed in the number of electric vehicles and plug-in hybrids being sold in Poland. Most car manufacturers offer electric or hybrid vehicles. The current state of e-mobility in Poland resembles the one observed in Europe 5–6 years ago. Therefore, it is expected that, in the years to come, if sufficiently favourable conditions exist, the electric vehicles sales market in Poland will improve significantly. Moreover, Szczecin Municipality is strongly focused on development of electro-mobility at the city area. Due to that, the model will be introduced under present and future projects and activities realized or supported by the Municipality.
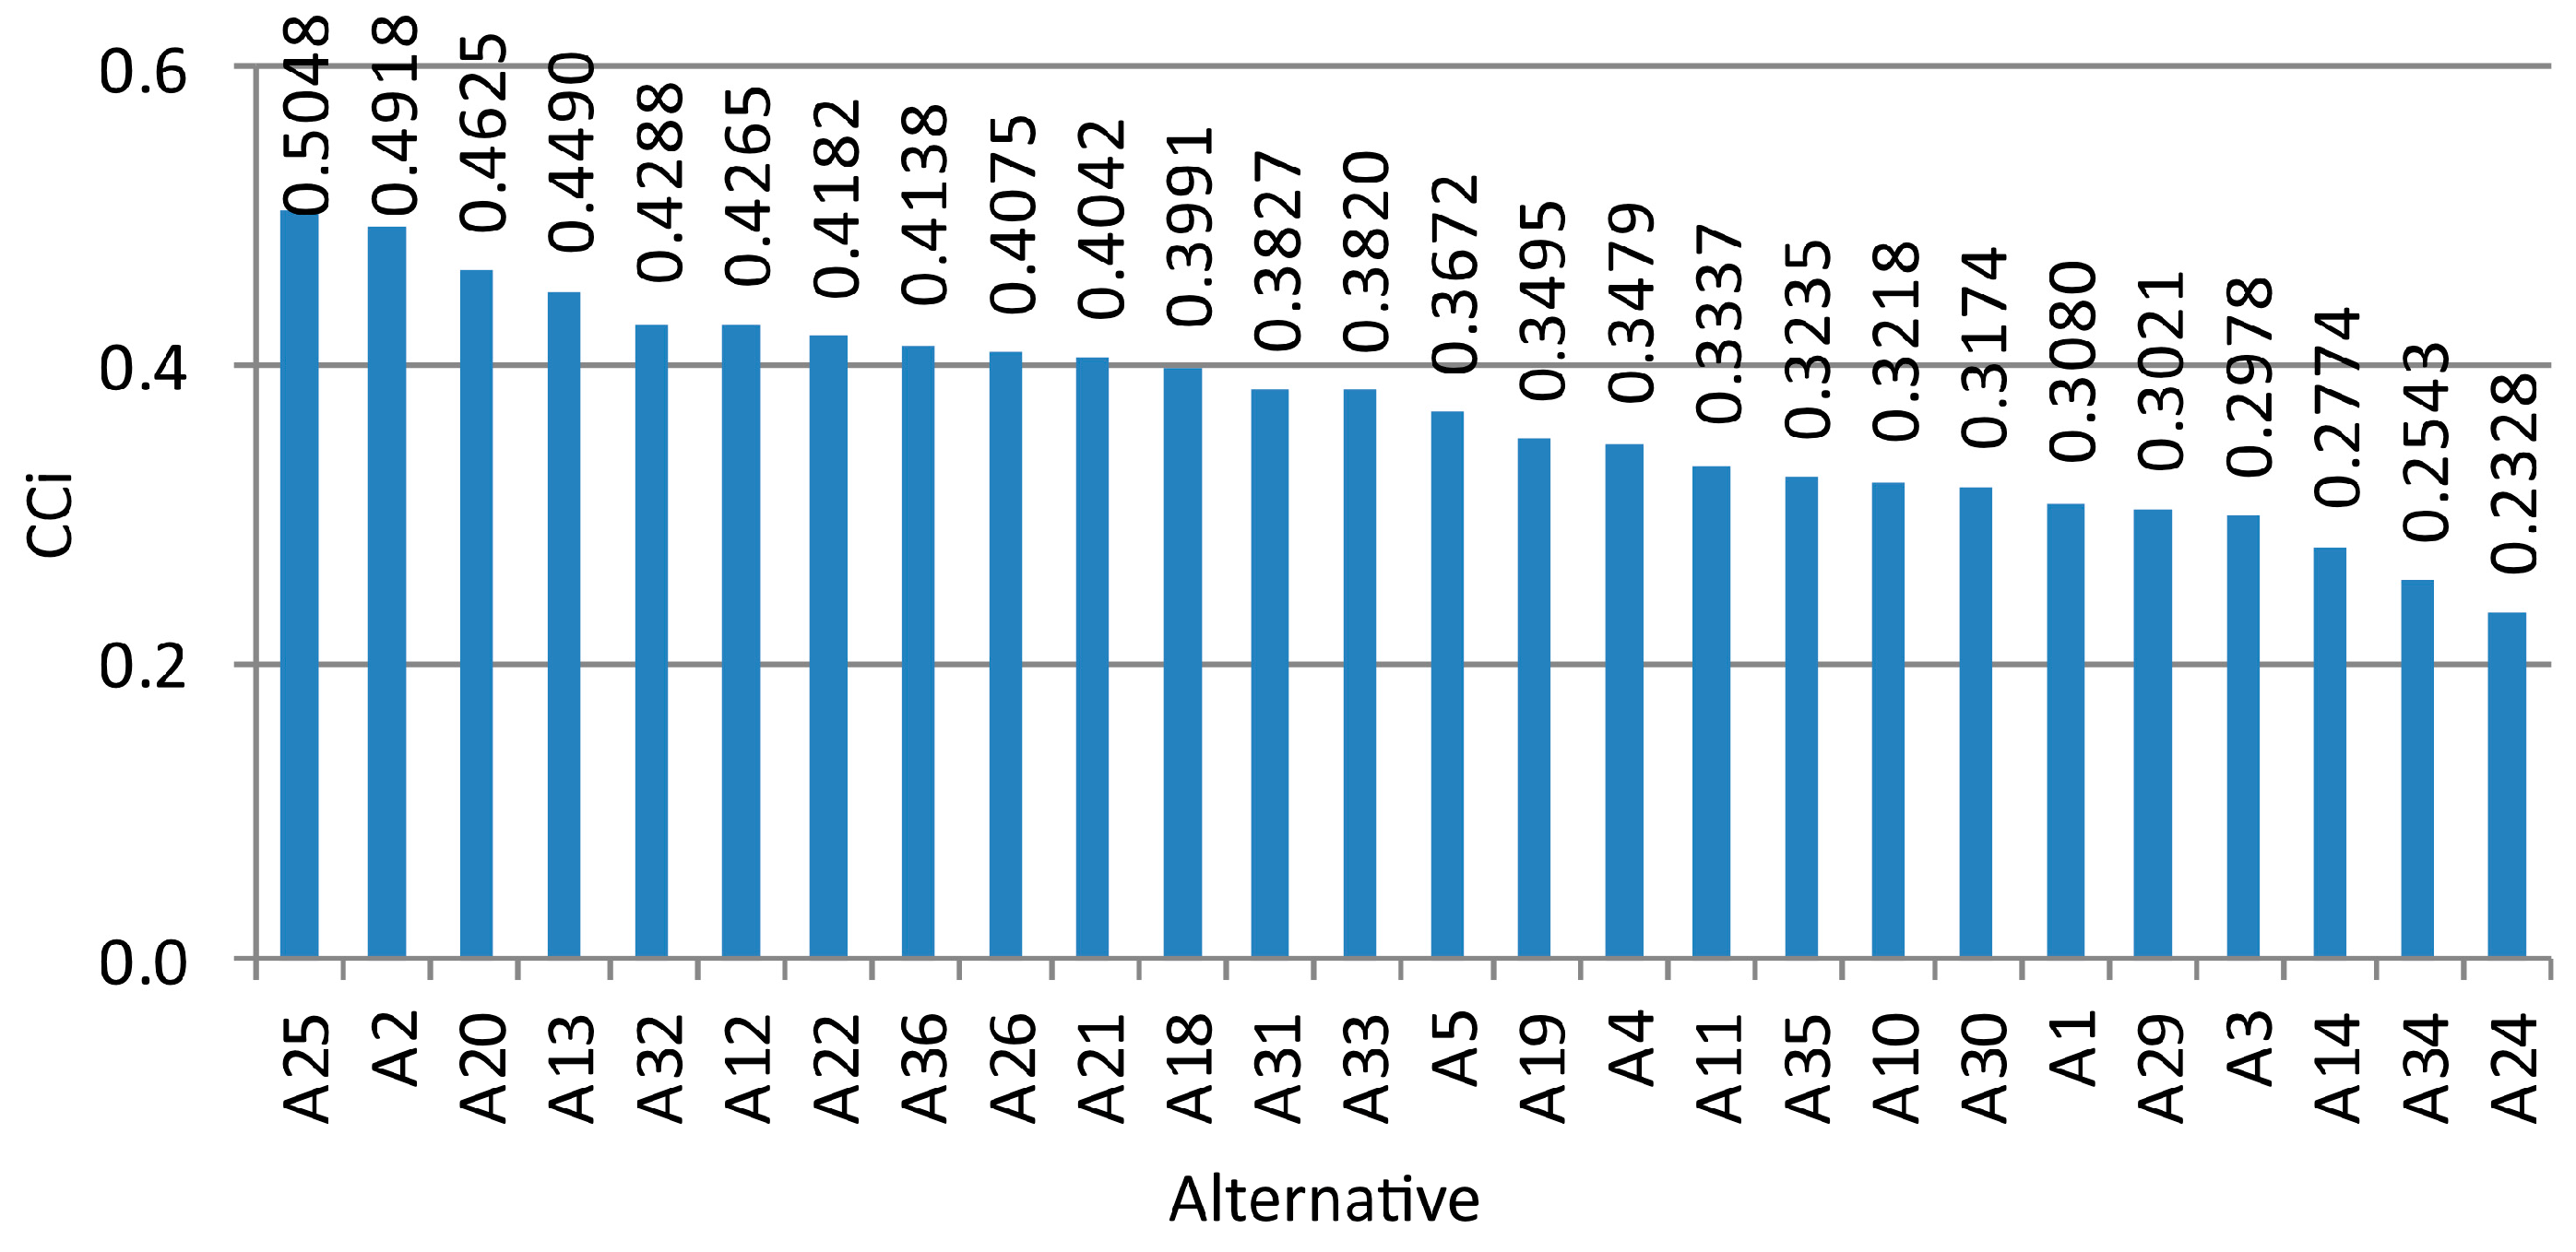
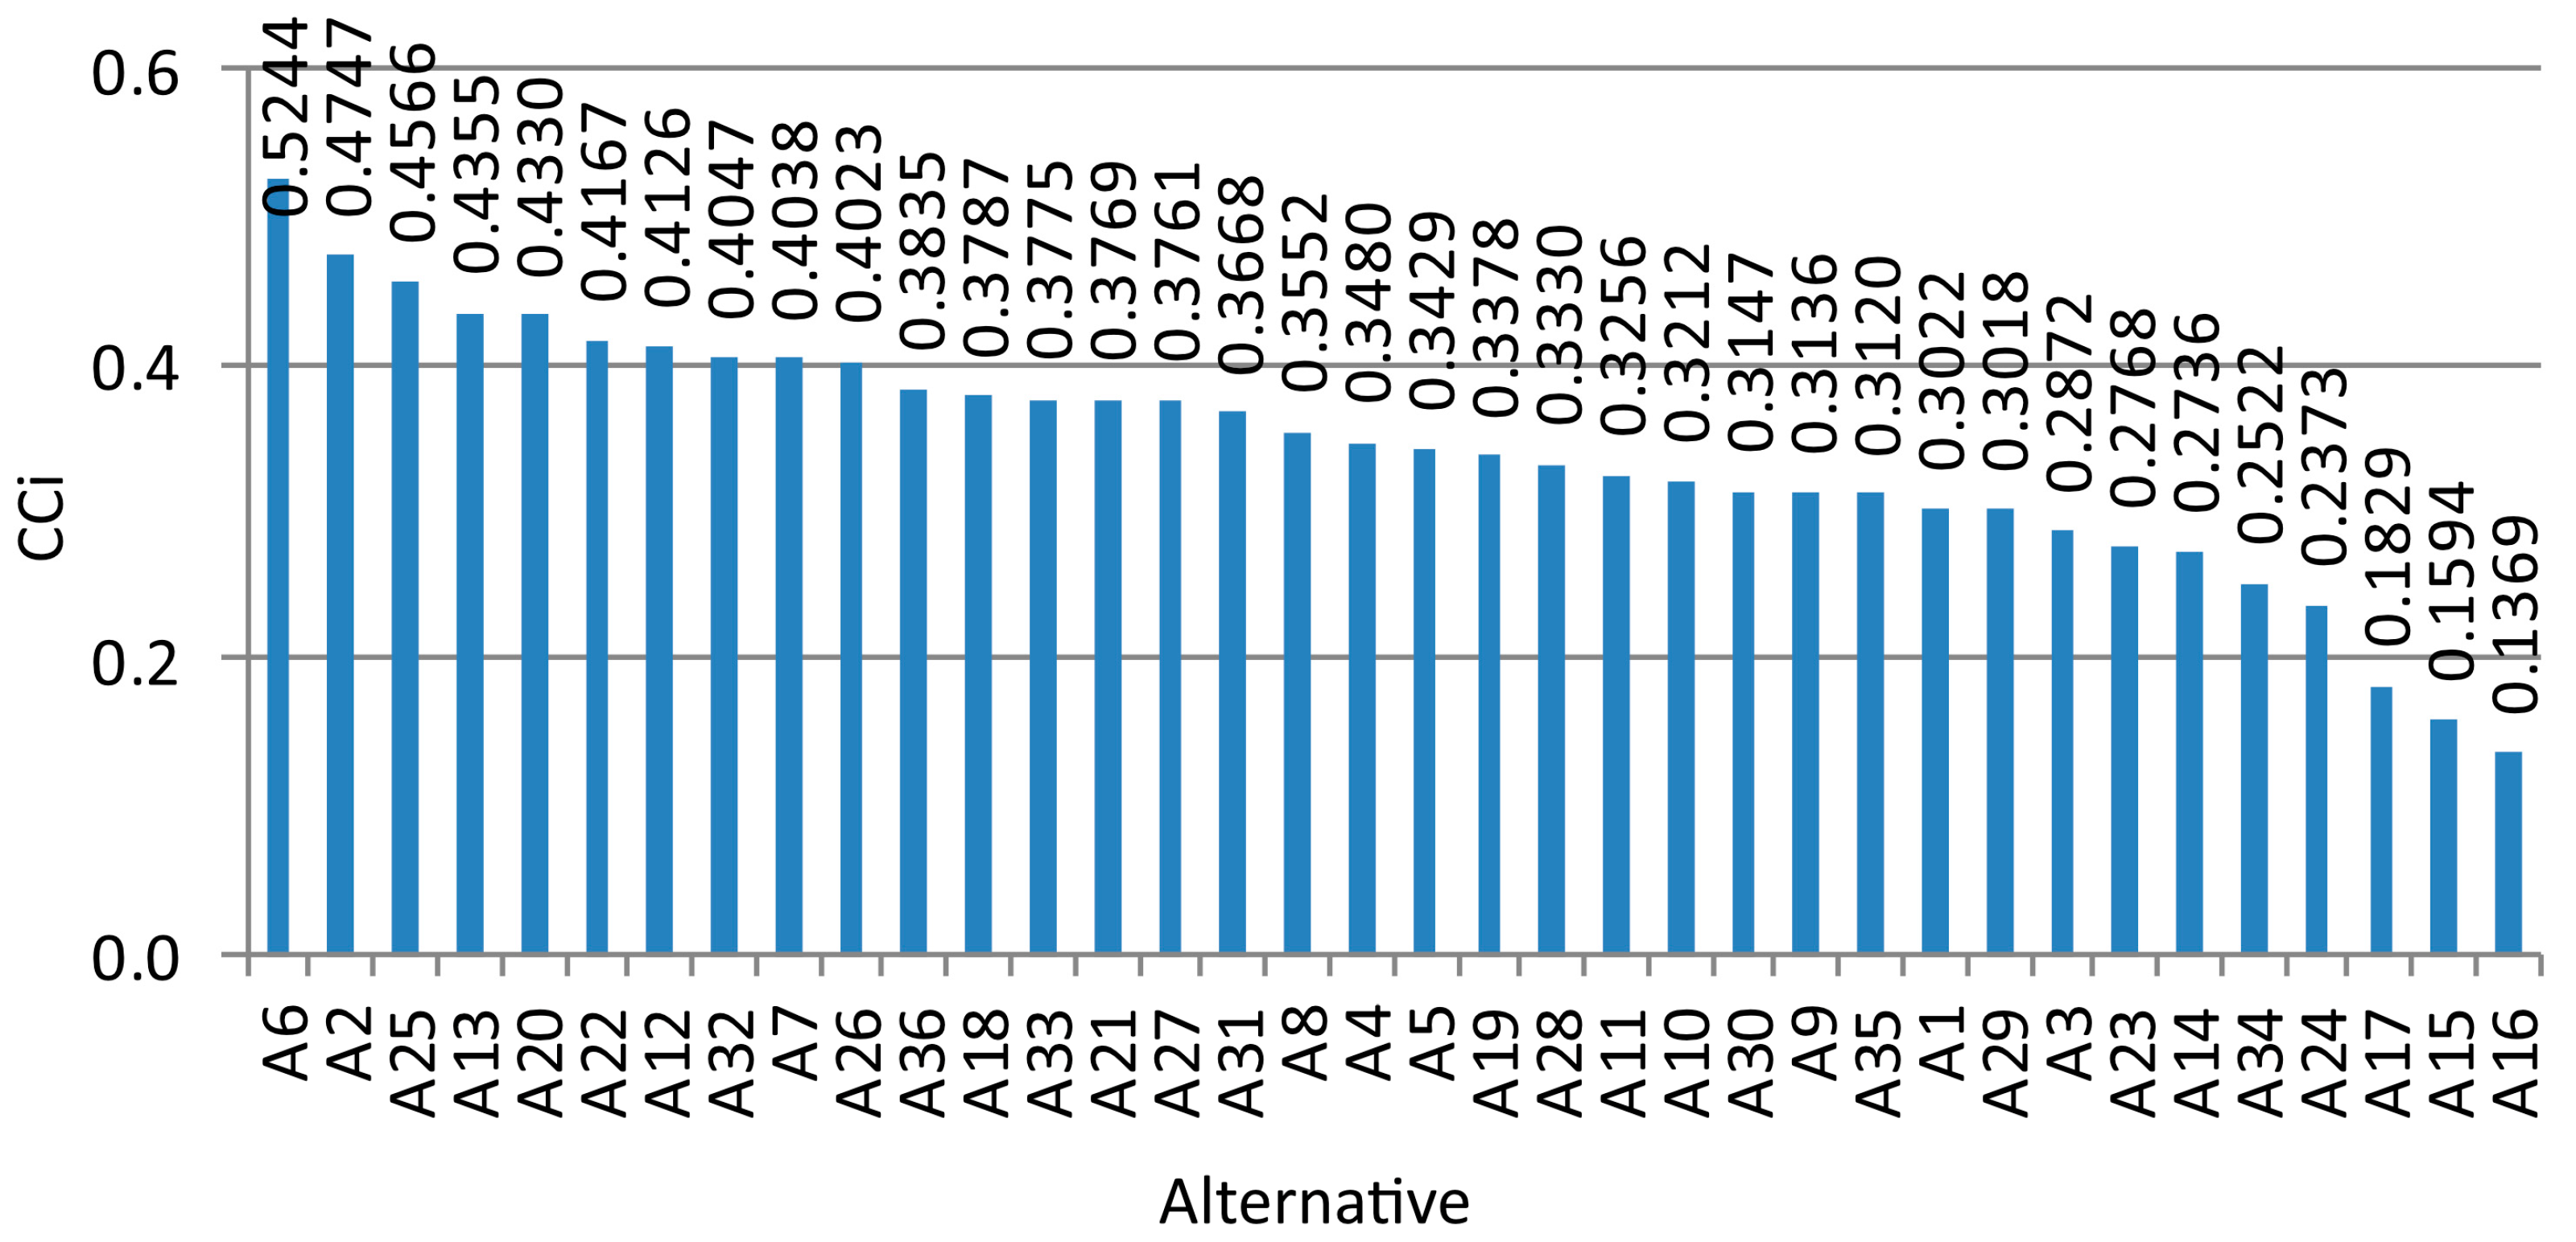
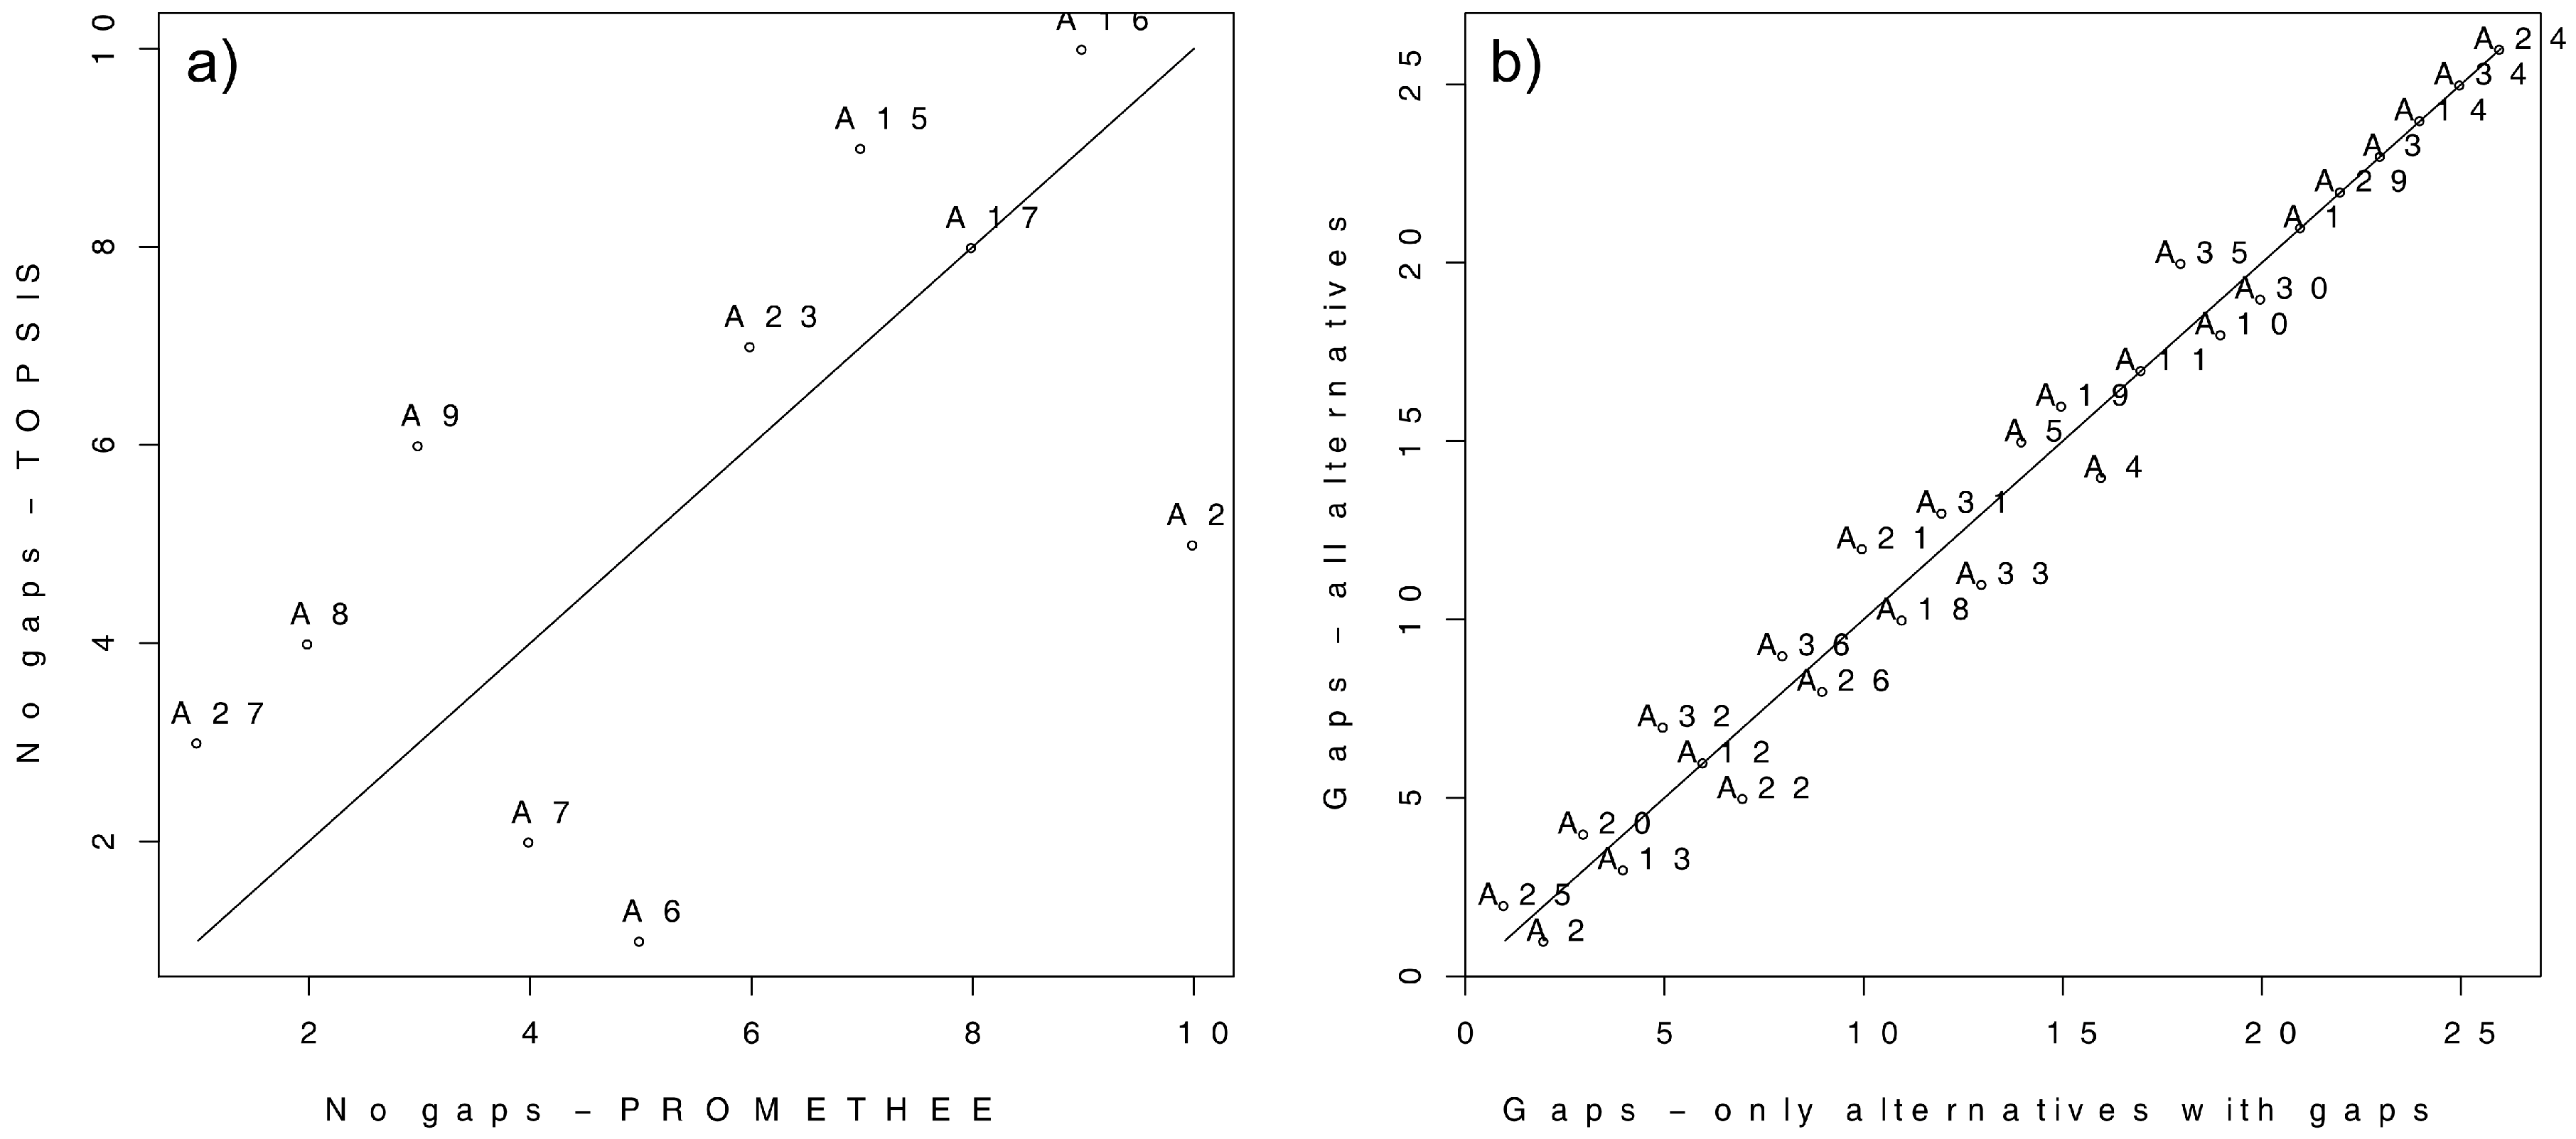
The authors’ contribution in this paper was to present a framework to solve MCA problems based on a set of alternatives with both certain and uncertain data, by creating an integrated multistep model reflecting decision maker’s preferences. In practical terms, an evaluation of 36 carefully selected Electric Freight Vehicles (EFVs) was performed based on nine indicators. From the set of alternatives, a complete set of measurements data was available only for 10 alternatives. For the remaining set of alternatives, the methods of fuzzy set theory were used to provide uncertain values for the data gaps. A comparative analytical study of the results from rankings based on certain data, uncertain data and mixed data was performed. A verification of correlation between the solutions obtained with the usage of certain and uncertain data was performed.
The presented above methodological contribution included the following highlights:
  • We propose a unique approach that aggregates certain and uncertain data in an integrated multistep model.
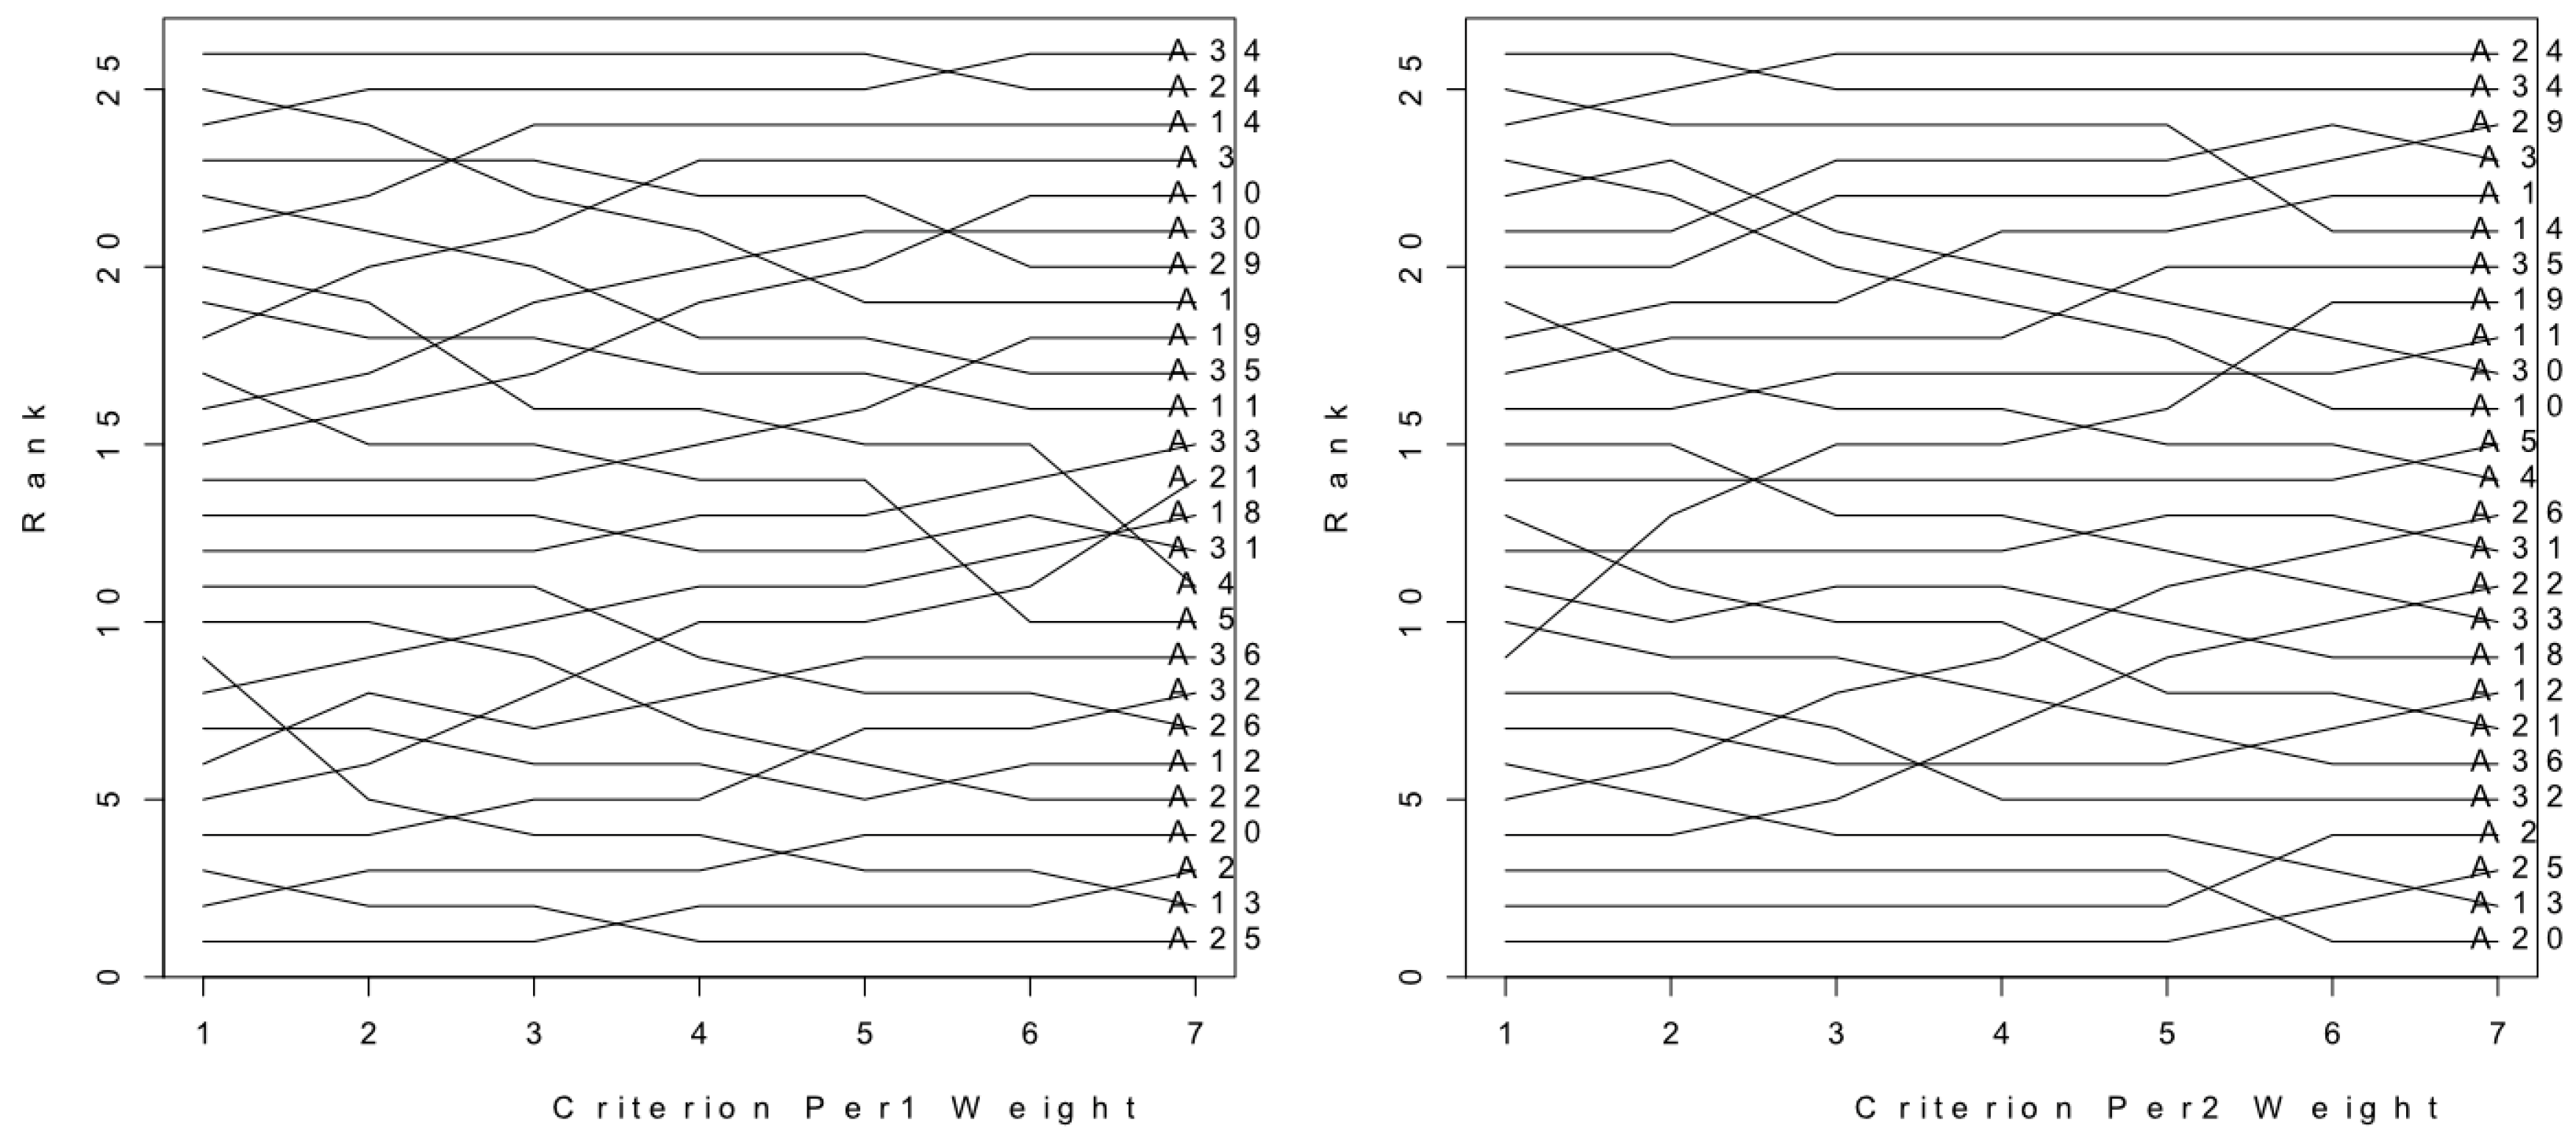
  • Following the multi-criteria approach, we incorporate the robustness and sensitivity analyses to the evaluation model in order to achieve an improvement of the practical application of the presented approach.
  • We perform a verification of successful usage of MCA-based methods in the problem of EFVs evaluation.
During the research, some possible areas of improvements of proposed approach and future work directions were identified. The presented model used catalogue information for the battery charging time. However, in “real life” situations, the actual battery charging time can vary as the operating conditions (temperature, charging or discharging current, state of charge, etc.) change, therefore it is important to address this problem in future research. One of the possible approaches of solving this problem would be to use the battery models of each car’s battery as a parameter of the MCA model. Moreover, the study was oriented on freight vehicles, while the model could be extended to accommodate research on passenger electric vehicles. Additionally, the utilization of the TOPSIS method provides the researchers with a model of a positive ideal solution. This could be used to form a set of guidelines for creating urban EFVs. Finally, the MCA methods used to create the proposed framework are vulnerable to the rank reversal phenomenon. It would be beneficial to construct a similar model based on methods that are free of this phenomenon, such as the COMET method [91]. This is important because the rank reversal problem remains an essential challenge in MCA [92], and even more important in the considered problem, where it should be assumed that, along with the lapse of time, the order of the alternatives would vary because of the changes in the evaluated alternatives’ set (commercially available EFVs).

Author Contributions

J.W. and K.M. wrote the paper; J.W. prepared and performed the MCA analysis; K.M. prepared theoretical literature review; K.K. and S.I. analysed EU projects; A.K. partially performed data processing; and R.T. reviewed and complemented the paper.

Conflicts of Interest

The authors declare no conflicts of interest.

Appendix A

Figure A1. Trapezoidal Fuzzy Number (TFN) representation of the linguistic weights of the criteria.
Sustainability 09 01453 g010
Figure A2. The structure of criteria broken down into groups.
Sustainability 09 01453 g011
Figure A3. Sensitivity analysis. Ranges of stability for the criteria: (a) Carrying Capacity; (b) Max Velocity; (c) Travel Range; (d) Engine Power; (e) Engine Torque; (f) Battery Charging Time 100%; (g) Battery Charging Time 80%; (h) Battery Capacity; and (i) Price.
Sustainability 09 01453 g012
Table A1. Table of criteria efficiencies for options with no data gaps.
CodeNameManufacturerCriteria
PerformanceEngineBatteryPrice
Carrying CapacityMax VelocityTravel RangeEngine PowerEngine TorqueBattery Charging Time 100%Battery Charging Time 80%Battery CapacityPrice
[kg][km/h][km][kW][Nm][h][min][kWh][thous. USD]
A6EVI MDElectric Vehicles International30009614520061010.012099.0120.0
A7EVI Walk-In VanElectric Vehicles International/Freightliner Custom Chassis Corp.200010014520061010.012099.090.0
A8e-NV200+Nissan705120170802704.03024.025.0
A9e-Wolf Omega 0.7e-Wolf6131401801404008.04024.250.0
A15Minicab-MiEV TruckMitsubishi Motors Corp.350100110301964.51510.512.9
A16Mitsubishi Minicab-MiEV (10.5 kWh)Mitsubishi Motors Corp.350100100301964.51510.515.5
A17Mitsubishi Minicab-MiEV (16kWh)Mitsubishi Motors Corp.350100150301967.03516.018.7
A23Partner Panel VanPeugeot635110170492008.03522.531.5
A27Phoenix Motorcars SUVPhoenix Motorcars3401501601105006.01035.045.0
A28Piaggio Porter electric-powerPiaggio Porter7505711010808.012035.024.4
Table A2. Table of criteria efficiencies for options with data gaps.
CodeNameManufac-TurerCriteria
PerformanceEngineBatteryPrice
Carrying CapacityMax VelocityTravel RangeEngine PowerEngine TorqueBattery Charging Time 100%Battery Charging Time 80%Battery CapacityPrice
[kg][km/h][km][kW][Nm][h][min][kWh][thous. USD]
A1Berlingo ElectricCitroën695110170492007.53022.5-
A5Electric Delivery Van 1000Spijkstaal Electro B.V.8304011814988.01202.7-
A21Nissan e-NT400 ConceptNissan Motor Co.183090140803209.06050.0-
A34Toyota EV TruckToyota Motor corp./Hino Motors100060100702808.04528.0-
A32SEV Edison (Chassis Cab)Smith Electric Vehicles25008015090-7.018040.081.0
A33SEV NewtonSmith Electric Vehicles US Corporation3200801601346507.0-120.0117.9
A11Kangoo Maxi Z.E.Renault650130170442268.0-22.022.0
A20Navistar eStarNavistar Int. Corp./Modec200080160703008.0-80.0150.0
A2Boulder Delivery TruckBoulder Electric Vehicle270010416080-8.0-80.0100.0
A4EcomileL’Moving9358012028-8.0-14.451.5
A10Jolly 2000L’Moving18208011040-6.0-38.474.0
A24Peugeot eBipperAllied Electric35010010030-3.0-20.060.0
A25Peugeot eBoxerAllied Electric80010015560-10.5-56.085.5
A26Peugeot eExpertAllied Electric66010515560-8.5-43.075.0
A13Mercedes Vito E-CellMercedes90089130602806.0-36.0-
A14Mercedes-Benz Sprinter E-CELLMercedes1200801351002202.0-35.2-
A19MT-EV WIVFreightliner Custom Chassis Corp./Morgan Olson20001041601206507.0-55.5-
A30Renault Maxity ElectricRenault Trucks/PVI189570100472708.0-42.0-
A35Transit Connect BEVFord/Smith Electric Vehicles700121129502357.0-21.0-
A3Boulder DV-500Boulder Electric Vehicle14001201601009008.0--70.0
A18ModecModec200080160703008.0--32.3
A29Ranger EVFord52011010045-8.0-30.0-
A36ZeroTruckElectrorides28009016010055012.0---
A31SmileL’Moving365451109----21.0
A22Opel Vivaro e-conceptOpel750110400--8.0---
A12MegaVanMega60060150--6.0--14.1
Table A3. Fragment of the decision matrix based on the alternatives with gaps in data.
Per1Per2Per3Eng4Eng5
A1(695, 695, 695, 695)(110, 110, 110, 110)(170, 170, 170, 170)(49, 49, 49, 49)(200, 200, 200, 200)
A2(2700, 2700, 2700, 2700)(104, 104, 104, 104)(160, 160, 160, 160)(80, 80, 80, 80)(80, 249,02, 449,94, 900)
A3(1400, 1400, 1400, 1400)(120, 120, 120, 120)(160, 160, 160, 160)(100, 100, 100, 100)(900, 900, 900, 900)
A4(935, 935, 935, 935)(80, 80, 80, 80)(120, 120, 120, 120)(28, 28, 28, 28)(80, 249,02, 449,94, 900)
A5(830, 830, 830, 830)(40, 40, 40, 40)(118, 118, 118, 118)(14, 14, 14, 14)(98, 98, 98, 98)
A10(1820, 1820, 1820, 1820)(80, 80, 80, 80)(110, 110, 110, 110)(40, 40, 40, 40)(80, 249,02, 449,94, 900)
A11(650, 650, 650, 650)(130, 130, 130, 130)(170, 170, 170, 170)(44, 44, 44, 44)(226, 226, 226, 226)
A12(600, 600, 600, 600)(60, 60, 60, 60)(150, 150, 150, 150)(9, 48,25, 94,63, 200)(80, 249,02, 449,94, 900)
A13(900, 900, 900, 900)(89, 89, 89, 89)(130, 130, 130, 130)(60, 60, 60, 60)(280, 280, 280, 280)
A14(1200, 1200, 1200, 1200)(80, 80, 80, 80)(135, 135, 135, 135)(100, 100, 100, 100)(220, 220, 220, 220)
A18(2000, 2000, 2000, 2000)(80, 80, 80, 80)(160, 160, 160, 160)(70, 70, 70, 70)(300, 300, 300, 300)
A19(2000, 2000, 2000, 2000)(104, 104, 104, 104)(160, 160, 160, 160)(120, 120, 120, 120)(650, 650, 650, 650)
A20(2000, 2000, 2000, 2000)(80, 80, 80, 80)(160, 160, 160, 160)(70, 70, 70, 70)(300, 300, 300, 300)
A21(1830, 1830, 1830, 1830)(90, 90, 90, 90)(140, 140, 140, 140)(80, 80, 80, 80)(320, 320, 320, 320)
A22(750, 750, 750, 750)(110, 110, 110, 110)(400, 400, 400, 400)(9, 48,25, 94,63, 200)(80, 249,02, 449,94, 900)
A24(350, 350, 350, 350)(100, 100, 100, 100)(100, 100, 100, 100)(30, 30, 30, 30)(80, 249,02, 449,94, 900)
A25(800, 800, 800, 800)(100, 100, 100, 100)(155, 155, 155, 155)(60, 60, 60, 60)(80, 249,02, 449,94, 900)
A26(660, 660, 660, 660)(105, 105, 105, 105)(155, 155, 155, 155)(60, 60, 60, 60)(80, 249,02, 449,94, 900)
A29(520, 520, 520, 520)(110, 110, 110, 110)(100, 100, 100, 100)(45, 45, 45, 45)(80, 249,02, 449,94, 900)
A30(1895, 1895, 1895, 1895)(70, 70, 70, 70)(100, 100, 100, 100)(47, 47, 47, 47)(270, 270, 270, 270)
A31(365, 365, 365, 365)(45, 45, 45, 45)(110, 110, 110, 110)(9, 9, 9, 9)(80, 249,02, 449,94, 900)
A32(2500, 2500, 2500, 2500)(80, 80, 80, 80)(150, 150, 150, 150)(90, 90, 90, 90)(80, 249,02, 449,94, 900)
A33(3200, 3200, 3200, 3200)(80, 80, 80, 80)(160, 160, 160, 160)(134, 134, 134, 134)(650, 650, 650, 650)
A34(1000, 1000, 1000, 1000)(60, 60, 60, 60)(100, 100, 100, 100)(70, 70, 70, 70)(280, 280, 280, 280)
A35(700, 700, 700, 700)(121, 121, 121, 121)(129, 129, 129, 129)(50, 50, 50, 50)(235, 235, 235, 235)
A36(2800, 2800, 2800, 2800)(90, 90, 90, 90)(160, 160, 160, 160)(100, 100, 100, 100)(550, 550, 550, 550)
Table A4. Fragment of the decision matrix based on the complete alternatives set.
Per1Per2Per3Eng4Eng5
A1(695, 695, 695, 695)(110, 110, 110, 110)(170, 170, 170, 170)(49, 49, 49, 49)(200, 200, 200, 200)
A2(2700, 2700, 2700, 2700)(104, 104, 104, 104)(160, 160, 160, 160)(80, 80, 80, 80)(80, 249,02, 449,94, 900)
A3(1400, 1400, 1400, 1400)(120, 120, 120, 120)(160, 160, 160, 160)(100, 100, 100, 100)(900, 900, 900, 900)
A4(935, 935, 935, 935)(80, 80, 80, 80)(120, 120, 120, 120)(28, 28, 28, 28)(80, 249,02, 449,94, 900)
A5(830, 830, 830, 830)(40, 40, 40, 40)(118, 118, 118, 118)(14, 14, 14, 14)(98, 98, 98, 98)
A6(3000, 3000, 3000, 3000)(96, 96, 96, 96)(145, 145, 145, 145)(200, 200, 200, 200)(610, 610, 610, 610)
A7(2000, 2000, 2000, 2000)(100, 100, 100, 100)(145, 145, 145, 145)(200, 200, 200, 200)(610, 610, 610, 610)
A8(705, 705, 705, 705)(120, 120, 120, 120)(170, 170, 170, 170)(80, 80, 80, 80)(270, 270, 270, 270)
A9(613, 613, 613, 613)(140, 140, 140, 140)(180, 180, 180, 180)(140, 140, 140, 140)(400, 400, 400, 400)
A10(1820, 1820, 1820, 1820)(80, 80, 80, 80)(110, 110, 110, 110)(40, 40, 40, 40)(80, 249,02, 449,94, 900)
A11(650, 650, 650, 650)(130, 130, 130, 130)(170, 170, 170, 170)(44, 44, 44, 44)(226, 226, 226, 226)
A12(600, 600, 600, 600)(60, 60, 60, 60)(150, 150, 150, 150)(9, 48,25, 94,63, 200)(80, 249,02, 449,94, 900)
A13(900, 900, 900, 900)(89, 89, 89, 89)(130, 130, 130, 130)(60, 60, 60, 60)(280, 280, 280, 280)
A14(1200, 1200, 1200, 1200)(80, 80, 80, 80)(135, 135, 135, 135)(100, 100, 100, 100)(220, 220, 220, 220)
A15(350, 350, 350, 350)(100, 100, 100, 100)(110, 110, 110, 110)(30, 30, 30, 30)(196, 196, 196, 196)
A16(350, 350, 350, 350)(100, 100, 100, 100)(100, 100, 100, 100)(30, 30, 30, 30)(196, 196, 196, 196)
A17(350, 350, 350, 350)(100, 100, 100, 100)(150, 150, 150, 150)(30, 30, 30, 30)(196, 196, 196, 196)
A18(2000, 2000, 2000, 2000)(80, 80, 80, 80)(160, 160, 160, 160)(70, 70, 70, 70)(300, 300, 300, 300)
A19(2000, 2000, 2000, 2000)(104, 104, 104, 104)(160, 160, 160, 160)(120, 120, 120, 120)(650, 650, 650, 650)
A20(2000, 2000, 2000, 2000)(80, 80, 80, 80)(160, 160, 160, 160)(70, 70, 70, 70)(300, 300, 300, 300)
A21(1830, 1830, 1830, 1830)(90, 90, 90, 90)(140, 140, 140, 140)(80, 80, 80, 80)(320, 320, 320, 320)
A22(750, 750, 750, 750)(110, 110, 110, 110)(400, 400, 400, 400)(9, 48,25, 94,63, 200)(80, 249,02, 449,94, 900)
A23(635, 635, 635, 635)(110, 110, 110, 110)(170, 170, 170, 170)(49, 49, 49, 49)(200, 200, 200, 200)
A24(350, 350, 350, 350)(100, 100, 100, 100)(100, 100, 100, 100)(30, 30, 30, 30)(80, 249,02, 449,94, 900)
A25(800, 800, 800, 800)(100, 100, 100, 100)(155, 155, 155, 155)(60, 60, 60, 60)(80, 249,02, 449,94, 900)
A26(660, 660, 660, 660)(105, 105, 105, 105)(155, 155, 155, 155)(60, 60, 60, 60)(80, 249,02, 449,94, 900)
A27(340, 340, 340, 340)(150, 150, 150, 150)(160, 160, 160, 160)(110, 110, 110, 110)(500, 500, 500, 500)
A28(750, 750, 750, 750)(57, 57, 57, 57)(110, 110, 110, 110)(10, 10, 10, 10)(80, 80, 80, 80)
A29(520, 520, 520, 520)(110, 110, 110, 110)(100, 100, 100, 100)(45, 45, 45, 45)(80, 249,02, 449,94, 900)
A30(1895, 1895, 1895, 1895)(70, 70, 70, 70)(100, 100, 100, 100)(47, 47, 47, 47)(270, 270, 270, 270)
A31(365, 365, 365, 365)(45, 45, 45, 45)(110, 110, 110, 110)(9, 9, 9, 9)(80, 249,02, 449,94, 900)
A32(2500, 2500, 2500, 2500)(80, 80, 80, 80)(150, 150, 150, 150)(90, 90, 90, 90)(80, 249,02, 449,94, 900)
A33(3200, 3200, 3200, 3200)(80, 80, 80, 80)(160, 160, 160, 160)(134, 134, 134, 134)(650, 650, 650, 650)
A34(1000, 1000, 1000, 1000)(60, 60, 60, 60)(100, 100, 100, 100)(70, 70, 70, 70)(280, 280, 280, 280)
A35(700, 700, 700, 700)(121, 121, 121, 121)(129, 129, 129, 129)(50, 50, 50, 50)(235, 235, 235, 235)
A36(2800, 2800, 2800, 2800)(90, 90, 90, 90)(160, 160, 160, 160)(100, 100, 100, 100)(550, 550, 550, 550)
Figure A4. Sensitivity analysis of the rankings based on the subset of alternatives with data gaps.
Sustainability 09 01453 g013
Figure A5. Sensitivity analysis of the rankings based on the complete set of alternatives.
Sustainability 09 01453 g014

References

  1. Piloto-Rodríguez, R.; Sánchez-Borroto, Y.; Melo-Espinosa, E.A.; Verhelst, S. Assessment of diesel engine performance when fueled with biodiesel from algae and microalgae: An overview. Renew. Sustain. Energy Rev. 2017, 69, 833–842. [Google Scholar] [CrossRef]
  2. Huo, M.Q.; Sato, K.; Ohizumi, T.; Akimoto, H.; Takahashi, K. Characteristics of carbonaceous components in precipitation and atmospheric particle at Japanese sites. Atmos. Environ. 2016, 146, 164–173. [Google Scholar] [CrossRef]
  3. Mizuta, K.; Nishizawa, Y.; Sugimoto, K.; Okayama, K.; Hase, A. Evaluation of Friction Phenomena of Brake Pads by Acoustic Emission Method. SAE Int. J. Commer. Veh. 2014, 7, 703–709. [Google Scholar] [CrossRef]
  4. Chathura, B.A.Y.; Punchihewa, H.K.G. A novel method to measure abrasion of solid tires. In Proceedings of the 2nd International Moratuwa Engineering Research Conference, Moratuwa, Sri Lanka, 5–6 April 2016; pp. 174–179. [Google Scholar]
  5. Thomas, B.S.; Kumar, S.; Mehra, P.; Gupta, R.C.; Joseph, M.; Csetenyi, L.J. Abrasion resistance of sustainable green concrete containing waste tire rubber particles. Constr. Build. Mater. 2016, 124, 906–909. [Google Scholar] [CrossRef]
  6. Kermani, M.R.S.; Dehnad, M.H. The effect of abrasive minerals on the mechanism of road stones polishing. Pet. Coal 2016, 58, 17–26. [Google Scholar]
  7. Squizzato, S.; Cazzaro, M.; Innocente, E.; Hopke, P.K.; Rampazzo, G. Urban air quality in a mid-size city—PM2.5 composition, sources and identification of impact areas: From local to long range contributions. Atmos. Res. 2017, 186, 51–62. [Google Scholar] [CrossRef]
  8. Inyang, H.I.; Bae, S. The aero-geochemistry of cities and regions. Environ. Monit. Assess. 2017, 130, 1–2. [Google Scholar] [CrossRef] [PubMed]
  9. Cullinane, S.; Edwards, J. Assessing the Environmental Impacts of Freight Transport; A. McKinnon: Green Logistics; Kogan Page Limited: St. Albans, UK, 2011. [Google Scholar]
  10. Muñuzuri, J.; van Duin, J.H.R.; Escudero, A. How efficient is city logistics? Estimating ecological footprints for urban freight deliveries. Procedia Soc. Behav. Sci. 2010, 2, 6165–6176. [Google Scholar] [CrossRef]
  11. Jedliński, M. The Position of Green Logistics in Sustainable Development of a Smart Green City. Procedia Soc. Behav. Sci. 2014, 151, 102–111. [Google Scholar] [CrossRef]
  12. Van Duin, J.H.R. Logistics Development in Multi-Actor Environments. Ph.D. Thesis, Delft University of Technology, Delft, The Netherlands, 2012. [Google Scholar]
  13. Crainic, T.G.; Ricciardi, N.; Storchi, G. Advanced Freight Transportation Systems for Congested Urban Areas. Trans. Res. Part C Emergy Technol. 2004, 12, 119–137. [Google Scholar] [CrossRef]
  14. Quak, H.J. Sustainability of Urban Freigth Transport Retail Distribution and Local Regulations in Cities. Ph.D. Thesis, Erasmus University Rotterdam, Rotterdam, The Netherlands, 2008. [Google Scholar]
  15. Van Rooijen, T.; Quak, H. City logistics in the European CIVITAS initiative. Procedia Soc. Behav. Sci. 2014, 125, 312–325. [Google Scholar] [CrossRef]
  16. Soysal, M.; Bloemhof-Ruwaard, J.M.; Bektaş, T. The time-dependent two-echelon capacitated vehicle routing problem with environmental considerations. Int. J. Prod. Econ. 2015, 164, 366–378. [Google Scholar] [CrossRef]
  17. Freight Transport Logistics Action Plan; Commission of the European Communities: Brussels, Belgium, 2007.
  18. Kiba-Janiak, M.; Cheba, K. How Local Authorities are Engaged in Implementation of Projects Related to Passenger and Freight Transport in Order to Reduce Environmental Degradation in the City. Procedia Soc. Behav. Sci. 2014, 151, 127–141. [Google Scholar] [CrossRef]
  19. Dablanc, L. Goods transport in large European cities: Difficult to organize, difficult to modernize. Trans. Res. Part A 2007, 41, 280–285. [Google Scholar] [CrossRef]
  20. Ramsey, M. As Electric Vehicles Arrive, Firms See Payback in Trucks. Available online: https://www.wsj.com/articles/SB10001424052748704584804575644773552573304 (accessed on 16 August 2017).
  21. Brinkman, N.D. Vehicle evaluation of neat methanol—Compromises among exhaust emissions, fuel economy and driveability. Int. J. Energy Res. 1979, 3, 243–274. [Google Scholar] [CrossRef]
  22. Lucas, G.G.; Richards, W.L. Alternative fuels for transportation. Trans. Plan. Technol. 1982, 7, 167–170. [Google Scholar] [CrossRef]
  23. Salameh, M.G. Oil Crises, Historical Perspective, Reference Module in Earth Systems and Environmental Sciences 2015.
  24. Buczaj, M. Wykorzystanie alternatywnych źródeł zasilania pojazdów w świetle norm i dyrektyw UE na przykładzie Polski. Motrol. In Motorization and Power Industry in Agriculture, nr 6; Commission of Motorization and Energetics in Agriculture: Lublin, Poland, 2006. [Google Scholar]
  25. Szmidt, E. Przegląd alternatywnych paliw i napędów stosowanych w motoryzacji. In Biuletyn Informacyjny ITS, nr 3(45); Instytut Transportu Samochodowego: Warszawa, Poland, 2011. [Google Scholar]
  26. Maj, M. Nowoczesne systemy zasilania pojazdów samochodowych gazem propan-butan (LPG) oraz sprężonym metanem (CNG). In Biuletyn Informacyjny ITS, nr 3(45); Instytut Transportu Samochodowego: Warszawa, Poland, 2011. [Google Scholar]
  27. Ding, X.L.; Si, J.P.; Wang, G.S. The performance analysis of LPG as the vehicle fuel. Appl. Mech. Mater. 2012, 217, 749–753. [Google Scholar] [CrossRef]
  28. Scheuerer, K. Hydrogen—Fuel for future propulsion technologies. In Proceedings of the 29th World Nuclear Association on WNA Annual Symposium, London, UK, 8–10 September 2004; pp. 77–78. [Google Scholar]
  29. Bauer, R.; Menrad, K.; Decker, T. Alternative fuel vehicles: Preferences, attitudes, and motives of German students in the field of mobility. Int. J. Electr. Hybrid Veh. 2014, 6, 298–314. [Google Scholar] [CrossRef]
  30. Pacini, H.; Sanches-Pereira, A.; Durleva, M.; Kane, M.; Bhutani, A. The State of the Biofuels Market: Regulatory. Available online: http://unctad.org/en/PublicationsLibrary/ditcted2013d8_en.pdf (accessed on 8 August 2017).
  31. Chintala, V.; Subramanian, K.A. A comprehensive review on utilization of hydrogen in a compression ignition engine under dual fuel mode. Renew. Sustain. Energy Rev. 2017, 70, 472–491. [Google Scholar] [CrossRef]
  32. Oh, J.; Choi, S.B.; Chang, Y.J.; Eo, J.S. Engine clutch torque estimation for parallel-type hybrid electric vehicles. Int. J. Automot. Technol. 2017, 18, 125–135. [Google Scholar] [CrossRef]
  33. Quak, H.; Nesterova, N.; van Rooijen, T. Possibilities and Barriers for Using Electric-powered Vehicles in City Logistics Practice. Trans. Res. Proc. 2016, 12, 157–169. [Google Scholar] [CrossRef]
  34. Nesterova, N.; Quak, H.; Balm, S.; Roche-Cerasi, I.; Tretvik, T. State of the Art City Logistics and EV, European Commission Seventh Framework Program. Available online: http://frevue.eu/wp-content/uploads/2016/04/FREVUE-D1.3-State-of-the-Art-add1.pdf (accessed on 8 August 2017).
  35. Vermie, T. Electric Vehicle City Distribution; Final Report; European Commission Project: Rotterdam, The Netherlands, 2002. [Google Scholar]
  36. Taniguchi, E.; Thompson, R.G. City Logistics: Mapping the Future; CRC Press: Boca Raton, FL, USA; Taylor & Francis: Milton Park, UK, 2015. [Google Scholar]
  37. Thompson, R.G. Vehicle related innovations for improving the environmental performance of urban freight systems. In Green Logistics and Transportation: A Sustainable Supply Chain Perspective; Fahimnia, B., Bell, M., Hensher, D.A., Sarkis, J., Eds.; Springer: Berlin, Germany, 2015; pp. 119–129. [Google Scholar]
  38. Quak, H.; Nesterova, N.; van Rooijen, T.; Dong, Y. Zero Emission City Logistics: Current Practices in Freight Electromobility and Feasibility in the Near Future. Trans. Res. Proc. 2016, 14, 1506–1515. [Google Scholar] [CrossRef]
  39. Lebeau, P.; Macharis, C.; Van Mierlo, J. Exploring the choice of battery electric vehicles in city logistics: A conjoint-based choice analysis. Trans. Res. Part E Logist. Trans. Rev. 2016, 91, 245–258. [Google Scholar] [CrossRef]
  40. Eberle, U.; von Helmolt, R. Sustainable transportation based on electric vehicle concepts: A brief overview. Energy Environ. Sci. 2010, 3, 689–699. [Google Scholar] [CrossRef]
  41. Xiong, P.; Peng, L.; Chen, D.; Wang, X.; Yu, G. Two-dimensional nanosheets based Li-ion full batteries with high rate capability and flexibility. Nano Energy 2015, 12, 816–823. [Google Scholar] [CrossRef]
  42. Kessels, J.T.B.A.; van den Bosch, P.P.J. Electronic horizon: Energy management using telematics information. In Proceedings of the 2007 IEEE Vehicle Power and Propulsion Conference, Arlington, TX, USA, 9–12 September 2007; pp. 581–586. [Google Scholar]
  43. European Commission White Paper. Roadmap to a Single Euopean Transport Area—Towards a Competitive and Resource-Efficient Transport System; European Commission: Brussels, Belgium, 2011. [Google Scholar]
  44. Foltyński, M. Electric Fleets in Urban Logistics. Procedia Soc. Behav. Sci. 2014, 151, 48–59. [Google Scholar] [CrossRef]
  45. Melo, S.; Baptista, P.; Costa, Á. Comparing the Use of Small Sized Electric Vehicles with Diesel Vans on City Logistics. Procedia Soc. Behav. Sci. 2014, 111, 1265–1274. [Google Scholar] [CrossRef]
  46. Banasik, A.; Bloemhof-Ruwaard, J.M.; Kanellopoulos, A.; Claassen, G.D.H.; van der Vorst, J.G.A.J. Multi-criteria decision making approaches for green supply chains: A review. Flex. Serv. Manuf. J. 2016. [Google Scholar] [CrossRef]
  47. Sathe, P.; Kumar, A.H.; Rajagopalan, K.; Singh, S. Strategic Technology and Market Analysis of Electric Vehicle Charging Infrastructure in Europe United Kingdom to have Maximum Charging Stations Installed by 2019. Available online: http://www.frost.com/c/10057/sublib/ display-report.do?id=M86E-01-00-00-00 (accessed on 16 August 2017).
  48. Van Duin, J.H.R.; Tavasszy, L.A.; Quak, H.J. Towards E(lectric)-urban freight: First promising steps in the electronic vehicle revolution. Eur. Trans. Trasp. Eur. 2013, 54, 1–19. [Google Scholar]
  49. Jeeninga, H.; van Arkel, W.G.; Volkers, C.H. Performance and Acceptance of Electric and Hybrid Vehicles; Municipality of Rotterdam: Rotterdam, The Netherlands, 2002. [Google Scholar]
  50. Sonnabend, P. Final Report Electric Vehicle Deliveries in Postal Services; European Commission: Bonn, Germany, 2001. [Google Scholar]
  51. Taniguchi, E.; Kawakatsu, S.; Tsuji, H. New Co-Operative System Using Electric Vans for Urban Freight Transport. Available online: https://www.witpress.com/Secure/elibrary/papers/UT00/UT00019FU.pdf (accessed on 8 August 2017).
  52. Markowitz, J.; Duvall, M. Plug-in hybrid electric van fleet test and demonstration in New York City. In Proceedings of the 23rd International Electric Vehicle Symposium and Exposition 2007, Anaheim, CA, USA, 2–5 December 2007. [Google Scholar]
  53. Del Pozo De Dios, E.; Dávila, A.; Alba, J.J.; Avalle, M. Optibody project: Optimizing vehicle structures for electric light trucks and vans. Lect. Notes Electr. Eng. 2013, 195, 633–640. [Google Scholar]
  54. Lee, D.Y.; Thomas, V.M.; Brown, M.A. Electric urban delivery trucks: Energy use, greenhouse gas emissions, and cost-effectiveness. Environ. Sci. Technol. 2013, 47, 8022–8030. [Google Scholar] [CrossRef] [PubMed]
  55. Tipagornwong, C.; Figliozzi, M. Analysis of competitiveness of freight tricycle delivery services in urban areas. Trans. Res. Rec. 2014, 2410, 76–84. [Google Scholar] [CrossRef]
  56. Taefi, T.T.; Kreutzfeldt, J.; Held, T.; Konings, R.; Kotter, R.; Lilley, S.; Baster, H.; Green, N.; Laugesen, M.S.; Jacobsson, S.; et al. Comparative Analysis of European Examples of Freight Electric Vehicles Schemes—A Systematic Case Study Approach with Examples from Denmark, Germany, the Netherlands, Sweden and the UK. In Dynamics in Logistics; Springer International Publishing: Cham, Switzerland, 2016; pp. 495–504. [Google Scholar]
  57. Iwan, S.; Kijewska, K.; Kijewski, D. Possibilities of Applying Electrically Powered Vehicles in Urban Freight Transport. Procedia Soc. Behav. Sci. 2014, 151, 87–101. [Google Scholar] [CrossRef]
  58. Nyquist, C. E-Mobility NSR, WP 7.5. Analysis of User Needs for ICT Solutions Assisting the Driver; E-Mobility NSR: Gothenburg, Sweden, 2013. [Google Scholar]
  59. Davis, B.; Figliozzi, M. A Methodology to Evaluate the Competitiveness of Electric Delivery Trucks. Trans. Res. Part E 2013, 49, 8–23. [Google Scholar] [CrossRef]
  60. Murray, C. Can EV Batteries Last 20 Years? Available online: http://www.eetimes.com/document.asp?doc_id=1280759 (accessed on 16 August 2017).
  61. Lebeau, P.; van Mierlo, J.; Macharis, C.; Lebeau, K. The electric vehicle as viable solution for urban freight transport? A total cost of ownership analysis. In Proceedings of the 13th WTCR, Rio de Janeiro, Brazil, 15–18 July 2013. [Google Scholar]
  62. Allen, J.; Thorne, G.; Browne, M. BESTUFS. In Good Practice Guide on Urban Freight Transport; BESTUFS.NET: Rijswijk, The Netherlands, 2007. [Google Scholar]
  63. Roy, B. Multicriteria Methodology for Decision Aiding; Springer Science & Business Media: Berlin, Germany, 2013. [Google Scholar]
  64. Guitouni, A.; Martel, J.M.; Vincke, P.; North, P. A Framework to Choose a Discrete Multicriterion Aggregation Procedure. Available online: https://pdfs.semanticscholar.org/27d5/9c846657268bc840c4df8df98e85de66c562.pdf (accessed on 8 August 2017).
  65. Obserschmidt, J.; Geldermann, J.; Ludwig, J.; Schmehl, M. Modified PROMETHEE approach for assessing enery technologies. Int. J. Energy Sect. Manag. 2010, 4, 183–212. [Google Scholar] [CrossRef]
  66. Belton, V.; Stewart, T.J. Multi Criteria Decision Analysis: An Integrated Approach; Kluwer: London, UK, 2002. [Google Scholar]
  67. Brans, J.P.; Mareschal, B.; Vincke, P. PROMETHEE: A new family of outranking methods in multicriteria analysis. Oper. Res. 1984, 84, 408–421. [Google Scholar]
  68. Behzadian, M.; Kazemzadeh, R.B.; Albadvi, A.; Aghdasi, M. PROMETHEE: A comprehensive literature review on methodologies and applications. Eur. J. Oper. Res. 2010, 200, 198–215. [Google Scholar] [CrossRef]
  69. Greco, S.; Figueira, J.; Ehrgott, M. Multiple Criteria Decision Analysis; Springer’s International Series: Boston, MA, USA, 2005; pp. 163–195. [Google Scholar]
  70. Opricovic, S.; Tzeng, G.H. Compromise solution by MCDM methods: A comparative analysis of VIKOR and TOPSIS. Eur. J. Oper. Res. 2004, 156, 445–455. [Google Scholar] [CrossRef]
  71. Shih, H.S.; Shyur, H.J.; Lee, E.S. An extension of topsis for group decision making. Math. Comp. Model. 2007, 45, 801–813. [Google Scholar] [CrossRef]
  72. Kauffman, A.; Gupta, M.M. Introduction to Fuzzy Arithmetic: Theory and Application; Van Nostrand Reinhold Co.: New York, NY, USA, 1991. [Google Scholar]
  73. Chen, C.T. Extensions of the topsis for group decision-making under fuzzy environment. Fuzzy Sets Syst. 2000, 114, 1–9. [Google Scholar] [CrossRef]
  74. Barfod, M.B.; Kaplan, S.; Frenzel, I.; Klauenberg, J. COPE-SMARTER–A decision support system for analysing the challenges, opportunities and policy initiatives: A case study of electric commercial vehicles market diffusion in Denmark. Res. Trans. Econ. 2016, 55, 3–11. [Google Scholar] [CrossRef] [Green Version]
  75. Domingues, A.R.; Marques, P.; Garcia, R.; Freire, F.; Dias, L.C. Applying multi-criteria decision analysis to the life-cycle assessment of vehicles. J. Clean. Prod. 2015, 107, 749–759. [Google Scholar] [CrossRef]
  76. Oliveira, G.D.; Dias, L.M.C.; Sarabando dos Santos, P.C. Modelling consumer preferences for electric vehicles in Portugal: an exploratory study. Manag. Environ. Q. Int. J. 2015, 26, 929–950. [Google Scholar] [CrossRef]
  77. Schmale, J.; Von Schneidemesser, E.; Dörrie, A. An integrated assessment method for sustainable transport system planning in a middle sized German city. Sustainability 2015, 7, 1329–1354. [Google Scholar] [CrossRef]
  78. Zhao, H.; Li, N. Optimal siting of charging stations for electric vehicles based on fuzzy Delphi and hybrid multi-criteria decision making approaches from an extended sustainability perspective. Energies 2016, 9, 270. [Google Scholar] [CrossRef]
  79. Li, W.; Li, Y.; Fan, J.; Deng, H. Siting of carsharing stations based on spatial multi-criteria evaluation: A case study of Shanghai EVCARD. Sustainability 2017, 9, 152. [Google Scholar] [CrossRef]
  80. Ma, X.; Zhang, Y.; Yin, C.; Yuan, S. Multi-Objective Optimization Considering Battery Degradation for a Multi-Mode Power-Split Electric Vehicle. Energies 2017, 10, 975. [Google Scholar] [CrossRef]
  81. Cai, Y.; Applegate, S.; Yue, W.; Cai, J.; Wang, X.; Liu, G.; Li, C. A hybrid life cycle and multi-criteria decision analysis approach for identifying sustainable development strategies of Beijing’s taxi fleet. Energy Policy 2017, 100, 314–325. [Google Scholar] [CrossRef]
  82. Pérez, J.C.; Carrillo, M.H.; Montoya-Torres, J.R. Multi-criteria approaches for urban passenger transport systems: A literature review. Ann. Oper. Res. 2015, 226, 69–87. [Google Scholar] [CrossRef]
  83. Wang, M.; Thoben, K.D. The Influential Factors for Application of the Electric Commercial Vehicle in the Urban Freight Transport. In Dynamics in Logistics; Springer: Cham, Switzerland, 2016; pp. 375–378. [Google Scholar]
  84. Franke, T.; Günther, M.; Trantow, M.; Krems, J.F. Does this range suit me? Range satisfaction of battery electric vehicle users. Appl. Ergon. 2017, 65, 191–199. [Google Scholar] [CrossRef] [PubMed]
  85. Sun, X.H.; Yamamoto, T.; Morikawa, T. Charge timing choice behavior of battery electric vehicle users. Trans. Res. Part D Trans. Environ. 2015, 37, 97–107. [Google Scholar] [CrossRef]
  86. Ayob, A.; Mahmood, W.M.F.W.; Mohamed, A.; Wanik, M.Z.C.; Siam, M.M.; Sulaiman, S.; Ali, M.A.M. Review on electric vehicle, battery charger, charging station and standards. Res. J. Appl. Sci. Eng. Technol. 2014, 7, 364–373. [Google Scholar] [CrossRef]
  87. Knox, J. Zero to 80 Percent in 15 Minutes: New Benchmark for EV Fast-Charging. Available online: http://www.ai-online.com/Adv/Previous/show_issue.php?id=3310&search=true#sthash.OIpRSmDl.dpbs (accessed on 16 August 2017).
  88. Young, K.; Wang, C.; Wang, L.Y.; Strunz, K. Electric vehicle battery technologies. In Electric Vehicle Integration into Modern Power Networks; Springer: New York, NY, USA, 2013; pp. 15–56. [Google Scholar]
  89. Min, C.; Gabriel, A.R. Accurate electrical battery model capable of predicting runtime and I-V performance. IEEE Trans. Energy Convers. 2006, 21, 504–511. [Google Scholar]
  90. Rong, P.; Pedram, M. An analytical model for predicting the remaining battery capacity of lithium-ion batteries. In Proceedings of the Design, Automation, and Test in Europe Conference and Exhibition, Washington, DC, USA, 3–7 March 2003; pp. 1148–1149. [Google Scholar]
  91. Faizi, S.; Sałabun, W.; Rashid, T.; Wątróbski, J.; Zafar, S. Group Decision-Making for Hesitant Fuzzy Sets Based on Characteristic Objects Method. Symmetry 2017, 9, 136. [Google Scholar] [CrossRef]
  92. Faizi, S.; Rashid, T.; Sałabun, W.; Zafar, S.; Wątróbski, J. Decision Making with Uncertainty Using Hesitant Fuzzy Sets. Int. J. Fuzzy Syst. 2017, 1–11. [Google Scholar] [CrossRef]
Figure 1. Proposed evaluation framework.
Sustainability 09 01453 g001
Figure 2. Comparison of the rankings based on all nine criteria and on a subset of criteria with the “battery charging time 80%” criterion excluded.
Sustainability 09 01453 g002
Figure 3. GAIA (Geometrical Analysis for Interactive Aid) analysis, broken down into: (a) criteria; and (b) criteria groups.
Sustainability 09 01453 g003
Figure 4. Sensitivity analysis. Ranges of stability for the criteria clusters: (a) Performance; (b) Engine; (c) Battery; and (d) Price.
Sustainability 09 01453 g004
Figure 5. Values of the closeness coefficients (CCi) for the ranking based on the subset of alternatives with data gaps.
Sustainability 09 01453 g005
Figure 6. Sensitivity analysis of the rankings based on the subset of alternatives with data gaps.
Sustainability 09 01453 g006
Figure 7. Values of the closeness coefficients (CCi) for the ranking based on the full set of alternatives.
Sustainability 09 01453 g007
Figure 8. Sensitivity analysis of the rankings based on the complete set of alternatives.
Sustainability 09 01453 g008
Figure 9. Visual comparison of the rankings: (a) only alternatives without gaps; and (b) only alternatives with gaps.
Sustainability 09 01453 g009
Table 1. Overview of selected EU projects.
Project Abbreviation, TitleTime PeriodObjectives
EVD-Post—Electric vehicles deliveries in postal services1998–2000The overall objective of the EVD-POST project was to demonstrate the technical and economic viability of EVs in the regular operations of postal services in Europe.
ELCIDIS—Electric Vehicles City distribution systems1998–2002The overall objective was proving the viability of hybrid and electric vans and trucks for urban distribution, preferably in combination with the use of an UDC, showing the environmental benefits of such an application and promoting incentives for the use of those vehicles.
CIVITAS—Cleaner and better transport in cities2002–2016An integrated approach to sustainable mobility. Within CIVITAS, eight thematic categories of measures have been identified as the basic building blocks of an integrated strategy for sustainable mobility: clean fuels and vehicles, collective passenger transport, mobility management, car independent lifestyles, safety and security, urban freight logistics, integrated planning, demand management strategies, transport telematics, public involvement.
CO2NeuTrAlp—CO2 -Neutral Transport for the Alpine Space2009–2012A variety of technological solutions: electric engines in light vehicles, cars and buses, biofuel compliant combustion engines, compressed air technology, etc. have been applied in regions with differing resource potentials. The applied technical solutions have been analysed in order to elaborate proposals for harmonising technical standards.
TURBLOG—Transferability of urban logistics concepts and practice from a worldwide perspective2010–2013During the project they have provided the results in section:
 D1—A worldwide overview on urban logistic interventions and data collection techniques
 D2—Business Concepts and Models for Urban Logistics
 D3—Urban Logistics Practices, Synthesis of Selected Case Studies
 D4—Transferability Guidelines and Evaluation
ENCLOSE—Energy efficiency in City Logistics Services for small and mid-sized European Historic Towns2012–2015ENCLOSE project aims to provide and disseminate viable solutions for urban energy-efficient transport by: (a) addressing specific needs, requirements, options and priorities of European SMHTs, releasing a specific SULP (Sustainable Urban Logistics Plan); (b) qualifying the demand of European SMHTs for sustainable, energy-efficient urban logistics and freight distribution solutions; (c) investigating and assessing the operation of “green vehicles” (FEVs, PHEVs, Bio-gas) and fleets in urban distribution and other logistics schemes from the point of view of the needs and requirements of in SMHTs.
SMARTFUSION—Smart Urban Freight Solutions2012–2015The main objectives can be summarised as follows: (a) to demonstrate and evaluate the technical and logistical feasibility of introducing electric vehicles and the second generation of hybrid truck technology into the business environment; (b) to apply these vehicle technologies, in conjunction with information technology, operational, managerial and regulatory innovations, including urban consolidation centres and telematics systems; (c) to determine the critical success factors in stimulating the market uptake of new sustainable vehicle technology and other innovations in the urban logistics environment; (d) to develop a Smart Urban Designer tool that allows other city-regions and company supply chains to analyse the likely success and benefits of applying these innovations in their domain.
SELECT—Suitable electromobility for commercial transport2012–2015The project’s central objective was to understand the technical and practical user requirements for using electric vehicles in commercial transport and to develop a set of methods for the fleet management of electric and mixed fleets.
Table 2. The structure of criteria broken down into groups.
Group of CriteriaCriterion NameAbbreviationReferences
PerformanceCarrying capacityPer1[34]
Max velocityPer2[34]
Travel rangePer3[34,75,83,84]
BatteryBattery charging time 100%Bat4[34,85,86]
Battery charging time 80%Bat5[87]
Battery capacityBat6[75,83,86]
EngineEngine powerBat7[34,75,81]
Engine torqueBat8[32]
PricePricePr9[34]
Table 3. Table of criteria efficiencies for options with data gaps.
CodeNameManufacturerCriteria
PerformanceEngineBatteryPrice
Per1: Carrying CapacityPer2: Max VelocityPer3: Travel RangeEng4: Engine PowerEng5: Engine TorqueBat6: Battery Charging Time 100%Bat7: Battery Charging Time 80%Bat8: Battery CapacityPr9: Price
[kg][km/h][km][kW][Nm][h][min][kWh][thous. USD]
A1Berlingo ElectricCitroën695110170492007.53022.5-
A2Boulder Delivery TruckBoulder Electric Vehicle270010416080-8.0-80.0100.0
A3Boulder DV-500Boulder Electric Vehicle14001201601009008.0--70.0
A4Ecomilel’Moving9358012028-8.0-14.451.5
A5Electric Delivery Van 1000Spijkstaal Electro B.V.8304011814988.01202.7-
A6EVI MDElectric Vehicles International30009614520061010.012099.0120.0
A7EVI Walk-In VanElectric Vehicles International/Freightliner Custom Chassis Corp.200010014520061010.012099.090.0
A8e-NV200+Nissan705120170802704.03024.025.0
A9e-Wolf Omega 0.7e-Wolf6131401801404008.04024.250.0
A10Jolly 2000l’Moving18208011040-6.0-38.474.0
A11Kangoo Maxi Z.E.Renault650130170442268.0-22.022.0
A12MegaVanMega60060150--6.0--14,1
A13Mercedes Vito E-CellMercedes90089130602806.0-36.0-
A14Mercedes-Benz Sprinter E-CELLMercedes1200801351002202.0-35.2-
A15Minicab-MiEV TruckMitsubishi Motors Corp.350100110301964.51510.512.9
A16Mitsubishi Minicab-MiEV (10,5 kWh)Mitsubishi Motors Corp.350100100301964.51510.515.5
A17Mitsubishi Minicab-MiEV (16kWh)Mitsubishi Motors Corp.350100150301967.03516.018.7
A18ModecModec200080160703008.0--32.3
A19MT-EV WIVFreightliner Custom Chassis Corp./Morgan Olson20001041601206507.0-55.5-
A20Navistar eStarNavistar Int. Corp./Modec200080160703008.0-80.0150.0
A21Nissan e-NT400 ConceptNissan Motor Co.183090140803209.06050.0-
A22Opel Vivaro e-conceptOpel750110400--8.0---
A23Partner Panel VanPeugeot635110170492008.03522.531.5
A24Peugeot eBipperAllied Electric35010010030-3.0-20.060.0
A25Peugeot eBoxerAllied Electric80010015560-10.5-56.085.5
A26Peugeot eExpertAllied Electric66010515560-8.5-43.075.0
A27Phoenix Motorcars SUVPhoenix Motorcars3401501601105006.01035.045.0
A28Piaggio Porter electric-powerPiaggio Porter7505711010808.012035.024.4
A29Ranger EVFord52011010045-8.0-30.0-
A30Renault Maxity ElectricRenault Trucks/PVI189570100472708.0-42.0-
A31Smilel’Moving365451109----21.0
A32SEV Edison (Chassis Cab)Smith Electric Vehicles25008015090-7.018040.081.0
A33SEV NewtonSmith Electric Vehicles US Corporation3200801601346507.0-120.0117.9
A34Toyota EV TruckToyota Motor corp./Hino Motors100060100702808.04528.0-
A35Transit Connect BEVFord/ Smith Electric Vehicles70012112950-7.0-21.0-
A36ZeroTruckElectrorides28009016010055012.0---
Table 4. Preference model.
CriterionDirectionWeightPreference FunctionPreference Threshold p
Carrying capacityMax1V-shape1679.68
Max velocityMax1V-shape48.71
Travel rangeMax1V-shape53.63
Engine powerMax1V-shape135.70
Engine torqueMax1V-shape361.82
Battery charging time 100%Min1V-shape4.17
Battery charging time 80%Min1V-shape88.41
Battery capacityMax1V-shape63.50
PriceMin1V-shape67.07
Table 5. The ranking and options’ efficiencies obtained for the alternatives where complete data were available.
RankOptionPhi NetPhi +Phi −
1A270.24530.38130.1361
2A80.16250.30640.1439
3A90.15510.32750.1725
4A70.09180.40070.3089
5A60.08630.41180.3255
6A23−0.03800.18640.2244
7A15−0.09340.18260.2760
8A17−0.09510.15490.2501
9A16−0.11190.17700.2889
10A28−0.40250.08240.4849
Table 6. Rankings and Phi net values obtained from the efficiency data with the battery capacity reduced by 10%, 20% and 30%.
OptionA6A7A8A9A15A16A17A23A27A28
−10%Rank54237986110
Phi0.08400.08950.16220.1548−0.0916−0.1101−0.0942−0.0380.2456−0.4022
−20%Rank54237986110
Phi0.07350.07900.16540.1579−0.0883−0.1068−0.0910−0.03490.2465−0.4013
−30%Rank54237986110
Phi0.04770.05320.17110.1636−0.0770−0.0955−0.0819−0.02850.2475−0.4002
Table 7. Ranking and Phi net values obtained from the efficiency data with the “battery charging time 80%” criterion excluded.
OptionA6A7A8A9A15A16A17A23A27A28
Rank32548976110
Phi0.19190.19810.14580.1525−0.1585−0.1793−0.1369−0.07260.2170−0.3580
Table 8. Sensitivity analysis. The ranges of stability for the criteria clusters.
Cluster of CriteriaMinMax
Performance0.00%65.73%
Engine5.46%43.09%
Battery7.90%80.13%
Price0.00%30.45%
Table 9. Rankings based on: (a) exclusively alternatives with gaps; and (b) all alternatives. Alternatives providing full data are in bold.
(a) Only Data with Gaps(b) All Data
AlternativeRankCCiAlternativeRankCCi
A1210.3080A1270.3022
A220.4918A220.4747
A3230.2978A3290.2872
A4160.3479A4180.3480
A5140.3672A5190.3429
A10190.3218A610.5244
A11170.3337A790.4038
A1260.4265A8170.3552
A1340.4490A9250.3136
A14240.2774A10230.3212
A18110.3991A11220.3256
A19150.3495A1270.4126
A2030.4625A1340.4355
A21100.4042A14310.2736
A2270.4182A15350.1594
A24260.2328A16360.1369
A2510.5048A17340.1829
A2690.4075A18120.3787
A29220.3021A19200.3378
A30200.3174A2050.4330
A31120.3827A21140.3769
A3250.4288A2260.4167
A33130.3820A23300.2768
A34250.2543A24330.2373
A35180.3235A2530.4566
A3680.4138A26100.4023
A27150.3761
A28210.3330
A29280.3018
A30240.3147
A31160.3668
A3280.4047
A33130.3775
A34320.2522
A35260.3120
A36110.3835
Table 10. Comparison of the rankings: (a) only alternatives without gaps; and (b) only alternatives with gaps. Alternatives for which the rank in both rankings has not changed are marked in bold.
(a) Data without Gaps(b) Data with Gaps
AlternativePROMETHEETOPSISTOPSIS—ConvertedAlternativeOnly Alternatives with GapsAll AlternativesAll Alternatives—Converted
A6511A1212721
A7492A2221
A82174A3232923
A93256A4161814
A157359A5141915
A1693610A10192318
A178348A11172217
A236307A12676
A271153A13443
A2810215A14243124
A18111210
A19152016
A20354
A21101412
A22765
A24263326
A25132
A269108
A29222822
A30202419
A31121613
A32587
A33131311
A34253225
A35182620
A368119

