The Price of Environmental Sustainability: Empirical Evidence from Stock Market Performance in China


1
School of Finance/MBA School, Zhongnan University of Economics and Law, No. 182 Nanhu Avenue, East Lake High-Tech Development Zone, Wuhan 430073, China
2
Academy of Mathematics and Systems Science, Chinese Academy of Sciences, No. 55 Zhongguancun East Road, Haidian District, Beijing 100190, China
*
Author to whom correspondence should be addressed.
Sustainability 2017, 9(8), 1452; https://doi.org/10.3390/su9081452
Submission received: 23 July 2017
/
Revised: 13 August 2017
/
Accepted: 15 August 2017
/
Published: 17 August 2017
(This article belongs to the Section Economic and Business Aspects of Sustainability)
Abstract
:Chinese manufacturers, which produce nearly one-fourth of global manufacturing outputs, play important roles in the global supply chains for many products. The Chinese government proposed the “Made in China 2025” plan to help manufacturers upgrade their technology, so that the country will become a green and innovative “world manufacturing power”. It is important for researchers, practitioners, and the government to know the benefits and costs of being environmentally sustainable. In this paper, we investigate the effects of environmentally sustainable announcements of Chinese firms in the manufacturing, and the wholesale and retail industry on their stock market performance. First, we find negative market responses, which are significant in scale and statistics. Second, the stock market reactions are different for firms in different industries. Third, the stock market reactions are different in different years. Finally, we control the firm size and the book-to-market ratio with the Fama–French three factor model. The result is highly consistent with the one from the simple market model.
1. Introduction
China became the world’s factory shortly after it entered the WTO [1]. According to the latest economic census data [2], by the end of 2015, about 17.81% firms in China are classified in the manufacturing industry, which provide more than 97.75 million jobs and create more than 6.61 trillion of Chinese Yuan of profits. In 2015, China was ranked in the top ten exporters of merchandise such as mining products, iron and steel, chemicals, office and telecom equipment, automotive products, textiles, clothing, etc. [3]. China produces nearly one-fourth of global manufacturing output by value. Every year about 80% of air-conditioners, 70% of mobile phones and 60% of shoes all over the world are manufactured in China [4]. The manufacturing processes of many products, produce waste and pollution. Non-governmental organization (NGO) reports show that the supply chains of the textile [5,6,7], automobile [8,9], IT equipment [10,11,12,13] produce significant harm to the environment. In the past years, China has suffered from very serious environment problems. Environment and sustainability attract more attention from the public. The central government proposes the “Made in China 2025” plan to help manufacturers to upgrade their technology, so that the country will become a green and innovative “world manufacturing power” [14]. It is important for researchers, practitioners, and the government to know the benefits and costs of being environmentally sustainable.
In this paper, we study the economic consequences of firms’ environmentally sustainable operations in China using an event study. We define firms’ announcements of their environmentally sustainable operations as events, and then test the stock market reactions. Our results for the whole sample of 1595 events prove significant negative stock market return. The mean and median of abnormal returns are −0.46% and −0.56%. Our results for different industries demonstrate the difference of market responses among industries. We observe significant negative stock market reactions from 13 out of all 24 industries in our sample. In the worst case, on average, firms lost over 5% of their market value after announcing environmentally sustainable operations. We find the trend in the stock market reactions by comparing the abnormal returns in each year. The mean and median of abnormal returns increases in scale year by year. We check the robustness of our results by controlling the firm size and the book-to-market ratio with the Fama–French three factor model. The result is highly consistent with the one from the simple market model.
This paper contributes to the literature from the following aspects. First, we study the stock market reactions to environmentally sustainable operations for Chinese firms that are listed on the two main stock exchanges in China. A few papers study the stock market reactions on firms’ environmental performance [15,16,17]. Different types of events are studied. Klassen and McLaughlin [15] study the environmental awards and environmental crisis. Jacobs et al. [16] study firms’ announcements about Corporate Environmental Initiatives (CEIs) and Environmental Awards and Certifications (EACs). Arora et al. [17] investigate the stock market reactions to firms’ announcements of the appointments of Corporate Sustainable Executives (CSEs). The results from the above works are mixed. Although Klassen and McLaughlin [15] found significant stock market responses for firms’ strong and weak environmental performances, Jacobs et al. [16] found significant responses to CEIs and EACs only for some of the subcategories of firms. Investors do not have significant reactions to the appointment of CSEs in general. However, if the firm is undergoing an adverse sustainability event, the stock market reaction is significant. The Chinese manufacturers that produce a significant portion of global outputs play important roles in global supply chains. The environmentally sustainable practice and market responses make their unique impacts to both the academia and practitioners. However, only a few papers [18,19,20,21] study how environmental performance affects shareholder wealth using data from Chinese listed companies. Xu et al. [18] studies the stock market reaction to corporate environmental violation events. They find significant negative abnormal returns, which are much lower than abnormal returns for similar events in other countries. Lo et al. [19] reports negative stock market reactions to the announcements of environmental incidents. They find that corporate ownership and personal political ties are critical factors that affect the scale of stock market returns. Lyon et al. [21] finds that the shareholder value decreases due to the Green Company Awards. The stock market responds differently to announcements for firms with different ownership and industry characteristics. Lam et al. [20] find that the Chinese investors react negatively to CEIs, which is different from the results of similar research in a western context. The above works only consider certain types of environmentally sustainable operations of Chinese listed firms. Our sample includes a broad spectrum of environmentally sustainable operations, including CEIs, EACs, etc. In addition, our paper focuses on the firms in the manufacturing and wholesale and retail sector. Our paper provides insights on how investors react to the environmentally sustainable performance of Chinese listed companies in general.
Second, we study the stock market reactions to environmentally sustainable operations for firms in different industries. Most previous works [22,23] discuss the impacts of sustainability in firms’ operations. Some papers study specific industries, such as the textile and apparel industry [24,25,26]. Lo et al. [24] and Li and Wu [25] study the real impacts of the adoption of Environment Management Systems (EMS) for textile and apparel firms. Lo et al. [24] found that firms’ main financial ratios increase after adoption of EMSs, which indicates the increase in firms’ profitability and cost efficiency. Li and Wu [25] study the real and financial impact of the adoption of environmental management systems for firms in the textile and apparel industry in China. They found significant loss in profitability, sales and inventory turnover after Chinese textile and apparel firms adopt EMSs. Wu [26] studies the stock market reactions to the adoption of EMSs for Chinese textile and apparel firms. The paper reports that sample firms’ operational performance decreases after EMSs adoption. This paper extends the research scope to the entire manufacturing sector and the wholesale and retail industry. It investigates the stock market reactions to all types of environmentally sustainable related announcements. It helps us in deepening the understanding of the stock market reactions in different industries.
Third, we study the time pattern in the stock market reactions to environmentally sustainable operations. Previous studies [15,16,17,24] did not discuss the difference of the real or (and) financial impacts of environmentally sustainable operations in different years. However, China is considered to be an active and dynamic economy in the world. The market, environment, and governmental policies change over the years. Firm managers have to adjust their strategies and decisions to adapt to the changes, which may have a significant impact on the stock market reactions. We study the trend in market reactions by testing sub-samples for each year. Our results may help the managers and government to make better decisions.
The rest of this paper is organized as follows. We develop the research hypothesis in Section 2. The sampling process is introduced in Section 3. In Section 4, we describe the methodology and procedures of event study, which is used in this paper. Section 5 presents the results. We summarize our findings in Section 6 and point out the direction for future research.
2. Hypothesis
The theoretical foundation about the impacts of environmentally sustainable performance on market value of the firm is built on the belief that the stock market is efficient. In an efficient market, investors actively collect, process the information about public firms, and make proper trading decisions about the firms’ stock in a timely manner. Therefore, stock returns fully reflect all of the available information. The market responds to an announcement about the firm’s environmentally sustainable performance if it makes a real impact on the firm’s operating performance.
Firms’ announcements include the adoption of environment management systems as well as firms’ environmentally friendly and sustainable strategies and operations, both of which make impacts on firms’ costs and revenue. On the cost side, being environmentally sustainable involves the costs in replacing outdated processes and equipments, the costs in reshaping supply chain, and the costs in switching to new management systems and standards. On the revenue side, the environmentally sustainable operations raise the firms’ public image and build up its reputation as responsible firms, which helps the firms to enlarge their market share and contribute more revenue. In addition, the firm’s endeavor in improving environment sustainable performance can help it to reduce operating cost and increase operational efficiency. Empirical results of the stock market reactions to corporate environmentally sustainable performance are mixed. Previous research based on US firms reveal positive stock market reactions to the announcements of environmental performance awards [15], environmental business strategies, environmental philanthropy, ISO 14001 certification [16] and negative stock market reactions to voluntary emission reductions [16,27] and environmental crises [15]. However, literature based on Chinese companies support negative stock market reactions to environmental violation events [18], environmental incidents [19], environmental performance awards [21] and CEIs [20]. In this study, a significant proportion of firms under consideration are from the manufacturing industry. We expect stronger impacts on firms’ cost compared to their benefit in revenue. We hypothesize that environmentally sustainable performances make stronger impacts on Chinese firms’ costs compared to their benefits in revenue. Therefore, it may hurt firms’ profitability in the short to medium term. We propose our first hypothesis as follows.
Hypothesis 1.
The stock market reacts negatively to the announcements of environmentally sustainable operations in China.
Industry segmentation plays an important role in determining the significance and scale of stock market reactions to firms’ environmentally sustainable announcements. Firms from different industries perform differently in controlling pollution and environmental issues. For example, industries such as textile and petroleum processing generate more pollution on average. While other industries, such as wholesale, are cleaner. The costs and benefits of being environmentally sustainable are very different for these industries. Therefore, we expect different stock market responses to the announcement of firms from different industries. Our second hypothesis is stated bellow.
Hypothesis 2.
In China, firms in different industries react differently to the environmentally sustainable operations announcement.
The stock market reactions are affected by the attitudes of investors, the government and firms towards environmental problems. Grossman and Krueger [28] find an inverted U-shaped relationship between pollution and per capita income, which is called the environmental Kuznets curve. It reveals the fact that people put higher priority on economic development when their income is low, and pay more attention to environmental quality after becoming richer. During the last two decades, the per capital GDP of China quintupled. The Chinese investors have become more concerned about environmental issues. It may change investors’ attitudes to sample firms’ environmentally sustainable announcement.
Furthermore, in recent years, China has encountered serious environmental problems. Taking air pollution as an example, Figure 1 plots the average air quality index (AQI) of the three big cities in China during year 2008 to year 2015. AQI measures the overall degree of pollution in air. Larger value of AQI implies higher concentration of sulfur dioxide, suspended particulate matter, etc. In many countries, sensitive people are advised to reduce outdoor excises when AQI exceeds 100. The selected cities, which are Beijing, Shanghai and Shenzhen, are all highly developed regions and make significant contribution to the economic development of China. We observe that the AQI has gotten worse in all three cities since 2012. The Chinese people are getting to understand the importance of environmental sustainability on public welfare. The government and environment authority make stricter requirements on firms’ environmental performance, which may significantly influence firms’ operations and decision-making.
Third, the firms’ environmentally sustainable operations may have different impacts in the short and long term. In the short term, the increase in costs dominate the increase in the firms’ future revenues. The abnormal returns should be negative. However, in the long term, the marginal costs of being environmentally sustainable decrease. At the same time, the benefits from the revenue increase and cost savings become more and more significant due to firms’ continuous endeavor in environmentally sustainable improvements. Therefore, the stock market reactions should turn positive as time goes by. Thus, we propose our last hypothesis.
Hypothesis 3.
The stock market reactions to sample firms’ environmentally sustainable operations change with time.
3. Sample and Data
Our sample consists of environmental sustainability related announcements made by firms that are listed on the two stock exchanges in China. We generate our sample through the following procedures.
Firstly, we collect all events about socially responsibility operations of listed firms in China. These events are extracted from the China Listed Firm’s Corporate Social Responsibility Research Database (GTA-CSRR), which include firms’ announcements of socially responsible operations voluntarily disclosed in their corporate social responsibility reports, environmental reports, sustainability reports, corporate citizenship reports, etc. We exclude all announcements that are not related to environmental sustainability. A significant portion of those announcements are about the adoption of environmental management systems, including ISO certified systems such as the ISO 14000, the ISO 14064 for Greenhouse Gas Accounting and Verification, ISO 50001 for energy management, and industry specified systems such as the OEKO-TEX STANDARD100 for the textile industry, Forest Stewardship Council (FSC) Certification for forest management, etc. Other announcements include firms’ endeavors in voluntary emission reduction, adoption of environmentally friendly techniques, energy and material savings, etc. We call a firm environmentally sustainable firm if it has made at least one such announcement.
Secondly, we screen firms according to their CSRC codes and their market types. The CSRC codes is an industry classification system for listed companies, which is created by the China Securities Regulatory Commission. It consist of a Latin letter and a two-digit Arabic numerals. We include firms whose core business is closely related to the manufacturing (CSRC code C13 to C43), wholesale and retail industries (CSRC code F51 to F52) in China. We only consider mainland China based firms, which issue A-share stocks.
Lastly, we exclude unqualified firms from our sample: (i) we first exclude stocks carrying “ST” (special treatment) or “*ST” tags from the sample; (ii) we also exclude the events if more than 40 stock returns out of the total 200-trading-day estimation period of the firm are missing; and (iii) the events with incomplete stock return during the event window are excluded.
We summarize our final sample in Table 1. The sample firms are from the 30 sub-industries. These sub-industries cover more than 48% public firms in China. In addition, 425 of the 1654 firms total are sustainable firms that have made environmentally sustainable operations announcements during the years 2008 to 2016. After clearing six sample firms due to a lack of trading data during the estimation period or event window, 419 firms remain in our final sample. Among which, 216 sample firms are listed on the Shanghai Stock Exchange, while the other 203 sample firms are traded on the Shenzhen Stock Exchange. These sample firms made 1595 environmentally sustainable operations on 347 distinct dates.
4. Methodology
In this work, we use an event study to examine the stock market reactions to the announcements of sustainable operations of sample firms. Event studies have been applied in empirical research for a long time [29]. As it is mentioned in Jacobs et al. [16], event studies have some advantages over other empirical research methods. They provide a standard procedure, which allows researchers to test the significance of the impacts caused by events under concern. The philosophy of an event study lies in the belief that stock markets are efficient, so stock prices reflect information regarding the performance and value of the firm as soon as it is realized. Therefore, one can study the impacts of events on firm performance by comparing the real stock returns during the event period with its counter-party, which is determined by a proper pricing model that excludes the impacts of events. We perform the study following the steps, which are described as below.
- (1)
- Defining eventsEvery announcement in our sample is defined as an instance of event. If more than one sustainable operation of a firm is announced on the same day, we treat them as one single event. We define Day 0 of an event as the date on which the announcement of the event is made. If an announcement is made on a non-trading day, we define Day 0 as the immediate subsequent trading day. The days before (after) Day 0 are labeled as Day −1, Day −2 (Day 1, Day 2), etc. We select a three-day event window, which includes days [−1,1], in this research. Abnormal returns are estimated for all events over the event window. We include Day −1 and Day 1 in the event window to ensure that the information of the events are fully reflected in stock prices.
- (2)
- The pricing model
- (3)
- Estimating abnormal returnsWe follow Jacobs et al. [16] to select a 200-trading-day estimation period, which covers the range starting from Day −210 and ending on Day −11, for each of the events. The ending day of estimation period is two weeks earlier than the event day. It guarantees that the information of events is eliminated. We select the CSI China A Share (Total Return) Index as the proxy of market return. The index is composed of all the A Share stocks actively traded in Shanghai and Shenzhen, which reflects the overall movements of two markets. The historical records of the three risk factors are obtained from the China Stock Market and Accounting Research (CSMAR) Database. Some records of the daily stock return may be missing due to suspension of trading and other reasons. To make our results valid, we exclude an event if more than 40 stock returns out of the total 200-trading-day estimation period of the firm are missing. We also exclude events with incomplete stock returns during the event window. We first estimate the loadings on each risk factor as it is presented in Equation (1). The abnormal return for a stock i from day t is defined as the difference between the real return and the theoretical value predicted by the pricing model (Equation (2)). The pricing model is estimated with stock market data, which is released at least two weeks earlier than the sample firm’s announcement of events. Thus, the abnormal return calculated from Equation (2) represents the extra return caused by the event. A significant positive (negative) abnormal return serves as evidence of a causal link between the announcement of environmentally sustainable operations and increase (decrease) in firm value:
- (4)
- Testing statisticsIf the sample deviates from zero significantly, we identify a causal link between the event and the stock return. Thus, we can conclude that events of environmentally sustainable operations have a significant impact on stock return. Being consistent with previous works, we use a Student’s t-test to examine the statistical significance of sample mean abnormal return (Equation (3)) and the cumulative abnormal return (Equation (4)):
The Student’s t-test works well for normal populations or large samples. However, the distribution of stock returns usually has a thicker tail than normal distribution. When dealing with small samples, the t-test is no longer appropriate. To guarantee the robustness of our results, we also report the result of the Wilcoxon signed-rank test and the generalized sign test.
5. Results
5.1. Stock Market Reaction for the Whole Sample
We first study the stock market reaction to firms’ environmentally sustainable operations with the whole sample, which consists of 1595 different events. In Table 2, we report the sample firms’ abnormal returns on Day −1, Day 0, Day 1 as well as the cumulative abnormal returns during the three-day event window, i.e., days [−1,1]. We observe significant negative abnormal returns on Day −1 and Day 0. On Day −1, the median abnormal return is −0.10%, and 47.34% of abnormal returns are positive. Sharper results are observed on Day 0, in both scale and statistic significance. The mean value and median of the abnormal return are −0.51% and −0.5%, and only 40.38% of abnormal returns are positive. On Day 1, the abnormal returns become positive; however, the result is not significant. During the whole three-day event window, the mean and median of abnormal return are −0.46% and −0.56%, both of which are significant at the 1% level. Only 43.95% of abnormal returns for the events are positive, which is significantly less than 50% at the 1% level.
Our result strongly supports the argument that the environmentally sustainable announcements have negative impacts on the stock return. However, the market reaction becomes less significant on the day after the event day. Our result is not completely consistent with literature based on US companies [16,27]. Significant positive market reactions to announcement of CEIs were observed in [16]. However, the stock market reacts negatively to firms’ environmentally sustainable announcements in China according to our results. However, the market reacts negatively to voluntary emission reductions events in the US, and our result is more significant in both statistics (0.01 vs. 0.1) and in scale (−0.51% vs. −0.23%). Our result is consistent with the research works based on Chinese companies [18,19,20,21]. In our study, the mean abnormal return is 10.51% on Day 0, which is significant at the 0.01 level. The abnormal returns for the environmental incidents [19], the CEIs [20] and the environmental awards [21] are −0.41% (days [−1,0]), −0.28% (days[0,1]) and −0.6% (days[−1,1]), which are significant at the level of 5%, 5% and 10% respectively. Our result is more significant either in scale or in statistics.
5.2. Stock Market Reaction for Different Industries
To investigate the stock market reactions for different industries, we construct subsamples of announcements of environmentally sustainable operations according to the firms’ CSRC codes. In generating subsamples, we exclude a sample if its size is less than 10. Finally, 24 subsamples have been formed. The sample sizes vary from 11 to 201. These subsamples cover 80% categories of sub-industries and more than 97% of events of the original whole sample.
Table 3 reports the mean, median and percentage of positive abnormal returns during the whole event window (days [−1,1]) for each sub-industry. There is significant evidence that supports negative stock market reactions in 13 sub-industries. Among the 24 subsamples, 10 subsamples return significant negative mean abnormal returns, and another 10 subsamples return significant negative median abnormal returns. We also observe in 10 subsamples that the percentage of positive abnormal returns is less than 50%, which is statistically significant. The average mean abnormal return and the average median abnormal return for significant subsamples are −1.65% and −1.47%. On average, 36.48% of abnormal returns are positive for significant subsamples.
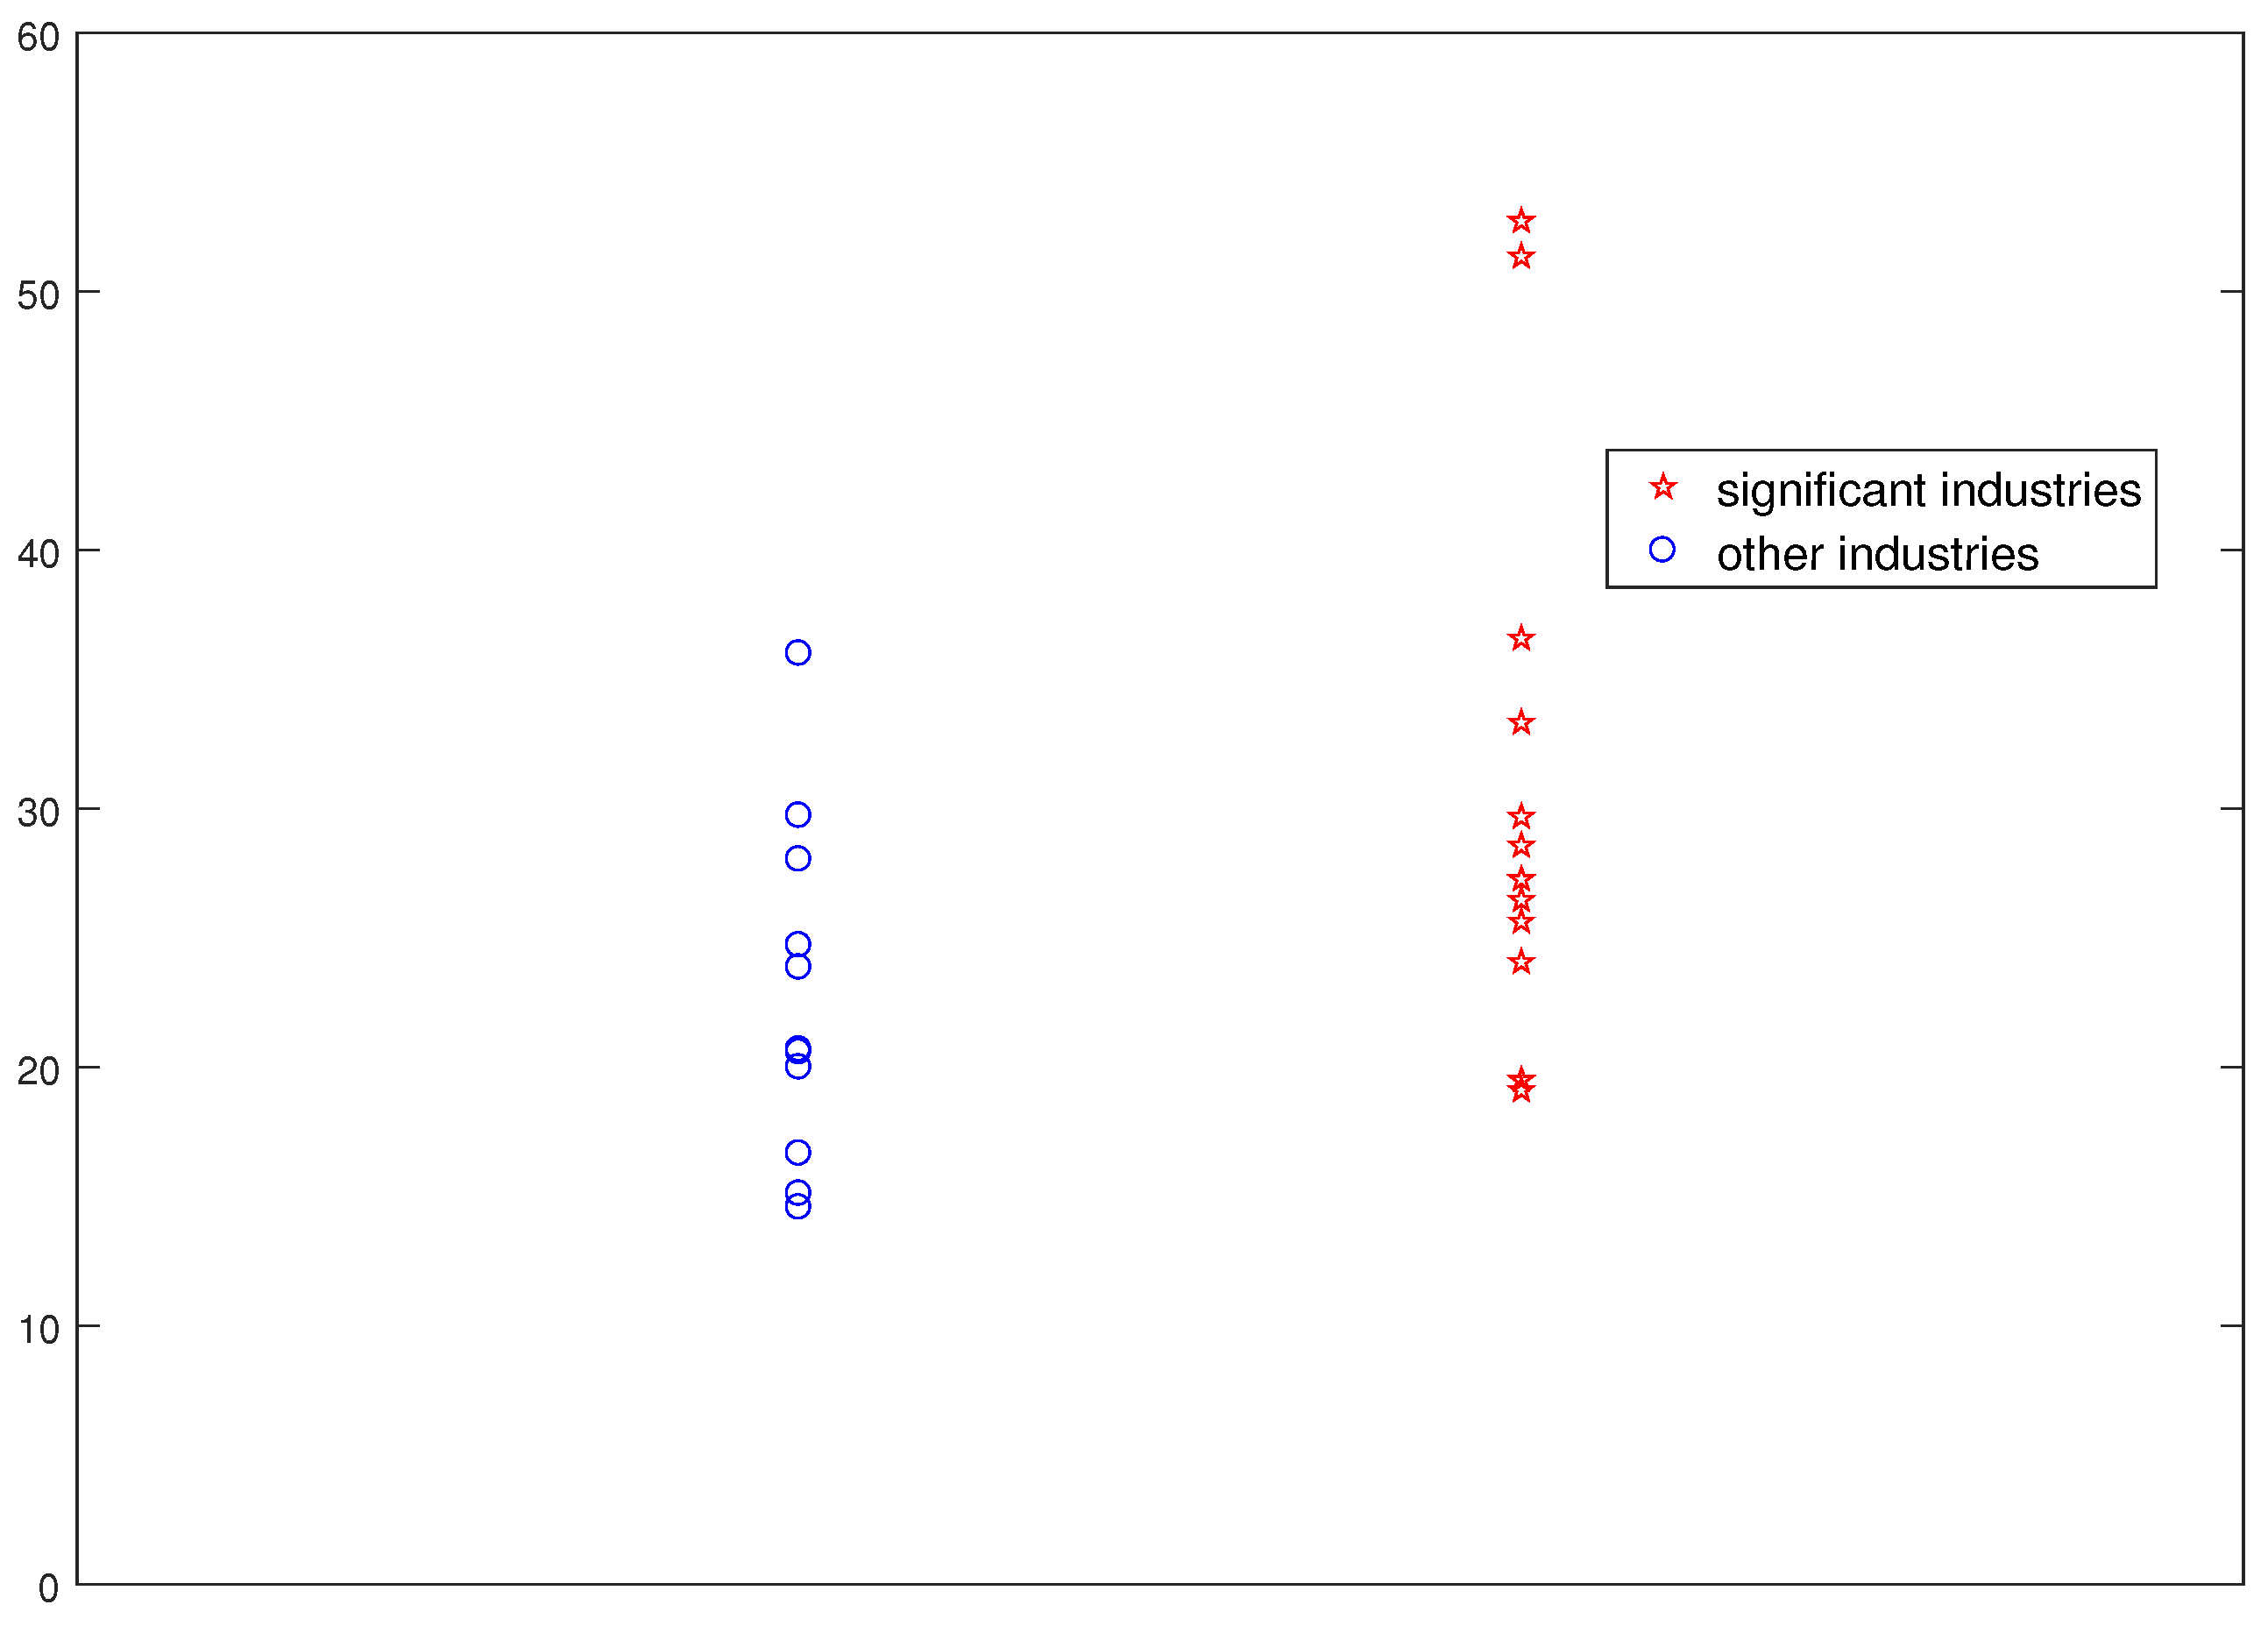
There are two interesting observations. First, we observe a higher percentage of sustainable firms in the industries that report significant stock market reaction (significant industries). We calculate the percentage of sustainable firms for each industry in our sample and divide the industries into two groups. One group consists of significant industries, and the other group consists of insignificant industries. We plot the percentage of sustainable firms for industries from the two groups in Figure 2. The circles and pentagrams represent the percentage of sustainable firms for the insignificant and significant industries, respectively. The percentage of sustainable firms is higher in the group of significant industries. This observation has been verified via a hypothesis test. Our result shows that the sample mean of the significant industries (30.89%) is greater than the insignificant industries (22.73%) with a 0.05 level of significance. The result remains significant with a 0.1 level of significance if we exclude the two largest values, which may be outliers, from the significant industries. For the industries that have a higher percentage of environmentally sustainable firms, more information about the consequences of being environmentally sustainable is available. Investors can make more consistent predictions on firm values after their environmentally sustainable announcements. It explains why significant sub-industries are associated with a higher percentage of sustainable firms.
The second observation is that the scale of abnormal returns varies among different sub-industries. We find that the stock market has positive reactions for certain sub-industries, such as textile garment and apparel industries (C18), papermaking and paper product industries (C22), etc. However, none of the reactions are significant. All significant sub-industries generate negative reactions. For some industries, such as industries of petroleum processing, coking, and nuclear fuel processing, and (C25) industries of rubber and plastic products (C29), the mean abnormal returns are relatively high in scale. For some other industries, such as wholesale industries (F51), the mean abnormal returns are relatively low in scale. This difference may be due to the difference in the nature of business for each industry. For example, the manufacturing process of petroleum, nuclear fuel, rubber and plastic products produces a lot of waste and pollution. Being environmentally sustainable requires expensive technology, costly process re-engineering, etc., which causes negative stock market reactions. For industries such as wholesale, environmentally sustainable operations do not bring significant costs, so the stock market reactions are not significant in scale.
We note that the differences in firms’ financial indicators are other possible reasons for differences in stock market reactions [15,24,30]. Table 4 displays statistics of firm size and book-to-market ratio (B/M) for different industries. The two financial indicators vary among industries. However, these differences are not reflected in the market model of stock return. It may cause bias in estimating abnormal returns. We perform a robustness check of our results by controlling the firm size and B/M in Section 5.4.
5.3. Stock Market Reaction in Different Years
We quantify the stock market reactions to firms’ environmentally sustainable announcements during the whole event window (days [−1,1]) in each calender year. Results are summarized in Table 5. Our first observation is that the number of environmentally sustainable announcements increases steadily since 2010. In 2016, our sample firms made 235 announcements, which is more than three times compared to year 2009. Second, the stock market reactions are very significant from 2011 to 2016. The mean abnormal returns for 2011, 2012, 2013, and 2014 are −1.32%, −1.31%, −0.90% and −0.88% while the median abnormal returns are −1.34%, −1.04%, −1.20% and −1.12%. Furthermore, 31.77%, 38.49%, 38.26% and 39.71% of abnormal returns are positive for the same years. All of the above statistics are significant at the 0.01 level. The mean and median of abnormal returns are significant in 2015 and 2016 with a level of significance no greater than 0.05. Third, the abnormal returns have increased in scale since 2011. In 2011, the mean and median of abnormal returns are −1.32% and −1.34%, which increase to 0.53% and 0.60% in 2016. The portion of positive abnormal returns increases from 31.77% to 58.72% during the same period. These observations are consistent with our analysis in Section 2.
5.4. Controlling the Firm Size and the Book-To-Market Ratio (B/M)
So far, we did not consider firms’ financial indicators, which vary among industries. To control the firm size and the book-to-market ratio, we use the famous Fama–French three factor model (Equation (5)) to estimate the required return of stocks. Fama and French [31] propose a linear model to explain the risk premium of stocks and bonds with three common risk factors including the market risk, the firm size and the firm price-to-book ratio:
In Equation (5), the subscription i and t stand for i-th stock and date, respectively. is the return of stock i from day t. is the risk-free rate in day t. The market premium, which is the value-weighted market return minus the risk-free rate , is denoted by . and are daily returns on zero-cost portfolio that mimic the effect of company size and book-to-market ratio, respectively. The Fama–French three factor model is proved to be able to better explain risk return of stocks than the traditional single factor market model:
We analyze the stock market reactions of the whole sample and every sub-industry with the Fama–French three factor model. All three-factor data are retrieved from the CSMAR database. We report our results in Table 6 and Table 7. We find that the results are very consistent with the one obtained with the simple market model. The market makes significant negative reactions to firms’ environmentally sustainable announcements on Day 0, Day 1 and during days [−1,1]. On Day 0, the mean and median of abnormal returns are −0.57% and −0.65%, and both are significant at the 1% level. In addition, 37.43% abnormal returns are positive, which is significantly less than 50% at the 1% level. On Day 1, although the results support negative stock market reactions, they are less significant in scale. The mean and median of abnormal returns are −0.09% and −0.18%, and 45.71% of abnormal returns are positive. During the whole event window (days [−1,1]), the mean and median of abnormal returns are −0.65% and −0.60%, and both are significant at the 0.01 level. Furthermore, 42.82% abnormal returns are positive, which is significantly less than 50% at the 0.01 level.
The Fama–French three factor model abnormal returns are consistent with the simple market abnormal returns. Both of them support strong negative stock market reactions on Day 0 and during days [−1,1]. However, after controlling the firm size and the book-to-market ratio, the reactions are slightly stronger.
Table 7 displays the stock market reaction during the whole event window (days [−1,1]) for each industry after controlling the firm size and the book-to-market ratio. There is significant evidence that supports negative stock market reactions in 12 sub-industries. Among the 24 subsamples, 11 subsamples return significant negative mean abnormal returns, and another 11 subsamples return significant negative median abnormal returns. We also observe that the percentage of positive abnormal returns of eight subsamples are significantly less than 50%. The average mean abnormal return and the average median abnormal return for significant subsamples are −1.79% and −1.43%. On average, 36.85% of abnormal returns are positive for significant subsamples.
The results are consistent with the one from the simple market model. The industries, which suffer from significant negative stock market reactions in the Fama–French three factor model, also generate significant negative stock market reactions in the simple market model. As a result, we confirm that significant industries have a higher percentage of environmentally sustainable firms. The sample mean of the percentage of the significant sub-industries (31.87%) is greater than the insignificant sub-industries (22.43%), with a 0.01 level of significance. The result remains significant with a 0.05 level of significance if we exclude the two largest values from the significant sub-industries.
We sort the significant industries by their mean abnormal returns. We find that the order is largely the same as the simple market model. It confirms that the scale of the stock market return is correlated with the nature of the industry.
6. Conclusions
In this paper, we investigate the effects of environmentally sustainable announcements of Chinese firms in the manufacturing, wholesale and retail industries on its stock market performance. We first study the stock market reactions to the firms’ announcements on environmentally sustainable operations with the whole sample. We find the stock market reacts negatively to the firms’ environmentally sustainable announcements. We study the market response during the whole three-day event window in each sub-industry. The result shows that almost half of the 24 sub-industries make significant responses, which are all negative, to environmentally sustainable announcements. Our analysis shows that there is a significant correlation between the significance of stock market reactions and the number (in percent) of sustainable firms in the sub-industry. We also find that the scale of abnormal returns differs among industries. We study the market responses during the event window for each year. An increasing trend in the abnormal returns is observed. Finally, we control the firm size and the book-to-market ratio with the Fama–French three factor model. The result is highly consistent with the one from the simple market model.
There are several limitations in this work. First, we do not distinguish the corporate environmental Initiatives (CEIs) and environmental awards and certifications (EACs). In our sample, firms usually release information about CEIs and EACs on the same day. Thus, we can not study the stock market reactions of CEIs and EACs separately. Second, although we find a correlation between the significance of stock market reactions and the number (in percent) of sustainable firms in the sub-industry, we are not able to identify the causal link between them. Third, we did not study the time pattern of the stock market reactions for each sub-industry in every year. The main reason is that this will decrease the sample sizes for many sub-industries. Lastly, although we investigated the market reactions for each industry, we did not find the determinants of the difference in market reaction. This can be an interesting direction for future research.
Acknowledgments
We thank the two anonymous reviewers and the editor for their comments, which helped us improve the paper. Biao was supported by “the Fundamental Research Funds for the Central Universities (2017)”, and “the Innovative Research Team Project: Financial Risk Management” provided by the Zhongnan University of Economics and Law. Kekun was supported by the Start-Up Grant (31541410505) and the General Research Grant (31541310516) from the Zhongnan University of Economics and Law. This article is funded by the Collaborative Innovation Center of the Industrial Upgrading and Regional Finance (Hubei).
Author Contributions
Biao Li and Kekun Wu designed the study. Biao Li was responsible for the data collection and statistical methods. Kekun Wu analyzed the data and wrote the entire manuscript. All authors read and approved the final manuscript for submission.
Conflicts of Interest
The authors declare no conflict of interest.
References
- Mees, H. China as the World’s Factory. In The Chinese Birdcage; Palgrave Macmillan: New York, NY, USA, 2016; pp. 21–32. [Google Scholar]
- China Statistical Yearbook 2016. Available online: http://www.stats.gov.cn/tjsj/ndsj/2016/indexeh.htm (accessed on 12 April 2017).
- World Trade Statistical Review 2016. Available online: https://www.wto.org/english/res_e/statis_e/wts2016_e/wts16_toc_e.htm (accessed on 12 April 2017).
- Made in China? Available online: https://www.economist.com/news/leaders/21646204-asias-dominance-manufacturing-will-endure-will-make-development-harder-others-made (accessed on 15 August 2017).
- Ma, J.; Wang, J.; Collins, M.; Wu, M.; Orlins, S.; Li, J. Textile Phase II Report—Sustainable Apparel’s Critical Blindspot. Available online: http://wwwen.ipe.org.cn/reports/NewsReport.aspx (accessed on 12 April 2017).
- Lvse Jiangnan Public Environmental Concerned Center; Zhaolu Environmental Protection and Commonweal Service Center; Green Home of Fujian; The Institute of Public and Environmental Affairs; Friends of Nature; Nature University. Green Choice Alliance Phase III Textile Industry Report—New Standards Put Brand Responsibility to the Test. Available online: http://wwwen.ipe.org.cn/reports/NewsReport.aspx (accessed on 12 April 2017).
- Yuan, Y.; Ma, Y.; Ma, J.; Li, J.; Yuan, Y.; Collins, M.; Guo, M.; Fang, Y.; Tian, J.; Greer, L.; et al. Green Choice Alliance Phase 4 Textile Industry Report—No Excuses: Taking Full Responsibility for Pollution from Manufacturing. Available online: http://wwwen.ipe.org.cn/reports/NewsReport.aspx (accessed on 12 April 2017).
- Lvse Jiangnan, The Institute of Public and Environmental Affairs. Toyota Supplier’s Air Emissions Continually Disturb Residents—Toyota Motor Supply Chain Pollution Investigation 1. Available online: http://wwwen.ipe.org.cn/reports/NewsReport.aspx (accessed on 12 April 2017).
- The Institute of Public and Environmental Affairs, Lvse Jiangnan. Toyota Breaks the Silence: More Pollution Issues Await Follow-Up: Toyota Motor Supply Chain Pollution Investigation 2. Available online: http://wwwen.ipe.org.cn/reports/NewsReport.aspx (accessed on 12 April 2017).
- Friends of Nature; Institute of Public and Environmental Affairs; Green Beagle. 2010 Study of Heavy Metal Pollution by IT Brand Supply Chain—The IT Industry Has a Critical Duty to Prevent Heavy Metal Pollution. Available online: http://wwwen.ipe.org.cn/reports/NewsReport.aspx (accessed on 12 April 2017).
- Friends of Nature; Institute of Public and Environmental Affairs; Green Beagle. 2010 Study of Heavy Metal Pollution by IT Brand Supply Chain (Phase II)—29 IT Brands’ Responses and Consumers’ Green Choice. Available online: http://wwwen.ipe.org.cn/reports/NewsReport.aspx (accessed on 12 April 2017).
- Friends of Nature; Institute of Public and Environmental Affairs; Green Beagle. Investigative Report on I.T. Industry Heavy Metals Pollution (Phase III)—Green Choice Consumers Urge the I.T. Brands to Break their Silence. Available online: http://wwwen.ipe.org.cn/reports/NewsReport.aspx (accessed on 12 April 2017).
- Lv Se Jiang Nan Public Environmental Concerned Center; The Institute of Public and Environmental Affairs; Friends of Nature; Envirofriends; Nature University. Who is Polluting the Taihu Basin?—Green Choice Alliance IT Industry Supply Chain Investigative Report (Phase VII). Available online: http://wwwen.ipe.org.cn/reports/NewsReport.aspx (accessed on 12 April 2017).
- Still made in China. Available online: https://www.economist.com/news/special-report/21663332-chinese-manufacturing-remains-second-none-still-made-china (accessed on 15 August 2017).
- Klassen, R.D.; McLaughlin, C.P. The impact of environmental management on firm performance. Manag. Sci. 1996, 42, 1199–1214. [Google Scholar] [CrossRef]
- Jacobs, B.W.; Singhal, V.R.; Subramanian, R. An empirical investigation of environmental performance and the market value of the firm. J. Oper. Manag. 2010, 28, 430–441. [Google Scholar] [CrossRef]
- Arora, P.; Hora, M.; Singhal, V.; Subramanian, R. When do Appointments of Corporate Sustainability Executives affect Shareholder Value? (28 March 2017). Georgia Tech Scheller College of Business Research Paper No. 17-17. Available online: https://www.scheller.gatech.edu/directory/phd/arora/pubs/CSEAppointments_Final.pdf (accessed on 8 June 2017).
- Xu, X.D.; Zeng, S.X.; Tam, C.M. Stock market’s reaction to disclosure of environmental violations: Evidence from China. J. Bus. Ethics 2012, 107, 227–237. [Google Scholar] [CrossRef]
- Lo, C.; Tang, C.S.; Zhou, Y.; Yeung, A.C.; Fan, D. Environmental Incidents and the Market Value of Firms: An Empirical Investigation in the Chinese Context. Working Paper. 2017. Available online: https://ssrn.com/abstract=2987976 (accessed on 16 June 2017).
- Lam, H.K.; Yeung, A.C.; Cheng, T.C.; Humphreys, P.K. Corporate environmental initiatives in the Chinese context: Performance implications and contextual factors. Int. J. Prod. Econ. 2016, 180, 48–56. [Google Scholar] [CrossRef]
- Lyon, T.; Lu, Y.; Shi, X.; Yin, Q. How do investors respond to Green Company Awards in China? Ecol. Econ. 2013, 94, 1–8. [Google Scholar] [CrossRef]
- Kleindorfer, P.R.; Singhal, K.; Wassenhove, L.N. Sustainable operations management. Prod. Oper. Manag. 2005, 14, 482–492. [Google Scholar] [CrossRef]
- Drake, D.F.; Spinler, S. OM Forum-Sustainable Operations Management: An Enduring Stream or a Passing Fancy? Manuf. Ser. Oper. Manag. 2013, 15, 689–700. [Google Scholar] [CrossRef]
- Lo, C.K.; Yeung, A.C.; Cheng, T.C. The impact of environmental management systems on financial performance in fashion and textiles industries. Int. J. Prod. Econ. 2012, 135, 561–567. [Google Scholar] [CrossRef]
- Li, B.; Wu, K. Environmental Management System Adoption and the Operational Performance of Firm in the Textile and Apparel Industry of China. Sustainability 2017, 9, 992. [Google Scholar] [CrossRef]
- Wu, K. Social Sustainable Performance and the Market Value of the Firm in Textile and Apparel Industry of China. Unpublished work. 2017. [Google Scholar]
- Jacobs, B.W. Shareholder value effects of voluntary emissions reduction. Prod. Oper. Manag. 2014, 23, 1859–1874. [Google Scholar] [CrossRef]
- Grossman, G.M.; Krueger, A.B. Economic growth and the environment. Q. J. Econ. 1995, 110, 353–377. [Google Scholar] [CrossRef]
- MacKinlay, A.C. Event studies in economics and finance. J. Econ. Lit. 1997, 35, 13–39. [Google Scholar]
- Barber, B.M.; Lyon, J.D. Detecting abnormal operating performance: The empirical power and specification of test statistics. J. Financ. Econ. 1996, 41, 359–399. [Google Scholar] [CrossRef]
- Fama, E.F.; French, K.R. Common risk factors in the returns on stocks and bonds. J. Financ. Econ. 1993, 33, 3–56. [Google Scholar] [CrossRef]
Figure 1.
Average air quality index (AQI) in cities of China during year 2008 to year 2015. The axis and axis represent the year and average AQI respectively.
Figure 1.
Average air quality index (AQI) in cities of China during year 2008 to year 2015. The axis and axis represent the year and average AQI respectively.
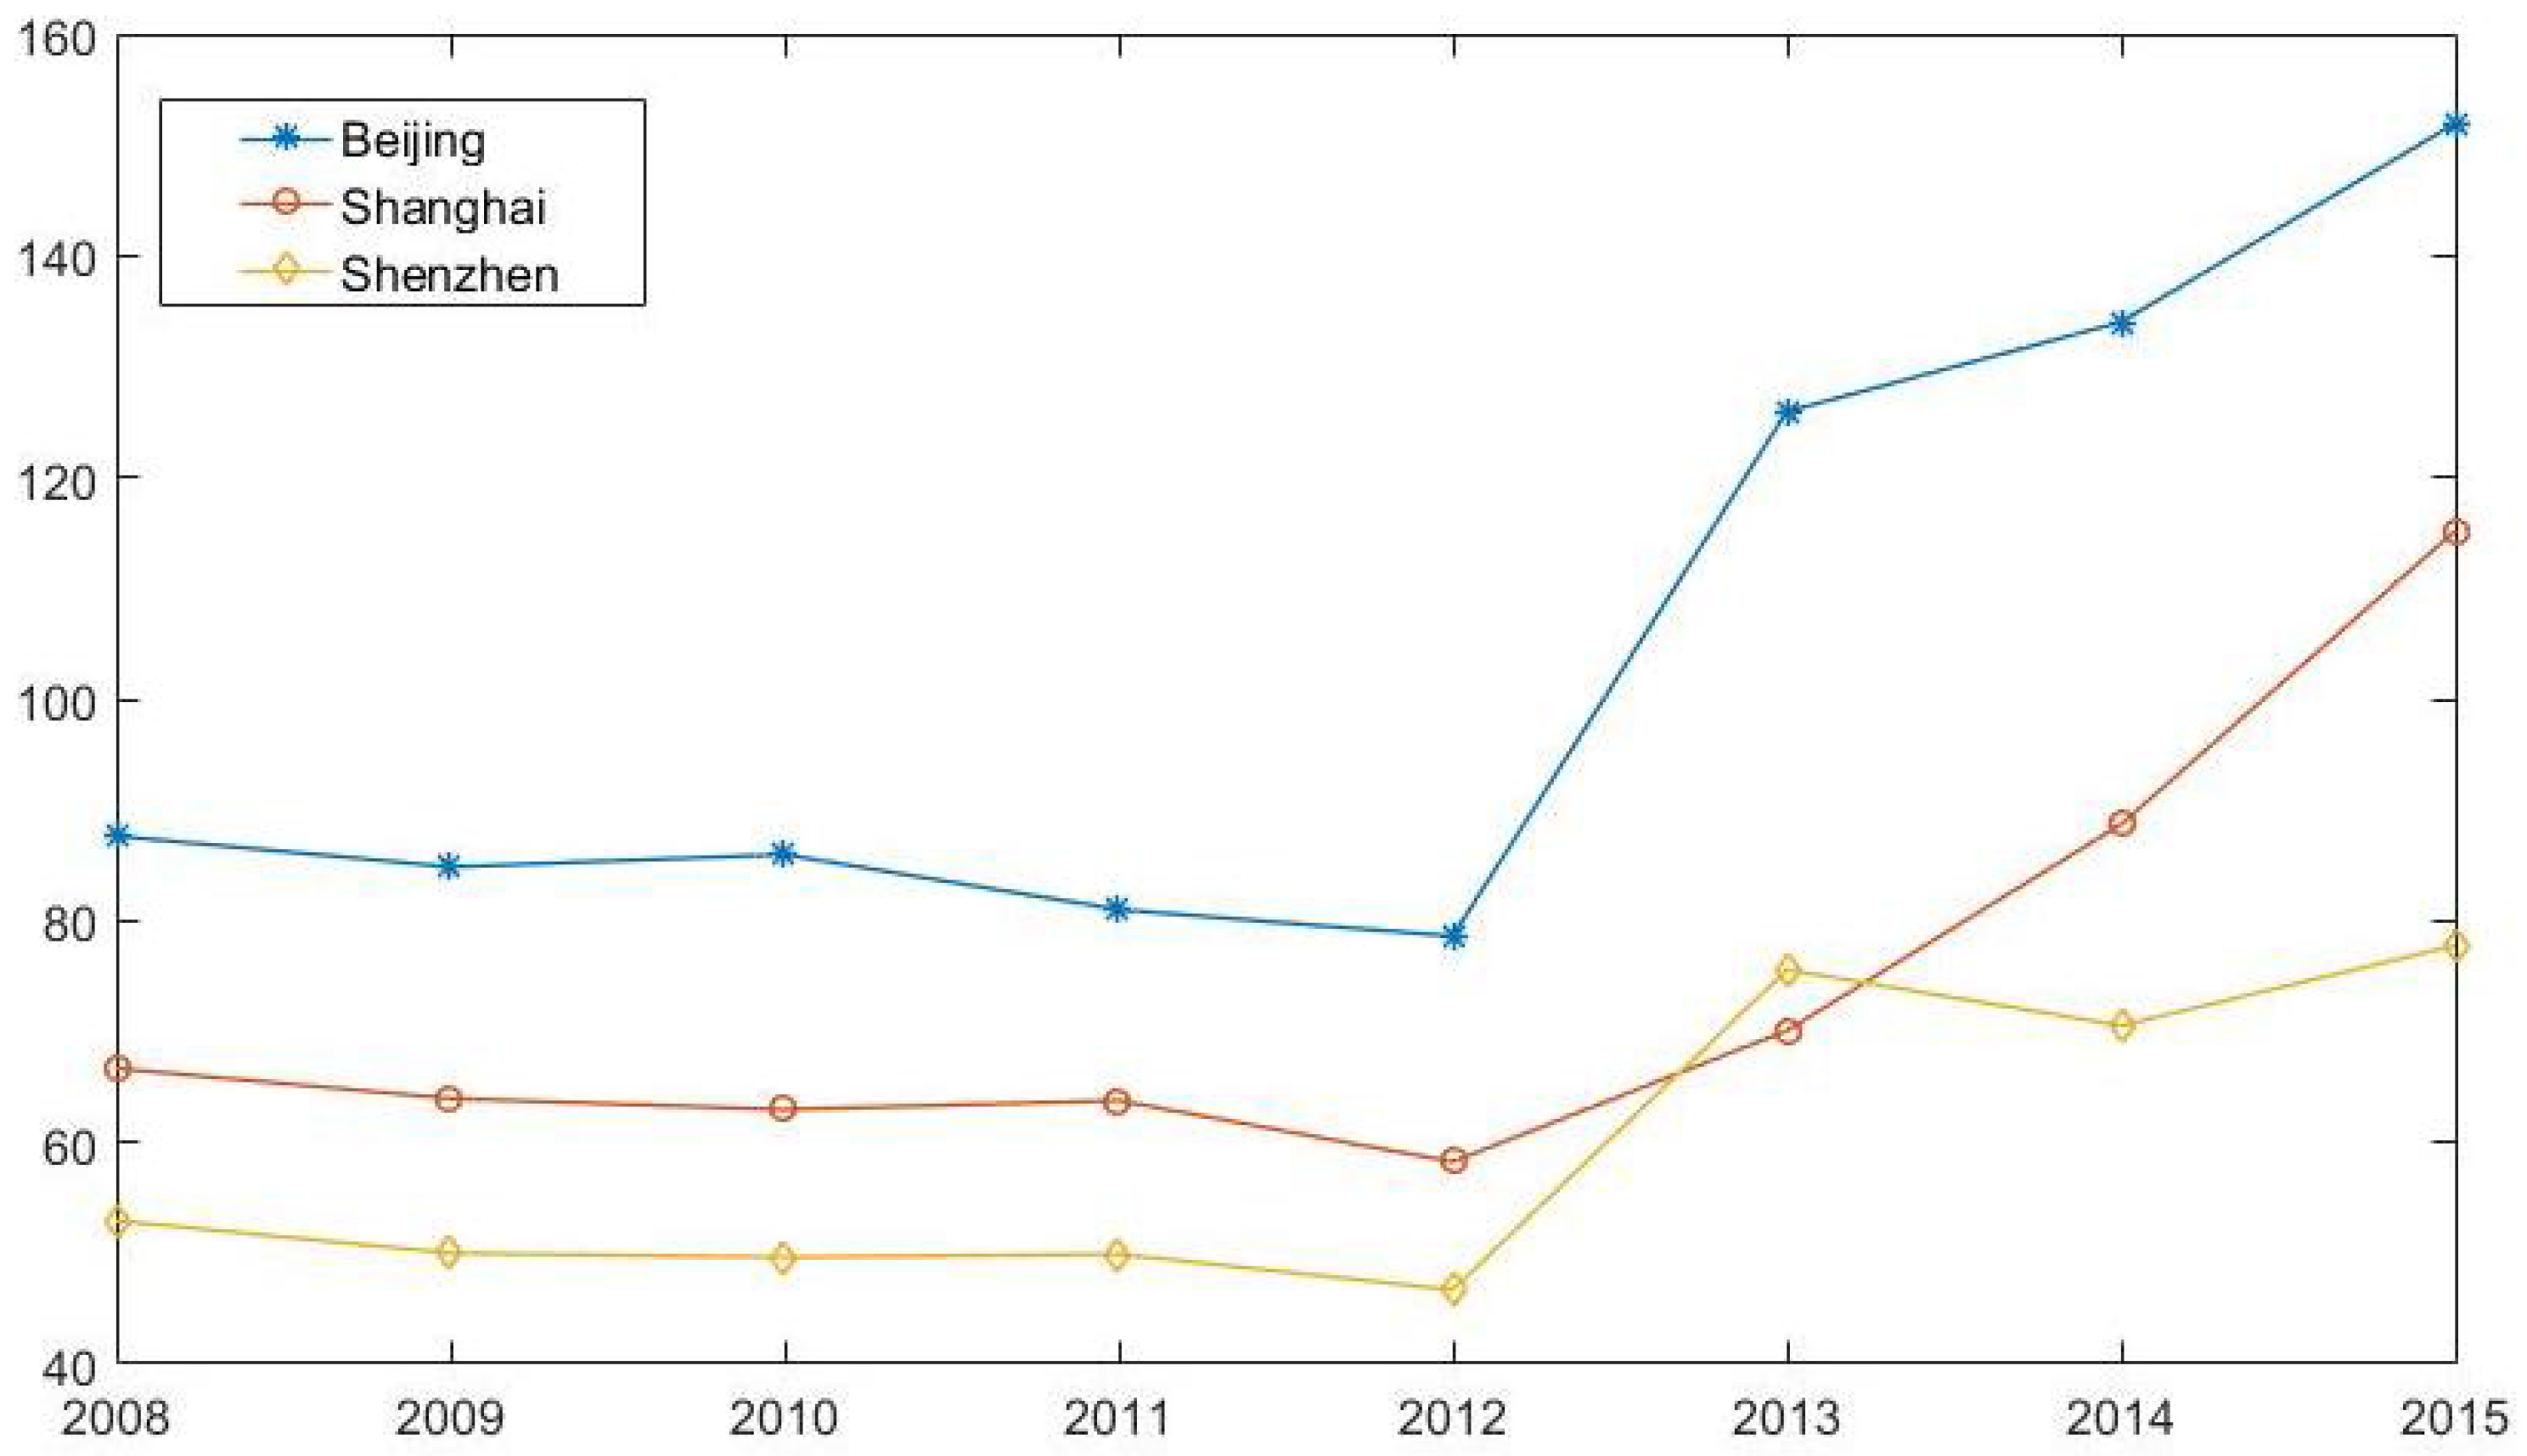
Figure 2.
The percentage of environmentally sustainable firms for the significant and insignificant subsamples. Circles represent the percentage of sustainable firms of subsamples, for which there is no significant stock market reaction. Pentagrams represent the percentage of sustainable firms of subsamples, for which there is significant stock market reaction.The axis represents the percentage of environmental sustainable firms.

Table 1.
Description of sample firms.
| CSRC Code | Description | No. of Firms | No. of Sustainable Firms | No. of Events |
|---|---|---|---|---|
| C13 | Agricultural and sideline food processing industry | 35 | 10 | 32 |
| C14 | Food manufacturing | 34 | 7 | 19 |
| C15 | Alcohol, beverage and refined tea manufacturing | 41 | 15 | 75 |
| C17 | Textile industry | 39 | 10 | 39 |
| C18 | Textile garment and apparel industry | 29 | 6 | 14 |
| C19 | Leathers, furs, feathers and related products and footwear industry | 8 | 2 | 9 |
| C21 | Furniture manufacturing | 13 | 1 | 1 |
| C22 | Papermaking and paper product industry | 25 | 9 | 22 |
| C23 | Printing and recording media reproduction industry | 10 | 2 | 6 |
| C24 | Manufacturing of stationery, industrial arts, sports and entertainment supplies | 9 | 2 | 4 |
| C25 | Industries of petroleum processing, coking, and nuclear fuel processing | 18 | 6 | 25 |
| C26 | Manufacturing of chemical raw materials and chemical products | 162 | 39 | 136 |
| C27 | Pharmaceutical industry | 136 | 36 | 133 |
| C28 | Chemical fiber manufacturing | 20 | 4 | 17 |
| C29 | Industry of rubber and plastic products | 41 | 8 | 21 |
| C30 | Industry of non-metallic mineral products | 64 | 19 | 84 |
| C31 | Industry of ferrous metal smelting and rolling processing | 37 | 19 | 84 |
| C32 | Industry of non-ferrous metal smelting and rolling processing | 55 | 29 | 123 |
| C33 | Metal product industry | 48 | 7 | 34 |
| C34 | Industry of non-ferrous metal smelting and rolling processing | 89 | 22 | 71 |
| C35 | Special-purpose equipment manufacturing | 107 | 30 | 103 |
| C36 | Automobile manufacturing | 88 | 21 | 89 |
| C37 | Manufacturing of railways, ships, aircrafts, spacecrafts and other transportation equipment | 33 | 9 | 42 |
| C38 | Electric machinery and equipment manufacturing | 144 | 24 | 99 |
| C39 | Manufacturing of computers, communications and other electronic equipment | 185 | 55 | 201 |
| C40 | Instrument and meter manufacturing | 11 | 3 | 11 |
| C41 | Other manufacturing industries | 15 | 3 | 5 |
| C42 | Industry of comprehensive utilization of waste resources | 4 | 1 | 7 |
| F51 | Wholesale industry | 68 | 13 | 45 |
| F52 | Retail industry | 86 | 13 | 44 |
| Total | 1654 | 425 | 1595 |
Table 2.
The market model abnormal returns for the whole sample.
| Day −1 | Day 0 | Day 1 | Days [−1,1] | |
|---|---|---|---|---|
| Mean abnormal return | −0.00% | −0.51% | 0.05% | −0.46% |
| -statistic | 0.05 | −6.96 *** | 0.83 | −3.78 *** |
| Median abnormal return | −0.10% | −0.50% | 0.02% | −0.56% |
| -statistic | −1.28 * | −8.31 *** | 0.04 | −5.01 *** |
| % abnormal returns positive | 47.34% | 40.38% | 50.53% | 43.95% |
| -statistic | −2.10 ** | −7.66 *** | 0.40 | −4.81 *** |
*** significant at the 0.01 level; ** significant at the 0.05 level; * significant at the 0.10 level.
Table 3.
The market model abnormal returns for different industries.
| CSRC Code | N | Mean | - Statistic | Median | -Statistic | % Positive | -Statistic |
|---|---|---|---|---|---|---|---|
| C13 | 32 | −1.47% | −1.71 ** | −1.33% | −1.45 * | 43.75% | −0.53 |
| C14 | 19 | −1.15% | −0.89 | −1.45% | −0.70 | 47.37% | 0.00 |
| C15 | 75 | −0.94% | −1.95 ** | −0.84% | −2.04 ** | 41.33% | −1.39 * |
| C17 | 39 | −1.55% | −1.72 ** | −1.73% | −1.86 ** | 35.90% | −1.60 * |
| C18 | 14 | 2.04% | 1.20 | 1.79% | 0.88 | 64.29% | 0.80 |
| C22 | 22 | 0.60% | 0.76 | 0.08% | 0.19 | 50.00% | 0.21 |
| C25 | 25 | −2.16% | −2.33 ** | −1.46% | −1.94 ** | 40.00% | −0.80 |
| C26 | 136 | −0.84% | −1.98 ** | −0.63% | −2.33 *** | 41.18% | −1.97 ** |
| C27 | 133 | −0.96% | −2.94 *** | −0.84% | −3.23 *** | 37.59% | −2.77 *** |
| C28 | 17 | 0.34% | 0.22 | 0.58% | 0.24 | 52.94% | 0.00 |
| C29 | 21 | −1.96% | −1.48 * | −0.49% | −1.08 | 42.86% | −0.44 |
| C30 | 84 | −0.42% | −0.81 | −0.49% | −1.11 | 40.48% | −1.64 * |
| C31 | 84 | −0.61% | −1.35 * | −0.97% | −1.99 ** | 39.29% | −1.85 ** |
| C32 | 123 | −0.78% | −1.84 ** | −1.12% | −2.31 ** | 37.40% | −2.71 *** |
| C33 | 34 | −0.10% | −0.11 | 0.17% | −0.27 | 52.94% | 0.17 |
| C34 | 71 | 0.13% | 0.23 | −0.07% | 0.13 | 47.89% | −0.24 |
| C35 | 103 | −0.29% | −0.56 | −0.14% | −0.76 | 49.51% | 0.00 |
| C36 | 89 | −0.16% | −0.39 | −0.81% | −0.73 | 43.82% | −1.06 |
| C37 | 42 | −0.64% | −1.08 | −1.10% | −1.29 * | 35.71% | −1.70 ** |
| C38 | 99 | 0.39% | 0.64 | −0.22% | −0.11 | 48.48% | −0.20 |
| C39 | 201 | 0.27% | 0.82 | 0.12% | 0.72 | 51.74% | 0.42 |
| C40 | 11 | −5.26% | −3.26 *** | −4.67% | −2.36 *** | 18.18% | −1.81 ** |
| F51 | 45 | −0.13% | −0.16 | −0.87% | −0.62 | 37.78% | −1.49 * |
| F52 | 44 | 0.31% | 0.65 | 0.38% | 0.69 | 56.82% | 0.75 |
*** significant at the 0.01 level; ** significant at the 0.05 level; * significant at the 0.10 level.
Table 4.
Variations in firm size and book-to-market ratio.
| CSRC Code | N | Firm Size (Million Yuan) | Book-to-Market Ratio (%) | ||||||
|---|---|---|---|---|---|---|---|---|---|
| Min | Mean | Max | STD | Min | Mean | Max | STD | ||
| C13 | 32 | 1.68 | 22.45 | 89.12 | 26.17 | 13.57 | 72.19 | 197.74 | 46.42 |
| C14 | 19 | 4.16 | 11.39 | 25.08 | 5.76 | 33.53 | 69.87 | 111.35 | 25.91 |
| C15 | 75 | 1.51 | 26.00 | 141.47 | 32.91 | 14.08 | 50.54 | 139.90 | 23.99 |
| C17 | 39 | 1.09 | 4.77 | 16.60 | 3.22 | 24.52 | 91.42 | 194.53 | 33.42 |
| C18 | 14 | 1.19 | 5.09 | 13.15 | 3.73 | 29.80 | 62.75 | 125.04 | 24.64 |
| C19 | 9 | 2.65 | 4.75 | 9.00 | 1.93 | 33.33 | 68.88 | 102.82 | 21.93 |
| C21 | 1 | 1.53 | 1.53 | 1.53 | 0.00 | 81.53 | 81.53 | 81.53 | 0.00 |
| C22 | 22 | 1.27 | 4.99 | 17.35 | 4.01 | 54.92 | 139.98 | 249.31 | 57.70 |
| C23 | 6 | 1.11 | 5.83 | 13.40 | 5.85 | 23.69 | 37.09 | 56.77 | 13.16 |
| C24 | 4 | 1.22 | 9.53 | 33.71 | 16.12 | 14.94 | 65.50 | 91.00 | 35.84 |
| C25 | 25 | 2.16 | 6.40 | 24.27 | 5.02 | 9.92 | 186.38 | 621.36 | 193.89 |
| C26 | 136 | 1.10 | 9.29 | 48.33 | 8.81 | 17.51 | 138.74 | 768.07 | 119.44 |
| C27 | 133 | 0.77 | 16.90 | 86.39 | 13.13 | 9.24 | 46.24 | 154.93 | 26.70 |
| C28 | 17 | 1.56 | 4.35 | 10.26 | 2.35 | 35.55 | 138.98 | 275.28 | 70.24 |
| C29 | 21 | 1.22 | 6.20 | 13.69 | 3.51 | 19.12 | 104.51 | 263.61 | 74.49 |
| C30 | 84 | 2.17 | 16.29 | 104.18 | 19.15 | 28.09 | 139.36 | 500.43 | 94.26 |
| C31 | 84 | 2.30 | 25.47 | 123.81 | 25.46 | 103.81 | 337.83 | 943.82 | 165.02 |
| C32 | 123 | 1.57 | 18.11 | 85.91 | 17.19 | 8.12 | 125.81 | 473.93 | 93.29 |
| C33 | 34 | 1.12 | 10.46 | 32.26 | 8.63 | 25.90 | 135.43 | 392.48 | 90.93 |
| C34 | 71 | 1.61 | 14.02 | 107.57 | 18.91 | 21.71 | 113.55 | 324.68 | 72.45 |
| C35 | 103 | 2.04 | 17.12 | 140.74 | 21.35 | 18.73 | 106.90 | 363.08 | 80.54 |
| C36 | 89 | 2.47 | 20.93 | 84.18 | 16.54 | 24.55 | 130.23 | 370.61 | 83.00 |
| C37 | 42 | 3.73 | 48.81 | 267.35 | 54.52 | 26.78 | 111.97 | 275.08 | 72.51 |
| C38 | 99 | 2.06 | 20.04 | 169.61 | 24.88 | 15.25 | 89.69 | 260.76 | 57.39 |
| C39 | 201 | 1.23 | 16.36 | 163.98 | 20.62 | 11.80 | 99.40 | 927.67 | 118.69 |
| C40 | 11 | 1.56 | 6.22 | 14.03 | 4.67 | 19.88 | 60.16 | 99.32 | 27.43 |
| C41 | 5 | 1.22 | 2.41 | 4.31 | 1.29 | 38.76 | 65.31 | 104.41 | 25.44 |
| C42 | 7 | 6.37 | 9.69 | 16.67 | 4.44 | 19.08 | 73.83 | 110.00 | 37.59 |
| F51 | 45 | 1.95 | 12.56 | 41.79 | 9.49 | 19.15 | 163.94 | 620.53 | 142.50 |
| F52 | 44 | 1.61 | 18.71 | 96.50 | 25.68 | 24.12 | 100.31 | 195.38 | 44.22 |
| Total | 1595 | 0.77 | 16.83 | 267.35 | 21.80 | 8.12 | 117.20 | 943.82 | 110.16 |
Table 5.
The market model abnormal returns in different years.
| Year | N | Mean | -Statistic | Median | -Statistic | % Positive | -Statistic |
|---|---|---|---|---|---|---|---|
| 2009 | 74 | −0.75% | −1.06 | −0.75% | −1.37 * | 43.24% | −1.05 |
| 2010 | 72 | 0.39% | 0.80 | 0.18% | 0.47 | 52.78% | 0.35 |
| 2011 | 192 | −1.32% | −4.47 *** | −1.34% | −4.61 *** | 31.77% | −4.98 *** |
| 2012 | 239 | −1.31% | −4.53 *** | −1.04% | −4.31 *** | 38.49% | −3.49 *** |
| 2013 | 264 | −0.90% | −2.90 *** | −1.20% | −3.73 *** | 38.26% | −3.75 *** |
| 2014 | 272 | −0.88% | −3.14 *** | −1.12% | −3.52 *** | 39.71% | −3.33 *** |
| 2015 | 247 | 0.86% | 2.33 ** | 0.50% | 1.76 ** | 53.04% | 0.89 |
| 2016 | 235 | 0.53% | 2.12 ** | 0.60% | 2.40 *** | 58.72% | 2.61 *** |
*** significant at the 0.01 level; ** significant at the 0.05 level; * significant at the 0.10 level.
Table 6.
The Fama–French three factor model abnormal returns for the whole sample.
| Day −1 | Day 0 | Day 1 | Day [−1,1] | |
|---|---|---|---|---|
| Mean abnormal return | 0.02% | −0.57% | −0.09% | −0.65% |
| -statistic | 0.27 | −7.77 *** | −1.40 * | −4.87 *** |
| Median abnormal return | −0.14% | −0.65% | −0.18% | −0.60% |
| -statistic | −1.05 | −9.70 *** | −2.66 *** | −5.60 *** |
| % abnormal return positive | 46.65% | 37.43% | 45.71% | 42.82% |
| -statistic | −2.65 *** | −10.02 *** | −3.41 *** | −5.71 *** |
*** significant at the 0.01 level; * significant at the 0.10 level.
Table 7.
The Fama–French three factor model abnormal returns for different industries.
| CSRC Code | N | Mean | -Statistic | Median | -Statistic | % Positive | -Statistic |
|---|---|---|---|---|---|---|---|
| C13 | 32 | −1.81% | −1.85 ** | −1.17% | −1.62 * | 43.75% | −0.53 |
| C14 | 19 | −1.91% | −1.07 | −2.32% | −0.50 | 47.37% | 0.00 |
| C15 | 75 | −0.76% | −1.33 * | −0.63% | −1.52 * | 41.33% | −1.39 * |
| C17 | 39 | −2.45% | −2.08 ** | −1.20% | −2.09 ** | 38.46% | −1.28 |
| C18 | 14 | 1.28% | 0.86 | 0.41% | 0.56 | 50.00% | 0.27 |
| C22 | 22 | 0.40% | 0.56 | 0.03% | 0.16 | 54.55% | 0.21 |
| C25 | 25 | −3.25% | −2.07 ** | −1.77% | −2.48 *** | 28.00% | −2.00 ** |
| C26 | 136 | −0.88% | −2.16 ** | −1.03% | −2.91 *** | 36.76% | −3.00 *** |
| C27 | 133 | −1.27% | −3.31 *** | −0.61% | −3.74 *** | 35.34% | −3.30 *** |
| C28 | 17 | 0.40% | 0.30 | −0.38% | 0.05 | 41.18% | −0.49 |
| C29 | 21 | −2.17% | −1.93 ** | −1.79% | −1.81 ** | 38.10% | −0.87 |
| C30 | 84 | −0.63% | −1.28 | −0.87% | −1.11 | 41.67% | −1.42 * |
| C31 | 84 | −0.79% | −1.65 * | −0.75% | −1.93 ** | 39.29% | −1.85 ** |
| C32 | 123 | −0.99% | −2.17 ** | −0.93% | −2.32 ** | 38.21% | −2.52 *** |
| C33 | 34 | 0.54% | 0.69 | −0.03% | 0.51 | 50.00% | 0.17 |
| C34 | 71 | −0.57% | −0.81 | −0.46% | −0.87 | 42.25% | −1.19 |
| C35 | 103 | −0.41% | −0.68 | −0.68% | −0.54 | 46.60% | −0.59 |
| C36 | 89 | −0.21% | −0.40 | −0.18% | −0.03 | 47.19% | −0.42 |
| C37 | 42 | −0.80% | −1.59 ** | −1.36% | −1.78 ** | 42.86% | −0.77 |
| C38 | 99 | −0.37% | −0.49 | 0.04% | −0.31 | 51.52% | 0.20 |
| C39 | 201 | 0.35% | 1.07 | 0.27% | 0.58 | 51.24% | 0.28 |
| C40 | 11 | −4.05% | −2.97 *** | −4.49% | −2.27 ** | 18.18% | −1.81 ** |
| F51 | 45 | 0.26% | 0.31 | −0.57% | −0.43 | 40.00% | −1.19 |
| F52 | 44 | 0.15% | 0.35 | −0.15% | 0.20 | 47.73% | −0.15 |
*** significant at the 0.01 level; ** significant at the 0.05 level; * significant at the 0.10 level.
© 2017 by the authors. Licensee MDPI, Basel, Switzerland. This article is an open access article distributed under the terms and conditions of the Creative Commons Attribution (CC BY) license (http://creativecommons.org/licenses/by/4.0/).
Share and Cite
MDPI and ACS Style
Li, B.; Wu, K. The Price of Environmental Sustainability: Empirical Evidence from Stock Market Performance in China. Sustainability 2017, 9, 1452. https://doi.org/10.3390/su9081452
AMA Style
Li B, Wu K. The Price of Environmental Sustainability: Empirical Evidence from Stock Market Performance in China. Sustainability. 2017; 9(8):1452. https://doi.org/10.3390/su9081452
Chicago/Turabian StyleLi, Biao, and Kekun Wu. 2017. "The Price of Environmental Sustainability: Empirical Evidence from Stock Market Performance in China" Sustainability 9, no. 8: 1452. https://doi.org/10.3390/su9081452
Note that from the first issue of 2016, this journal uses article numbers instead of page numbers. See further details here.