
A Comparative Study of Trade Relations and the Spatial-Temporal Evolution of Geo-Economy between China and Vietnam

Faculty of Geographical Science, Beijing Normal University, Beijing 100875, China
*
Author to whom correspondence should be addressed.
Sustainability 2017, 9(6), 944; https://doi.org/10.3390/su9060944
Submission received: 27 April 2017
/
Revised: 27 April 2017
/
Accepted: 31 May 2017
/
Published: 3 June 2017
(This article belongs to the Section Economic and Business Aspects of Sustainability)
Abstract
:With the increasing economic importance of the Asia-Pacific Region, the economic interdependence among countries in the region has gradually enhanced. With the continuous opening up of the two countries, Sino-Vietnamese economic relations have also been deepened. However, the export trade between Vietnam and China has been competitive. China and Vietnam seek to dominate or join an agreement that is conducive to their own trade, which also exacerbates the trade competition between the two countries. This paper compares China and Vietnam and analyzes their foreign trade data from 2005 to 2014. By analyzing the competitiveness of export commodities, the trade division effect and spatio-temporal changes of the geo-economic relationship in the Asia-Pacific Region, this study explores Sino-Vietnamese trade relations and compares the pattern of geo-economic evolution between the two countries. The findings show that China and Vietnam have similarities and substitutability in textiles, apparel and footwear in terms of commodity structure. There is already a trade diversion effect between Vietnam and China on these commodities, but it is not substantial. From a geographic perspective, China’s geo-economic relations in the Pacific Rim present an increasingly dispersed trend. However, the spatial pattern of Vietnam’s geo-economy has maintained a low-level and stable spatial agglomeration over the last decade.
1. Introduction
1.1. Background
In the 21st century, international society entered an era of large-scale shifts in power [1], and the world political and economic center is shifting towards the Asia-Pacific Region. Today, the Asia-Pacific Region is still the world’s most dynamic region and contributes the most to world economic growth [2]. As China’s economy has rapidly developed, its global influence has also increased. Vietnam, as a small newly industrialized economy, has gained increasing economic strength and influence in the Asia-Pacific Region. At the same time, Vietnam has a high degree of trade linkages with China, but it is also highly vulnerable to any trade restrictions. It will actually result in “a tilt toward a third power such as US” [3].
China, as an emerging power, might challenge the established power, the United States (US), and exert more influence on the status quo in the Asia-Pacific Region [4]. In order to strengthen economic interdependence with other countries and enhance influence in the region, both China and the United States want to build a framework conducive to their own trade relations. Thus, when the Obama administration took office, President Obama proposed a rebalanced strategy toward the Asia-Pacific Region, aiming to show the US’s power and presence in the region. In the economic realm, to coordinate with the strategic rebalance, the US government established a US-centered and China-free Trans-Pacific Partnership (TPP) [5]. At the same time, “the momentum of the TPP appears to have spurred China to push more actively for promoting regional comprehensive economic partnership (RCEP)” [6]. Therefore, member countries like Vietnam, which belong to both the TPP and the Association of Southeast Asian Nations (ASEAN), are becoming the focus of both China and the United States. In this context, as one of the largest trading partners of both Vietnam and China, the United States is likely to seek to reduce trade with China but increase trade with Vietnam in some commodities. Accordingly, the relationship between Vietnam and China and its influence on bilateral trade has become a political and academic concern.
On one hand, China’s rise in the last decade has attracted the attention of the world. In 2010, China’s gross domestic product (GDP) caught up with Japan, and it now ranks as the second largest economy in the world. In 2011, the International Monetary Fund (IMF) predicted that China’s GDP would surpass the United States in 2016 if measured on the basis of purchasing power parity (PPP). To China’s Asian neighbors and other foreign powers, especially the United States, the rise of China means a new distribution of power in the Asia-Pacific Region. This is closely related to the security interests of all countries. Some scholars have studied how China’s Asian neighbors view the rise of China, and they found that “geographical and cultural proximity” has a great positive impact on people’s perception of China, and the rise of China has been largely recognized and welcomed by the East Asian countries overall [7]. Almost all of China’s neighbors are unwilling to see the geopolitical rivalry between China and the US which could destroy regional stability and prosperity, because they can realize the maximum of interests of continuing to trade freely with China while benefiting from the security umbrella from the US.
On the other hand, since becoming a World Trade Organization (WTO) member at the end of 2006, Vietnam has enjoyed many benefits from opening up to the world. In order to open up more, Vietnam actively joined the TPP negotiations and eventually became one of its members. Vietnam has its own advantages: First, due to abundant labor and natural resources, Vietnam will be able to attract more labor-intensive industries from other countries, which will be conducive to its long-term economic development. A recent study shows that Vietnam has a clearer advantage than China in population health, although it fell behind in education [8]. Second, US trade with Vietnam increased more than 8-fold from 2002 to 2012, and Vietnam’s rapid increase in goods supplied to the US made it the second-largest supplier of US imports among the Asia-Pacific countries (excluding Canada, Japan and Mexico) in 2012 [9]. Lastly, Vietnam is good at using the rules of trade agreements. Since becoming a member of WTO and TPP, Vietnam has received considerable benefits for each agreement, and is being actively engaged in RCEP negotiations with China. Here, we just take the TPP as a case: the terms for exception of the TPP let twelve countries protect their important industries; these exceptions give Vietnam a long enough protection period to adapt to the rules. However, from Vietnamese and other Asian TPP members’ perspectives, joining in the agreements will help them not only to maximize their own trade with China and the US, but also to balance China with the US in terms of influence in Asia [10]. Moreover, in order to integrate into the Asia-Pacific market, Vietnam could also join in RCEP if the TPP doesn’t really come into force.
China is expected to face some competition with Vietnam, which is considered by many scholars to be an important competitor to China. The relationship between China and Vietnam has been delicate since ancient times. During and even after the Cold War, as national interests diverged, and due to political asymmetry, many neighboring countries felt an implicit threat from China, and Vietnam is the archetypal example of such a fearful neighbor [11]. As historic enmity and suspicions between the two countries simmered, Vietnam has been taking dynamic “soft balancing” as a response to the rising China [12]. In recent years, in the South China Sea, the two countries have had frequent conflicts, and this in turn has altered their geo-economic relations. The trade competition between Vietnam and China has also begun to be intensified. In this study, we focus specifically on the textile, apparel and clothing, and footwear instead of all the industries, because there is competition and cooperation in these three industries between Vietnam and China. China and Vietnam are both populous countries, and labor-intensive industries developed rapidly due to their abundant labor resources. Some products of labor-intensive industries, like textile, apparel and clothing, and footwear, are competitive in the international market. The export target market for these three products is mainly concentrated in developed countries, such as the US, Japan and Australia. Once Vietnam starts to enjoy more favorable open-market access conditions in the textile and apparel markets, will China still be able to maintain its current key market share in textile and apparel export markets, such as the US and Japanese markets? Furthermore, as has been mentioned before, Vietnam’s trade has been closely linked to China in the most recent decade (Figure 1). China is currently one of the leading suppliers of textiles to Vietnam and other Asia-Pacific countries. Thus, the increased import demand for textiles from Vietnam and other Asian countries might create additional export opportunities for China after the implementation of a new trade agreement [13].
1.2. Literature Review
Comparative study helps understand the similarities and differences of the targets, usually used to analyze the political and economic relations between two countries [3]. Comparative study focuses on one scientific question, and the target objectives for a comparative study can be two countries, or more countries and economies [14,15]. Through the comparative study, we can find which commodities have competition in the international market between China and Vietnam. Trade division effect is closely linked to trade agreements, just as TPP and RCEP [16]. There has been abundant research on the topic from different perspectives, and many models and equations for trade diversion have been developed [17]. In this paper, we use this method to explain whether there is a trade division effect between the two countries before the agreements.
Geo-economy is the relationship, including competition, cooperation and alliance between countries and regions under the influence of geopolitics [18]. In today’s world, economic factors have become one of the most important factors affecting international relations [19], economic interdependence has led to increasingly close geo-economic ties between nations. The trade links between countries is an important indicator to reflect their geo-economic ties. This tightening of geo-economic ties will deeply impact the geopolitical pattern among countries in a certain region [20].
Reviewing the existing literature, comparative studies only focus on the target countries; little research has put the target countries on a larger scale to study their economic relations. The current research has been focused on the economic and trade perspectives [8], seldom analyzing trade relations from the perspective of geography. Thus, combining trade relation and geography perspectives, this study not only compares the trade relation between Vietnam and China, but also puts them in the context of the integration of the Asia-Pacific; it is from the national and regional scales to study the economic relationship between the two countries. In order to conduct a comprehensive comparative study, we first calculated the competitiveness of China and Vietnam’s main export industries. Next, we constructed a model to contribute to a better understanding of a question: is there a trade diversion effect on China? Lastly, through spatio-temporal analysis, we compared the trends of the geo-economic relationship between the two countries and other Asia-Pacific countries.
1.3. Outline
This article is structured in four sections. Section 1 describes the research background in detail and then puts forward research questions. Section 2 introduces the research methods and models which we selected and constructed. Section 3 presents the study results including the export structure between China and Vietnam and the comparative advantages of similar export commodities, the trade division effects between the two countries, Vietnam and China’s geo-economic relationship with other Asia-Pacific countries. In Section 4, we provide our conclusions and discussion.
2. Research Methods and Data Sources
2.1. Relative Revealed Comparative Trade Advantage (RTA) Index
The revealed comparative advantage (RCA) index is usually used to explain whether a product has an export advantage. However, the RTA index also considers one-sidedness and the asymmetry of calculated results, which means that its comprehensive objectivity is better than the RCA index [21,22]. This paper uses the RTA index to distinguish the export advantage commodities for China and Vietnam. The equation is specified as follows:
where x and m represent exports and imports respectively, j is the reporting country, i is a good in a category, w represents the world, and iw represents a good in a category of the world. If RTAij > 0, then country j has a comparative advantage in good i; if RTAij < 0, it does not have a comparative advantage.
2.2. Trade Diversion Model Construction
If we want to know the impact of Vietnam on China’s export trade, we should first understand the trade diversion effect between the two countries. Does a trade diversion effect already exist between the two countries? This paper uses the extended gravity model, based on Mordonu [23], to investigate the influence of export trade diversions between China and Vietnam. Here, we also select the data on imports and exports of textile, apparel and clothing, and footwear. This can help us understand whether trade diversion effects exist for certain export commodities between two countries. Based on a dynamic panel data framework, we used the following model:
where: Expjt stands for exports from China to country j at time t, and αj is the time-invariant heterogeneity of country j in relation to China. The explanatory variables, varying both in the cross section and the time dimensions, follow. GDPjt is importing country j’s GDP. RERjt is the real exchange rate between Renminbi (RMB) and country j’s currency at time t. Here we chose the real exchange rate between the US dollar and RMB, and the US dollar and the Vietnamese Dong (VND) in each year, so the ratio is the real exchange rate between RMB and VND. TDjt is the potential trade diversion index, ECjt is the export compatibility index used to replace the trade creation (TC) index, and SDjt is the index proposed to measure supply-demand compatibility. μjt is the remaining error term. All variables are expressed in logarithms, symbolized by the letter L in front of the variables.
TD is the potential trade diversion index, representing the compatibility of a reporting country’s imports with a partner country’s exports. It measures how the imports of one country could be matched by the exports of another country, and it is calculated using the following formula:
where j is the reporting country, k is the partner country, i is a good, m is the share of imports of product i in the country’s in-category imports from the world and x is the share of exports of product i in the country’s in-category exports to the world.
EC is the export compatibility index, used to replace trade creation (TC).
where x is the share of exports of product i in the country’s total exports.
SD is the index proposed to measure supply-demand compatibility. It measures to what extent the reporting country’s export structure matches the structure of the partner country’s demand for imports and it should be regarded as a reduced demand factor. Its formula is as follows:
where j is the reporting country, k is the partner country and i is the commodity. x and m are shares of exports and imports of commodity i in total category by country and by trade flow.
2.3. Spatio-Temporal Analysis—Hotspot Analysis
The time–space analysis method, which this paper selected can often reveal and forecast the development trends of spatial patterns [24,25]. The evolution of Vietnam’s (or China’s) geo-economic spatial pattern can be clearly demonstrated by the tendency of geo-economic relations between Vietnam (or China) and other Asia-Pacific countries in time and space. However, what are the development trends of Vietnam and China’s geo-economic relations in the Pacific Rim? What are the similarities and differences in the pattern of geo-economic evolution between the two countries? To answer these questions, we examine the volume of bilateral trade that can objectively describe the geo-economic relationship between two countries (or economies).
2.3.1. Global Spatial Autocorrelation
The distribution characteristics of China’s geo-economic relationship with other Asia-Pacific countries can be described by Moran’s I index. The equation of Moran’s I is as follows [26]:
where the value wij is the weight assigned to areas i and j, and . Usually, wij will reflect the geographic distance between areas i and j, being defined, for example, as wij = 1 if I ≠ j and the areas are adjacent, and by wij = 0 otherwise. However, weights can also be more general depending, for example, on the distances between areas. Moran’s I usually ranges between −1 and 1, with more positive values indicating similarity of the rates, and values close to zero indicating an absence of spatial autocorrelation. If the Moran’s I index > 0, it presents the trend of agglomeration in space; if Moran’s I index < 0, it suggests decentralization in space.
2.3.2. Hotspot Analysis
A hotspot analysis can reveal a detailed pattern of spatial inequity [27]. Based on the trade data, we conducted a hotspot analysis using the local spatial statistic d-Getise-Ord [28]. The G-statistic () indicates whether features with high values or those with low values tend to cluster in a study area. is calculated as follows:
where, j ≠ i, the subscripts refer to the N sub-regions of an area, xj represents an observation for sub-region j, and [] is a symmetric binary (0 or 1) spatial weight matrix, with 1 s for each case that is within distance d of a given case i. Inclusion of d in the definition of the statistic is not essential, but it highlights the fact that the technique can be used to search for clusters at a range of different spatial scales by varying d. A Z score () indicates whether there is a significant difference between the local sum and the expected change of trade in a random distribution. The Z score is transformed as follows:
where E (·) and Var (·) denote the expected value and variance of statistic , respectively.
2.3.3. Result Verification—Fragmentation Index and Uniformity Index
In order to test the results, we selected the fragmentation index (FI) and uniformity index (UI), both of which can describe the distribution pattern of the data in general space. Some scholars selected FI and UI to explain the degree of agglomeration-fragmentation for urban agglomeration [29], and then some geographers introduced the two indexes to measure the spatial and temporal evolution of geo-economic distribution in a certain region [30]. In this study, FI and UI were used to reveal the change of China and Vietnam’s geo-economic distribution pattern in the Pacific Rim, and to test the results from Moran’s I. First, we evaluated the spatial distribution level of China’s geo-economy in the Asia-Pacific Region. The formulation is as follows:
where is the fragmentation index, is the share of volume between China and country , and is the trade volume between China and country . The greater the value of , the more uniform the distribution of a geo-economy in space. is the area of country . is the uniformity index, is the product of both and . usually ranges between 0 and 1, with values close to 1 indicating that the spatial distribution of the geo-economy is more uniform, and values close to zero indicate otherwise.
2.4. Study Area and Data Sources
In this paper, we focused on Vietnam and China, and we also concentrated on the Asia-Pacific Region. The region we selected includes not only Vietnam and China, but also the other ASEAN countries, Mongolia, Russia and Caribbean countries. In order to make a comparative study between Vietnam and China, it is necessary to make identifications for a certain historical period. Data from 2005–2014 were selected, and we concentrated on the years 2005, 2010, and 2014 to show trends in temporal and spatial variation. The data used in this paper are all from authoritative databases and official websites, including the United Nations Commodity Trade Statistics Database (http://comtrade.un.org/), the Ministry of Commerce of China websites (http://www.mofcom.gov.cn/), the Ministry of Foreign Affairs of the People’s Republic of China websites (http://www.fmprc.gov.cn/mfa_chn) and the World Bank open databases (www.worldbank.org.cn).
3. Results
3.1. Features of Chinese and Vietnamese Export Trade
3.1.1. Export Commodity Category
China and Vietnam are both newly industrialized countries in Asia with relatively cheap labor forces. China’s increasingly skilled and Vietnam’s less-skilled labor force challenge the labor cost advantage of China’s export enterprises. As a result, labor-intensive industries, such as textile, apparel and footwear have developed rapidly in recent years in Vietnam. Even though China’s labor force is no longer as cheap as before, there are still some similarities in the structure of their main export commodities. By comparing the main export commodities of the two countries from 2005 to 2014 (Table 1), it can be seen that China’s main export products were concentrated in three categories identified by the Standard International Trade Classification Revision 3 (SITC Rev. 3; for details, see Appendix A): machinery and transport equipment (7), miscellaneous manufactured articles (8), and manufactured goods (6), and we can see there were few changes during this period. Vietnam’s main export goods were concentrated in four categories: miscellaneous manufactured articles (8), mineral fuels, lubricants and related materials (3), manufactured goods (6), and food and live animals (0). Compared to China, Vietnam had significant changes in its main export goods. For example, the ranking of petroleum, petroleum products and related materials (33) and cereals and cereal preparations (04) dropped significantly, and textile yarn and related products (65) and telecommunication and sound recording apparatus (76) increased significantly. A comparison of the changing trend of export commodities shows clearly that textile yarn and related products (65), office machines and automatic data processing machines (75), articles of apparel and clothing accessories (84) and footwear (85) are common export categories for both countries. Accordingly, we chose textiles, apparel and clothing, and footwear for comparison in our study.
3.1.2. Relative Revealed Comparative Trade Advantage (RTA) of Export Commodities
By calculating at 2-digits we can show the development of a trend, but for further analysis, calculating at 3-digits, the differences can be displayed between the two countries more clearly, so we calculated textile, apparel and clothing, and footwear at the 3-digit SITC 3 level. Table 2 presents the results of Equation 1. From the 2-digit level perspective, the trend for the RTA of textile shifts from a rapid rise to a slow drop in both countries. The RTAs of textile in Vietnam in this period are all less than zero, indicating that Vietnam does not have a comparative export advantage for textile. The RTAs of apparel and clothing and footwear are both greater than zero, and Vietnam’s value is higher than China’s. It can also be seen that the RTA of footwear has decreased from 2005 to 2014, but the RTA of apparel and clothing rose for Vietnam and fell for China. In short, China is more competitive than Vietnam in textiles, while Vietnam has a comparative advantage over China in apparel and clothing and footwear. When we go out to three digits for the comparison, we find two patterns as follows: first, although China has some advantages in some categories at present, especially in textiles, there are still some sub-categories (among these three commodities) that are declining. Second, compared with China, Vietnam has more categories for which the RTA index grew higher during this 10-year period, indicating that Vietnam has great potential in these main export commodities. By joining a new trade agreement, its export advantages may be further enhanced.
3.2. Trade Diversion Analysis
We take the logarithm transformation to consider the nonlinear relationships between the dependent and independent variables. The logarithm transformation can also reduce the impacts of outliers on the model estimations [31]. Next, we select three types of analytical models, including a panel data ordinary least squares (OLS) model, a fixed effects model, and a random effects model. However, as the number of included observations is insufficient (only 10), it cannot pass the Hausman test [32]. Thus, we finally choose OLS to estimate the model (2).
The results can be seen in Table 3. According to the estimation results, Adjusted R-squared = 0.997, and F-statistic is significant at 1% (Prob [F-statistic] = 0.000), which confirms a good model fit. All the variables passed the t-test at 10%, with the exception of C, for which Prob. = 0.9998 > 0.1. The GDP variable has a significant positive relationship with EXP, confirming that the contribution of exports to GDP is still significant in both countries. It also indicates that these three commodities exported from China to Vietnam have a positive role in Vietnam’s GDP. Next, we can further see that the real exchange rate between RMB and VND plays an important role in bilateral trade between China and Vietnam. The variables TD and EC are both significant, indicating that a trade diversion effect and a trade creation effect exist between the two countries on textile, apparel and clothing and footwear. However, the variables TD and EC do not play a significant role because the coefficients are 0.185 and 0.118, respectively. The last variable SD is negatively correlated with EXP; even the absolute value of the coefficient is small, indicating that the supply-demand of these commodities has a negative impact on export from China to Vietnam.
Overall, there is trade diversion effect between Vietnam and China on the commodities of textile, apparel and clothing and footwear, but the effects are not obvious. Export from China to Vietnam plays an important role in Vietnam’s GDP, which shows that, with growing commercial ties with China, Vietnam is economically dependent on China to a certain extent. The real exchange rate has had a significant effect on exports over a decade, and the more economic growth along with open climate, the more important adjusting function role the real exchange rate plays. So the dynamic real exchange rate between RMB and VND deserves long-term concern.
In order to investigate the possible reasons, we can think in two aspects. Vietnam’s labor force is much cheaper than China’s, which gives Vietnam’s labor products a price advantage in the international market. On China’s side, in recent years, the appreciation of the RMB is not conducive to product exports. With China’s disappearing demographic dividend and increasing labor employment cost, China has no significant advantage in labor-intensive industries. In addition, it is worth noting that the labor-intensive industries transferred from China to Vietnam are not likely to be greatly affected by TPP when the agreements came into force in 2016, but rather will likely be affected by China’s economic transformation and upgrading. China still remains an important trading partner of Vietnam, despite Vietnam’s membership in the TPP.
3.3. Vietnam and China’s Geo-Economic Relations in the Asia-Pacific Region
3.3.1. Global Spatial Autocorrelation Analysis
Table 4 shows the evolution of Moran’s I indexes from 2005 to 2014, which are all significant at the p < 0.01 level for each year. It appears that China’s geo-economic relationship with other Asia-Pacific countries is positively spatially autocorrelated, since the Moran’s I indexes are all greater than zero. The result also shows that China’s geo-economic relationships have significant spatial clusters. However, the Moran’s I index has a declining trend over time, with the value decreasing from 0.203 to 0.164, which means that the spatial agglomeration has gradually weakened. The spatial pattern of China’s geo-economy is more dispersed in this region.
In order to compare with China, we calculated Vietnam’s geo-economic relations in the same methodological way (Equation (3)). We can see similar results with China in Table 5. The changes of Moran’s I indexes from 2005 to 2014 are significant at the 90% or 95% level (p < 0.1) for each year. For Vietnam, like China, geo-economic relations with other Asia-Pacific countries is positively spatially autocorrelated. However, the Moran’s I changed from increasing to decreasing over the last ten years, but the change is slight. Because the value of Moran’s I is very low, even though the values are all greater than zero, Vietnam’s geo-economic relationship in the region has been in a low-level state for the last decade and has changed little. The spatial pattern of Vietnam’s geo-economy has maintained a low-level spatial agglomeration in the Asia-Pacific Region, which is clearly different from China.
3.3.2. Hotspot Analysis
Figure 2 shows the results of the hotspot analysis of geo-economic relations between China and Asia-Pacific countries from 2005 to 2014 (Equations (4) and (5)). Hotspots are mainly concentrated in the United States and Japan, which both have a close and complementary relationship with China in terms of trade. By virtue of their nearby location, North Korea and South Korea both belonged to the hotspot area in 2005. In 2010 and 2014, however, both countries were no longer hotspots. Coldspots are mainly concentrated in the Caribbean and in northern South America. This is expected, because these countries are all a great distance from China, and trade with them is smaller compared to the key market countries.
Overall, the hotspots and coldspots in the Asia-Pacific Region have remained stable since 2005. There have not been substantive changes during the study periods: the hotspots have been maintained in the United States and Japan and the coldspots have remained concentrated in the Caribbean and northern South America. Most of the other countries and regions have been relatively stable. Over time, the number of coldspots has increased, but the number of hotspots has declined. This shows that China’s trade agglomeration in the Asia-Pacific Region has a downward trend, and the spatial distribution of its foreign trade has become increasingly uniform.
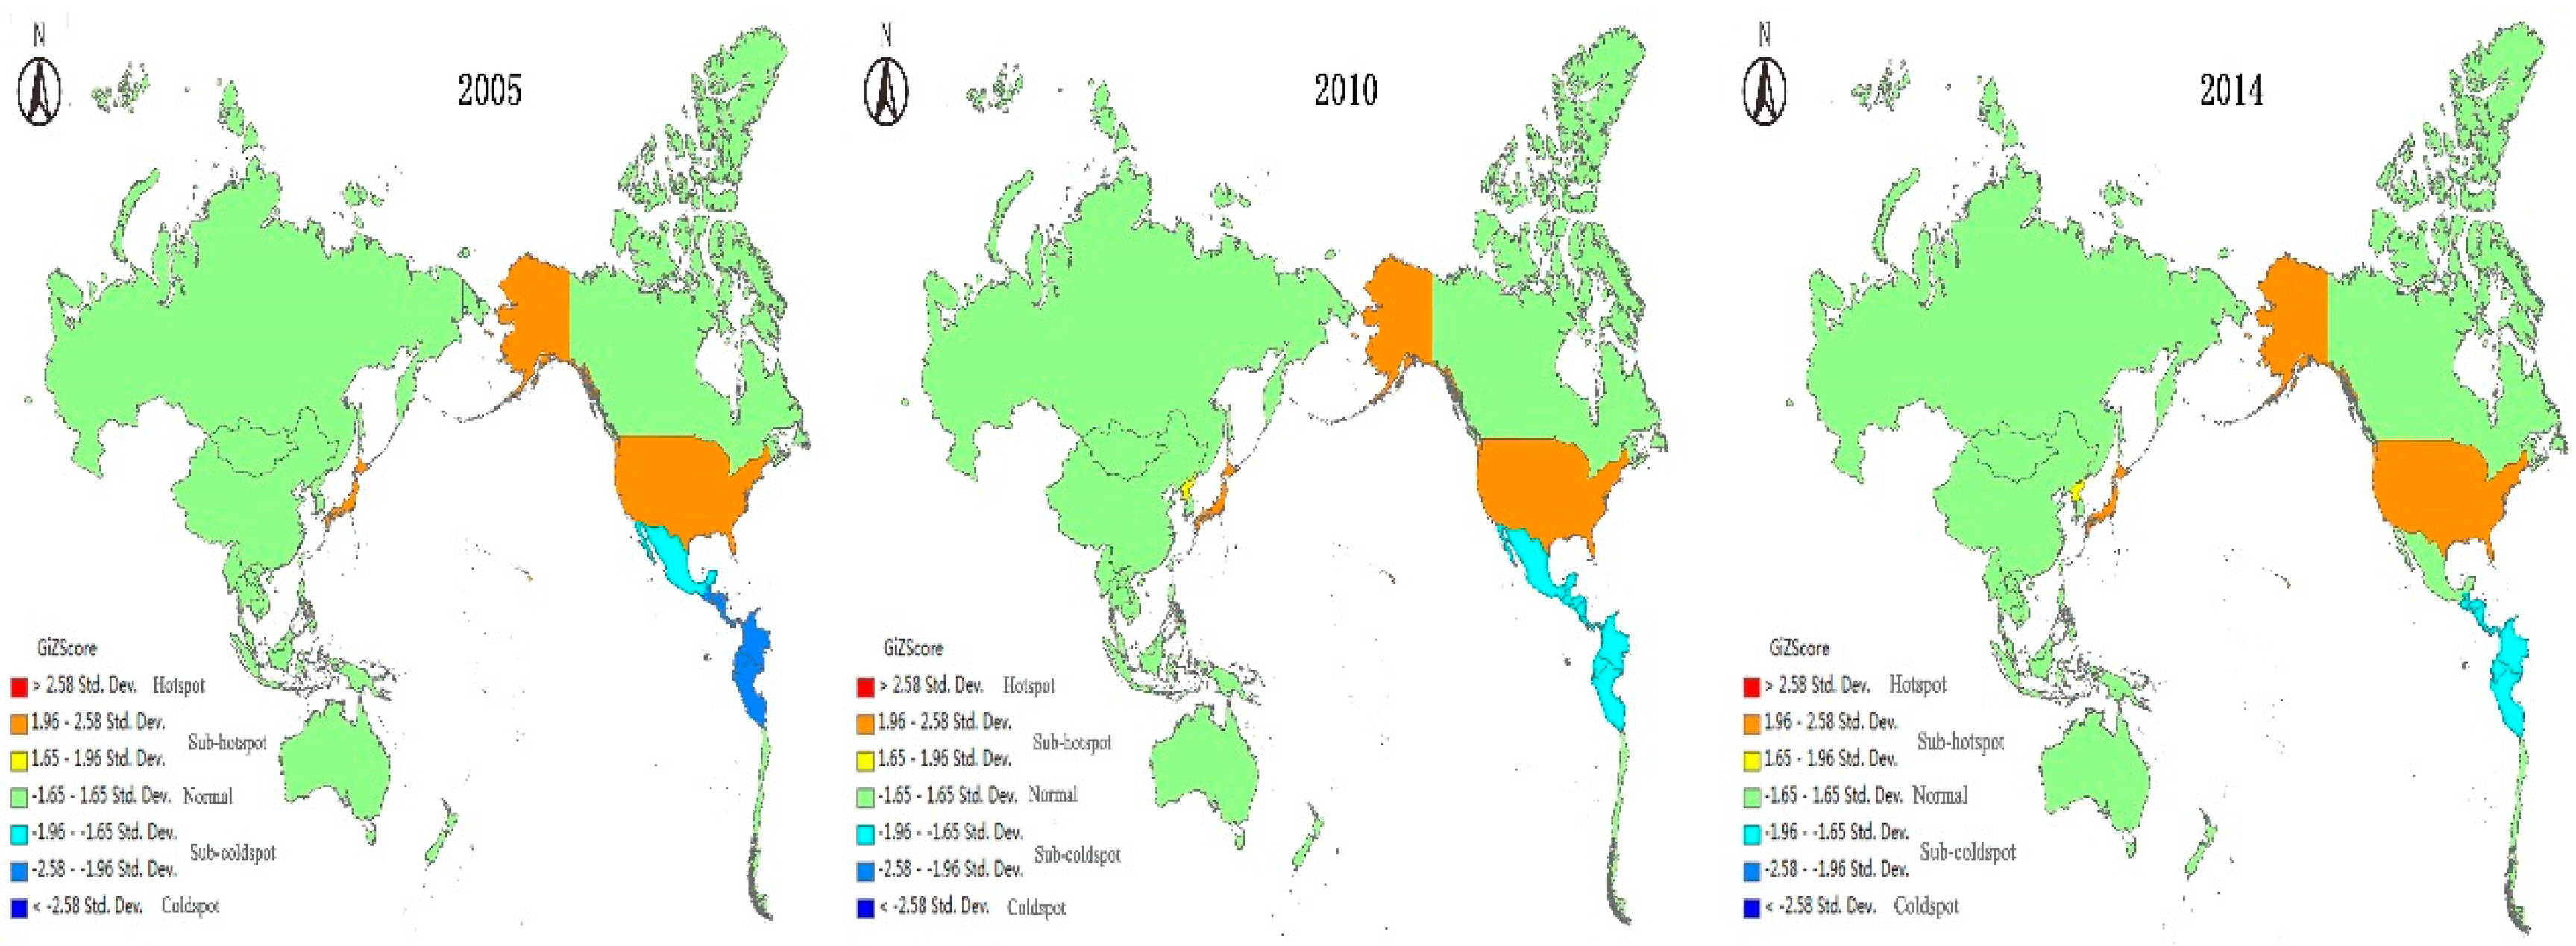
From the hotspot analysis we can find some similar changes between the two countries. The results of geo-economic relations between Vietnam and the Asia-Pacific countries from 2005 to 2014 are presented in Figure 3. On one hand, there are no hotspots on the map, but the sub-hotspots are mainly concentrated in the United States and Japan and has still maintained this trend; the situation is as similar as China’s. This indicates that the US and Japan not only have close economic and trade ties with China, but also that both are important trading partners of Vietnam. In turn, the US and Japan have a great economic and trade impact on Asian newly industrialized economics, especially on China and Vietnam. On the other hand, due to the distance, the volume of trade is small. The Central American region has been a coldspot or sub-coldspot area from 2005 to 2014, even though there are some slight changes every five years. Thus, the spatial distributions of coldspots or sub-coldspots have some similarity between these two countries, just like the hotspots or sub-hotspots. Vietnam’s hotspots and coldspots both are steady in space over time, which is in accordance with Moran’s I index, which changed little.
3.3.3. Result Verification
The results from Equations (6)–(9) are presented in Table 6. Both the fragmentation index and the uniformity index rose steadily from 2005 to 2014, meaning China’s spatial pattern of foreign trade tends to be homogeneous in the Asia-Pacific Region. The results reveal that China’s geo-economy tends to be more decentralized in the study area, rather than concentrated in several countries, and that it is diversified in the selected countries. The fragmentation index and import uniformity of Vietnam increased from 2005 to 2010 and decreased from 2010 to 2014, but all the values of these indexes fluctuated lightly. The results also correspond to the previous analyzed trend in the Moran’s I indexes of the two countries.
4. Conclusions and Discussion
This paper compares China and Vietnam, analyzing the trade relations and the pattern of geo-economic evolution between the two countries. The key findings include the following: The main export goods for both China and Vietnam are textile yarn and related products, articles of apparel and clothing accessories, and footwear. China is more competitive than Vietnam in textile yarn and related products, while Vietnam has a comparative advantage over China in articles of apparel and clothing accessories and in footwear. Moreover, Vietnam has more development potential in most of these commodities than China. There has been little trade diversion effect between China and Vietnam in some industries, especially in labor intensive industries, such as textile, apparel and clothing, and footwear. According to model estimated results, export from China to Vietnam plays an important role in Vietnam’s GDP, and the real exchange rate has a significant effect on the export over a decade between the two countries.
China’s geo-economy agglomeration in the Asia-Pacific Region presented a downtrend trend from 2005 to 2014, and the spatial distribution of its foreign trade became increasingly uniform. Vietnam is, however, different from China; the spatial pattern of Vietnam’s geo-economy has maintained a low-level and stable spatial agglomeration over the last decade. What they have in common is the spatial distribution of hotspots and coldspots: hotspots or sub-hotspots are spatially concentrated in the US and Japan while coldspots or sub-coldspots area are concentrated in Central America.
From the above analytic conclusions, we can summarize that from the trade dimension, there is growing competition in textile, apparel and clothing, and footwear between China and Vietnam. Although the effect was limited, the trade diversion has already existed in labor-intensive industries between the two countries; from the geo-economic relation dimension, China’s geo-economic relations in the Asia-Pacific Region have been gradually homogenized, and the degree of agglomeration has been reduced since 2005. Therefore, from another perspective, Vietnam and China still have great potential to cooperate in textile, garment and other similar industries. On one hand, with Vietnam’s export of textile products increasing rapidly, it will import more textile raw materials and primary products from China. On the other hand, Chinese corporations are considering moving their production factories to Vietnam to strive for the benefits of the trade agreement immediately [33]. These changes will strengthen, rather than weaken the economic and trade relations between Vietnam and China. This will also promote the sustainable development of bilateral relations.
In the context of globalization and Asia-Pacific economic integration, the economic relations between China and Vietnam are increasingly influential in the region. Through comparative study, this paper analyzes trade and geo-economic relations between China and Vietnam from the national and regional scales, including in two countries and in the Asia-Pacific region. However, there are still some aspects to improve. On one hand, although RTA index is more objective and better than RCA, we only analyze the competition of commodities, and the complementary commodities should have received further attention. On the other hand, it should further analyze the geopolitical implications behind the geo-economy in the Asia-Pacific. For example, for the United States, who once dominated the TPP negotiations, the geopolitical implications of TPP may be greater than its economic implications. As the result of this study, there is already a trade diversion effect before the TPP and the actual impacts on the economic relations between China and Vietnam are likely to be quite limited, even though the geopolitical implications could be greater.
Acknowledgments
This work is supported by the major project of National Social Science Foundation of China (No. 16ZDA041). All the authors gratefully thank the reviewers and editors for their insightful and constructive comments. We especially thank A Xing Zhu, Ian Baird in the Department of Geography at the University of Wisconsin and Yang Cheng in the Faculty of Geographical Science at Beijing Normal University for their valuable advice for this research.
Author Contributions
Teng Ma played an important role in the conception of the study, establishing the model, and drafting and revising the manuscript. Yuli Liu performed the data processing and analyses. Yuejing Ge contributed to the conception of the study, played a vital role in interpreting the results and approved the final version.
Conflicts of Interest
The authors declare no conflict of interest.
Appendix A

Table A1.
Standard International Trade Classification (SITC) Revision 3 (used in this paper).
| Code | Summary Titles | Label |
|---|---|---|
| 03 | Seafood | Fish, crustaceans, molluscs and preparations thereof |
| 04 | Grains | Cereals and cereal preparations |
| 05 | Vegetables & fruits | Vegetables and fruits |
| 07 | Drinks | Coffee, tea, cocoa, spices, and manufactures thereof |
| 23 | Crude rubber | Crude rubber (including synthetic and reclaimed) |
| 32 | Coal | Coal, coke and briquettes |
| 33 | Petroleum | Petroleum, petroleum products and related materials |
| 34 | Gas | Gas, natural and manufactured |
| 42 | Vegetable oils | Fixed vegetable oils and fats, crude, refined or fractionated |
| 65 | Textile | Textile yarn and related products |
| 651 | Textile yarn | Textile yarn |
| 652 | Cotton | Cotton fabrics, woven |
| 653 | Fabrics | Fabrics, woven, of man-made fabrics |
| 654 | Other fabrics | Other textile fabrics, woven |
| 655 | Knitted fabrics | Knitted or crocheted fabrics, n.e.s. |
| 656 | Small wares | Tulles, trimmings, lace, ribbons & other small wares |
| 657 | Special textile | Special yarn, special textile fabrics & related |
| 658 | Made-up articles | Made-up articles, of textile materials, n.e.s. |
| 659 | Floor coverings | Floor coverings, etc. |
| 66 | Nonmineral manufactures | Non metallic mineral manufactures, n.e.s. |
| 67 | Iron and steel | Iron and steel |
| 69 | Metal manufactures | Manufactures of metal, n.e.s. |
| 71 | Power machinery | Power generating machinery and equipment |
| 74 | Other machinery | Other industrial machinery and parts |
| 75 | Office machines | Office machines and automatic data processing machines |
| 76 | Telecommunication | Telecommunication and sound recording apparatus |
| 77 | Electrical machinery | Electrical machinery, apparatus and appliances, n.e.s. |
| 78 | Road vehicles | Road vehicles |
| 79 | Transport equipment | Other transport equipment |
| 82 | Furniture | Furniture and parts thereof |
| 84 | Apparel & clothing | Articles of apparel & clothing accessories |
| 841 | Men’s clothing | Men’s clothing of textile fabrics, not knitted |
| 842 | Women’s clothing | Women’s clothing, of textile fabrics |
| 843 | Men’s clothing, knitted | Men’s or boy’s clothing, of textile, knitted, croche. |
| 844 | Women’s clothing, knitted | Women’s clothing, of textile, knitted or crocheted |
| 845 | Articles of apparel, textile | Articles of apparel, of textile fabrics, n.e.s. |
| 846 | Clothing accessories | Clothing accessories, of textile fabrics |
| 848 | Articles of apparel | Articles of apparel, clothing access., excluding textile |
| 85 | Footwear | Footwear |
| 851 | Footwear | Footwear |
| 87 | Professional instruments | Professional and scientific instruments, n.e.s. |
| 89 | Miscellaneous articles | Miscellaneous manufactured articles, n.e.s. |
Notes: The bolds are at 2-digit SITC 3 level, and others are at 3-digit SITC 3 level.
References
- Joseph, S.N. Hard Power and Soft Power; Peking University Press: Beijing, China, 2005; pp. 1–11. [Google Scholar]
- Zhao, J.L.; Zhang, Y.H.; Wu, X.Y. Asia-Pacific Economic Retrospect in 2015 and Outlook in 2016. Asia Pac. Econ. Rev. 2016, 1, 3–7. [Google Scholar]
- Ravindran, M.S. China’s potential for economic coercion in the South China Sea disputes: A comparative study of the Philippines and Vietnam. J. Curr. Southeast Asian Aff. 2012, 3, 105–132. [Google Scholar]
- Ikenberry, G.J. The rise of China and the future of the West: Can the liberal system survive? Foreign Aff. 2008, 87, 23–37. [Google Scholar]
- Zhao, S.S. A New Model of Big Power Relations? China–US strategic rivalry and balance of power in the Asia–Pacific. J. Contemp. China 2014, 24, 377–397. [Google Scholar] [CrossRef]
- Lewis, M.K. The TPP and the RCEP (ASEAN+ 6) as Potential Paths toward Deeper Asian Economic Integration. Asian J. WTO Int. Health Law Policy 2013, 8, 359–378. [Google Scholar]
- Chu, Y.H.; Liu, K.; Huang, M.H. How East Asians View the Rise of China. J. Contemp. China. 2015, 24, 398–420. [Google Scholar] [CrossRef]
- Khuong, V.M. Can Vietnam achieve more robust economic growth?: Insights from a comparative analysis of economic reforms in Vietnam and China. J. Southeast Asian Econ. 2015, 1, 52–83. [Google Scholar] [CrossRef]
- Williams, B.R. Trans-Pacific Partnership (TPP) Countries: Comparative Trade and Economic Analysis; Congressional Research Service: Washington, DC, USA, 2013; pp. 8–16. [Google Scholar]
- Panda, J.P. Factoring the RCEP and the TPP: China, India and the Politics of Regional Integration. Strateg. Anal. 2014, 1, 49–67. [Google Scholar] [CrossRef]
- Womack, B. China and Vietnam: The Politics of Asymmetry; Cambridge University Press: New York, NY, USA, 2006; pp. 77–89. [Google Scholar]
- McDougall, D. Responses to ‘Rising China’ in the East Asian Region: Soft balancing with accommodation. J. Contemp. China 2012, 21, 1–17. [Google Scholar] [CrossRef]
- Lu, S. Impact of the Trans-Pacific Partnership on China’s Textiles and Apparel Exports: A Quantitative Analysis. Int. Trade J. 2015, 29, 19–38. [Google Scholar] [CrossRef]
- Hirota, K. Comparative studies on vehicle related policies for air pollution reduction in ten Asian countries. Sustainability 2010, 2, 145–162. [Google Scholar] [CrossRef]
- Lee, W.S. Comparative case studies of the effects of inflation targeting in emerging economies. Oxf. Econ. Pap. 2011, 63, 375–397. [Google Scholar] [CrossRef]
- Shen, M.H. A cost benefits analysis of the Trans-Pacific Partnership Agreement (TPP): A Chinese Perspective. J. Contemp. Asia Pac. Stud. 2012, 1, 6–34. (In Chinese) [Google Scholar]
- Gunther, V.F.G. An Econometric Analysis of Trade Creation and Trade Diversion in Mercosur and Paraguay. Doctoral Dissertation, University of Minnesota, Twin Cities, MN, USA, August 2012. [Google Scholar]
- Mao, H.Y. Geopolitical and geo-economic situation in the surrounding areas and China’s strategie. Progr. Geogr. 2014, 3, 289–302. (In Chinese) [Google Scholar]
- Keohane, R.O.; Nye, J.S. Power and Interdependence; Longman Publishing Group: New York, NY, USA, 2001; pp. 9–22. [Google Scholar]
- Smith, A. Imagining geographies of the ‘new Europe’: Geo-economic power and the new European architecture of integration. Political Geogr. 2002, 21, 647–670. [Google Scholar] [CrossRef]
- Kang, C.W. The Research Review of Revealed Comparative Advantage Index. Commer. Res. 2014, 445, 32–39. (In Chinese) [Google Scholar]
- Esterhuizen, D.; Van Rooyen, C.J. How competitive is agribusiness in the South African food commodity chain? Agrekon 1999, 38, 744–754. [Google Scholar] [CrossRef]
- Mordonu, A. Measuring Trade Diversion-The Case of Russioan Exports in the Advent of EU Enlargement. Available online: http://cris.unu.edu/measuring-trade-diversion-case-russian-exports-advent-eu-enlargement (accessed on 27 April 2017).
- Wang, S.F.; Cao, Y.; Ge, Y.J. Spatio-temporal changes and their reasons to the geopolitical influence of China and the US in South Asia. Sustainability 2015, 7, 1064–1080. [Google Scholar] [CrossRef]
- Wu, X.; Cui, P. A Study of the Time–Space Evolution Characteristics of Urban–Rural Integration Development in a Mountainous Area Based on ESDA-GIS: The Case of the Qinling-Daba Mountains in China. Sustainability 2016, 8, 1085. [Google Scholar] [CrossRef]
- Assuncao, R.M.; Reis, E.A. A new proposal to adjust Moran’s I for population density. Stat. Med. 1999, 18, 2147–2162. [Google Scholar] [CrossRef]
- Huang, Z.; Wei, Y.D.; He, C.; Li, H. Urban land expansion under economic transition in China: A multi-level modeling analysis. Habitat Int. 2015, 47, 69–82. [Google Scholar] [CrossRef]
- Ord, J.K.; Getis, A. Local spatial autocorrelation statistics: Distributional issues and an application. Geogr. Anal. 1995, 27, 286–306. [Google Scholar] [CrossRef]
- Shi, Y.J.; Zhu, Y.B.; Feng, D.X. Polycentric network development patterns of Zhongyuan urban agglomeration. Sci. Geogr. Sinica. 2012, 12, 1430–1438. (In Chinese) [Google Scholar]
- Yang, W.L. Study on the spatial-temporal evolution and internal mechanism of geo-economic connections of China. ActaGeogr. Sin. 2016, 6, 956–969. (In Chinese) [Google Scholar]
- He, C.F.; Zhou, Y.; Huang, Z.J. Fiscal decentralization, political centralization, and land urbanization in China. Urban Geogr. 2015, 37, 436–457. [Google Scholar] [CrossRef]
- Hausman, J.A. Specification tests in econometrics. Econometrica 1978, 46, 1251–1271. [Google Scholar] [CrossRef]
- Economic and Commercial Cousellor’s Office of the Embassy of the People’s Republic of China in the Socialist Republic of Vietnam. Available online: http://vn.mofcom.gov.cn/article/zxhz/zzjg/201310/20131000360529.shtml (accessed on 30 May 2016).
Figure 1.
Trade flow between China and Vietnam, 2005–2014. Source: Calculated from UN COMTRADE.
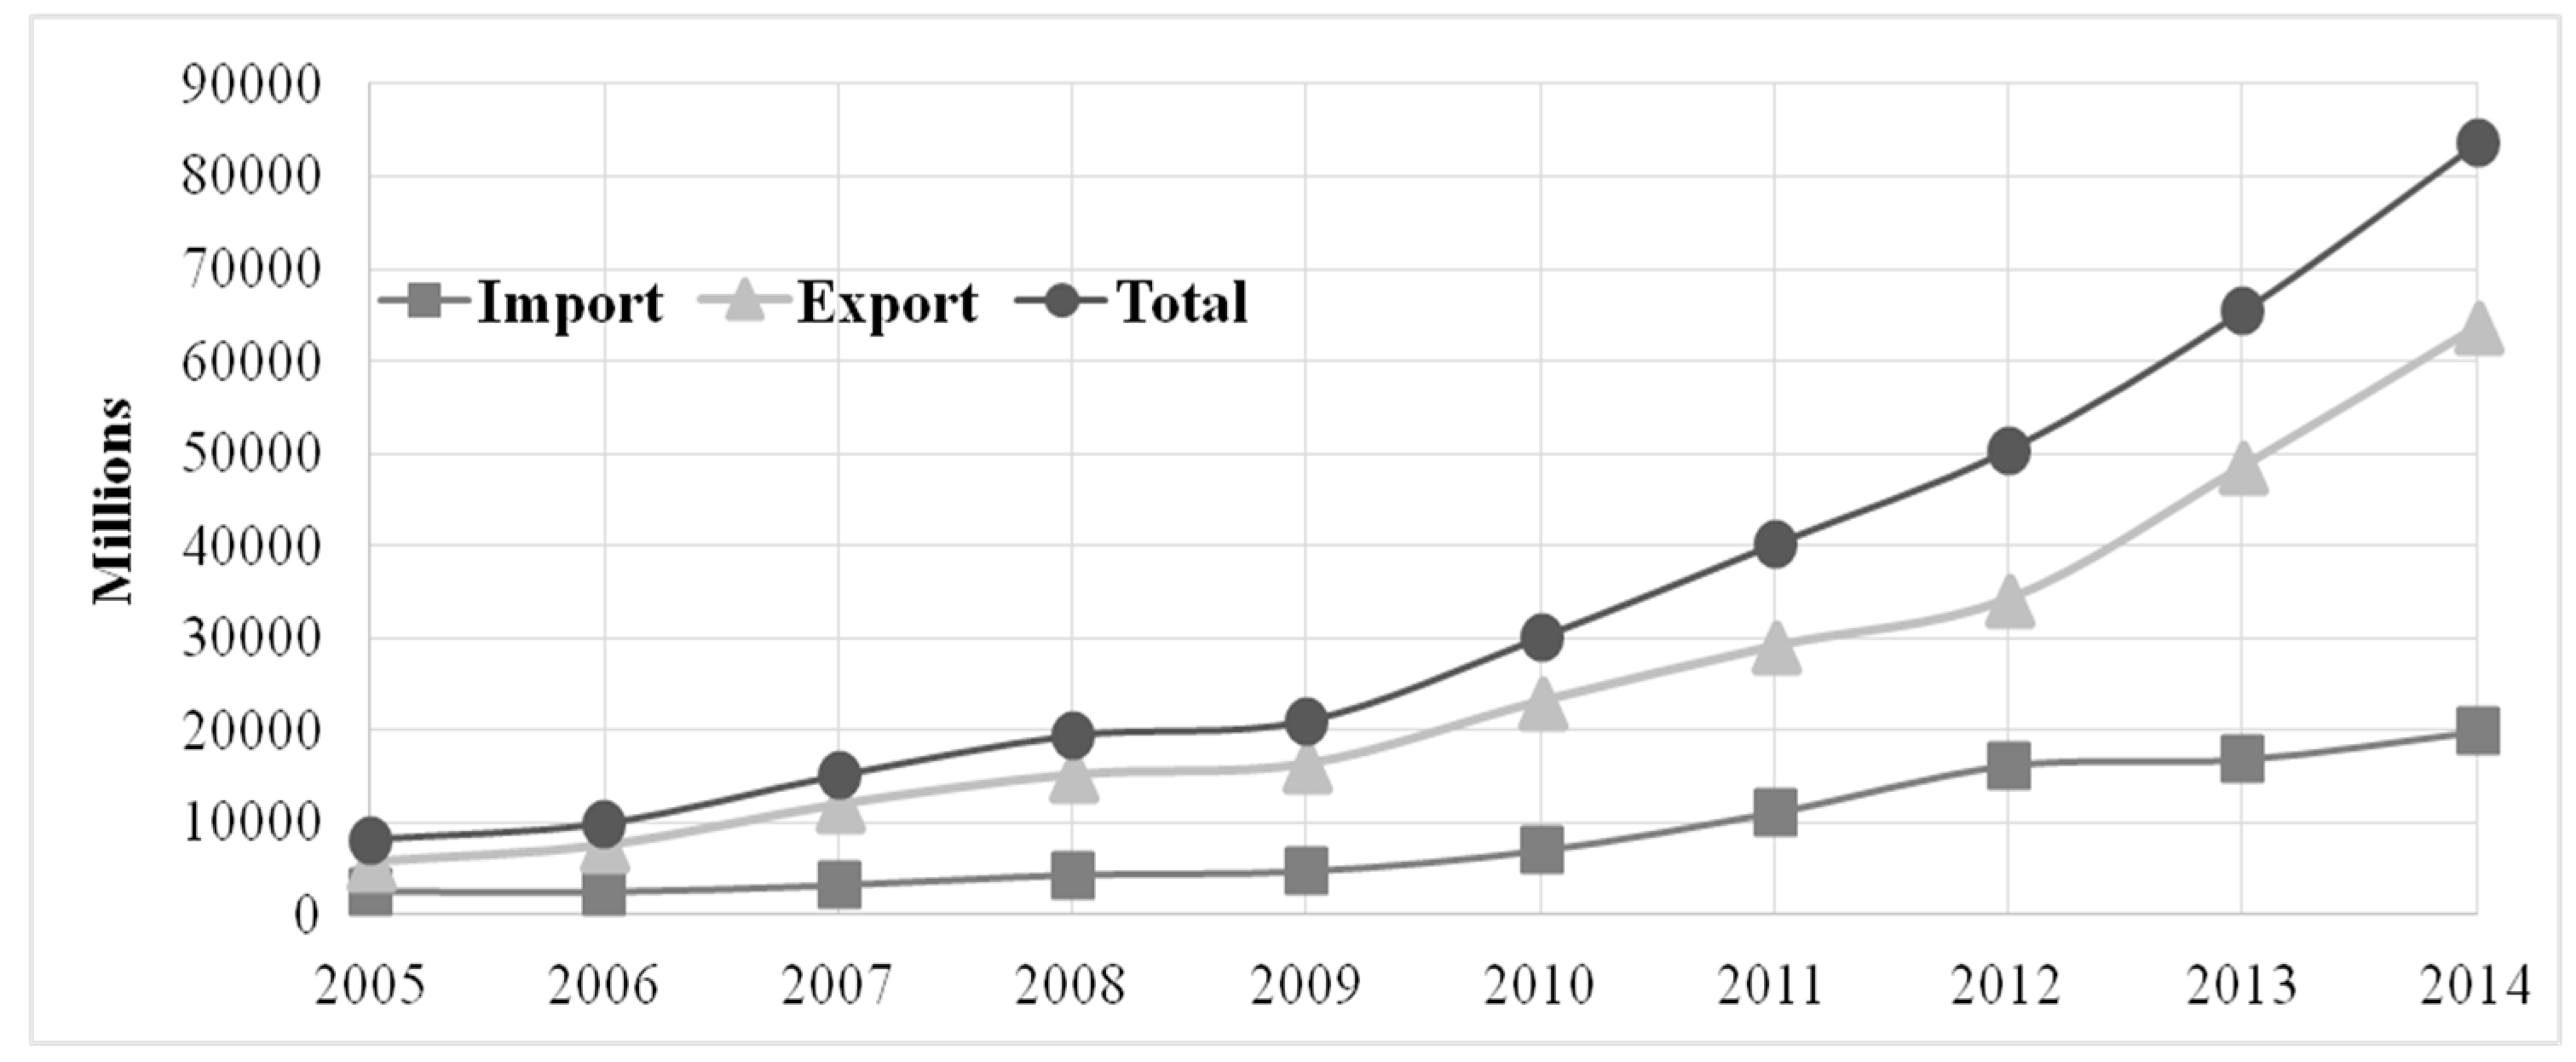
Figure 2.
Hotspot analysis of China’s geo-economic relationship in the Asia-Pacific Region.
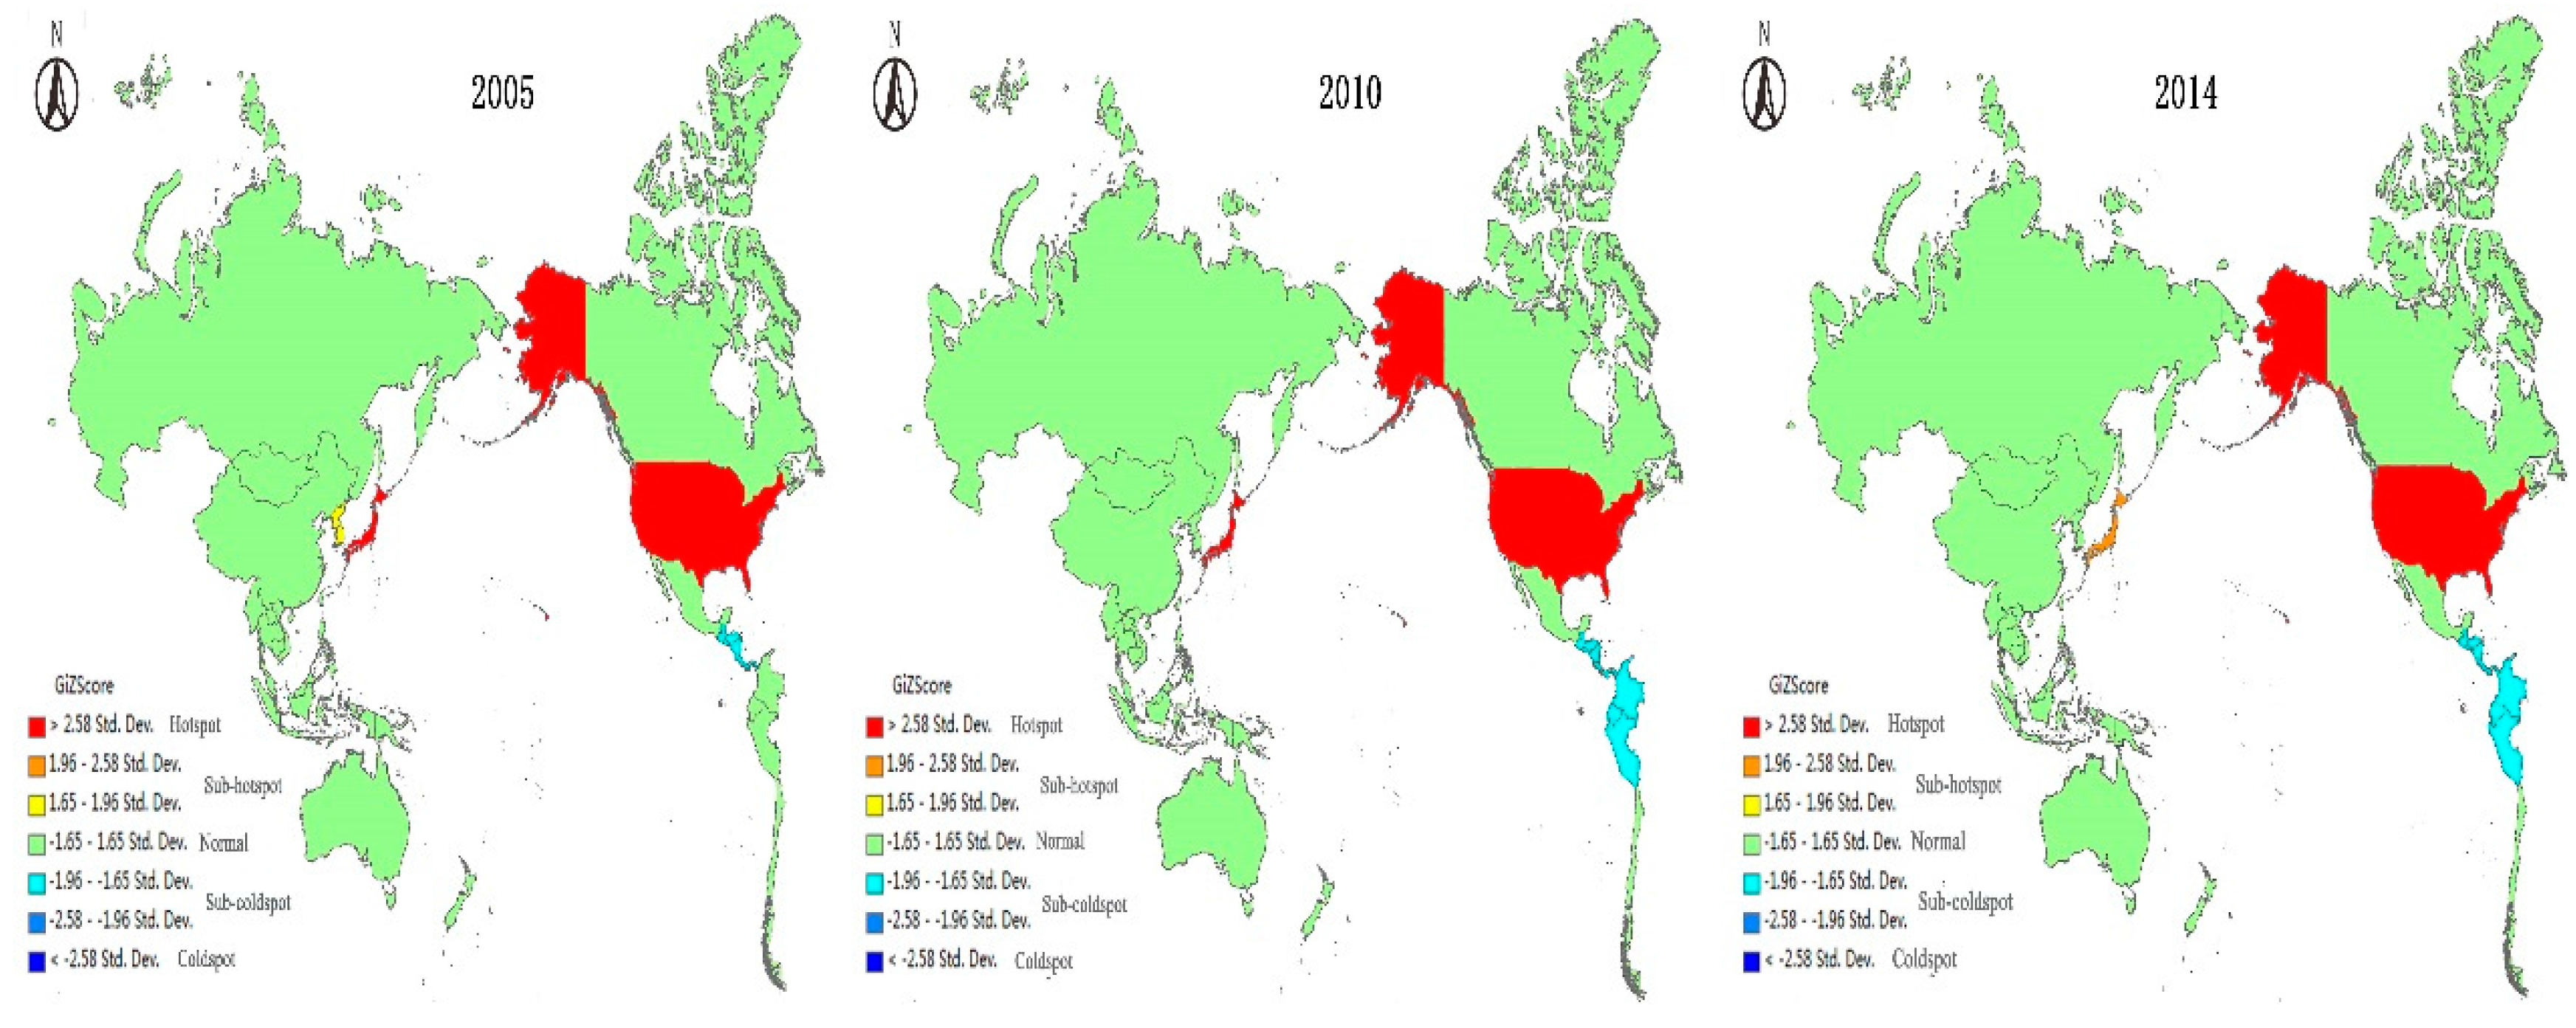
Figure 3.
Hotspot analysis of Vietnam’s geo-economic relationship in the Asia-Pacific Region.

Table 1.
Category ranking of export commodities (summary titles).
| Summary Titles Rank | 2005 | 2010 | 2014 | |||
|---|---|---|---|---|---|---|
| CHN | VNM | CHN | VNM | CHN | VNM | |
| 1 | Office machines | Petroleum | Office machines | Apparel & clothing | Electrical machinery | Telecommunication |
| 2 | Telecommunication | Apparel & clothing | Electrical machinery | Petroleum | Telecommunication | Apparel & clothing |
| 3 | Electrical machinery | Footwear | Telecommunication | Footwear | Office machines | Footwear |
| 4 | Apparel & clothing | Seafood | Apparel & clothing | Seafood | Apparel & clothing | Electrical machinery |
| 5 | Miscellaneous articles | Grains | Miscellaneous articles | Miscellaneous articles | Miscellaneous articles | Petroleum |
| 6 | Textile | Furniture | Textile | Grains | Textile | Office machines |
| 7 | Metal manufactures | Electrical machinery | Other machinery | Electrical machinery | Other machinery | Textile |
| 8 | Other machinery | Drinks | Metal manufactures | Textile | Metal manufactures | Furniture |
| 9 | Road vehicles | Office machines | Road vehicles | Telecommunication | Iron and steel | Miscellaneous articles |
| 10 | Iron and steel | Vegetables & fruits | Transport equipment | Furniture | Road vehicles | Power machinery |
| 11 | Footwear | Miscellaneous articles | Professional instruments | Drinks | Furniture | Iron and steel |
| 12 | Professional instruments | Crude rubber | Iron and steel | Office machines | Professional instruments | Vegetable oils |
| 13 | Furniture | Textile | Furniture | Crude rubber | Footwear | Non mineral manufactures |
| 14 | Non mineral manufactures | Coal | Footwear | Vegetables & fruits | Non mineral manufactures | Gas |
Notes: Calculated at the 2-digit SITC Rev.3 (Standard International Trade Classification Revision 3) level.
Table 2.
Relative trade advantage (RTA) of export goods in China and Vietnam.
| RTA | 2005 | 2010 | 2014 | ||||
|---|---|---|---|---|---|---|---|
| Category | CHN | VNM | CHN | VNM | CHN | VNM | |
| Textile | 1.413 | −3.996 | 2.054 | −3.121 | 2.039 | −4.154 | |
| Textile yarn | 0.100 | −1.074 | 0.599 | 2.480 | 0.183 | 2.632 | |
| Cotton | 1.845 | −4.742 | 3.005 | −9.260 | 2.731 | −10.730 | |
| Fabrics | 1.78 | −12.768 | 2.363 | −10.052 | 2.786 | −14.050 | |
| Other fabrics | 0.773 | −3.699 | 1.113 | −2.624 | 1.315 | −2.381 | |
| Knitted fabrics | 0.849 | −5.487 | 2.103 | −11.875 | 2.545 | −18.014 | |
| Small wares | 1.006 | −10.403 | 2.038 | −11.766 | 2.192 | −10.784 | |
| Special textile | −0.032 | −4.730 | 1.061 | −2.452 | 1.161 | −2.853 | |
| Made-up articles | 4.335 | 2.635 | 4.123 | 3.681 | 3.641 | 2.497 | |
| Floor coverings | 0.989 | 0.007 | 1.207 | −0.122 | 1.160 | −0.161 | |
| Apparel & clothing | 3.371 | 4.803 | 3.247 | 5.585 | 3.101 | 5.222 | |
| Men’s clothing | 2.993 | 7.963 | 2.672 | 8.099 | 2.685 | 8.166 | |
| Women’s clothing | 3.209 | 5.847 | 3.039 | 6.555 | 3.074 | 5.849 | |
| Men’s clothing, knitted | 3.528 | 8.905 | 4.118 | 7.399 | 3.673 | 6.487 | |
| Women’s clothing, knitted | 3.189 | 7.342 | 4.161 | 5.795 | 4.048 | 5.707 | |
| Articles of apparel, textile | 3.343 | 3.175 | 3.073 | 5.463 | 2.816 | 5.304 | |
| Clothing accessories | 3.187 | −2.75 | 3.604 | −0.485 | 3.311 | −0.431 | |
| Articles of apparel | 5.202 | 0.779 | 3.244 | 1.107 | 2.906 | 0.406 | |
| Footwear | 3.755 | 13.605 | 3.390 | 10.733 | 3.201 | 9.500 | |
| Footwear | 3.755 | 13.605 | 3.390 | 10.733 | 3.201 | 9.500 | |
Notes: Each category was used instead of the 3-digit SITC 3 level, while bolds are at 2-digit SITC 3 level.
Table 3.
Estimation results.
| Dependent Variable: LEXP | Sample (Adjusted): 2005 2014 | ||||||
|---|---|---|---|---|---|---|---|
| Method: Least Squares | Included Observations: 10 | ||||||
| Variable | Coefficient | Std. Error | t-Statistic | Prob. | |||
| C | 4.59E-06 | 0.017 | 0.000 | 0.9998 | |||
| LGDP | 2.297 | 0.106 | 21.738 | 0.0000 | |||
| LRER | 0.991 | 0.087 | 11.416 | 0.0003 | |||
| LTD | 0.185 | 0.050 | 3.680 | 0.0212 | |||
| LEC | 0.118 | 0.044 | 2.671 | 0.0557 | |||
| LSD | −0.742 | 0.085 | −8.769 | 0.0009 | |||
| Effects Specification | Cross-section fixed (dummy variables) | ||||||
| R-squared | 0.998 | Mean dependent var | 0.000 | ||||
| Adjusted R-squared | 0.997 | S.D. dependent var | 1.000 | ||||
| S.E. of regression | 0.054 | F-statistic | 611.683 | ||||
| Sum squared resid | 0.012 | Prob (F-statistic) | 0.0000 | ||||
Table 4.
Global Moran’ I of geo-economy in China.
| 2005 | 2010 | 2014 | |
|---|---|---|---|
| Moran’s I | 0.203 | 0.186 | 0.164 |
| Z | 3.444 | 3.163 | 2.899 |
| P | 0.00 | 0.00 | 0.00 |
Table 5.
Global Moran’s I of geo-economy in Vietnam.
| 2005 | 2010 | 2014 | |
|---|---|---|---|
| Moran’s I | 0.097 | 0.117 | 0.106 |
| Z | 1.702 | 2.092 | 2.007 |
| P | 0.089 | 0.036 | 0.045 |
Table 6.
Fragmentation index and uniformity indexes of trade in China and Vietnam.
| 2005 China/Vietnam | 2010 China/Vietnam | 2014 China/Vietnam | |
|---|---|---|---|
| Export fragmentation index | 3.87/3.67 | 4.23/3.78 | 4.38/3.87 |
| Import fragmentation index | 3.80/3.48 | 3.99/3.50 | 4.22/3.36 |
| Import and export fragmentation index | 3.95/3.72 | 4.24/3.74 | 4.41/3.72 |
| Export uniformity index | 0.63/0.70 | 0.67/0.72 | 0.68/0.73 |
| Import uniformity index | 0.53/0.57 | 0.58/0.61 | 0.62/0.59 |
| Import and export uniformity index | 0.59/0.66 | 0.63/0.68 | 0.66/0.68 |
© 2017 by the authors. Licensee MDPI, Basel, Switzerland. This article is an open access article distributed under the terms and conditions of the Creative Commons Attribution (CC BY) license (http://creativecommons.org/licenses/by/4.0/).
Share and Cite
MDPI and ACS Style
Ma, T.; Liu, Y.; Ge, Y. A Comparative Study of Trade Relations and the Spatial-Temporal Evolution of Geo-Economy between China and Vietnam. Sustainability 2017, 9, 944. https://doi.org/10.3390/su9060944
AMA Style
Ma T, Liu Y, Ge Y. A Comparative Study of Trade Relations and the Spatial-Temporal Evolution of Geo-Economy between China and Vietnam. Sustainability. 2017; 9(6):944. https://doi.org/10.3390/su9060944
Chicago/Turabian StyleMa, Teng, Yuli Liu, and Yuejing Ge. 2017. "A Comparative Study of Trade Relations and the Spatial-Temporal Evolution of Geo-Economy between China and Vietnam" Sustainability 9, no. 6: 944. https://doi.org/10.3390/su9060944
Note that from the first issue of 2016, this journal uses article numbers instead of page numbers. See further details here.