
A Dynamic Programming Model for Operation Decision-Making in Bicycle Sharing Systems under a Sustainable Development Perspective


Department of Management Science and Engineering, Business School of Hunan University, Changsha 410082, China
*
Author to whom correspondence should be addressed.
Sustainability 2017, 9(6), 895; https://doi.org/10.3390/su9060895
Submission received: 9 March 2017
/
Revised: 9 May 2017
/
Accepted: 23 May 2017
/
Published: 2 June 2017
(This article belongs to the Section Economic and Business Aspects of Sustainability)
Abstract
:Maintaining a balance between revenue and expenditure is the key to the sustainable development of a bicycle sharing system (BSS), and is a challenge for almost all systems worldwide. This article proposes a dynamic programming approach to obtain the optimal strategy to maximize the revenue of overall BSS. The Variable Granularity-Depth First Search (VG-DFS) algorithm is designed to speed up the solution. A numerical experiment is presented to verify the applicability of the model through a comparison with real data from the BSS in Hangzhou. Results indicated that the BSS could achieve break-even, or even obtain a substantial income by utilizing our model to make operational decisions, especially when the region it is located in has a relatively high GDP. Moreover, the best investment strategy proved is to involve stations in the initial construction period of the BSS as much as possible.
1. Introduction
Bicycle sharing systems have attracted the attention of numerous cities as a green, flexible, sustainable mobility model. This type of public project is an economical trip mode for people; however, it is not always economical for the government, or operator. Most bicycle sharing systems (BSSs) have been developed by the government and operated by an external operator. To encourage people to accept this new trip mode, many BSSs do not charge users. Nevertheless, the operating costs of a BSS are alarmingly high (including hardware investment, cost of maintenance and depreciation, the reposition cost, etc.). For instance, the capital costs of SmartBike (Washington, USA), Cyclocity (Vilnius, Lithuania) and Bixi (Montreal, Canada) are around USD $3600, $4400 and $3000 per bicycle, respectively; and the average operating cost of several systems is approximately USD $1600 per bicycle (New York City Department of City Planning 2009) [1]. These costs meant that the BSS operators are unable to meet their income targets to cover their expenditure, despite the government having a large financial stake in subsidizing the daily operating costs of a BSS. The BSS has developed an income channel, by selling the advertisement rights to advertising contractors or the operator [2]; however, most advertising contractors are not sure of whether the return on investment of a time-varying BSS can achieve their expectations, so there is a lack of participation enthusiasm. For these reasons, few BSSs are able to obtain satisfactory revenue by selling advertising rights, and the profit of the BSS is always negative. Given this situation, government departments begin to question whether the investment is worthy, which subsequently means that the operator would have to quit the BSS with heavy losses, and the rejection of a contract extension by the advertising contractor with the operator.
Thus, a crucial factor in the sustainable development of a BSS is its ability to meet the profit demands of all stakeholders, that is, to ensure that the basic income requirements of all stakeholders can be achieved in any operation stage. Due to the requirements of building stations and purchasing bicycles in the early stage of building a BSS, the system needs a lot of effective financial input. For instance, the government in Hangzhou provided RMB 150 million as a start-up fund, and RMR 270 million worth of subsidized loans in the early stage of the BSS. The government in Shanghai and Zhuzhou invested RMB 78.361 million and RMB 1.5 billion in the construction stage of the BSS, respectively [3]. For the BSS in Washington, D.C. and Canada, Bixi, the cost of planning, implementation and administration for capital bikeshare totaled USD $5.0 million and USD $15 million, respectively [4]. However, two factors prevent the BSS from achieving sustainable operation. (1) The BSS cannot obtain enough continuous support from the government; and (2) although the government has invested a plenty of money, its supervision is weak. Indeed, the main comments in news and media on a failed BSS venture always focus on the lack of effective financial support and supervision. In Wuhan, for example, the government invested RMB 300 million in the development of a BSS in 2009 by adopting a public-private-partnership (PPP) business model. Nevertheless, to maximize profit, the operator invested most of their energy into real estate projects and advertising media—the costs of which are subsidized by the government—and neglected to maintain the system. After four years, the project failed, because none of their bicycles could be used with predictable results [5], with the obvious reason being a lack of government regulation. The other instance was in Beijing, where the BSS only survived for two years during the Beijing Olympic Games. This is mainly due to a lack of support in both policy and funding. Thus, developing a sustainable investment strategy for the government, and designing mechanisms to supervise the behavior of the operator, are particularly challenging and meaningful issues for a BSS.
Although the government plays a significant role in influencing the performance of a BSS, the impacts of the operator cannot be ignored. The BSS is a carbon-free method of transportation, it has a large number of users, and the operator can externalize many internal effects. Shaheen et al. [2] concluded that advertising was a revenue source for most BSSs worldwide, such as SmartBike (USA), Hangzhou Public Bicycle (China), and nextbike (Germany), unless the BSS operator was a non-profit organization. Regardless of whether the operating rights of advertising is sold to an advertising company, or operated by an agency or the local authority, it is widely used for improving the profit of a BSS [6]. However, only a small number of BSSs can carry out advertisement opportunities smoothly, and they are especially difficult for the BSSs in small-sized cities or recently opened ventures, because they are not sufficiently attractive to the advertising contractor. Therefore, methods to dispel the concerns of the advertisement contractor are another problem for the BSS.
Since research on the optimization of income structure in a BSS is quite new, the literature on its related challenges are sparse. While the operation decision-making problem in bicycle sharing system is yet to be studied, literatures on other PPP projects and supply chain have already proposed some approaches to solve the similar issue. This article focuses on the dynamic programming (DP) model of profit management in a discrete operation cycle. This method will benefit optimal decision-making in each stage and in the perspective of the maximization of overall revenues. Additionally, the DP will also consider the supervision and incentive mechanisms between the government and the operator, as well as the advertising revenue distribution and the incentive mechanism between the operator and the advertising contractor. The contributions of this article are the following:
(i) Introduction of a sustainable operation problem in BSS.
A new multi-period operation decision-making problem is introduced, arising from a BSS. This is the primary problem faced by the sustainable development of a BSS.
(ii) Mathematical models are raised for the provided problem.
Mathematical models are proposed to solve the problem of operating a BSS sustainably, the objective function of which, is different from other literatures. The objective function in our model is based on the actual situation and is quite distinctive when compared to typical decision-making problems, as it focuses on maximizing the total system revenue during the whole operational period. Based on the modeling approach, the DP and the Stackelberg Game (SG) models are utilized; each associated with a certain vision on searching the optimal solution. Thus, the Pareto optimal solution of operating decision variables in a BSS can be found.
(iii) Improving solution methods.
Solutions to the problem are developed based on the DP and SG formulations as mentioned above, and enhanced by an algorithmic. The improved algorithmic can be a speed enhancer of DP solution without significantly reducing accuracy. The technology can be applied to other similar DP problems, thus the contribution to theory in this work has a certain degree of universality.
(iv) Verification through a comparison of computational experiments with real data.
A case study of the BSS in Hangzhou was solved by using the suggested formulations and solution methods. The BSS in Hangzhou is one of the best bicycle sharing systems worldwide. Results point out that the proposed models and its relevant solutions can obtain similar results to Hangzhou’s data. Thus, our contributions are from both a scientific and a practical point of view.
The rest of this article is organized as follows: Section 2, a review of the literature is presented to describe related work from several application areas. In Section 3 and Section 4, the mathematical models are described by specifying the optimization mechanisms, present formulations and the chosen objective function. In Section 5, an algorithmic are proposed to enhance the speed of solving the mathematical models. In Section 6, the numerical experiments are described. Finally, in Section 7, relative conclusions, further extensions and research directions are discussed.
2. Literature Review
For the past few years, BSS operations have attracted the attention of researchers in different fields. Among them, the most eye-catching research direction is the repositioning of bicycles, and this area harvested a wealth of research results. Benchimol et al. [7] first provided the bicycle-repositioning problem (BRP) and presented a method to deal with the balancing of the stations when no bikes are moving. Forma et al. [8] classified the BRP as a variation of the Pickup and Delivery Problem (PDP). Raviv et al. [9] improved the research by constructing the objective function to minimize the measure of the expected user’s dissatisfaction, and Ho and Szeto [10] used the concept of a penalty function [9] and presented an iterated tabu search heuristic to solve the static BRP. They also pointed out that when the BRP only considered one vehicle; the problem becomes a one-commodity pickup-and-delivery traveling salesman problem (1-PDTSP). When the BRP considered multiple vehicles and a maximum duration constraint for each route, the problem belongs to a one-commodity pickup-and-delivery vehicle routing problem. Dell’Amico et al. [11] and Erdoğan et al. [12] solved the BRP with the branch-and-cut algorithm with different assumptions. Di Gaspero et al. [13] tackled the BRP by means of Constraint Programming (CP). Rainer-Harbach et al. [14] investigated different metaheuristic approaches for solving the BRP. Szeto et al. [15] proposed chemical reaction optimization (CRO) to solve the single-vehicle static BRP with the objective of minimizing the operational time on the vehicle route and the weighted sum of unmet customer demand. Ho and Szeto [16] proposed a hybrid large neighborhood search for solving the multi-vehicle BRP with the objective of minimizing the total travel time and the weighted sum of the penalty cost at each station. Li et al. [17] considered multiple types of bikes in static BRP, and formulated a mixed-integer linear programming according to this new problem. Kloimüllner and Raidl [18] considered only full vehicle loads for movement among the rental stations in BRP and used a compact MIP model, a logic-based Benders decomposition (LBBD), and a Branch-and-Check (BAC) to formulate this rebalancing problem. In addition to this, some researchers have focused on the different aspects of bicycle sharing system operations. For example, Shu et al. [19] developed a network flow model to support decision-making in the design and management of the BSS. Li and Shan [20] provided a bidirectional incentive model to encourage the behavior of crowdsourcing to improve the performance of bicycle reposition.
From the observation on the above literatures, the research on various aspects of BSS operation is emerging in an endless stream. However, the research on the sustainable profit of a BSS is limited. Shaheen et al. [21] illustrated that some operational programs have four key factors affecting profitability: station location, membership retention, discounts, and new revenue sources. Furthermore, new revenue sources include new sponsor revenue, selling advertising space and starting an online store. Ricci [22] pointed out that “further research is necessary to develop innovative evaluation frameworks and methods that are specific to bike sharing, able capture their full range of impacts and not just those which are directly and more easily quantifiable”. Nakamura and Abe [23] proposed and evaluated a hybrid model as an appropriate prototype to ensure the sustainable management of BSSs. Zhang et al. [3] pointed out that it was necessary to understand the stakeholders’ prospective earnings for the responsible officer to develop a BSS. Thus, it can be seen that the sustainable profit of a BSS has already started to receive attention from scholars. Moreover, in the real world, many BSSs are facing the unsustainable problem of interruption by a break in a funding chain. The main reasons for this result are as follows. (1) The government being unwilling to pay enough money to subsidize the BSS, as it does not have sufficient faith in the return on investment of the project. (2) The operator leaves the BSS due to low revenue. (3) The advertising contractor is not willing to buy the rights of operating advertisement from a BSS, due to the investment risk. (4) Users no longer use bicycles due to poor service. As long as one of the above-mentioned conditions appear, the BSS will be hard to keep running. Thus, the question of how to balance and create profit for every stakeholder from the perspective of operational decisions is a significant problem for a BSS.
In a BSS, stakeholders include government, the operator, the advertising contractor and the user (this article focuses on the profit issue of a BSS, so this article does not consider the user of the BSS). The cooperative partnership between the government and the operator is mostly a public-private partnership, and the relationship between the operator and the advertising contractor is more similar to the supply chain. Obviously, the objective of these relationships is to achieve a win-win scenario. Therefore, it is necessary to establish a proper restraint mechanism to safeguard the interests of both parties. The incentive and punishment mechanism has been widely used in many research areas, of which the public-private partnership project and supply chain are two.
In public-private partnership, for example, Zhang [24] suggested that one of the critical success factors for a public–private partnership is the formulation of an appropriate risk allocation via reliable contract. Chen [25] devised a method for making cross-enterprise dynamic joint decisions through dynamic programming and the Stackelberg game. The result of their research pointed out that in a cooperative setting, the consigned revenue-sharing vendor managed inventory contract tended to enable channel efficiency, and the profit of both parties increases. Pongsiri [26] pointed out that a sound regulatory framework will benefit the government to ensure partnerships operate efficiently, and realize resource optimization configuration. In turn, the private sector is protected by contract agreements to avoid the risk of market volatility. The literature mentioned above illustrates that an appropriate risk allocation is of benefit to cooperation efficiency.
The research area into supply chain also has plenty of articles to explore this mechanism among stakeholders. For instance, Ho et al. [27] explored differences between distributional and peer-induced fairness in supply chain contract design. They showed that the retailer made a lower share of the total supply chain in the presence of peer-induced fairness, and the experiment suggested that peer-induced fairness was more salient. Xu et al. [28] proved that the price set by a risk-averse dual-channel supply chain was lower than a risk-neutral dual-channel supply chain. They also pointed out that the manufacturer provided a contract to the retailer, which not only coordinated the dual-channel supply chain, but also ensured that both stakeholders achieve a win–win situation, which can promote cooperation between the retailer and the manufacturer. Furthermore, revenue sharing—as one of the most popular contracts in the practice area—has attracted the attention of many scholars. Under a revenue-sharing contract, retailers pay a wholesale price for each unit purchased to suppliers, plus a percentage of the retailers’ revenue [29]. Giannoccaro and Pontrandolfo [30] proposed a model of supply chain contract based on the revenue sharing mechanism, which could improve all stakeholders’ profits by turning contract parameters. Kouvelis and Zhao [31] proved that the effect of applying revenue-sharing contracts with working capital coordination for the decentralized management of supply chains was better than buyback and quantity discount when there are bankruptcy risks and default costs. They also proposed that revenue-sharing contracts could be used to effectively achieve the desired working capital coordination.
As mentioned above, how to share risk and profit in a cooperative relationship is one of the most significant issues on both sides. The revenue-sharing contract has been proved to be an effective instrument for facilitating the coordination of bilateral cooperation and improving the profit of all stakeholders. Therefore, in this article, to motivate advertising contractors towards the responsible operation of the advertisement management task of a BSS and reassure them, the revenue-sharing contract was applied to the rational allocation of risk and profit on both sides. With the objective to encourage the operator to continue operating the BSS, the government could subsidize the operator to reduce the risk of bankruptcy. Otherwise, to incentivize the behavior of the operator (and if the advertising contractor could meet the requirements), the government could implement the incentive and punishment mechanism with the operator, and the operator could create incentives to encourage the advertising contractor to enhance its efforts.
The BSS as a project, which has a period of construction and operation, and goes through a long development process. The BSS has a massive need for infrastructure investment. However, government subsidy is subject to local fiscal revenue restrictions, and the benefits of advertising are impacted by the quantity of users in the BSS. Thus, the question of how to obtain an optimal decision to ensure that the BSS can develop sustainably when there are many constraints is the significant issue for this article to resolve. Previous studies have provided methods to obtain the optimal decision in a long and changing development period. For example, Zhu et al. [32] used a linear programming approach to support the decision-making process in industrial energy-management. They revealed the significance of such decision-making tools for energy planning and accounting; in industrial settings, different performance indicators can lead to different recommendations. Yu and Gao [33] proposed a discrete dynamic programming (DP) model for investment decision-making in environmental projects. The model they provided obtained the optimum investment strategy with the objective of minimizing costs and meeting the emission standard. The decision-making (DM) techniques for the construction of effective decision models for decision-maker selection can be divided into three types: multicriteria decision making (MCDM) techniques, mathematical programming (MP) techniques, and artificial intelligence (AI) techniques [34]. Dynamic programming, as an MP technique can make optimum strategy in a time-varying system under multiple constraints. Therefore, in this article, DP is utilized to solve the proposed problem.
Studies exploring the optimal operation decisions in various industries are plentiful. However, to our knowledge, the problem of exploring the optimal operation decisions of a BSS has never been studied. In this article, the objective function is to maximize the total revenue of a BSS, whilst ensuring that all stakeholders can meet their demands of expected profit, that is, to obtain the Pareto optimum solution during the period of the BSS operation.
3. Model Description
Two crucial factors in the sustainable development of a BSS are user trips and a positive return for each stakeholder in a BSS. Hence, a major challenge in modeling and formulating the optimal operation decision problem is to express the objective function accordingly. We did so by defining the objective function precisely as the profit of overall BSS in a period of development to be maximized.
In this section, as the increase in user trips is the key to the sustainable development of the BSS, and runs through the models proposed, the state transition equation of user trips is first introduced in Section 3.1. Next, to improve the operating performance of all partners, the incentive and punishment mechanism model of the government and the operator is established in Section 3.2. Finally, to optimize the benefit of the entire system, the profit function of the government, the operator and the advertising contractor are shown in Section 3.3. For the sake of convenience, the main notations exhibiting the major variables and parameters used throughout the models are shown in Table 1, and the rest of the parameter descriptions are shown in Table A1 of Appendix A.
3.1. The State Transition Equation of the User Trips
User trips in a BSS are a key indicator that the system can run smoothly. Only in the case of user trips is enough to attract external funding. In that way, in addition to outside influences (such as local climate, the construction of bike lanes and public recognition), main factors that lead the user trips to change are as follows:
- (i)
- The system scale. With the expansion of the system scale, it will be able to meet the travel needs of users. Only when the system is of a certain scale can local people appreciate the convenience of using bicycles. The system scale effect is described on the user trips as (, means the power of in stage ). Since the establishment of the station always starts in densely populated areas, with an increase in the number of stations, the population density around the new station becomes smaller, so it takes .
- (ii)
- The system service. As the user’s satisfaction determines the choice of their travel behavior, the service level from a BSS operator can directly affect the user’s satisfaction. Therefore, if a high level of service can create a convenient and comfortable experience for the user, then the user trips will increase, and vice versa (The system service effect is described on the user trips as . Based on the authors’ experiences, it is assumed that user trips will significantly rise with an increase in the service level when the service level is below a specific value, while the user trips do not apparently increase with an increase in the service level when the service level is above a specific value. Thus, we define [35]).
- (iii)
- The natural increase. With the development of the BSS and an increase in people’s environmental protection consciousness level, user trips will grow to a certain degree (The natural increase effect is described on the user trips as ).
Based on the analysis above, the expression for user trips growth in stage is as follows:
3.2. The Incentive and Punishment Mechanism Models
System profit is the second crucial factor that effects the sustainable development of a BSS. Each participant in the BSS must be profitable otherwise a party will exit, resulting in the system being unable to function properly. However, to facilitate the user and increase user trips, the charge of using a public bicycle is so low that the cost of operating cannot be filled. Thus, a suitable strategy of subsidy and externalizing internal benefits is the key to balancing the profit of a BSS. Hereby, the solutions proposed in this article will be described in detail from the perspective of the government and the operator, respectively.
3.2.1. The Incentive and Punishment Mechanism Models of the Government
To allow the support from the government to promote the development of a BSS effectively, it must develop policies of reward and punishment and subsidies related to the operating performance to restrain the behavior of the operator. Moreover, strategies proposed by the government should benefit an increase in user trips. Specific measures are as follows:
- (i)
- Investment expansion station. As an investor of a BSS, the government should aim to maximize their overall interests, and to formulate reasonable and feasible investment strategies for the station expansion. With continuous expansion of the BSS scale, user trips will also be enhanced.
- (ii)
- Subsidy policies. To support the continued operation of a BSS, the government has to provide a basic operating subsidy based on the number of stations. The subsidy policy is to develop a subsidy strategy that decreases year by year. This strategy could stimulate the operator actively to explore new ways to increase revenue and reduce government spending. The expression of the basic subsidy strategy is defined as follows:To ensure the sustainability of the BSS, depreciation funds must be withdrawn to support the upgrade of bicycles. The government has to pay depreciation funds at the early stage of construction, and the expression of the depreciation subsidy is defined as follows:In Equation (3), represents the depreciation expense of bicycles. represents the government will provide all depreciation expenses during the stage of construction, and will reduce the depreciation subsidy after the construction period. Moreover, the government could adjust the subsidy ratio by deciding the value of .
- (ii)
- Reward and punishment strategy. Since service level has a significant effect on the user trips; it is recommended that the government formulate the strategy of reward and punishment for the operator’s service level. The expression of the reward and punishment strategy is defined as follows:In Equation (4), we find that the intensity of punishment is greater than reward. This method assists in constraining the operator to maintain service quality at a stable level.
3.2.2. The Incentive and Punishment Mechanism Model of the Operator
In addition to effort to improve service level, the operator should also strive to externalize the internal benefits of the BSS, to reduce their dependence on government subsidy. The main measures are to translate the user trips into advertising effectiveness and carbon trading income. Specific measures are as follows:
- (i)
- Incentivizing the advertising contractor to actively cooperate and protect the advertising contractor’s profit level is one of the most effective measures. Thus, the following constraint is added to ensure that the advertising contractor’s profit margin is greater than the retained profit margin which is formulated by the operator:Since advertising effectiveness is related to the effort levels of the advertising contractor, the operator should encourage them to enhance their effort levels. Therefore, the retained profit margin that is formulated by the operator is set to relate to the effort level positively, as shown below:The operator can adjust the incentive strength by adjusting the value of .
- (ii)
- Translating the user trips into carbon trading income. Since traveling with bicycles does not yield any carbon, the BSS can reduce carbon emissions from the traffic area. Therefore, the operator could put the carbon emissions into the carbon market, and translate the environmental benefits into economic benefits. In order to calculate the carbon trading income, a new formula is proposed to determine it and is shown as follows:represents the transaction ratio, and is dependent on market saturation and the acceptance of carbon trading. In addition, although it failed at successful trading, the rest of the carbon emission reduction is also beneficial to society. Therefore, the benefits of the rest (the formula is shown in Equation (18)) will be included in the social benefits.
3.3. The Profit Functions of Stakeholders
3.3.1. The Profit Function of the Advertising Contractor
The advertisement resource in a BSS has an inherent benefit, which is obtained without any extra effort on behalf of the advertising contractor. The inherent benefit function of advertisement is estimated by the cost per thousand impressions is as follows:
where represents the possibility that the buying behavior generation of users in a BSS will increase with the improvement of a national economic level. represent the cost per thousand impressions. represents the “impression index”, and combines both the memorization and attention index during consumers observing commercials by tracking the electroencephalo- graph activity (EEG) [36]. It is always used to calculate the cost per impression (CPI), which is used to assess the cost effectiveness and profitability of advertising [37].
With an improvement of the advertising contractor’s effort level, such as more appealing presentation and more accurate market segmentation, the actual advertising profit will be a corresponding increase. The actual profit function of advertisement is as follows:
where represents the impact of market fluctuations on advertising profit, which is assumed that obeys a normal distribution (); and represents the impact coefficient of market random factors on advertising profit.
To share profit and risk with the advertising contractor, the operator selects a suitable proportion of allocation of the actual advertising profit. Thus, the advertising profit of the advertising contractor is as follows:
Then, the actual profit of the advertising contractor is as follows:
where represents the total cost of advertising; represents the effort cost of the advertising contractor; and represents the random risk caused by random factors.
Since the profit function of the advertising contractor has a feature of invariant absolute risk aversion, it is defined as follows:
3.3.2. The Profit Function of the Operator
The profit of the operator mainly consists of the government subsidy and the income obtained by externalizing internal benefits. The sum of government subsidies is as follows:
The profit function of the operator is defined as follows:
In Equation (14), represents the advertising revenue of the operator; and represents the cost of operating. When the service level is higher than the equilibrium state and the number of stations increases, the costs of operating also increase. represents the cost of depreciation at stage .
3.3.3. The Profit Function of the Government
The profit to the government consists of all social benefits and the total accumulated assets of the BSS, minus the cost of the subsidy and investment. The profit function of the government is defined as follows:
In Equation (15), represents the total accumulated assets of a BSS obtained by the government, and is made up of initial and new assets, the expression of it is as follows:
represents the investment of the government, which contains the addition of a new part only, the expression of it is as follows:
represents the carbon emission reduction benefit of the government, which only calculates the part without input into the carbon trading market. The design formula of the carbon emission reduction benefit of the government is as follows:
represents the energy-conserving benefit of the government. Since using bicycles instead of a vehicle that consumes gasoline will reduce the consumption of non-renewable energy. Therefore, using bicycles will produce an energy-conserving benefit. The design formula of it is shown as follows:
represents the exhaust gas treatment benefit of the government. As the exhaust gas contains many sulfides, nitrides and dust and other pollutants in addition to carbon dioxide, it causes pollution in the atmosphere, and the government has to invest in programs to treat the air pollution. Since public bicycles reduce the vehicle exhaust emissions, it is of benefit in atmospheric controlling. Therefore, using bicycles will produce an exhaust gas treatment benefit. The design formula of it is shown as follows:
In Equations (18)–(20), we assumed that different type of vehicles have a similar fuel consumption, so we took the average fuel consumption into calculation.
represents the health benefit of the government. The bicycle requires manpower to drive, so users are exercising during riding. That is, users of the BSS will do more exercise than the people who drive a motorized vehicle. Some reports have pointed out that people who exercise often have significantly better health than those who do not. Thus, a BSS user will exercise more and therefore improve their health, and their medical expenses will decrease. The design formula of the health benefit is shown below:
In Equation (21), represents the average medical expense per person per year, from the calendar year of statistical data regression can get its time-varying law:
represents the transport capacity substitution benefit of the government. With the development of the BSS, its advantages in short distance travel will become increasingly apparent. This will assist in alleviating passenger pressures on buses and taxis, and indirectly reduce infrastructure investment on those modes of transport, thereby saving social resources. As this saved social resource is the transport capacity substitution benefit of a BSS, the design formula is showed as follows:
In Equation (23), represent the BSS shares the user trips for bus and taxi each year, respectively.
4. Model Formulation
In a BSS, the government commissioned operator responsible for operating the business, and grants it the right of transfer bicycle advertising; the operator commissioned advertising contractor is responsible for advertising the business. This is a three stage of the Stackelberg game, where the specific game process is: first, the government as a leader and the operator as a follower. The government seeks the BSS Pareto optimal profit as the goal to determine the number of subsidies and investment decisions. Based on the decisions of the government, the operator is able to choose the service level that maximizes their own benefit. Second, the operator as a leader and the contractor as a follower. The operator maximizes the benefits as the goal, determines the incentive strength, and the advertising revenue allocation proportion. As per the decisions of the operator, the advertising contractor can choose the effort level that maximizes their own benefit. These gaming processes for the subgame-perfect equilibrium are solved by using backward induction.
4.1. The Advertising Contractor Determines the Optimal Effort Level
As described above, the crux of the advertising contractor is to choose a suitable effort level to maximize their profit. Differentiating the profit function of the advertising contractor with respect to yields:
where to ensure the concavity of the function , then let in Equation (24), which generates the optimal of the advertising contractor:
4.2. The Operator Determines the Advertising Revenue Allocation Proportion
Since the objective of the operator is to maximize their profit, it must be ensured that the profit margin is not lower than the retention value. Therefore, substituting into the function of the advertising contractor’s profit margin shown below, the optimal advertising revenue allocation proportion can be obtained.
The specific solution of the advertising revenue allocation proportion is shown in Appendix B.
4.3. The Operator Determines the Service Quantity Level
The crux of the operator here is to choose a suitable service level to maximize their profit. Differentiating the profit function of the operator with respect to yields:
where to ensure the concavity of the function , then let in Equation (27), which generates the optimal of the operator:
4.4. The Government Determines Optimal Decisions
The government can influence the operational effectiveness of a BSS by adjusting the subsidy coefficient, rewards and punishments coefficient and investment decision-making. The government should seek Pareto optimal decision-making under all constraints (that is, the profit margin of the advertising contractor must be no lower than the retention value. The profit of the operator must be a positive earning. The single phase of the capital investment must be less than the maximum investment of the government in every stage. The total investment amount must meet the limit).
To solve the above-mentioned problem, a dynamic programming model was constructed to solve the optimal investment decision of the government. The concrete model is as follows:
- (i)
- Decision variables:
- (ii)
- State variables:
- (iii)
- State-transition function:
- (iv)
- Objective function:
The state-transition function in Equation (29) represents the user trips in a new stage based on the state and decision in the last stage, which provided a detailed description in Section 3.1. The state-transition function in Equation (30) represents the remaining number of stations that need to be built in new stage (), which is obtained by the remaining number of stations that need to be built in the last stage () minus the number of new stations () added in this period.
In the objective function (Equation (31)), the first equation is to maximize the profit of the entire system (the sum of the profit of the government, the operator and the advertising contractor) during the operation period (from 0 to ). Based on the reason that the operator is the key in the BSS operational chain, which determines the final operating performance, and the government and the advertising contractor would like to maintain a cooperative relationship when the profits reach their expectations, the second equation is to maximize the profit of the operator during the operational period. For the constraint in this objective function, the first constraint represents the profit of the operator in every stage must be greater than zero. The second constraint represents that the profit margin of the advertising contractor in every stage must be greater than the retained profit margin that they formulate. These two constraints ensure that the operator and the advertising contractor will not leave the BSS due to unprofitability. The third constraint represents that the sum of the investment and the subsidy from the government in every stage must be less than the maximum amount of financial expenditure at one stage. The fourth constraint represents that the sum of the investment and subsidy from the government during the operation period must be less than the maximum amount of financial expenditure in the BSS. These two constraints ensure that the objective function is more consistent with the reality as the financial expenditure of any government has a certain limit and budget.
Since the state-transition process in this model is time-dependent, an algorithm that supports timing characteristics must be used to solve the optimal investment decision-making in each period. Solving the problem presented above may be time-consuming, even in instances of moderate size. Thus, in the next section, the way to speed up the computation time of the solving process will be discussed.
5. Algorithmic Enhancements
In this section, the iterative method was used for the above model to solve the optimal solution. The description of the solution process is as follows:
- (i)
- Determine the initial value, the search scope, and step length of decision variables.
- (ii)
- Solve the optimal value of decision variables: fix all the values of the decision variables, except the one waiting to be solved; find the optimal value for each discrete point of this decision variable in the search range (each discrete point can determine an optimal investment decision-making time series, which is solved by depth-first search algorithm); and select the discrete point that can maximize the objective function to replace the initial/last value.
- (iii)
- Repeat Step (ii) to solve the optimal value of other decision variables, until every decision variable has found the optimal value.
- (iv)
- Repeat Steps (ii) and (iii), until the optimal value of all decision variables remains unchanged.
In theory, it is feasible to use the depth-first search (DFS) algorithm to search all possible solutions to find the optimal investment decision-making process. However, since there are too many possible solutions for decision variables, for example, if 1300 stations needed investment over 10 stages in an operational period, the number of possible solutions may be about 10 × 1010. Directly using the depth-first algorithm will lead to a large amount of computation, and computing speed is very slow. Moreover, since the chromosome is long, the iterative computation time is also long, and the genetic algorithm is not suitable for this model and neither is the breadth-first algorithm as memory consumption is too large. Therefore, a Variable Granularity (VG) method [38] was provided to improve the DFS algorithm to a VG-DFS algorithm. Numerical experiments proved that the new algorithm could effectively improve computing speed (from more than two hours to a few minutes, by a computer with Intel Core i7 processor).
The principle of VG-DFS algorithm is as follows:
- (i)
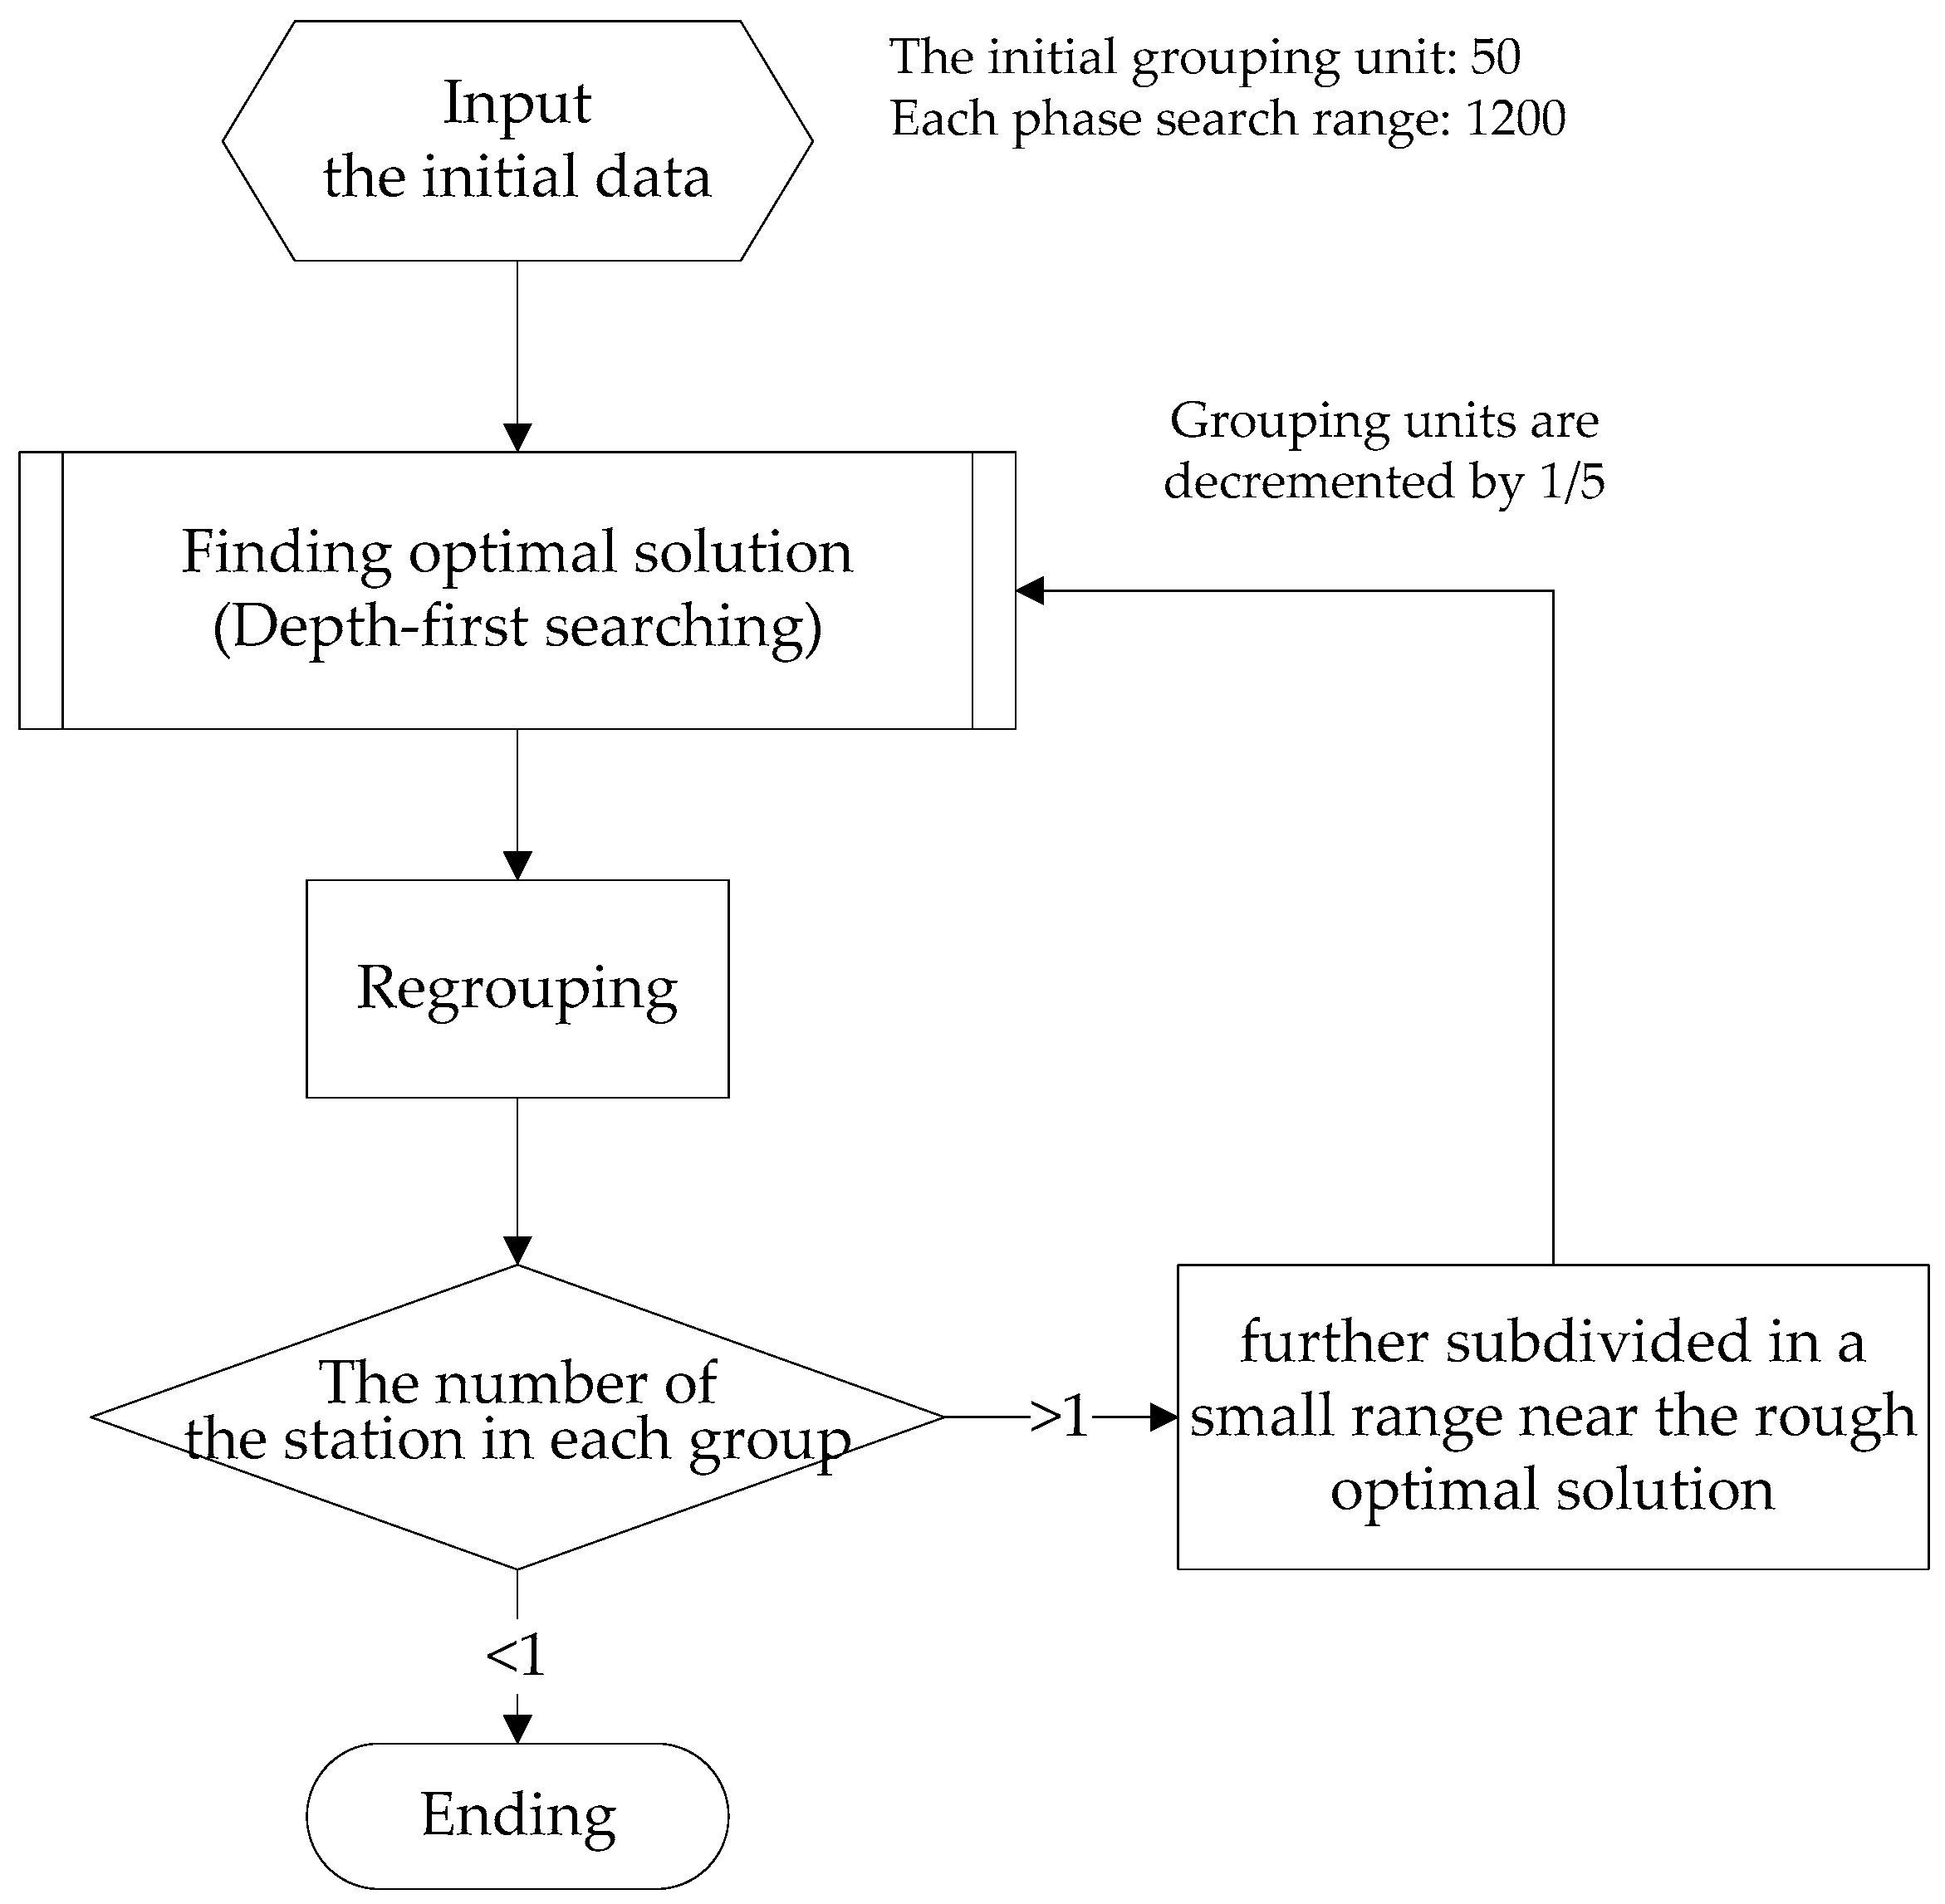
- Divide into groups. The optional set of decision variables will be significantly reduced through grouping, for example, every 100 stations are divided into a group, so the station variables inserted into the calculation will from 1300 to13 groups. Thus, the rough optimal solution can be obtained quickly by the depth-first algorithm. (The grouping mechanism: group is the extent to which a possible solution set is composed of distinguishable pieces. In the calculation, first, the group is composed of coarse-grained distinguishable pieces. Then, in the next stage, the group is composed of finer distinguishable pieces. In this article, we let a refined group shrink fivefold over the group in the previous stage. In this part, we suggest that interested readers investigate the definition of “granularity” [39] to deepen understanding).
- (ii)
- Subdivide. Further subdivided within a small range near the rough optimal solution obtained in Step (i) (for example, the rough optimal solution result is 800, the small range near it is 100, so the value range in the next stage is 700–900. Then, every 100/5 stations are subdivided into a group, there are 10 groups now). The optimal solution can also be obtained quickly after refinement.
- (iii)
- Repeat the second step. Subdivide the result again until it cannot be subdivided (for example, the number of stations in the group divided by five is smaller than 1), the final optimal solution is obtained.
According to the principle of the algorithm, the algorithm flow chart can be obtained, as seen in Figure 1.
6. Numerical Experiments
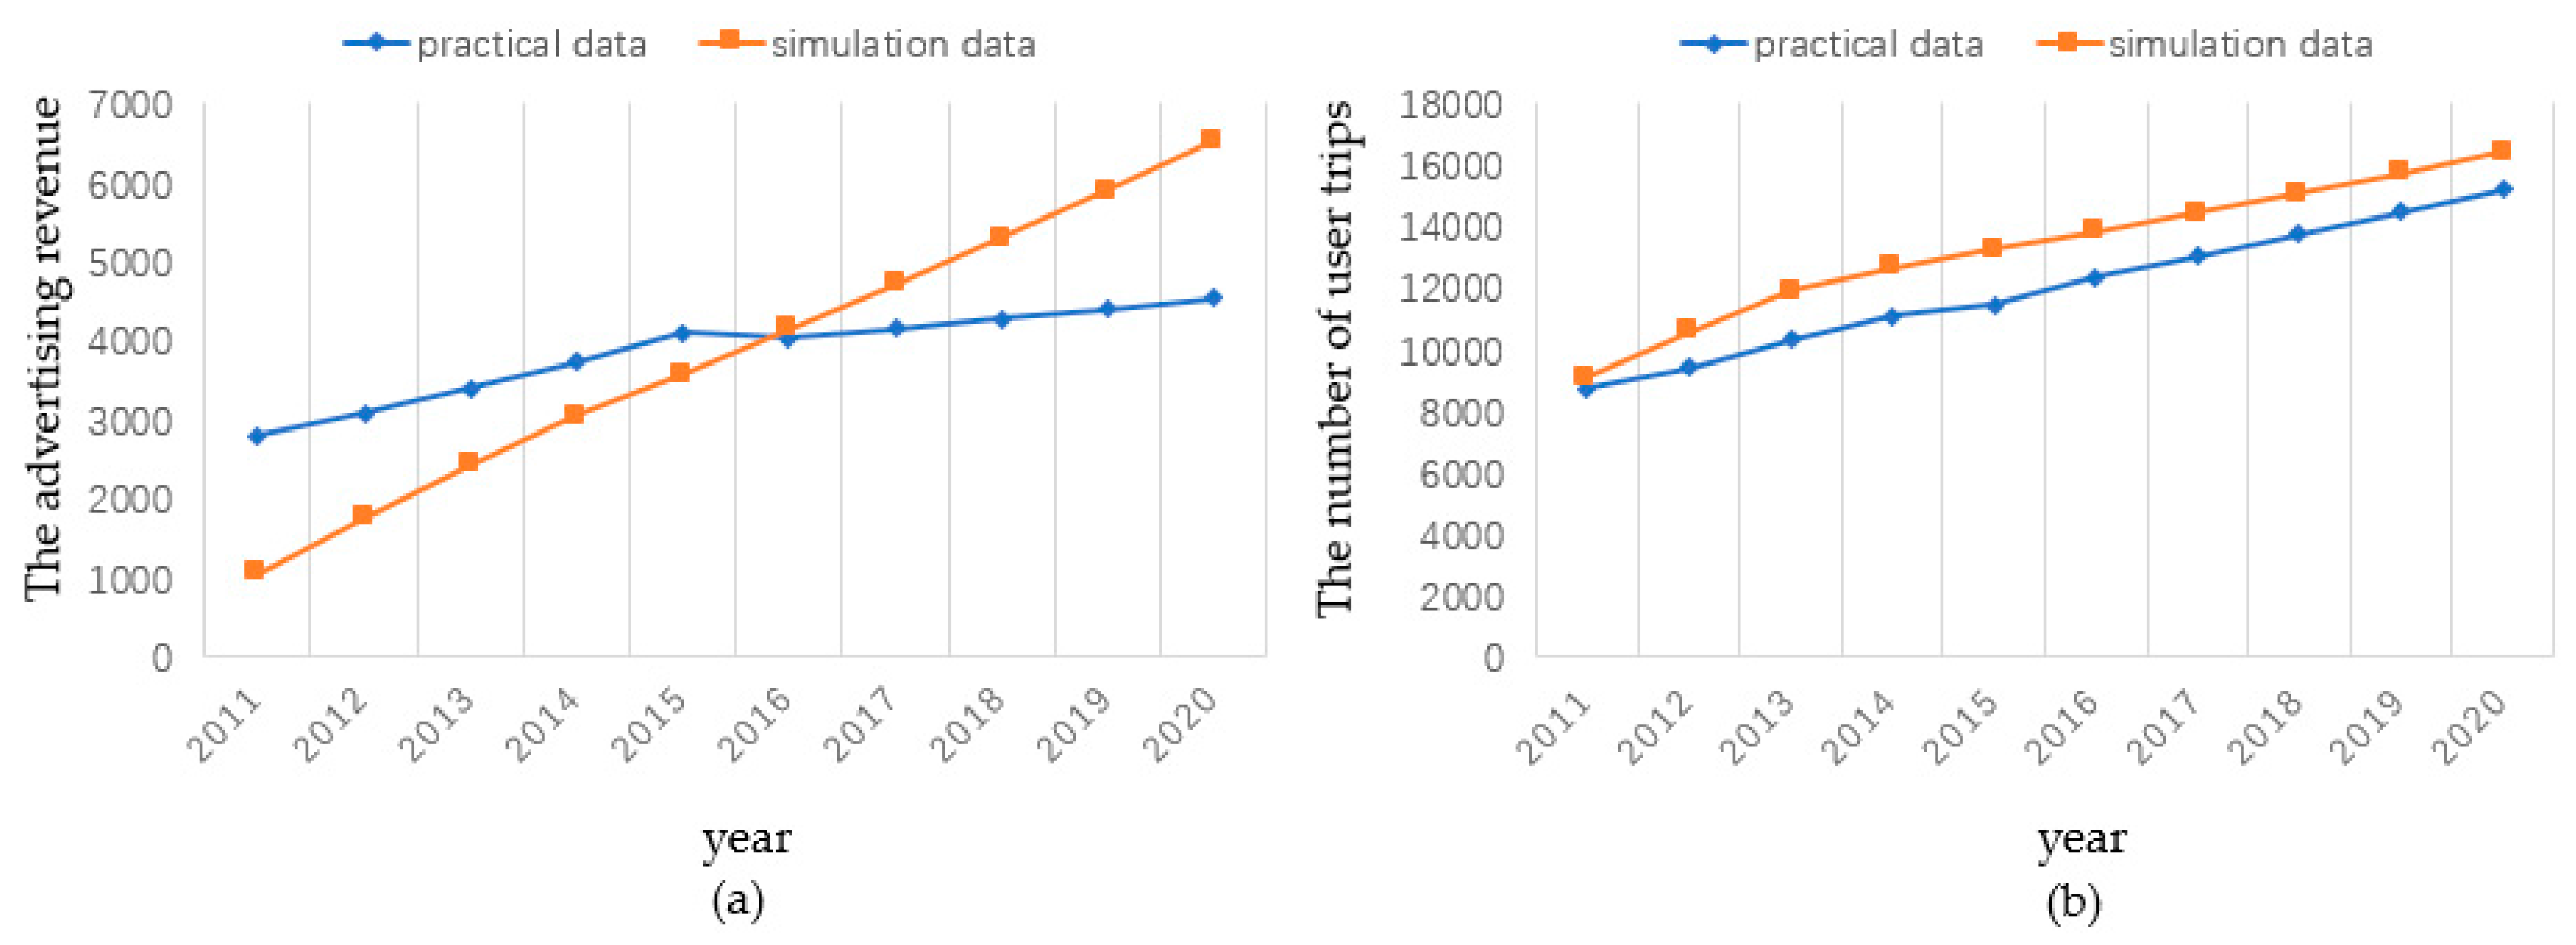
In this section, the performance of the models introduced in Section 3 and Section 4 is demonstrated, along with the algorithmic enhancements presented in Section 5, when solving instances of practical size. The VG-DFS algorithm and the process of the solution were coded here using a general-purpose programming language: C#. The comparison of the result obtained by using the practical operational data from the BSS in Hangzhou (which reflects the BSS developing trend under the existing economic environment and current operational strategies, without any optimization adjustment) and the result obtained from the model provided (the start counting data used in the model was from the BSS in Hangzhou) is presented in this section. Hangzhou BSS was established in 2008, after nine years of development has established 3737 service stations, and put 85,800 bicycles in the city. In this BSS, the number of times bicycles had been rented reached 115 million in 2016, and this number reached 744 million from 2008 to the end of January 2017. At present, this system is the world’s largest BSS [40]. The developing trend of the major parameters including advertising revenue and user trips from both real data [41,42] and predicted by our model are shown in Figure 2.
Table A2 presents the values of the parameters used in the dynamic programming model, which is shown in Appendix A.
Figure 2a shows the advertising revenue in the BSS from the practical and simulation data. The advertising management rights transfer policy of the BSS in Hangzhou, is based on a five-year contract (the first period was from 2011 to 2015, the second period is from 2016 to 2020), and the transfer fee is set at a fixed growth rate in each year. The simulation data predicted by our model was based on the changing of user trips, under the condition of using the optimal operating strategy. Thus, the change in advertising revenue in the real data is gentler, while the simulation data are steeper. However, the total advertising revenue over the ten-year period was basically the same.
Figure 2b is the number of user trips in the BSS from the practical data and simulation data. It can be observed that the simulation data and the practical data of the changing curve had a good degree of fit. The BSS in Hangzhou was one of the most successful projects around the world, and the numerical experiment indicated that the effect of our model would be similar; therefore, the operating strategy and the solution of optimal decision-making proposed in the model had feasibility and superiority. Just to be clear, the number of user trips from the practical data of 2017–2020 is predicted using the linear regression equation, which is calculated by the practical data of 2011–2016.
Next, it was necessary to analyze the optimal investment strategy under this condition. As shown in Table 2, regardless of the impression index value, the optimal investment strategy was to invest in stations as much as possible at the beginning, and then gradually reduce funding. This illustrated that the BSS needed to form economies of scale rapidly, in order to obtain the best benefits. From Table 2, it can be observed that the profit of the total BSS was positive, and as the value of the impression index increased, profit increased, and the total investment of the government decreased. Since the value of the impression index can reflect the possibility that the customer generates the purchase behavior after paying attention to an advertisement, and the purchase behavior is affected by the purchasing ability, the impression index value is also affected by the purchasing ability of the customer. Thus, the higher the local economic development level, the stronger the purchasing ability of advertising audiences in a BSS, the higher the value of the impression index. Therefore, it illustrates that a BSS in relatively economically developed areas can produce considerable economic benefits, and has a higher return on investment than in less developed areas.
As for the service level standard of the operator, the changing trend is with the increase of the impression index value. This indicates that the decision-making of limiting service quality of the operator to a higher level is the most beneficial method of enhancing the overall efficiency of the BSS.
The reward subsidy adjustment coefficient significantly increases when the impression index value increases. This suggests that a greater incentive and punishment intensity is needed to achieve the best effect when the BSS is in an economically developed region. As the advertising revenue is considerable, the operator would likely decrease the cost of operating if the incentive and punishment intensity of the service quality level is not sufficiently powerful.
7. Conclusions and Discussion
This article defines and formulates a revenue structure optimization model motivated by the need to achieve sustainable development in the BSS. Proper supervision and incentive mechanisms among stakeholders are important factors in the success of a BSS. This article is the first attempt to consider the revenue optimization decision problem, to formulate it as a dynamic program, and address various technical obstacles arising from solving large instances. In our model, the objective was to maximize the profit of the whole BSS under the condition of guaranteeing the interests of all stakeholders. To ensure the profit obtained by the stakeholders could meet their expected return, co-operative mechanisms with both incentive and oversight have been established. Given the long construction period of the BSS, this objective function becomes the optimization of the dynamic processes with time division. Next, the VG-DFS algorithm was developed to improve the speed of solving the model. Finally, a comparison of the results was obtained through practical data and simulation data.
This article found the following:
- (i)
- The BSS has the potential to achieve break-even, or even obtain a substantial income, when it implements suitable mechanisms and operational strategies, and the region in which it is located has a relatively high GDP.
- (ii)
- The proposed models were shown to be feasible and superior, which can provide guidance for operational decisions in a BSS or any other similar system.
- (iii)
- The best investment strategy in a BSS was to invest in stations, in the initial period of construction, as much as possible, and then reduce the investment year by year. Additionally, BSSs in economically developed areas have lower optimal operating subsidies than do economically underdeveloped areas, but the optimal intensity of rewards and punishments is higher in the former than in the latter.
In summary, the results illustrate the importance and necessity of investing in a BSS for its strong positive externalities, when under a sustainable development perspective. The proposed operation optimization model can be used to effectively achieve break even or obtain positive net payoff among all stakeholders in a BSS. As the locations of different BSSs have different trip purposes, terrain features, and recognition degrees, in addition to different levels of economic development, it might be challenging to find the optimal operation strategy by considering all influence factors. In these situations, the question of how to adjust the optimal strategy according to the characteristics of each BSS with a flexible model design to enhance the applicability and performance of the model remains a challenging research direction.
Supplementary Files
Supplementary File 1Acknowledgments
This study was supported by the Natural Science Foundation of China (No. 70971036) and the Social Science Late Foundation of China (No. 13FGL005).
Author Contributions
Linfeng Li and Miyuan Shan conceived and designed the experiments; Linfeng Li performed the experiments; Linfeng Li and Miyuan Shan analyzed the data; Sheng Liang and Ying Li contributed reagents/materials/analysis tools; and Linfeng Li wrote the paper.
Conflicts of Interest
The authors declare no conflict of interest.
Appendix A
The notations of the parameters used in this article are in Table A1, which are not presented in Table 1.

Table A1.
Notation list.
| Notation | Definition |
|---|---|
| The fixed operating subsidy for the operator | |
| The unit construction cost of the bicycle station | |
| The random variable | |
| The cost of advertising in unit bicycle station by the advertising contractor | |
| The basic operating cost of the operator | |
| The operating cost of unit bicycle station | |
| The carbon trading income of the operator in stage | |
| The sum of subsidies by the government given to the operator in stage | |
| The benefit of carbon emission reduction, energy-conserving, exhaust gas treatment, health and transport capacity substitution in stage , respectively | |
| The total accumulated assets of a BSS obtained by the government | |
| The cost coefficient of financial expenditure of the government | |
| The sum of the investment amount to build bicycle stations from the government | |
| The amount of new bicycle stations which are built during the operation period | |
| The amount of the bicycle stations at the beginning of the operation period | |
| The average distance of trip riding time by the public bicycle | |
| The average consumption of gasoline by vehicles | |
| The amount of carbon dioxide emission reduction of saving one liter of gasoline | |
| The unit price of carbon trading | |
| The bicycle replacement rate for bus, taxi, car and motorcycle, respectively | |
| The conversion coefficient of bus, taxi, car and motorcycle converted to vehicle, respectively | |
| The transaction ratio of carbon emission reduction from a BSS | |
| The average price of one liter of gasoline | |
| The exhaust gas of burning one liter of gasoline | |
| The cost of pollution treatment of | |
| The average travel times of users during one day | |
| The proportion of regular exercise group relative to lack of exercise group in reducing medical expense | |
| The average medical expense per person per year | |
| The regression coefficient of | |
| Year | |
| The unit cost of buying a bus and a taxi, respectively | |
| The depreciation life of a bus and a taxi, respectively | |
| The average passenger capacity of bus and taxi in one trip, respectively | |
| The average times of a bus departuring and a taxi carrying passengers in one day | |
| The transforming volume of the bicycle to the bus and the taxi in one year, respectively | |
| The average usage counter of the bicycle in a BSS in one year |
The values of the parameters used in the dynamic programming model are shown in Table A2.
Table A2.
The value of parameters.
| Parameter | Value | Remark | Parameter | Value | Remark |
|---|---|---|---|---|---|
| Parameters | Coefficients | ||||
| ¥ 10–20 ten thousand/thousand people | Assumption | 0.9 | Expert | ||
| ¥1 ten thousand | Assumption | 0.75 | Expert | ||
| ¥300 ten thousand | Expert | 10 | Assumption | ||
| ¥0.75 ten thousand | Expert | 1.5% | Expert | ||
| ¥35,000 ten thousand | Assumption | 10% | Assumption | ||
| ¥250,000 ten thousand | Assumption | 2 | Expert | ||
| ¥30 ten thousand | [43] | 7% | Assumption | ||
| ¥30 ten thousand | [43] | 7% | [44] | ||
| ¥0.5 ten thousand/station | [43] | 1 | Expert | ||
| ¥10 ten thousand | [43] | 0.33 | Expert | ||
| ¥2.5 ten thousand/station | [43] | 1 | Expert | ||
| 1300 stations | [41] | 1 | Expert | ||
| 2411 stations | [41] | 25% | Expert | ||
| 3.5 km | [43] | 0.052 | [45] | ||
| 9 L/100 km | [43] | 0.068 | [45] | ||
| 2.3 km/L | Expert | 0.238 | [45] | ||
| ¥35/ton | [46] | 0.027 | [45] | ||
| ¥6/L | Assumption | 1 | Assumption | ||
| 11.82 km/L | Expert | 1 | Assumption | ||
| ¥0.25 ten thousand/ton | Expert | 0.05555556 | Assumption | ||
| 3/day | [41] | 0.3 | Assumption | ||
| ¥60 ten thousand | Assumption | 0.15 | Assumption | ||
| ¥15 ten thousand | Assumption | 0.4 | Expert | ||
| 10 years | Assumption | 284.53 | Expert | ||
| 10 years | Assumption | 570,426 | Expert | ||
| 30 people | Assumption | ||||
| 2 people | Assumption | ||||
| 10 times/day | Assumption | ||||
| 30 times/day | Assumption | ||||
Explanatory notes: the “Expert” in Table A2 means the value of the parameter is estimated by interviewing with several experts in management science field.
Appendix B
The specific solution of the advertising revenue allocation proportion is shown in this part. The solving process is as follows:
Firstly, by expanding Equation (26), the result is:
Next, to facilitate the calculation, the equation above is simplified according to the principle below:
It can be obtained by the simplified equation as follows:
Solving the optimal value of , we obtain , and obeys the following formula:
In this equation, and .
When , has real number solution as follows:
When , has three unequal real roots:
In these expressions of the solution, and . Then it takes the smallest solution between 0 and 1.
References
- DeMaio, P. Bike-sharing: History, impacts, models of provision, and future. J. Public Transp. 2009, 12, 3. [Google Scholar] [CrossRef]
- Shaheen, S.; Guzman, S.; Zhang, H. Bikesharing in Europe, the Americas, and Asia: Past, present, and future. Transp. Res. Rec. J. Transp. Res. Board 2010, 2143, 159–167. [Google Scholar] [CrossRef]
- Zhang, L.; Zhang, J.; Duan, Z.Y.; Bryde, D. Sustainable bike-sharing systems: Characteristics and commonalities across cases in urban China. J. Clean. Prod. 2015, 97, 124–133. [Google Scholar] [CrossRef]
- Wikipedia. List of Bicycle-Sharing Systems. Available online: https://en.wikipedia.org/wiki/List of_bicycle-sharing_systems#Cities (accessed on 24 May 2017).
- Xinhua Net. Wuhan: Government Invested 300 Million Yuan in Public Sharing System but It Failed with Four Year, Why? Available online: http://news.xinhuanet.com/politics/2014-04/13/c_1110219296.htm (accessed on 25 May 2017).
- Midgley, P. Bicycle-Sharing Schemes: Enhancing Sustainable Mobility in Urban Areas; United Nations, Department of Economic and Social Affairs: New York, NY, USA, 2011; pp. 1–12. [Google Scholar]
- Benchimol, M.; Benchimol, P.; Chappert, B.; De La Taille, A.; Laroche, F.; Meunier, F.; Robinet, L. Balancing the stations of a self service “bike hire” system. RAIRO Oper. Res. 2011, 45, 37–61. [Google Scholar] [CrossRef]
- Forma, I.; Raviv, T.; Tzur, M. The static repositioning problem in a bike-sharing system. In Proceedings of the 7th Triennial Symposium on Transportation Analysis (TRISTAN), Tromsø, Norway, 20–25 June 2010; Volume 6, pp. 279–282. [Google Scholar]
- Raviv, T.; Tzur, M.; Forma, I.A. Static repositioning in a bike-sharing system: Models and solution approaches. EURO J. Transp. Logist. 2013, 2, 187–229. [Google Scholar] [CrossRef]
- Ho, S.C.; Szeto, W.Y. Solving a static repositioning problem in bike-sharing systems using iterated tabu search. Transp. Res. Part E Logist. Transp. Rev. 2014, 69, 180–198. [Google Scholar] [CrossRef]
- Dell’Amico, M.; Hadjicostantinou, E.; Iori, M.; Novellani, S. The bike sharing rebalancing problem: Mathematical formulations and benchmark instances. Omega 2014, 45, 7–19. [Google Scholar] [CrossRef]
- Erdoğan, G.; Battarra, M.; Calvo, R.W. An exact algorithm for the static rebalancing problem arising in bicycle sharing systems. Eur. J. Oper. Res. 2015, 245, 667–679. [Google Scholar] [CrossRef]
- Di Gaspero, L.; Rendl, A.; Urli, T. Balancing bike sharing systems with constraint programming. Constraints 2016, 21, 318–348. [Google Scholar] [CrossRef]
- Rainer-Harbach, M.; Papazek, P.; Raidl, G.R.; Hu, B.; Kloimüllner, C. PILOT, GRASP, and VNS approaches for the static balancing of bicycle sharing systems. J. Glob. Optim. 2015, 63, 597–629. [Google Scholar] [CrossRef]
- Szeto, W.Y.; Liu, Y.; Ho, S.C. Chemical reaction optimization for solving a static bike repositioning problem. Transp. Res. Part D 2016, 47, 104–135. [Google Scholar] [CrossRef]
- Ho, S.C.; Szeto, W.Y. A hybrid large neighborhood search for the static multi-vehicle bike-repositioning problem. Transp. Res. Part B 2017, 95, 340–363. [Google Scholar] [CrossRef]
- Li, Y.F.; Szeto, W.Y.; Long, J.C.; Shui, C.S. A multiple type bike repositioning problem. Transp. Res. Part B 2016, 90, 263–278. [Google Scholar] [CrossRef]
- Kloimüllner, C.; Raidl, G.R. Full-load route planning for balancing bike sharing systems by logic-based benders decomposition. Networks 2017, 69, 270–289. [Google Scholar] [CrossRef]
- Shu, J.; Chou, M.C.; Liu, Q.; Teo, C.P.; Wang, I.L. Models for effective deployment and redistribution of bicycles within public bicycle-sharing systems. Oper. Res. 2013, 61, 1346–1359. [Google Scholar] [CrossRef]
- Li, L.; Shan, M. Bidirectional incentive model for bicycle redistribution of a bicycle sharing system during rush hour. Sustainability 2016, 8, 1299. [Google Scholar] [CrossRef]
- Shaheen, S.A.; Martin, E.W.; Cohen, A.P.; Chan, N.D.; Pogodzinsk, M. Public Bikesharing in North America during a Period of Rapid Expansion: Understanding Business Models, Industry Trends & User Impacts; Mineta Transportation Institute: San Jose, CA, USA, 2014; pp. 12–29. [Google Scholar]
- Ricci, M. Bike sharing: A review of evidence on impacts and processes of implementation and operation. Res. Transp. Bus. Manag. 2015, 15, 28–38. [Google Scholar] [CrossRef]
- Nakamura, H.; Abe, N. Evaluation of the hybrid model of public bicycle-sharing operation and private bicycle parking management. Transp. Policy. 2014, 35, 31–41. [Google Scholar] [CrossRef]
- Zhang, X. Critical success factors for public–private partnerships in infrastructure development. J. Constr. Eng. Manag. 2005, 131, 3–14. [Google Scholar] [CrossRef]
- Chen, L.T. Dynamic supply chain coordination under consignment and vendor-managed inventory in retailer-centric B2B electronic markets. Ind. Mark. Manag. 2013, 42, 518–531. [Google Scholar] [CrossRef]
- Pongsiri, N. Regulation and public-private partnerships. Int. J. Public Sect. Manag. 2002, 15, 487–495. [Google Scholar] [CrossRef]
- Ho, T.H.; Su, X.; Wu, Y. Distributional and peer-induced fairness in supply chain contract design. Prod. Oper. Manag. 2014, 23, 161–175. [Google Scholar] [CrossRef]
- Xu, G.; Dan, B.; Zhang, X.; Liu, C. Coordinating a dual-channel supply chain with risk-averse under a two-way revenue sharing contract. Int. J. Prod. Econ. 2014, 147, 171–179. [Google Scholar] [CrossRef]
- Cachon, G.P.; Lariviere, M.A. Supply chain coordination with revenue-sharing contracts: Strengths and limitations. Manag. Sci. 2005, 51, 30–44. [Google Scholar] [CrossRef]
- Giannoccaro, I.; Pontrandolfo, P. Supply chain coordination by revenue sharing contracts. Int. J. Prod. Econ. 2004, 89, 131–139. [Google Scholar] [CrossRef]
- Kouvelis, P.; Zhao, W. Supply chain contract design under financial constraints and bankruptcy costs. Manag. Sci. 2015, 62, 2341–2357. [Google Scholar] [CrossRef]
- Zhu, Q.; Lujia, F.; Mayyas, A.; Omar, M.A.; Al-Hammadi, Y.; Al Saleh, S. Production energy optimization using low dynamic programming, a decision support tool for sustainable manufacturing. J. Clean. Prod. 2015, 105, 178–183. [Google Scholar] [CrossRef]
- Yu, S.; Gao, S. A dynamic programming model for environmental investment decision-making in coal mining. Appl. Energy 2016, 166, 273–281. [Google Scholar] [CrossRef]
- Chai, J.; Liu, J.N.; Ngai, E.W. Application of decision-making techniques in supplier selection: A systematic review of literature. Exp. Syst. Appl. 2013, 40, 3872–3885. [Google Scholar] [CrossRef]
- Jonsson, P.; Eklundh, L. Seasonality extraction by function fitting to time-series of satellite sensor data. IEEE Trans. Geosci. Remote Sens. 2002, 40, 1824–1832. [Google Scholar] [CrossRef]
- Kong, W.; Zhao, X.; Hu, S.; Vecchiato, G.; Babiloni, F. Electronic evaluation for video commercials by impression index. Cogn. Neurodyn. 2013, 7, 531–535. [Google Scholar] [CrossRef] [PubMed]
- Farris, P.; Bendle, N.; Pfeifer, P.; Reibstein, D. Marketing Metrics: The Manager’s Guide to Measuring Marketing Performance; FT Press: Upper Saddle River, NJ, USA, 2015. [Google Scholar]
- Tenbrink, T.; Winter, S. Variable granularity in route directions. Spat. Cogn. Comput. 2009, 9, 64–93. [Google Scholar] [CrossRef]
- Wikipedia. Granularity. Available online: https://en.wikipedia.org/wiki/Granularity (accessed on 24 May 2017).
- Surging News (Shanghai). The “Survival Report” of Bike Sharing: What Is the Future Development of Hangzhou BSS? Available online: http://news.163.com/17/0331/10/CGRNTHK4000187VE.html (accessed on 24 May 2017).
- Why Could the Bicycle Sharing System in Hangzhou Succeed? A New Line of the Urban Institute. Available online: https://zhuanlan.zhihu.com/p/21716193 (accessed on 24 May 2017).
- Hangzhou Daily. 675 Million User Trips in 8 Years, How Could Hangzhou Public Bicycle to Draw Attention of the World. Available online: http://zjnews.zjol.com.cn/zjnews/hznews/201608/t20160808_1832367.shtml? open_source=weibo_search (accessed on 24 May 2017).
- Chao, X. The Research on Cost-Effectiveness of a Bicycle Sharing System. Master’s Thesis, Chang’an University, Xi’an, China, 2015. [Google Scholar]
- China Economic Net. Data Presentation: The General Survey of the GDP and Growth Rate in China, 1980–2014. Available online: http://intl.ce.cn/specials/zxxx/201501/20/t20150120_4389486.shtml (accessed on 24 May 2017).
- Tianjun, F. The Effect Analysis on Public Bicycle Traffic System. Ph.D. Thesis, Jilin University, Changchun, China, 2016. [Google Scholar]
- Hangzhou Daily. Hangzhou Bicycle Sharing System Participate in the Carbon Emissions Trading for the First Time. Available online: http://hznews.hangzhou.com.cn/chengshi/content/2013-05/04/content_4721591.htm (accessed on 25 May 2017).
Figure 1.
The VG-DFS algorithm flow chart.

Figure 2.
The comparison of the real data and the results of numerical simulation ().

Table 1.
Nomenclature list.
| Nomenclature | |
|---|---|
| Sets | |
| Set of time stages, indexed by | |
| Set of the optimal number of building bicycle stations in stage | |
| State Variables | |
| The user trips of the BSS in stage | |
| The remaining amount of bicycle stations that need the BSS to build in stage | |
| Decision Variables | |
| The construction cycle of a BSS | |
| The retention proportionality coefficient of the depreciation subsidy formulated by the government | |
| The critical value of service level evaluation index of the operator formulated by the government | |
| The strength adjustment coefficient of the reward and punishment subsidy formulated by the government in stage | |
| The unit subsidy proportion of operation and maintenance formulated by the government | |
| The incentive strength of the effort degree of the advertising contractor formulated by the operator | |
| Parameters | |
| The decay coefficient of population density | |
| The growth rate of the bicycle station | |
| The number of the bicycle station in the BSS in stage | |
| The service level evaluation index of the operator in stage | |
| The influence coefficient of service level on the growth of the user trips | |
| The maximum value of | |
| The adjustment coefficient of service level | |
| The natural growth rate of the user trips | |
| The depreciation rate of the public bicycle | |
| The utility coefficient of reward and punishment of the operator’s service level | |
| The remained profit margin of the advertising contractor formulated by the operator, according to the effort degree of the advertising contractor | |
| The remained profit margin of the advertising contractor decided by itself | |
| The actual profit of the advertising contractor in stage | |
| The advertising revenue of the advertising contractor in stage | |
| The effort degree of the advertising contractor for operating the advertising business of the BSS in stage | |
| The inherent income of advertisement in the BSS in stage | |
| The coefficient of GDP growth | |
| The impression index | |
| The constant term of the impression index | |
| The actual revenue of advertisement in the BSS in stage | |
| The influence coefficient of the advertising random factor | |
| The efficiency conversion coefficient of the effort degree of the advertising contractor | |
| The advertising revenue distribution coefficient formulated by the operator in stage | |
| The effort cost coefficient of the advertising contractor | |
| The cost coefficient of the operator’s service level | |
| The risk utility coefficient of the advertising contractor | |
| The variance of the advertising random factor | |
| The profit of the advertising contractor, the operator and the government in stage , respectively | |
| The maximum amount of investment by the government in the BSS in a single stage | |
| The maximum amount of investment by the government in the BSS during the entire operational period |
Table 2.
The influence of the change of on the decision variables.
| (10 Terms) | (10 Terms) | ||||||||
|---|---|---|---|---|---|---|---|---|---|
| 10 | 5 | 0 | 0.8 | 3.6 | 1.7 | 1.6 | 24.94829 | 22.11933 | 414-366-328-92-0-0-0-0-0-0 |
| 12 | 5 | 0.2 | 0.8 | 3.9 | 1.5 | 1.6 | 23.88662 | 23.97634 | 432-382-342-44-0-0-0-0-0-0 |
| 15 | 5 | 0.6 | 0.8 | 4.6 | 1.3 | 1.6 | 22.37334 | 26.74762 | 450-396-354-0-0-0-0-0-0-0 |
| 18 | 5 | 0.8 | 0.9 | 5 | 1.1 | 1.6 | 19.68258 | 29.59224 | 500-446-254-0-0-0-0-0-0-0 |
© 2017 by the authors. Licensee MDPI, Basel, Switzerland. This article is an open access article distributed under the terms and conditions of the Creative Commons Attribution (CC BY) license (http://creativecommons.org/licenses/by/4.0/).
Share and Cite
MDPI and ACS Style
Li, L.; Shan, M.; Li, Y.; Liang, S. A Dynamic Programming Model for Operation Decision-Making in Bicycle Sharing Systems under a Sustainable Development Perspective. Sustainability 2017, 9, 895. https://doi.org/10.3390/su9060895
AMA Style
Li L, Shan M, Li Y, Liang S. A Dynamic Programming Model for Operation Decision-Making in Bicycle Sharing Systems under a Sustainable Development Perspective. Sustainability. 2017; 9(6):895. https://doi.org/10.3390/su9060895
Chicago/Turabian StyleLi, Linfeng, Miyuan Shan, Ying Li, and Sheng Liang. 2017. "A Dynamic Programming Model for Operation Decision-Making in Bicycle Sharing Systems under a Sustainable Development Perspective" Sustainability 9, no. 6: 895. https://doi.org/10.3390/su9060895
Note that from the first issue of 2016, this journal uses article numbers instead of page numbers. See further details here.