
Does Environmental Policy Reduce Enterprise Innovation?—Evidence from China


1
Australia Business School, University of New South Wales, Sydney 2052, Australia
2
School of Economics and Management, Northwest University, Xi’an 710127, China
*
Author to whom correspondence should be addressed.
Sustainability 2017, 9(6), 872; https://doi.org/10.3390/su9060872
Submission received: 9 March 2017
/
Revised: 17 May 2017
/
Accepted: 18 May 2017
/
Published: 23 May 2017
(This article belongs to the Section Economic and Business Aspects of Sustainability)
Abstract
:With the serious worldwide problem of carbon emissions, carbon emissions’ control and trade have become necessary policies adopted by the governments, after the establishment of the EU Emissions Trading System (EU ETS), China has also implemented a similar carbon emission trading pilot policy which plays a vital role in environmental regulation and influences enterprise behaviors, so this paper will put more focus on the impact of this policy on the enterprise innovation. In this paper, we construct a theoretical model and use the “Chinese Carbon Emissions Trading Pilot Policy” as a quasi-natural experiment to accurately identify the net causal effect of this environmental policy on enterprise innovation. Moreover, we use the synthetic control and difference-in-differences methods to eliminate the endogeneity to a large extent and conduct the robustness tests, difference-in-differences method, placebo test, and permutation test to respectively confirm these results. The results show that the implementation of carbon emissions trading policy will significantly reduce the enterprise innovation in general, this conclusion is contrary to the EU ETS’s effect, which is confirmed by plenty of previous empirical study. However, this policy has different effects across enterprises of different industries and different types of innovation. It can promote enterprise innovation of environmental industry, but it will inhibit enterprise innovation of non-environmental industry; besides, it can promote the development of green technical innovation and inhibit non-green technical innovation, which is basically identical to the causal effect of EU ETS.
1. Introduction
At present, the problems of the global climate and greenhouse gas (GHG) emissions are of increasing concern to the public. Effective and sustainable development has significantly been key to breaking through environmental dilemmas and constraints. Therefore, the effectiveness of environmental policy has become an important issue that we must consider, and to research whether it can help people reduce environmental pollution, and improve energy efficiency. For increasingly serious environmental problems, different countries and regions have issued different environmental policies, hoping to alleviate greenhouse gas emissions. For example, the United States put forward the “Acid Rain Project” and the “Regional Greenhouse Gas Initiative”; China has produced the “Carbon Emissions Trading Pilot Policy”; and Colombia has developed a cap-and-trade program. Other plans for greenhouse gas control and emissions trading are under consideration in other countries such as Australia, New Zealand, and Quebec, Canada (Calel and Dechezlepretre, 2016) [1].
The implementation of these environmental policies is aimed at alleviating GHG emissions and improving energy efficiency. According to a study by Kossoy and Guigon (2012) [2], carbon emissions of the total GHG emissions have increased rapidly from 5% to 10% in recent years. Carbon emissions and trading policies are a means of reducing the GHG emissions and improving energy efficiency. In this regard, Europe has set up the “EU Emissions Trading System” (EU ETS) in 2005, and today, has become the world’s largest carbon emissions trading market, according to Kossoy and Guigon (2012). The market has begun to take shape, with an annual market value of transaction now exceeding 175 billion U.S. dollars [2]. The EU ETS has a gradually maturing development model and mechanism design that the rest of the world is attempting to replicate. However, as it is still in the early stages of development in the world, policy effects are controversial and attracting much attention.
It is undeniable that the establishment of the carbon trading market is an important environmental policy. The main goal is to optimize the allocation of carbon emissions to and reduce pollution to a minimum. An environmental policy which can improve technological innovation is one of the important signs of its success (Pizer and Popp, 2008) [3]. At present, literature shows that the construction of carbon emissions and trading market projects can give enterprise incentive to improve technology and innovate. (Stavins, 1995; Jaffe et al., 2003) [4,5]. With the regulation of the carbon trading policy, enterprises have to receive the associated carbon price which will induce them to improve the ability of independent innovation, which can reduce total carbon emissions, and optimize the efficiency of resource use in order to reduce production costs. Most of the literature on the impact of carbon emissions and trade policy on enterprise innovation has focused on exploring the impact of EU ETS’s carbon emissions and trading policies (Gagelmann and Frondel, 2005; Grubb et al., 2005; Hoffmann, 2007; Schleich et al., 2009) [6,7,8,9]. However, for the China’s carbon trading policy pilot, with a similar function as the EU ETS program, there is little related literature focusing on it. Therefore, whether and to what extent China’s “carbon trading pilot” program affects innovation ability is still an unsettled topic, and thus absolutely deserves to be studied.
Carbon trading policy is a kind of environmental regulation. However, the content of environmental regulation is very broad and difficult to quantify and establish the measurement model, this paper mainly analyzes the impact of carbon trading policy on enterprise innovation. The Chinese government have issued plenty of environmental regulation policies, mainly including a carbon trading policy, sulfur pilot policy, and the “two control zones” policy. This article will select the carbon trading policy as the studied environmental regulation. The first reason is that the environmental problems caused by carbon emissions are the hotspots of global concerns and the major problems that many researchers have tried to study and solve. Secondly, in order to better compare the effect of China’s environmental regulation policy with international experience, carbon trading policy provides us with a good perspective. In view of this, this paper will select the carbon trading policy as the main manifestation of environmental regulation, in order to examine the impact of environmental regulation on enterprise innovation.
In this paper, we use the characteristics of China’s “carbon trading policy pilot” system to construct a “quasi-natural experiment”, using provincial and individual levels of enterprise data. We use the enterprise data of 29 provinces in China and the synthetic control method and difference-in-differences method which are used in policy evaluation to estimate the causal effect of the carbon trading policy pilot on enterprise innovation. The empirical results show that the carbon pilot policy is a significant hindrance to the innovation of enterprise, the implementation of the carbon pilot policy does not effectively promote the innovation of local enterprises. On the contrary, it hinders innovation, which is unlike some previous literature claiming that EU ETS provides a significant incentive for enterprise innovation. Meanwhile, this effect differs across industries and types of enterprise which means that China’s carbon trading policy has a significant impact on enterprise innovation in environmental industry and enterprise’s green technical innovation, this conclusion is the same as the analysis of EU ETS’s policy effect.
The remainder of the paper is organized as follows: Section 2 reviews the relevant literature. Section 3 introduces a background to China’s greenhouse gas emissions and carbon trading policy pilot, provoking discussion, and providing a theoretical hypothesis. Section 4 provides a theoretical and empirical model, and estimation method set. Section 5 illustrates the empirical and measurement results. Section 6 outlines the relevant robustness test. Section 7 provides a further discussion which analyzes the mechanism of impact of carbon trading policy on enterprise innovation. Finally, Section 8 is the conclusion of the paper.
2. Literature Review
This paper will analyze the effectiveness of China’s carbon trading policy from the perspective of enterprise innovation. The innovation hypothesis dates back to John Hicks (1932) [10], and then it is extended and applied by Porter (1991) [11] and Acemoglu et al. (2012) [12]. In environmental policy areas, due to severe GHG missions, the economy will increase its direct investment in technological improvement. Fowlie (2010) also shows that the implementation of carbon emission and trading policy can significantly increase the capital investment in environmental issues [13]. There have been two diametrically opposed views on whether environmental policies can improve enterprise’s ability to innovate so far. On the one hand, a large quantity of literature shows that environmental policies can lead to innovation in enterprises with positive incentives for technological progress. Many scholars have done theoretical arguments and relative research (Goulder and Schneider, 1999; Van der Zwaan et al., 2002; Popp, 2004) [14,15,16]. In empirical study, some scholars have also pointed out that environmental policy can provide incentives for technological improvements (Brunnermeier and Cohen, 2003; Popp, 2002; Aghion et al., 2016) [17,18,19]. A large number of scholars claim that environmental policies, especially the carbon trading policy, can have direct causal effects on technological changes (Lanjouw and Mody, 1996; Popp, 2006; Lanoie et al., 2007; Johnstone et al., 2011; De Marchi, 2012) [20,21,22,23,24].
On the other hand, some studies have pointed out that environmental policy does not have a significant positive impact on technological change. For example, the analysis of Popp (2002) finds that the growth rate of patented technology is only 3.14%, even in a period of rapid growth in energy prices in the late 1970s [18]. Martin et al. (2011) argue that under current energy prices, technological innovation should be better than the current situation [25]. List et al. (2003) and Greenstone and Gayer (2009) point out that environmental policy will inhibit the formation and development of new technological progress [26,27]. Taylor (2012) through the U.S. “acid rain plan” policy assessment study shows that, since 1995, environmental policy has inhibited the development of sulfur dioxide control technology [28]. The study based on Lange and Bellas (2005) shows that there is no positive incentive for advanced technology coming from environmental policy [29].
For the carbon trading market, a large number of scholars have pointed out that not only will carbon trading environment policy fail to have a positive impact on enterprise innovation, but even may have a negative effect on enterprises’ innovation (Grubb et al., 2005) [7]. Anderson et al. (2011) make it clear that, under the EU carbon trading system, many companies are more willing to use new equipment or purchase other technology to deal with the increased carbon pricing, rather than improve their own technological innovation [30]. Hoffmann (2007) also claim that enterprises are more inclined to buy other technologies to deal with such environmental regulation [8]. There are other scholars who support it. They point out that under the regulation of environmental policy, a large number of enterprises do not have their own technical capacity to improve energy efficiency, but prefer to introduce other means of technology to reduce their own production costs (Tomas et al., 2010) [31].
From the plenty of previous literature we can see that the mechanism of environmental regulation for enterprise innovation is uncertain, on the one hand, some scholars think this impact is positive (Brunnermeier and Cohen, 2003; Popp, 2002; Aghion et al., 2012) [17–19], and on the other hand, others think this impact cannot work or even be negative (List et al., 2003; Greenstone and Gayer, 2009; Lange and Bellas) [26,27,29]. To be specific, as for the “policy effect” of carbon trading policy, there are significant differences in the impact of carbon trading policy on the environment, and the environmental benefits of carbon trading are also disputed by experts. Some researchers believe that it can generate incentives for technological improvements and enterprise innovation (Calel and Dechezlepretre, 2016; Stavins, 1995; Jaffe et al., 2003; Aghion et al., 2016) [1,4,5,19]. However, others focusing on carbon trading policy’s effect can have an opposite conclusion (Grubb et al., 2005; Hoffmann, 2007; Anderson et al., 2011) [7,8,30], however, the latter are mainly based on investigation and case analysis. Therefore, in general, as a carbon trading policy, EU ETS’s positive effect on enterprise innovation is still supported by plenty empirical study.
Based on previous literature, firstly, the impact of environmental regulation (especially, the carbon trading policy) on enterprise innovation can still not be confirmed, secondly, we can also see, due to availability of data and time constraints of policy implementation, there is little literature on China’s environmental regulation policy. Some reports point out that China’s environmental regulation policy is difficult to assess due to data and transparency (The Economist, 2012; Hering and Poncet, 2013) [32,33]. In recent years, a small number of researchers have begun to study China’s environmental regulation policy. With the gradual improvement of micro database construction of China, environmental issues have attracted more and more global scholars’ attention (Dean et al., 2009; Lu et al. , 2012; Cai et al., 2016; He et al., 2016) [34,35,36,37]. In an earlier article, Dean et al. (2009) studied the impact of China’s environmental policy regulation on foreign investment [34]; Hering and Poncet (2013) use the China’s “two control zones” environmental policy, using quasi-natural experiments to study the impact of this policy on enterprise profit, cost, and external direct investment. Results show that strict environmental regulation will increase corporate profits and reduce foreign capital inflows, and this causal effect is greater in countries with lower levels of environmental regulation [33]. He et al. (2016) use the quasi-natural experiment of the government to enforce the emission reduction policy during the Beijing Olympic Games to identify the causal effect of carbon abatement on mortality [37].
It can be seen that before this study, there has been a small amount of literature for China’s environmental regulation policy using quasi-natural experiment method to carry out policy impact assessment. The quasi-natural experiment can be an excellent way to avoid omitted variables within environmental policy issues, and identify causal effects. There is little literature focusing on China’s carbon trading policy pilot’s evaluation. In this paper, we try to measure the causal effect of China’s carbon trading policy pilot in order to explore its effect on the Chinese enterprise innovation. Because of the heterogeneity of enterprise innovation, this paper will take the synthetic control method to identify this causal effect.
This paper focuses on three points. First, most of the study of carbon emissions policy on enterprise innovation from EU ETS policy, while this article places more emphasis on Chinese carbon trading policy which lacks public and researcher attention. Secondly, in view of the widespread drawbacks of the difference-in-differences method which is widely used in the field of policy evaluation, this paper uses the synthetic control method to avoid the deviation of the influence of the carbon trading policy on the innovation of the enterprise and strictly recognize the causal mechanism. Thirdly, this paper focuses on the path dependence of carbon trading policy on enterprise innovation, and analyzes its internal mechanisms.
3. China’s Greenhouse Gas Emission Status, Policy Background and Theoretical Hypothesis
3.1. China’s Greenhouse Gas Emission Status
China has not yet formally incorporated official statistics of GHG emissions data. International agencies have made estimates of national emissions’ effects by analyzing socio-economic activities, energy consumption, and carbon emissions factors. At present, according to the national fossil energy combustion statistics obtained by carbon dioxide emissions data, the data published by the International Energy Agency have attracted more attention in the international community. International Energy Agency data show that China’s carbon dioxide emission was 6.590 billion tons in 2008, and the United States’s emission was 5.595 billion tons. This emission in China is greater than the United States, this number exceeds 900 million tons, accounting for 22% of global emissions.
Hampered by the global financial crisis, Europe and the United States saw negative growth in energy consumption and GHG emissions in 2008 and 2009. However, China and other developing countries, due to the development stage, saw positive growth in energy consumption and GHG emissions. Considering the truth that fossil energy consumption emissions of carbon dioxide accounted for more than three-quarters of the total GHG emissions. It can be said that China’s current carbon dioxide emissions in the total have become second to none in the world. According to the research of the World Resources Institute (WRI), the total emissions of six types of GHG missions in China accounts for 19% of global GHG emissions. China’s carbon dioxide emissions account for approximately one-quarter of all global emissions. However, at 2008 per capita levels, China’s fossil energy emissions of carbon dioxide accounted for 4.6 tons. This is 2.6% higher than the average level of developing countries, slightly higher than the global average of 4.4 tons per capita, but less than the United States.
China has now become the largest global GHG emissions country due to the rapid development of economic entity. This increase status in carbon emissions will not change in the short term, so it creates huge international pressure to reduce emissions. For the first time in 2009, the Chinese government officially announced a clear and quantifiable goal of controlling GHG emissions. By 2020, carbon emissions per unit of GDP would be 40–45% lower than in 2005. To achieve 2020 GHG emissions target, China has also completed significant GHG emissions control work. In May 2013, the Ministry of Environmental Protection submitted the “People’s Republic of China Environmental Protection Tax Law”, and a carbon tax will be included in the environmental tax code.
3.2. The Background of China’s Carbon Emissions Trading Pilot Policy
Since the establishment of the “Kyoto Protocol”, the government creation of carbon emission reduction plans with clear objectives and emissions trading, especially in carbon, has become a reality. According to the World Bank estimates, the carbon trading market may exceed the oil market to become the largest energy and environmental equity derivatives market with a size of approximately 3.5 trillion U.S. dollars by 2020. Following the EU ETS, China’s carbon emissions trading market has become the world's second largest carbon emissions trading market.
On October 29 of 2011, the National Development and Reform Commission issued a “Notice on Carrying out the Pilot Project on Carbon Emissions Trading”, and agreed to carry out carbon emission trading market pilots in Beijing, Tianjin, Shanghai, Chongqing, Hubei, Guangdong and Shenzhen. Seven pilot provinces and cities have all carried out carbon emissions trading so far, as shown in Figure 1.
Carbon emissions trading pilots launched one after another. The pilot areas combined with the local situation, taking into account the carbon intensity objectives, economic growth trends, enterprises and industry emissions, and other factors. This has led to a local carbon trading management approach to determine the threshold of participation in carbon trading enterprises. The total inclusion among enterprises and units was more than 1900.
Based on these figures, this paper focuses on the impact of carbon trading policy on the innovation of local enterprises. Taking into account the major pilots in the eastern developed provinces and cities, the national policy and system has a strong advantage in its particularity, though not enough to accurately assess the effect of carbon trading policy. Hubei Province, is located in central China—similar to other provinces—showed no particularity. In this paper, Hubei Province considered representative across provinces is the focus of the study. For the control group selection, we take into account the eastern provinces and cities of economic development, geographical advantages, policies, and other conditions which are much higher than the central and western regions of China. As Hubei is located in the central part of China, in order to more accurately assess the effect of carbon trading policy on regional enterprise innovation, the central and western provinces of China were selected as a research control group.
3.3. Theoretic Hypothesis
By combing through the literature, we can see that there are two different views on the impact of carbon trading policy on enterprise innovation. On the one hand, some literature points out that carbon trading policy is beneficial to enterprise innovation. On the other hand, other literature argues that carbon trading policy has a negative impact on enterprise innovation. However, there is an important question worth noting in the above literature. Some sources view carbon trading policy on the overall level general impacts of innovation, thus affecting the overall innovation behavior (Porter, 1991) [11]. However, there are a number of sources that discuss environmental regulation only for enterprise innovation in selected industry sectors (Borghesi et al., 2012) [38], or by innovation type (Jaffe and Palmer, 1996; Lanjouw and Mody, 1996) [5,20]. So how do we define “technology” and “innovation” of the enterprise? What is the relationship between “technology” and “innovation”? Is this impact different for technological innovation in different industries? Will this impact differentiate between different types of technological innovation? In view of these problems, this paper argues that it is necessary to accurately define and identify the “technology” and “innovation” of the enterprise, and analyzes the different types of enterprises and innovation. This paper will describe and explain these problems by two parts: the theoretical hypothesis and empirical testing.
So what exactly is “innovation”? The definition of innovation differs between disciplines, and in the field of economics, the concept of innovation originated in American economist Schumpeter (1912) [39].
“Innovation refers to the introduction of a new combination of new elements of production and production conditions into the production system, which includes five meanings: the introduction of a new product, the introduction of a new technical approach, the opening up of a new market, raw materials or semi-finished products of a new source of supply, and a new form of organization.”
With this introduction of the concept of innovation and the richness of the connotation, the classification method in economics has also been circulated so far. In this paper, the literature on carbon trading policy and enterprise innovation shows that the problems studied by a large number of researchers on how technology, enterprises, and productivity can be improved. In this article, we define “enterprise innovation” as the technical innovation of enterprises. “Technology” refers to the enterprise’s production technology. Technology and innovation have a certain relationship, that is to say, the former is a subsidiary of the latter term.
This paper focuses on the technical efficiency of enterprises to see whether there is a certain degree of innovation and improvement. What is the measure of technical innovation? Here, we will use the quantity of the enterprise patents. Although there are some limitations in the use of patents to measure technical innovation (Aghion et al., 2012) [19], the present “number of patents” remains the best proxy variable for technological innovation (Johnstone et al., 2010) [23]. It has a strong correlation with innovation inputs and can be used as a measure of technological innovation (Griliches, 1990; Ley et al., 2016) [40,41].
What is the relationship between carbon trading policy and the technical innovation of the enterprise? Does it have a general impact on the overall level of innovation? Does it only work for enterprise innovation in certain industries? Does it work for a certain type of enterprise innovation? What are some of the industries here? What type of technology does it refer to? On this issue, Hicks’ (1932) “Induced Innovation Hypothesis” has put forward that if the price of an element is higher than the other elements, then the use of the element will be reduced, and the associated technological innovation will be generated [10]. Hicks continues, “A change in the relative prices of the factors of production is itself a spur to innovation, and to innovation of a particular kind-directed to economizing the use of a factor which has become relatively expensive”. Subsequently, Porter (1991) developed and proposed the “Porter Hypothesis”, where he points out that appropriate environmental regulation will stimulate the technological innovation of enterprises, thereby reducing the cost of the enterprise, gaining a greater competitive advantage [11].
In the study of China’s carbon trading policy, we believe that after the implementation of China’s Carbon Emissions Trading Pilot Policy, pilot provinces and cities set up the highest emission standards for carbon dioxide for each enterprise and allow different enterprises to trade carbon dioxide emissions quota. Therefore, the policy limits the amount of carbon dioxide emissions and increases the cost of emissions. This will inevitably lead to rising prices of carbon emissions factors, which to some extent limit the total amount of carbon dioxide emissions. This reduces the economic activity of enterprises, thereby reducing the economic performance of enterprises. This decreases research and development (R&D) investment, leading to a weakening in technological innovation. Our first assumption is:
Hypothesis 1 (H1).
China’s Carbon Emissions Trading Pilot Policy reduces the economic performance of enterprises, thereby reducing the R&D investment, making overall enterprise technology innovation weaker.
At the same time, however, the extent of carbon trading policy is not the same for across industry sectors. As Hicks (1932) explains, when the price of an element rises relatively, the technological innovation associated with that element will increase [10]. We believe that, even if the carbon trading policy of industry as a whole curbs overall enterprise innovation; its effects across sectors are different. When carbon trading policy is associated with environmental industry sectors, the impact is more severe, and the willingness to improve technological innovation and reduce costs is stronger. At the same time, those enterprises that are not related to environmental industry sectors are relatively less motivated to achieve technological innovation. Therefore, carbon trading policy will promote environmental enterprise innovation, but will reduce non-environmental enterprise innovation. Our second hypothesis:
Hypothesis 2 (H2).
China’s Carbon Emissions Trading Pilot Policy can promote enterprise innovation of environmental industry, but it will inhibit enterprise innovation of non-environmental sectors.
Based on the relationship between technology and innovation mentioned previously, on the basis of Hypothesis 2, we believe that China’s Carbon Emissions Trading Pilot Policy has been able to improve enterprise innovation in the environmental industry. This is due to the development of green technologies related to environmental enterprises. However, the reason why the policy will inhibit enterprise innovation of non-environmental industry is that such enterprises face the high cost of business, and its relative non-green technology has not been developed. Our third hypothesis:
Hypothesis 3 (H3).
China’s Carbon Emissions Trading Pilot Policy promotes the development of green technical innovation and inhibits the development of non-green technical innovation.
4. Estimation Method
In general, most of the literature uses the difference-in-differences method (DID) for the study of policy effects. DID evaluation of the effectiveness of policy uses the first difference to eliminate the fixed effect, and then uses the second difference to show the policy effect. Compared with the traditional model, DID has many advantages, but is still flawed. The selection of the control group can be subjective and arbitrary, and does not have a strong conviction. Policy is sometimes endogenous. That is to say, there is a systematic difference in policy interventions between cities, and this difference happens to be the reason for the city's policy intervention (Abadie et al., 2010) [42]. Especially for the second flaw, we often do not have sufficient reasons to rule out the endogeneity of the policy, so the direct use of DID to assess the results of the policy is often biased.
Abadie et al. (2010) proposed the synthetic control method, which is mainly weighted by multiple control groups, which are very similar to those of the treatment group, according to the serious flaws in DID [42]. The difference between the treatment groups and the control groups is overcome by weighting. The basic idea of the synthetic control method is that it is very difficult to find a control group that is completely similar to the treatment group in realistic conditions. We can construct a good control group based on a combination of control groups that are not subject to policy intervention. The method was proposed by Abadie et al. and used to study the impact of terrorist activities on the Basque region of Spain, where the authors used a combination of other parts of Spain to simulate the potential economy of the Basque region without terrorist activity increase. Abadie et al. (2010) studied the effects of tobacco control legislation in California on reducing per capita tobacco consumption using a combination of other U.S. states to replicate tobacco consumption in California without implementing tobacco control legislation [42]. With the popularity of synthetic control law, many domestic scholars have gradually adopted this method.
4.1. Theoretical Model
The synthetic control method is essentially based on the data selection control group to evaluate the policy effect. The basic characteristic is that it is necessary to clearly control the weight of each individual in the group, that is, each individual determines the similarity according to the characteristics of the respective data. This constitutes the “counterfactual state” in the contribution of the degree. The similarity between the control group and the treatment group is measured according to the predictive variables before the policy intervention. The method has the following two advantages: (1) it is an extension of the traditional difference-in-differences method, as a non-parametric estimator; and (2) in the construction of the control group, the data determines the size of the weight, thereby reducing the subjective judgment. The synthetic control method can clearly show the similarity between the treatment group and the synthetic control group before and after the policy intervention, and avoid the error caused by contrasting areas (Temple, 1999) [43].
The individual weight of the synthetic control group is chosen as a positive number and the sum is 1, and the extrapolation is avoided. For the sake of simplicity, it is now assumed that the innovation of the J + 1 region can be observed. The first region (Hubei) has been interfered with by the carbon trading policy, while the other J regions are the control group. The T period of regional innovation can be directly observed. The year a region implemented the carbon trading policy is . Hubei implementation of carbon trading policy corresponds to 2011, and therefore .
By using the “counterfactual states” framework in the project evaluation literature, represents the non-intervened result of object i at the moment T and use represents the intervened result of object i at the moment T, where, i belongs to 1, …, J, t belongs to 1, …, T (or ; ). Equation can represent the effect of carbon trading policy implementation. We assume that the carbon trading policy has no effect on the innovation of the regional enterprise before the implementation. The case can obtain for all of i region, and case can obtain for all of i region. We use a dummy variable that indicates whether or not to accept the intervention, and if the region i is subject to policy intervention at moment t, then the variable is 1 and vice versa.
The result at observed region i at the moment t is , i.e., . For areas that have not been interfered with by carbon trading policies, we have . Since only the first area has been affected by the carbon trading policy after the moment , our goal is to estimate . At the time of , . is the real level of enterprise innovation’s value which can be observed in Hubei, to estimate , we need to estimate , first. is the theoretical value of regional enterprise innovation level under no carbon trading policy intervention in Hubei Province, which is not observed. Therefore, we need to construct “counterfactual state” variables to express it.
Similar to the assumptions in the difference-in-differences model, we assume is determined by the following model
where it is the time fixed effect, is a vector, which includes observable variables that contains the region i that is not affected by the carbon trading policy, is a unknown parametric vector, and is a common factor vector that is not observed. is a regional fixed effect vector, the error term describe the temporary pulse at the region i, where the mean of this variable is zero. It is obvious that Equation (1) is an extension of the general traditional fixed effect of the difference-in-differences model. Difference-in-differences model allows the presence of unobtrusive individual influencing variables, but limits the change of effect of these variables from time to time. In contrast, the model of Equation (1) allows the effect of the observed individual variable to change over time. If the limit does not change over time, our proposed method can degenerate to the traditional difference-in-differences method.
Most importantly, there is no need to limit , , , as independence of each other in this model. In order to assess the impact of carbon trading policy on regional enterprise innovation, we must estimate the result of the first region without receiving policy intervention. In order to solve this problem, we can use the control group that has not been interfered with by the carbon trading policy to approximate the value of the variable that has not been interfered with by the carbon trading policy in Hubei Province. For this purpose, we consider a weight vector , the element of the weight vector to satisfy , for all J and, in the meantime, , each particular value of the vector represents a feasible synthetic control for the first region, which is a weighted average of all regions within the control group.
is used as the result of the synthetic control of the weight of the variable is
Assuming there is a weight vector satisfy
If matrix is non-singular, we can obtain that
Abadie et al. (2010) prove that under general conditions, the right side of the above equation approaches zero [42]. Therefore, for , we can use as the unbiased estimate of to approximate , and can be an approximator to .
4.2. Implementation of the Method
To estimate , we need to know . In order to make the Equation (4) hold, the feature vector of the first region needs to be within the convex combination of the eigenvector sets in other regions. However, in the actual calculation, there may be no solution in the data that makes the system set up exactly, which requires the approximate solution to determine the synthetic control vector .
We choose to minimize the norm function , which is the distance between and , to determine the weight vector . The variable is a dimension feature vector of Hubei area before the implementation of carbon trading policy. The form of is
where is a linear combination of Hubei enterprise innovation before carbon trading policy was implemented, and is a feature vector . In the meantime, is a matrix, the column j of the is the feature vector of the area i before carbon trading policy was implemented. The column j of is . As for , a general choice is .
In general, the distance function is , where is a k-dimensional symmetric positive definite matrix. The choice of can impact estimating mean square error (MSE). We choose diagonal semi-definite matrix to minimize the carbon trading policy before the implementation of the regional enterprises to estimate the mean square error of innovation. This makes our estimation of Hubei’s enterprise innovation growth path as near as possible to the implementation of carbon trading policy before the implementation of Hubei enterprise innovation growth path.
It is worth noting that in the estimation of the weight , we require , so that the synthesis control group is limited to the control group of convex combinations. To avoid the interference between the treatment group and the control group becoming too large in the estimate, we reduce the treatment group and control group differences’ excessive and extrapolated estimates of estimated deviations (King and Zeng, 2005) [44]. The full model is estimated using the Synth package developed by Abadie et al. (2010) [42].
5. Empirical Test
5.1. The Empirical Test of Synthetic Control Method
This paper uses the provincial balance panel data from 2005 to 2014 to analyze the impact of carbon trading policy on the innovation of enterprise in Hubei province. The innovation of regional enterprise is expressed by the number of enterprise applying for patents in each region (in logs). Given the availability of data, the provinces do not include Qinghai, Tibet, Hong Kong, Macau, and Taiwan. Our goal is to use the weighted average of other provinces to approximate the innovation of enterprises in Hubei without implementing carbon trading policies, and then to compare the impact of carbon trading policies on enterprise innovation in contrast to real innovation in Hubei. According to the idea of synthetic control method, the principle of choosing the weight is to make the determined factors of enterprise innovation similar to the real condition of Hubei province as much as possible before the implementation of this policy. Therefore, we choose to predict the number of major scientific and technological activities of enterprises above a designated size, the expenditure of science and technology activities, the cost of technology introduction, the scale of enterprises, the GDP of the region, the proportion of the total industrial output value to the regional GDP, and the foreign direct investment. The proportion of GDP, import, and export trade accounted for the proportion of GDP. All data are from the years of “China Statistical Yearbook” and “China Science and Technology Statistical Yearbook”.
Through the calculation of synthetic control method, Table 1 shows the weight of the provinces used to form the synthesis of Hubei, a total of four provinces, of which Henan Province is the largest weight. It can be seen from the table that the economic indicators are very close, and the gap is far less than the real variables in Hubei and the average real variables of other provinces. Among the two sides, the difference between the input of the scientific and technological personnel, the capital investment, the scale of the enterprise, and the proportion of the foreign direct investment in the GDP of the region are 0% < 11.14%, 1.24% < 10.71%, 0.37% < 5.62%, and 3.01% < 14.98%. From the comparison of the indicators in Table 2, the synthetic Hubei Province is better suited to the characteristics of the real Hubei province before the implementation of the carbon trading policy, indicating that the method is suitable for assessing the policy effect of carbon trading.
Figure 2 depicts Hubei and the synthetic control method of the synthesis of Hubei enterprises in the region of innovation. As can be seen from the figure, before the implementation of carbon trading policy, the path of the two is almost completely equal, which means that the synthesis of Hubei Province is a very good copy of the carbon trading policy before the implementation of the Hubei enterprise innovation growth path. After the implementation of the carbon trading policy in 2011, the number of patent applications (in log) in the real Hubei Province began to decrease compared to the number of patent applications in synthetic Hubei Province, and the gap between them gradually widened. The gap between the two means that, compared with the implementation of carbon trading policy in Hubei Province, the implementation of carbon trading policy reduces the innovation of enterprise in Hubei. Assuming that there is no implementation of carbon rights trading policy in 2014, enterprises in Hubei province applying for patent value should be 11.58 (in log), which is the actual number of patent applications with a value difference of 0.1, a decline of about 1%.
In order to more intuitively observe the impact of carbon trading policy on the path of innovation growth in Hubei enterprise, we calculated the gap of the number of patent applications (in log) between the enterprises in the real Hubei and the enterprises in synthetic Hubei before and after the implementation of the carbon trading policy, as shown in Figure 3. In 2011, before the implementation of the policy, the gap between the two is −0.05 to 0.05 fluctuating between the ups and downs. After 2011, the number of patent applications of the real Hubei was 0.113, 0.107, and 0.009 lower than the number of the synthetic Hubei applications, respectively. As seen from the results of the calculation, the implementation of the carbon trading policy has changed the original path of innovation growth in Hubei enterprises to a certain extent. The degree of change has gradually expanded with the passage of time. Specifically, the implementation of the carbon trading policy has reduced the innovation activities of enterprise in Hubei, proving H1.
5.2. A Further Empirical Test
From the above analysis and the case of Hubei Province we can see that, on the whole, carbon trading policy on the region's enterprise innovation has a certain hindrance. Of course, the analysis of the overall enterprise industry in Hubei Province can only be a case, with its particularities, and therefore, serves as a base for the need for in-depth discussion and mining of this issue. Another question of interest is whether there is a variability of the hindrance in different industry sectors and in different types of enterprise innovation. In order to answer this question, this paper also uses the “Cathay Pacific Csmar Database” that collected China’s 2009–2015 listed enterprise patent data to specifically analyze whether the impact of carbon trading policy on enterprise innovation is heterogeneous. In order to accurately evaluate the effect of carbon trading policy on a single enterprise, we establish a difference-in-differences (DID) model. The specific model settings are as follows:
In the above formula, and are dummy variables. If the enterprise is located in a province being subject to carbon trading policy intervention, the value is 1, and there is no intervention if it is 0. If is 1, it indicates that, in this year, carbon trading policy is implemented. The coefficient is the focus of our concern, which represents the net effect of carbon trading policy on enterprise innovation. and , respectively represent the individual fixed effect and time fixed effect as a random disturbance. The dependent variable is denoted by , where it is the innovation level of the i-th enterprise at time t, and k is the different types of patents.
In China, the types of patents are divided into three categories, “patents for invention”, “patents for utility model”, and “patents for design”. According to the introduction of the State Intellectual Property Office of the P.R.C, “patents for invention” refers to, “any new technical solution relating to a product, a process or improvement”. “Patents for utility model” refers to, “any new technical solution relating to the shape, the structure, or their combination, of a product”. Meanwhile, “patents for design” means, “any new design of the shape, the pattern or their combination, or the combination of the color with shape or pattern, of a product, which creates an aesthetic feeling and is fit for industrial application”.
For the technical innovation of an enterprise, patents for invention have a typical representative meaning and are more important than the other two types of patents. As the patents for utility model and design are more reflected in the external conditions and are not of greater significance for technology promotion, we regard patents for invention as representative of technical innovation.
Firstly, we use the above model to examine whether there is a discrepancy from the impact of carbon trading policy on enterprise innovation in different industry sectors. The main objective of carbon trading policy is to reduce carbon emissions and improve environmental governance. The industry criterion of the enterprise will be divided into two categories of enterprises, namely, the enterprise of the environmental industry and the non-environmental industry, as detailed in industry classification in Table 3.
According to the classification criterion of the above table, it points out whether the innovation effect of carbon trading policy on enterprises is different in these two types. The specific industry classification criteria and the corresponding empirical results are shown in Table 4.
As can be seen from Table 4, the impact of carbon trading policy on the environmental industry and non-environmental industry’s enterprise innovation has a certain difference. In terms of different patents, regardless of whether the industry is related to the environment, the carbon trading policy has a positive effect on patents for utility model’s innovation and patents for design’s innovation of the enterprise, but the significance is slightly different. However, patents for invention are significantly different from the patents for utility model and for design. Carbon trading policy plays a significant role in promoting the patents for invention of enterprises in the environmental industry, and has a hindrance to the patents for invention of enterprises that are in non-environmental industries. The effect is significant at the 5% confidence level, there is a clear difference between the two industries. This shows that the carbon trading policy promotes environmental enterprise innovation, but inhibits the non-environmental enterprise innovation. Thus, the H2 is obtained.
Secondly, after examining the heterogeneity of the barriers to enterprise innovation in the different industries, we will examine whether there are differences in the role of different types of innovation activities. In the context of carbon trading policy and enterprise innovation, researchers often use green technology or green patents, and in this regard we also try to take such a classification method to ensure that the findings are comparable to other findings.
We also follow the Organization for Economic Cooperation and Development (OECD) classification criteria for green patents that Ley (2016) has cited [41], which considers that the industry patent meets one of the following seven points as a green technical patent. The seven points are: (1) general environmental management; (2) energy generation from renewable and non-fossil sources; (3) combustion technologies with mitigation potential; (4) technologies specific to climate change mitigation; (5) technologies with potential or indirect contribution to emission mitigation; (6) technologies with potential or indirect contribution to emission mitigation; and (7) energy efficiency in buildings and lighting. Here, according to Ley et al. (2016), we claim that when a patent belongs to any of these seven points, it belongs to the green technical patent. Due to data limitations at the patent level, it is difficult for us to classify the patents. Therefore, we will classify the enterprises that meet these seven standards and classify this type of enterprise industry as a green patent.
In this way, all enterprise innovations are divided into two categories, namely, green technical innovation and non-green technical innovation. This makes it possible for us to discuss whether there is a heterogeneity in the impact of carbon trading policy on the different types of innovationof enterprises. The specific empirical results are shown in Table 5.
Table 5 focuses on the impact of carbon trading policies on different types of enterprise innovation. From the regression results, carbon trading policy on green and non-green technical innovation has a certain heterogeneity. This heterogeneity is not manifested in all aspects of innovation. As shown in Table 5, carbon trading policy on the patents for utility model and design does not exist, but has a consistent role in promoting innovation. The heterogeneity of different types of enterprise innovation is manifested in the invention of innovation. It can be seen from Table 5 (5.1) and (5.4) that the carbon trading policy has a significant effect on the patents for invention in green technical innovation, but the invention of non-green technical innovation has a hindrance. Regarding patents for design, the policy promotes green technical patents, but also promotes them in significantly greater proportion than the promotion of non-green technical patents. Thus, H3 is proven.
6. Robustness Test
This paper mainly examines the impact of carbon trading policy on the innovation of local enterprises, but the article only selects Hubei Province as the research object. Hubei Province has its own characteristics, and there are differences with other regions. This difference may lead to the bias of research conclusions. At the same time, since the synthetic control method does not fully guarantee that the control group we obtained can accurately reproduce the potential evolution path of the treatment group, the evaluation result also has a limited certainty.
All of these factors have led to more doubts about our research conclusions, whether the decline in regional innovation is caused by carbon trading policy, or by a contingency factor? In other words, the decline in enterprise innovation may be caused by a number of other factors, such as economic downturn, or the enterprise itself. At the same time, compared to other regions, does the policy intervention in the area of enterprise innovation lead to a related decline which has statistical significance? In order to test the robustness of the results, we use the difference-in-differences method (DID), placebo test, and permutation test to prove the reliability of the above conclusions.
6.1. DID Method
Although DID has some flaws compared to synthetic control method, we will use DID to evaluate the effect of carbon trading policy and compare it with the results obtained by synthetic control. The DID model is set as follows
where Innovation indicates the level of innovation of local enterprises, which can be indicated by the number of enterprises above the scale of the patent application value. Treat and year are dummy variables. If the province implements the carbon trading policy, the value is 1 and vice versa. If the value of year is 1, this means the year after the implementation of the carbon trading policy in 2011, and vice versa. In the meantime, the coefficient of interaction of Treat and year is the focus of our concern. It represents the net effect of carbon trading policy on local enterprise innovation. X represents the control variables, which are the number of scientific and technological activities of enterprises about designated size, the internal expenses of science and technology activities and its square items, the introduction cost of technology, the scale of enterprises, the GDP of the region, the proportion of total industrial output value to the regional GDP, direct investment accounted for the proportion of GDP, and import and export trade accounted for the proportion of GDP. δi and are the individual fixed effect and time effect respectively, the specific regression results in Table 6.
Table 6 is the result of the regression of all provinces. It can be seen from the coefficient of interaction that carbon trading policy has a hindrance to local enterprise innovation and is significant at a 5% confidence level. Column B in Table 6 is the result of the removal of the eastern provinces in the control group, and it can be seen that the effect of carbon trading on the innovation of local enterprises is still significant. Taking into account the eastern pilot provinces and the central and western provinces, there are significant differences across the provinces. It raises the question as to whether or not the carbon trading policy reducing innovation in Hubei enterprises is universal. In order to answer this question, Column C in Table 6 wipes off the central and western carbon pilot provinces (Hubei, Chongqing), in order to examine the carbon trading policy on the eastern pilot provinces of regional innovation. The regression results are similar to the situation in Hubei Province, carbon trading policy also reduces the innovation of enterprises in the eastern region. In summary, it can be seen from Table 3 that the DID regression results are consistent with the result symbols obtained by the synthetic control method, further illustrating the robustness of the synthetic control method.
6.2. Placebo Test
We examined the conclusions of this paper in the robustness test. This method belongs to a false test, we will assume that other provinces and Hubei Province were impacted by the same policy intervention. In accordance with the synthetic control method of its structural control group, we analyze the gap between the region and its synthetic control group after 2011, and see whether there are significant differences. As the hypothetical provinces do not implement the carbon trading policy, if the above estimate of Hubei Province is a real effect, then the region should not be found in Hubei and the same effect. If there is a big difference between the innovation and the synthetic group in the hypothetical area, it is similar to the situation in Hubei Province, which shows that the synthetic control law does not provide strong evidence to illustrate the carbon trading policy of enterprise innovation in Hubei.
Based on the placebo test from Table 1, we can see Henan Province is the largest weight whose value is 0.469, nearly be half of the whole weight. At this point, we not only select the largest weight of Henan Province, but also select Guangxi Province whose weight is 0 as a test object. The reason is that the maximum weight indicates that Henan and Hubei are the most similar, and the weight of 0 shows that Guangxi and Hubei are very different in the various characteristics, the two most extreme cases as a test object can be used as a most effective proof to confirm the robustness of the conclusions. The results of the specific placebo test are shown in Figure 4 and Figure 5. For Henan and Guangxi, before and after the implementation of carbon trading policy, the path of innovation in real areas is consistent with the path of the synthetic control group. There is almost no gap between the two provinces, with a good degree of coincidence. Compared with the results shown in Figure 1, the results show that Henan and Guangxi did not change before and after the implementation of the policy, so to a certain extent, it proved that the carbon trading policy caused a decline in regional enterprise innovation, rather than being caused by the accidental factors.
6.3. Permutation Test
The above analysis shows that the carbon trading policy reduces the innovation of local enterprises, but we do not know whether the policy effect is statistically significant. Abadie et al. (2010) propose a similar rank test (permutation test) to test whether the above mentioned policy effect is statistically significant [42], which can determine whether the innovation in other regions is similar to Hubei province, and calculate its probability.
The basic idea of the permutation test method is to assume that all the provinces in the control group have implemented the carbon trading policy in 2011 and construct the synthetic group using the synthetic control method to estimate the policy effect under the assumed conditions, respectively. Then compare the actual policy effect of Hubei province with the hypothetical effect obtained by the control group. If the difference between the actual effect and the hypothetical effect is large enough, then the impact of carbon trading policy reducing the local enterprise innovation is significant.
In this paper, all 16 (total 17) provinces in the control group were tested for placebo, respectively, to calculate the gap between enterprise innovation and synthetic group innovation in each province. This gap was used as a random selection of a province to estimate the impact of carbon trading policy distribution. As a statistical test, if the gap between Hubei Province and the overall gap is clearly different, it will mean that the policy effect obtained in Hubei Province is significant. However, we are using the determinants of regional enterprise innovation before 2011 to construct a synthetic group. If the average predicted standard deviation (the gap of the square root of the logarithm of the number of actual local patent applications between the logarithm of the number of predicted local patent applications) of a province before 2011 is relatively large, it illustrates that the model is less accurate for the province to some extent.
By calculation, we get the average predicted standard deviation of 0.0243 of Hubei province before the year of 2011. We removed the provinces whose average predicted standard deviation is more than 6.9% in the control group, and there are eight provinces. Before 2011, the average predicted standard deviation of these provinces is relatively large. This number can be more three times that of Hubei Province, of which the largest province is Inner Mongolia. Its number is more 22 times than that of Hubei Province and Sichuan’s number is more 18 times than that of Hubei.
Figure 6 shows the deviation distribution after removing eight provinces. It can be seen that before 2011, the gap between deviation of Hubei Province and the deviation of other provinces is not large, and after 2011, the gap has been gradually increased. The gap in Hubei Province is located outside the distribution of most provinces, although there is an area below the province of Hubei. This means that the condition where we want to select a province at random to get the same significant effect of carbon trading policy as Hubei province is not a small probability event. This indicates that the impact of carbon trading policy is significant. After a series of robustness tests, the carbon trading policy has had a negative impact on the innovation of enterprises in Hubei Province, and the influence has a certain significance.
7. Further Discussion
Through the above analysis we can see that, on the whole, the carbon trading policy is a hindrance to the innovation of enterprises, and that heterogeneity exists between the different industries and the different types of enterprise innovation. This heterogeneity is not manifested in all aspects of innovation, mainly in enterprise innovation. In terms of the heterogeneity of the impact of carbon trading policy on enterprise innovation, the previous context does not analyze the process of its specific impact mechanism, which is the focus of this part. Carbon trading policy has a certain hindrance to enterprise innovation in general, and there are differences between the effects of innovation in different industries and types. This section explains it mainly through the enterprise's performance and scientific research. In order to better explain the problem, we draw the different types of business in each year, and the R&D investment accounted for the proportion of the main business income of different enterprises in different industries in order to reflect the enterprise’s research investment situation (Figure 7 and Figure 8).
It can be seen from the figures that, after the implementation of carbon trading policy, no matter what kind of industry and what type of enterprise innovation, corporate research investment continued to decline, which may lead to regional enterprises reducing their level of innovation. The main reason is that carbon trading policy increases the cost of business and reduces the profits, leading to a decline in the amount of investment by enterprises in innovation, hampering regional innovation.
Secondly, comparing the curves’ slope of different types of innovation and different industries , we can see, compared to green technical innovation and environmental industries, non-green technical innovation, and non-environmental industries, the reduction in scientific research is significantly higher. This is the cause of heterogeneity in the impact of carbon trading policy on innovation, because environmental regulation is associated with environmental industry sectors. The impact is more severe, and their willingness to improve technological innovation and reduce costs is even stronger. Those enterprises that are not related to the environmental industry sectors are less motivated to achieve technological innovation.
Another reason for the difference in the impact of carbon trading policy on different innovative patents is the difference between the benefits of different innovative inventions. In terms of patents for utility model and design of enterprises, they have the advantage of smaller scientific research investments. Enterprises can realize economic benefit from these patents in the short term, and are more inclined to invest in them. However, the improvement of patents for invention is a long process, requiring a lot of research investment, which makes the carbon policy constraint in the external environment a major limiter, leading to decline in enterprise invention.
8. Conclusions
With growing environmental problems, the Chinese government has gradually introduced a series of policies to govern the environment. Among these, the Carbon Emissions Trading Pilot Policy is one of the important measures for the Chinese government to comprehensively manage environmental challenges. This paper chooses carbon trading as typically representative of China’s environmental regulation policy to analyze its impact on enterprise innovation. The results show that the conclusions of the literature for this problem are diametrically opposed to previous literature relative to EU ETS’s effect, so there is no accurate conclusion about this causal effect. Some studies assert that carbon trading policy can produce positive incentives for enterprise innovation, while others point out that it can only be effective in the environmental sector. Other research claims that carbon trading policy for enterprise innovation will have a negative impact on enterprise innovation. At the same time, China is one of the largest countries with the largest carbon emissions. However, there is a lack of China’s carbon trading policy for enterprise innovation research literature.
Based on these two points, this paper systematically attempts to discuss China’s carbon trading policy. The impact of China’s Carbon Emissions Trading Pilot Policy on enterprise innovation behavior. This paper takes this opportunity to estimate this causal effect. Therefore, it combines the synthetic control and difference-in-differences methods to achieve it. On the one hand, it uses the synthetic control method which can make up for the flaws in DID method. On the other hand, the DID method can make the study more detailed and accurate.
Based on the use of different empirical methods for cross validation, firstly, we take Hubei Province as a case to use the synthetic control method to estimate a general effect of carbon trading policy on enterprise innovation. Due to some literature finding that some industry sectors’ enterprise innovation is impacted by environmental regulation (e.g., electricity industry and paper industry), we use the data from the enterprise level, listed company data, and divide the industries which comprise all enterprise into two categories—environmental industry and non-environmental industry. The DID method was then used to meticulously estimate the policy effect on enterprises coming from different industries. Subsequently, there is also some literature that argues that environmental regulation can just have a significant effect on green technical innovation and cannot promote the non-green technical innovation. Referring to the OECD’s criterion of green technical patent, we respectively test the different effects of carbon trading policy on different types of enterprise innovation, including green technical innovation and non-green technical innovation.
The conclusion of the study shows that the implementation of carbon trading policy has a certain hindrance to the innovation of local enterprises in general, and the effect is statistically significant and temporally persistent. With the potential for the implementation of carbon trading policy in 2014, in Hubei Province—compared with the actual number of enterprises in Hubei—the number of patent applications decreased by 0.1, a decline rate of about 1%.
At the same time, we conducted a series of robustness tests on the results of difference-in-differences method, placebo test, and permutation test. The results show that carbon trading policy has good robustness to the hiring effect of local enterprises’ innovation. However, to be specific, China’s carbon trading policy has a different effect in different industries and different types of innovation. This carbon trading policy can significantly promote enterprise innovation in environmental industry and create incentives for the development of green technical innovations. Conversely, it could also reduce enterprise innovation in non-environmental industry and their non-green technical innovations.
We think that this heterogeneity exists between the different industries and the different types of enterprise innovation for two reasons, including enterprise performance and difference of technology (patent). Firstly, because environmental regulation is associated with environmental industry sectors, the impact is more severe, and their willingness to improve technological innovation and reduce costs is even stronger. At the same time, those enterprises that are not related to environmental industry sectors are relatively less motivated to achieve technological innovation. Secondly, due to the difference between the benefits of different innovative inventions, the patents for utility models and designs have their own advantage, as they just smaller scientific research investments, and can be applied to economic performance in the short term. However, the improvement of patents for invention is a long process and requires a lot of research investment, which makes the carbon trading policy constraint in the external environment difficult to achieve, leading to a decline in enterprise invention.
The conclusion of this paper has some policy implications, that is, when the government implements the carbon trading policy, it should also consider local factors and adopt the proper implementation of the policies in order to ensure the desired effect of the policy and prevent the emergence of other negative factors. However, the effectiveness of the carbon trading policy is beyond doubt. This regulation can reduce the enterprise innovation in general, this effect will only affect the short term because of enterprise performance and types of technology, and it can play a significantly positive role in green technical innovation of enterprises which belong to the environmental industry. At this point, the policy is a significant positive driver. After all, the effectiveness of a policy should be reflected in the long term and be beneficial to the whole of society.
Acknowledgments
This research is funded by Projects of the National Social Science Foundation of China, the subject is the impasse of global climate change negotiation and China’s actively involvement with and response to the negotiation. The item number is 16BZZ086. This article is supported by Yan Zhang, she also contributed to the completion of this paper, and we thank her for her support and companionship.
Author Contributions
For this research article, different authors did the different work. Chen Feng and Beibei Shi conceived and designed the experiments. Rong Kang guided and perfected the whole procedure. Beibei Shi constructed the model and completed the relative tests. Chen Feng wrote the paper.
Conflicts of Interest
The authors declare no conflict of interest.
References
- Calel, R.; Dechezleprêtre, A. Environmental policy and directed technological change: Evidence from the European carbon market. Rev. Econ. Stat. 2016, 98, 173–191. [Google Scholar] [CrossRef]
- Kossoy, A.; Guigon, P. State and Trends of the Carbon Market 2012; The World Bank: Washington, DC, USA, 2010; pp. 13–16. [Google Scholar]
- Pizer, W.A.; Popp, D. Endogenizing technological change: Matching empirical evidence to modeling needs. Energy Econ. 2008, 30, 2754–2770. [Google Scholar] [CrossRef]
- Stavins, R.N. Transaction costs and tradeable permits. J. Environ. Econ. Manag. 1995, 29, 133–148. [Google Scholar] [CrossRef]
- Jaffe, A.B.; Palmer, K. Environmental regulation and innovation: A panel data study. Rev. Econ. Stat. 1996, 79, 610–619. [Google Scholar] [CrossRef]
- Gagelmann, F.; Frondel, M. The impact of emission trading on innovation—Science fiction or reality. Eur. Environ. 2005, 15, 203–211. [Google Scholar] [CrossRef]
- Grubb, M.; Azar, C.; Persson, U.M. Allowance allocation in the European emissions trading system: A commentary. Clim. Policy 2005, 5, 127–136. [Google Scholar] [CrossRef]
- Hoffmann, V.H. EU ETS and Investment Decisions: The case of the German electricity industry. Eur. Manag. J. 2007, 25, 464–474. [Google Scholar] [CrossRef]
- Schleich, J.; Rogge, K.; Betz, R. Incentives for energy efficiency in the EU Emissions Trading Scheme. Energy Effic. 2009, 2, 37–67. [Google Scholar] [CrossRef]
- Hicks, J.R. The Theory of Wages; Macmillan: New York, NY, USA, 1932; pp. 19–34. [Google Scholar]
- Porter, M.E. Towards a dynamic theory of strategy. Strateg. Manag. J. 1991, 12, 95–117. [Google Scholar] [CrossRef]
- Acemoglu, D.; Aghion, P.; Bursztyn, L.; Hemous, D. The environment and directed technical change. Am. Econ. Rev. 2012, 102, 131–166. [Google Scholar] [CrossRef] [PubMed]
- Fowlie, M. Emissions trading, electricity restructuring, and investment in pollution abatement. Am. Econ. Rev. 2010, 100, 837–869. [Google Scholar] [CrossRef]
- Goulder, L.H.; Schneider, S.H. Induced technological change and the attractiveness of CO2 abatement policies. Resour. Energy Econ. 1999, 21, 211–253. [Google Scholar] [CrossRef]
- Van der Zwaan, B.C.C.; Gerlagh, R.; Schrattenholzer, L. Endogenous technological change in climate change modelling. Energy Econ. 2002, 24, 1–19. [Google Scholar] [CrossRef]
- Popp, D. ENTICE. Endogenous technological change in the DICE model of global warming. J. Environ. Econ. Manag. 2004, 24, 742–768. [Google Scholar] [CrossRef]
- Brunnermeier, S.B.; Cohen, M.A. Determinants of environmental innovation in US manufacturing industries. J. Environ. Econ. Manag. 2003, 45, 278–293. [Google Scholar] [CrossRef]
- Popp, D. Induced innovation and energy prices. Am. Econ. Rev. 2002, 92, 160–180. [Google Scholar] [CrossRef]
- Aghion, P.; Dechezleprêtre, A.; Hemous, D.; Martin, R.; Van Reenen, J. Carbon taxes, path dependency, and directed technical change: Evidence from the auto industry. J. Political Econ. 2016, 124, 1–51. [Google Scholar] [CrossRef]
- Lanjouw, J.O.; Mody, A. Innovation and the international diffusion of environmentally responsive technology. Res. Policy 1996, 25, 549–571. [Google Scholar] [CrossRef]
- Popp, D. International innovation and diffusion of air pollution control technologies: The effects of NOx and SO2 Regulation in the US, Japan and Germany. J. Environ. Econ. Manag. 2006, 51, 46–71. [Google Scholar] [CrossRef]
- Lanoie, P.; Laurent-Lucchetti, J.; Johnstone, N.; Ambec, S. Environmental policy, innovation and performance: New insights on the Porter Hypothesis. J. Environ. Econ. Manag. 2011, 20, 803–842. [Google Scholar] [CrossRef]
- Johnstone, N.; Haščič, I.; Popp, D. Renewable energy policies and technological innovation: Evidence based on patent counts. Environ. Res. Econ. 2010, 45, 133–155. [Google Scholar] [CrossRef]
- De Marchi, V. Environmental innovation and R&D cooperation: Empirical evidence from Spanish manufacturing firms. Res. Policy 2012, 41, 614–623. [Google Scholar] [CrossRef]
- Martin, R.; Muûls, M.; Wagner, U. Carbon markets, carbon prices and innovation: Evidence from interviews with managers. In Proceedings of the Annual Meetings of the American Economic Association, San Diego, CA, USA, 4–6 January 2013. [Google Scholar]
- List, J.A.; Millimet, D.L.; Fredriksson, P.G.; Warren NcHone, W. Effects of environmental regulations on manufacturing plant births: Evidence from a propensity score matching estimator. Rev. Econ. Stat. 2003, 85, 944–952. [Google Scholar] [CrossRef]
- Greenstone, M.; Gayer, T. Quasi-experimental and experimental approaches to environmental economics. J. Environ. Econ. Manag. 2009, 57, 21–44. [Google Scholar] [CrossRef]
- Taylor, M.R. Innovation under Cap-and-Trade Programs. Proc. Natl. Acad. Sci. USA 2012, 109, 4804–4809. [Google Scholar] [CrossRef] [PubMed]
- Lange, I.; Bellas, A. Technological change for sulfur dioxide scrubbers under market-based regulatio. Land Econ. 2005, 81, 546–556. [Google Scholar] [CrossRef]
- Anderson, B.; Di Maria, C. Abatement and allocation in the pilot phase of the EU ETS. Environ. Res. Econ. 2011, 48, 83–103. [Google Scholar] [CrossRef]
- Tomás, R.A.F.; Ribeiro, F.R.; Santos, V.M.S.; Gome, J.F.P.; Bordado, J.C.M. Assessment of the impact of the European CO2 emissions trading scheme on the Portuguese chemical industry. Energy Policy 2010, 38, 626–632. [Google Scholar] [CrossRef]
- The Economist. “Clearing the Air?”. Available online: http://www.economist.com/node/21542826 (accessed on 14 January 2012).
- Hering, L.; Poncet, S. Environmental policy and exports: Evidence from Chinese cities. J. Environ. Econ. Manag. 2014, 68, 296–318. [Google Scholar] [CrossRef]
- Dean, J.M.; Lovely, M.E.; Wang, H. Are foreign investors attracted to weak environmental regulations? Evaluating the evidence from China. J. Dev. Econ. 2009, 90, 1–13. [Google Scholar] [CrossRef]
- Lu, Z.; Streets, D.G.; Zhang, Q.; Wang, S.; Carmichael, G.R.; Cheng, Y.F.; Wei, C.; Diehl, T.; Tan, Q. Sulfur dioxide emissions in China and sulfur trends in East Asia since 2000. Atmos. Chem. Phys. Discuss. 2010, 10, 6311–6331. [Google Scholar] [CrossRef]
- Cai, X.; Lu, Y.; Wu, M.; Yu, L. Does environmental regulation drive away inbound foreign direct investment? Evidence from a quasi-natural experiment in China. J. Dev. Econ. 2016, 123, 73–85. [Google Scholar] [CrossRef]
- He, K.; Huo, H.; Zhang, Q. Urban air pollution in China: Current status, characteristics and progress. Ann. Rev. Energy Environ. 2002, 27, 397–431. [Google Scholar] [CrossRef]
- Borghesi, S.; Cainelli, G.; Mazzanti, M. European emission trading scheme and environmental innovation: An empirical analysis using CIS data for Italy. G. Econ. Ann. Econ. 2012, 71, 71–97. [Google Scholar]
- Schumpeter, J.A. Economic Doctrine and Method: An Historical Sketch; Reinhold, A., Translator; Oxford University Press: New York, NY, USA, 1954. [Google Scholar]
- Griliches, Z. Issues in assessing the contribution of research and development to productivity growth. Bell J. Econ. 1979, 10, 92–116. [Google Scholar] [CrossRef]
- Ley, M.; Stucki, T.; Woerter, M. The impact of energy prices on green innovation. Energy J. 2016, 37, 41–75. [Google Scholar] [CrossRef]
- Abadie, A.; Diamond, A.; Hainmueller, J. Synthetic Control methods for comparative case studies: Estimating the effect of California’s tobacco control program. J. Am. Stat. Assoc. 2010, 105, 493–505. [Google Scholar] [CrossRef]
- Temple, J. The new growth evidence. J. Econ. Lit. 1999, 37, 112–156. [Google Scholar] [CrossRef]
- King, G.; Zeng, L. The dangers of extreme counterfactuals. Political Anal. 2006, 14, 131–159. [Google Scholar] [CrossRef]
Figure 1.
Carbon emissions trading pilot distribution.
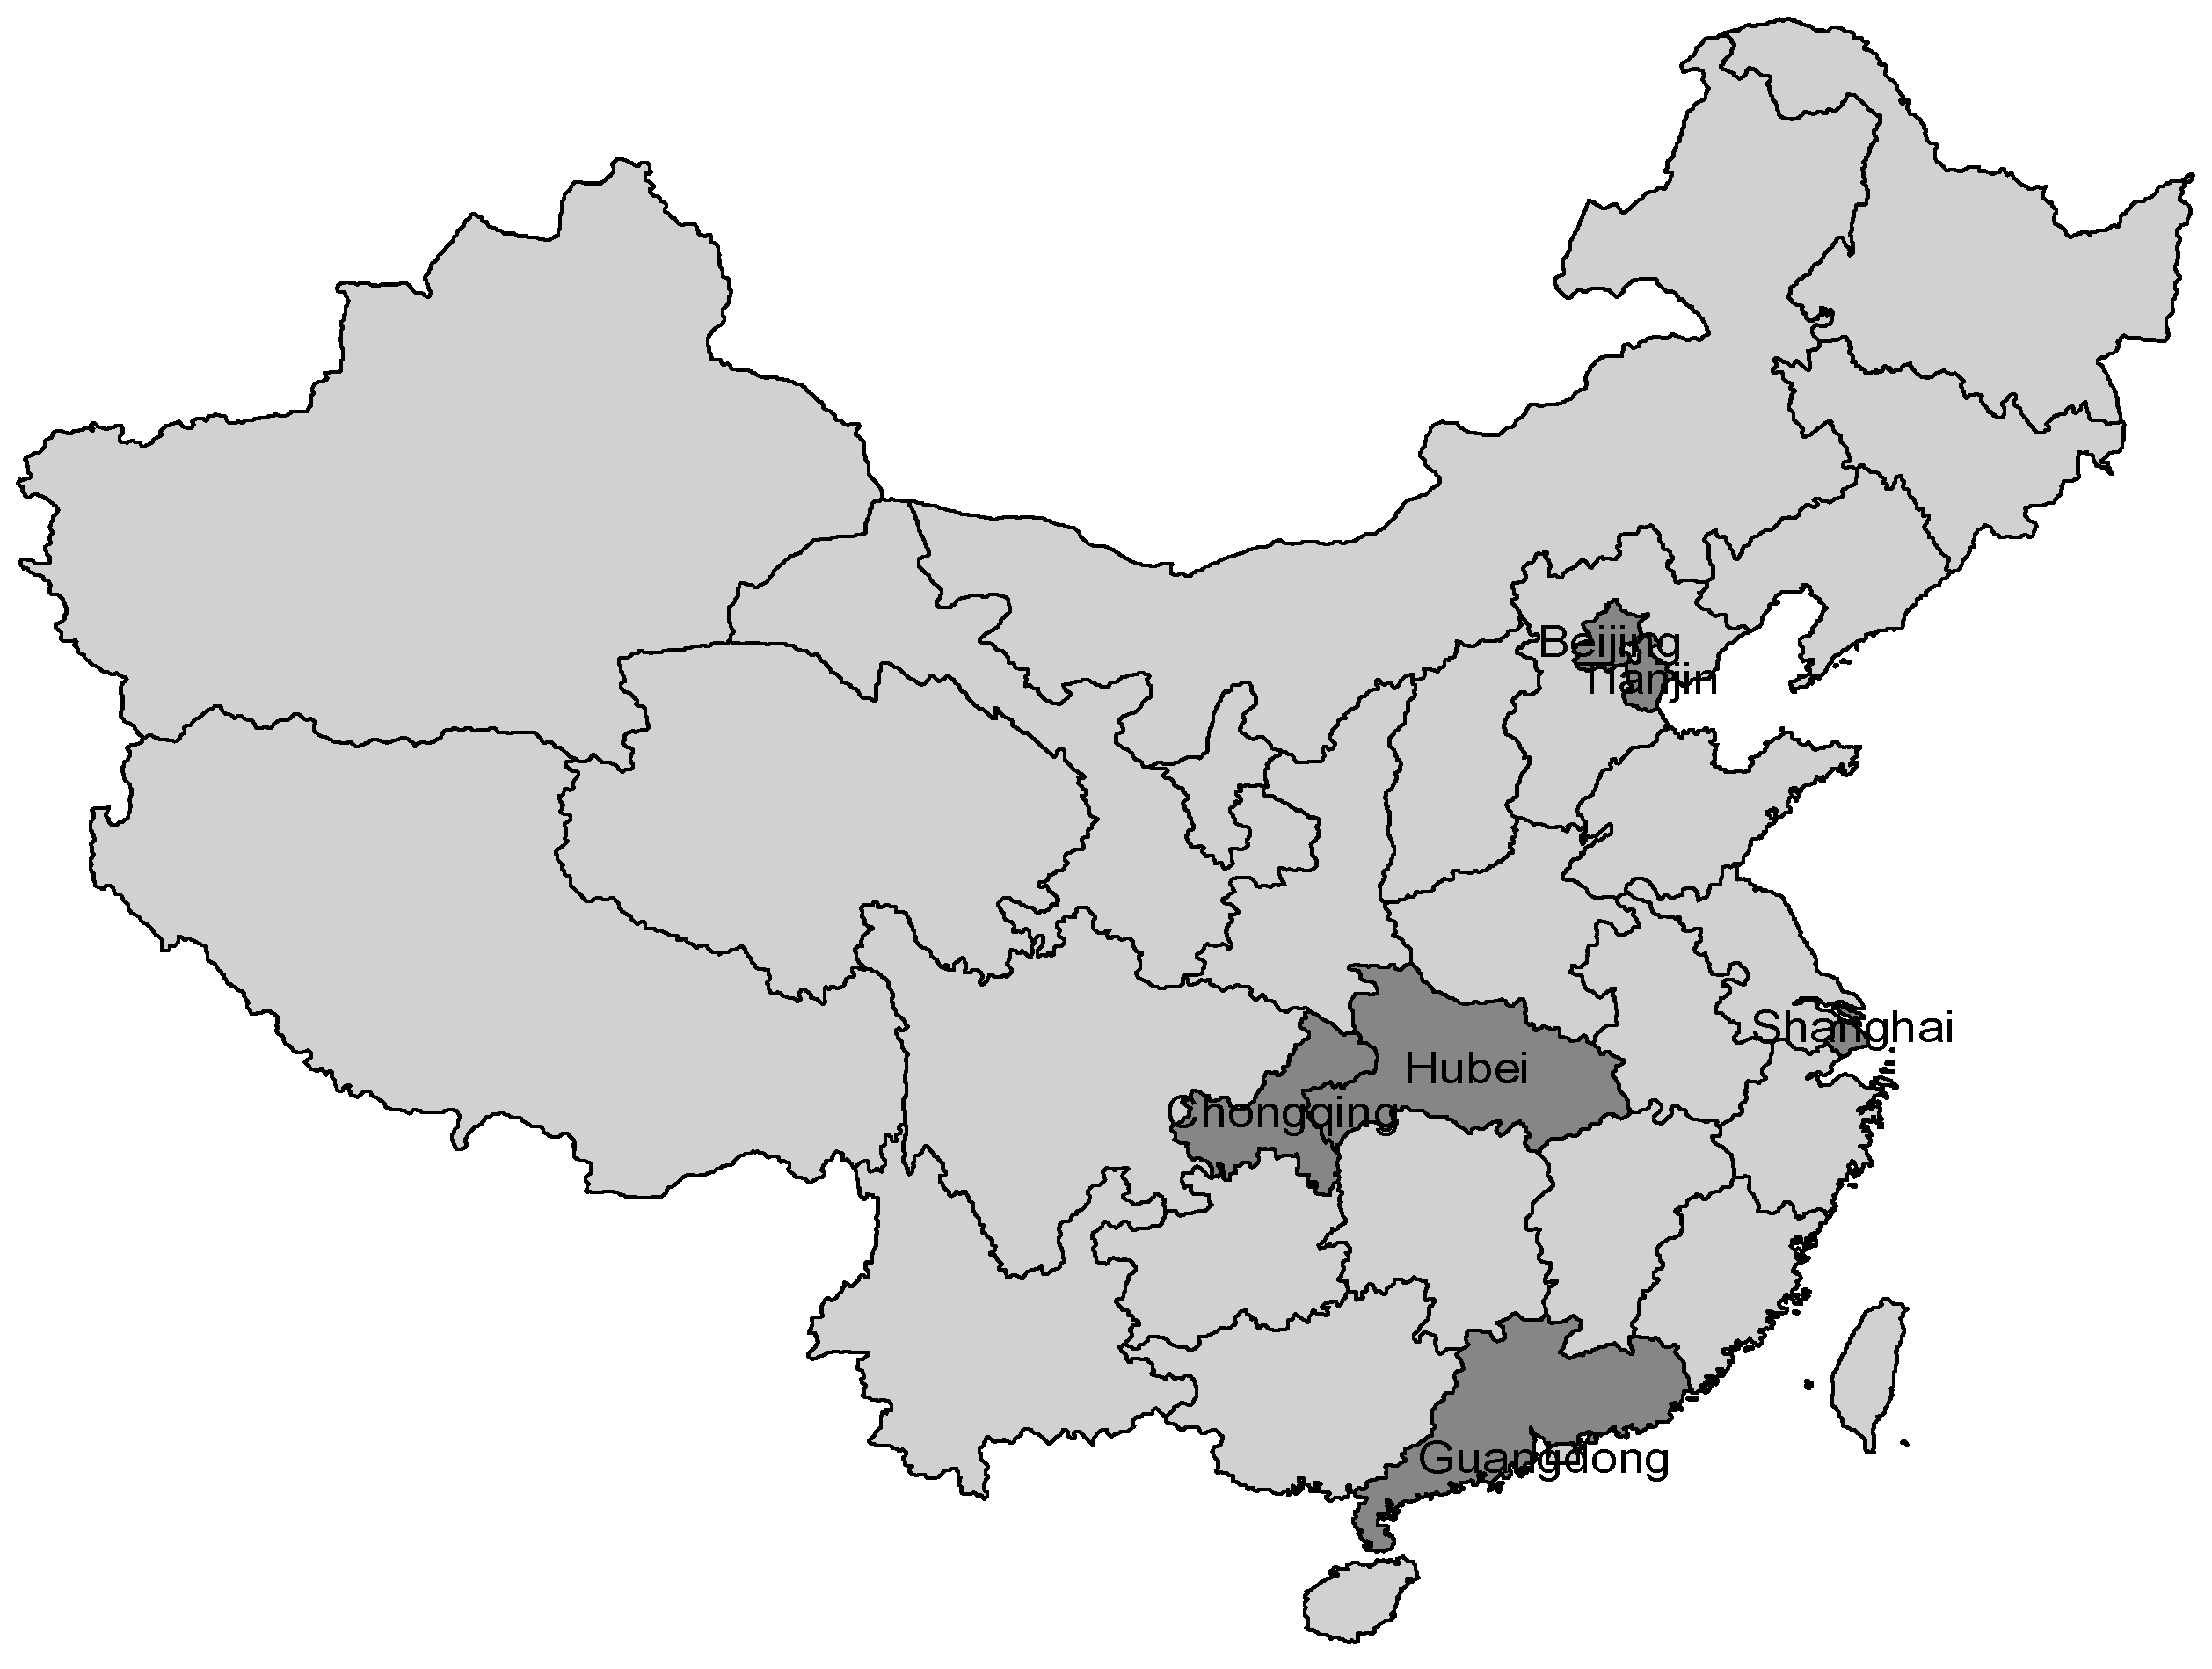
Figure 2.
The number of patent applications of Hubei and Synthetic Hubei province.

Figure 3.
The gap in the number of patent applications.

Figure 4.
The number of patent applications of Henan and Synthetic Henan Province.

Figure 5.
The number of patent applications of Guangxi and Synthetic Guangxi Province.
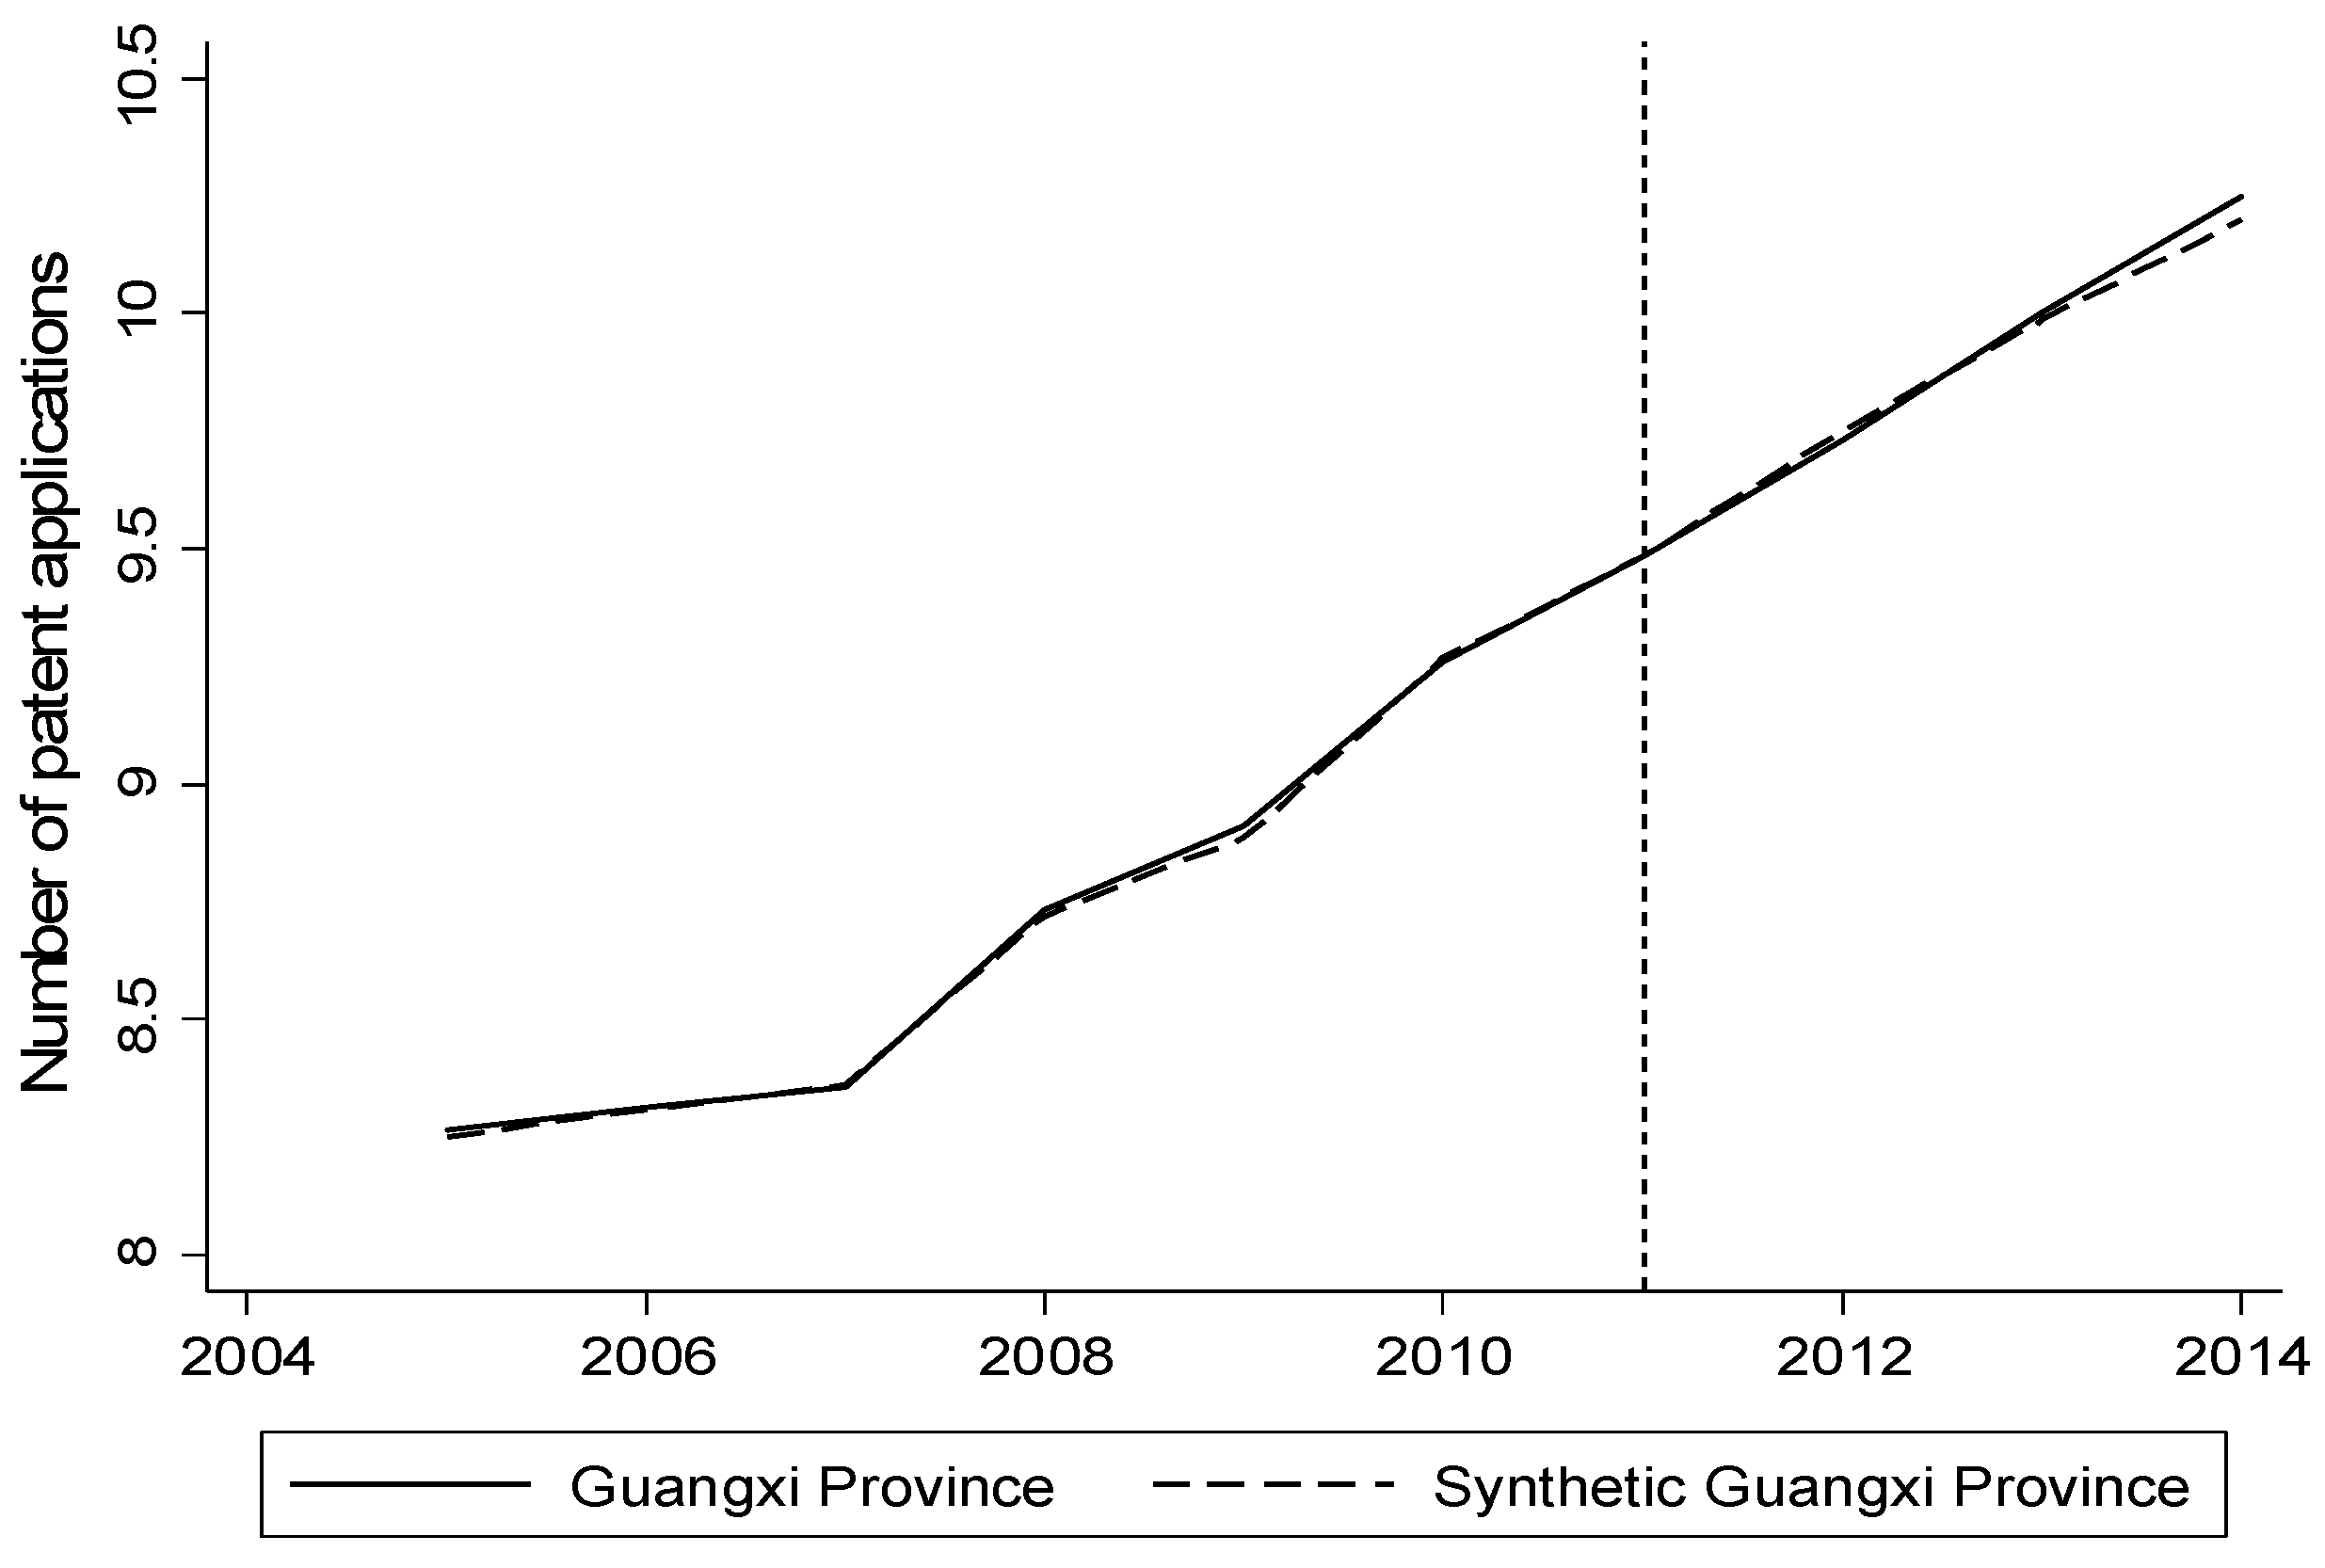
Figure 6.
Deviation distribution after removing eight provinces.
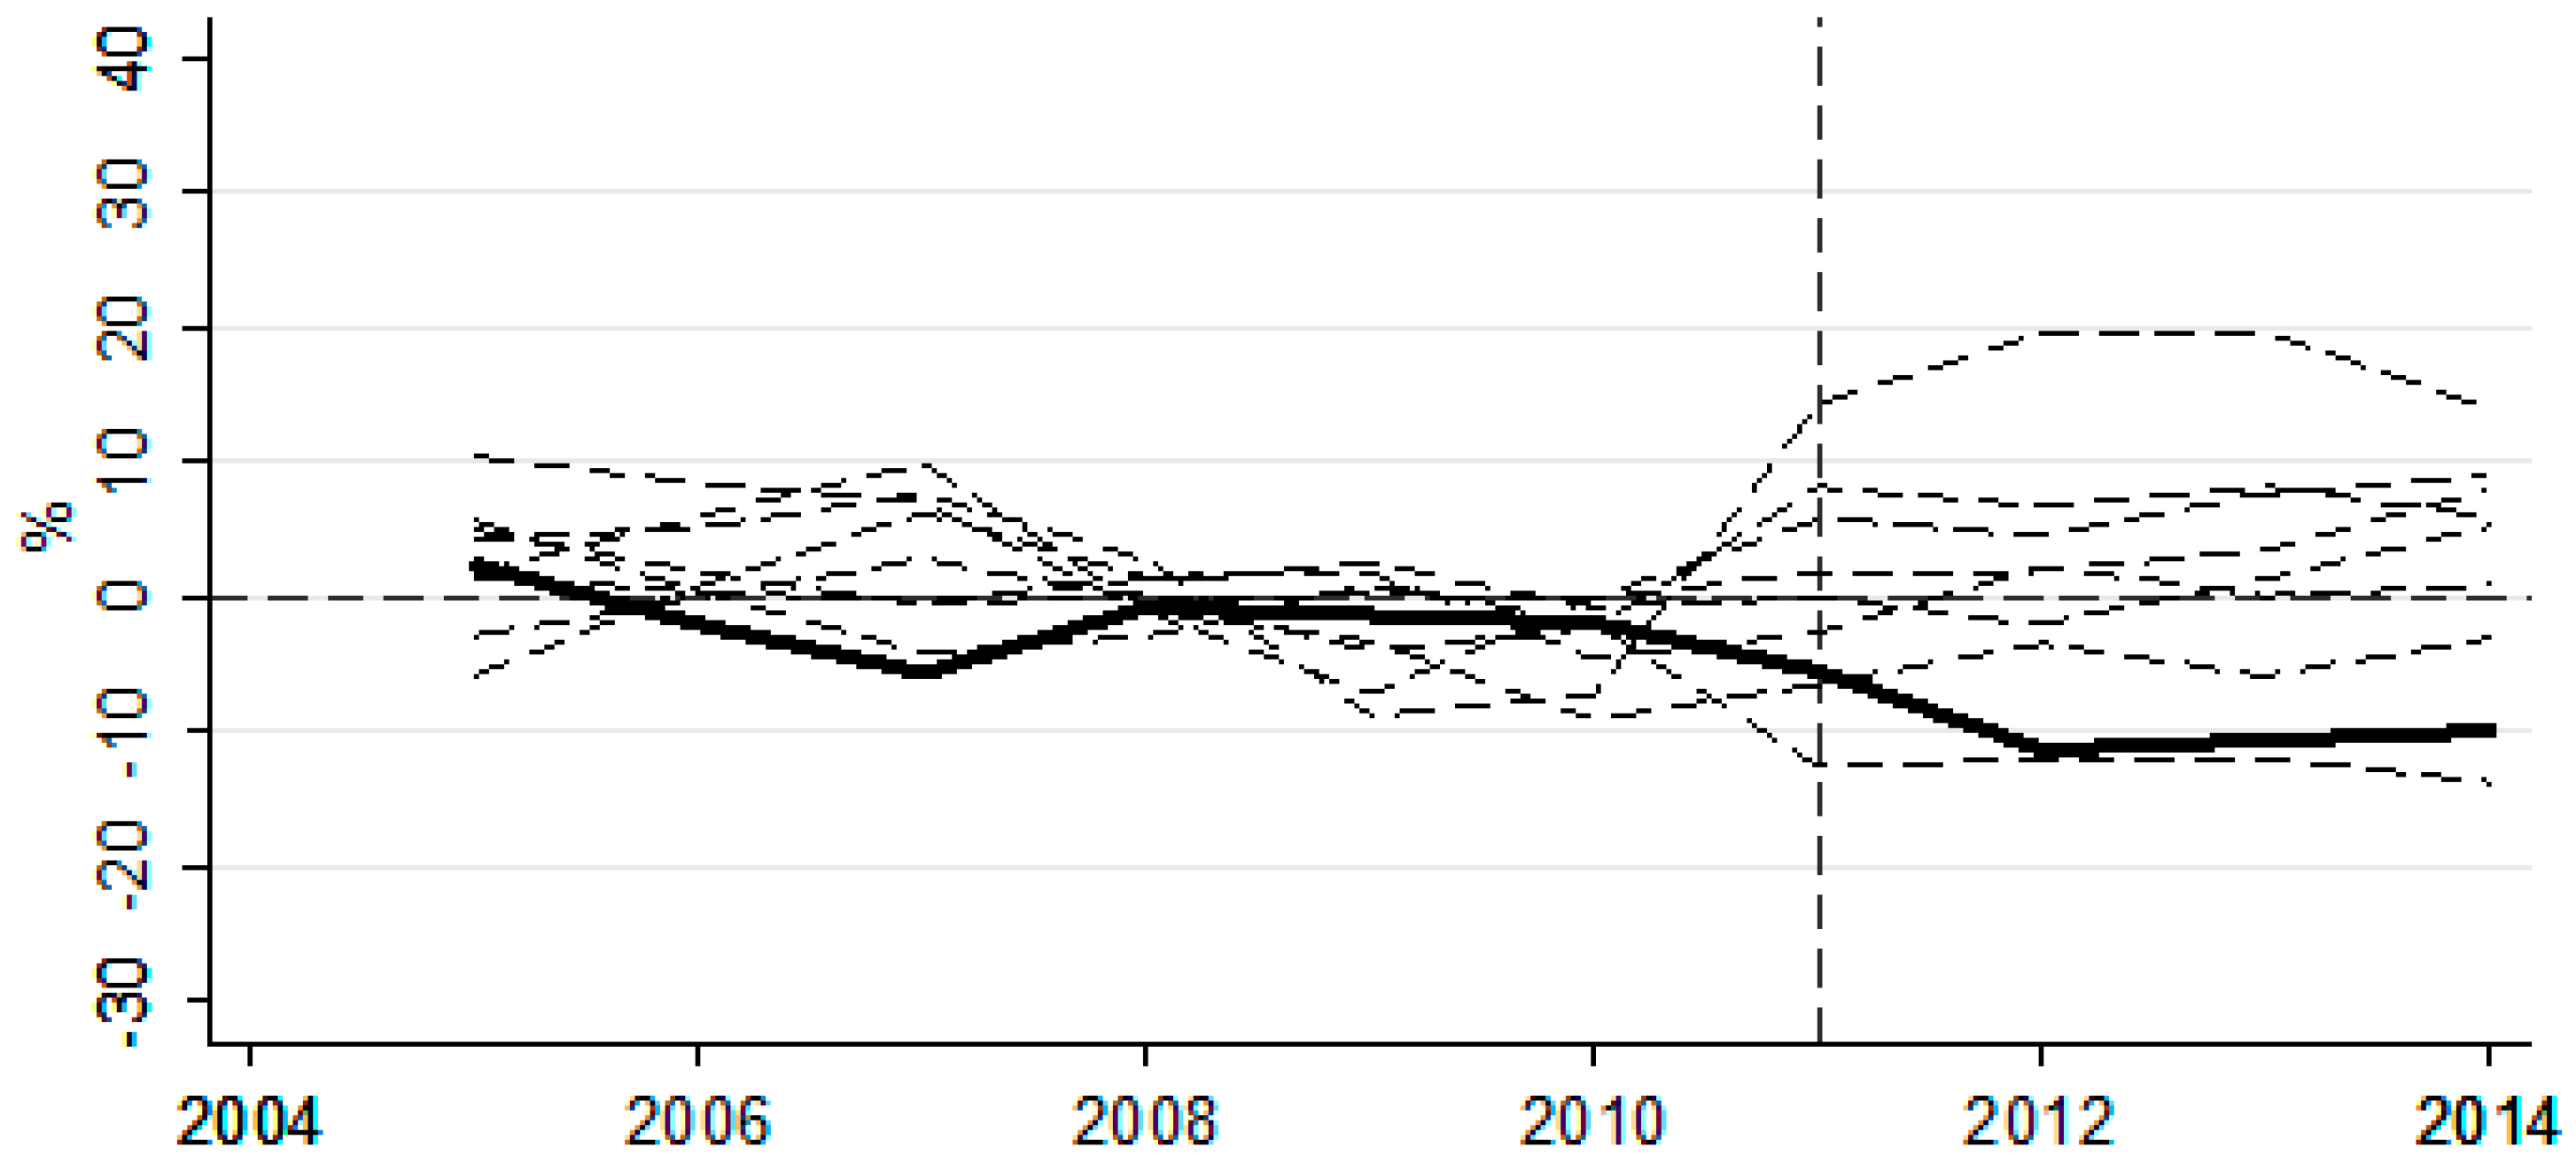
Figure 7.
Enterprise research investment in different industries.

Figure 8.
Enterprise research investment in different types of enterprises.


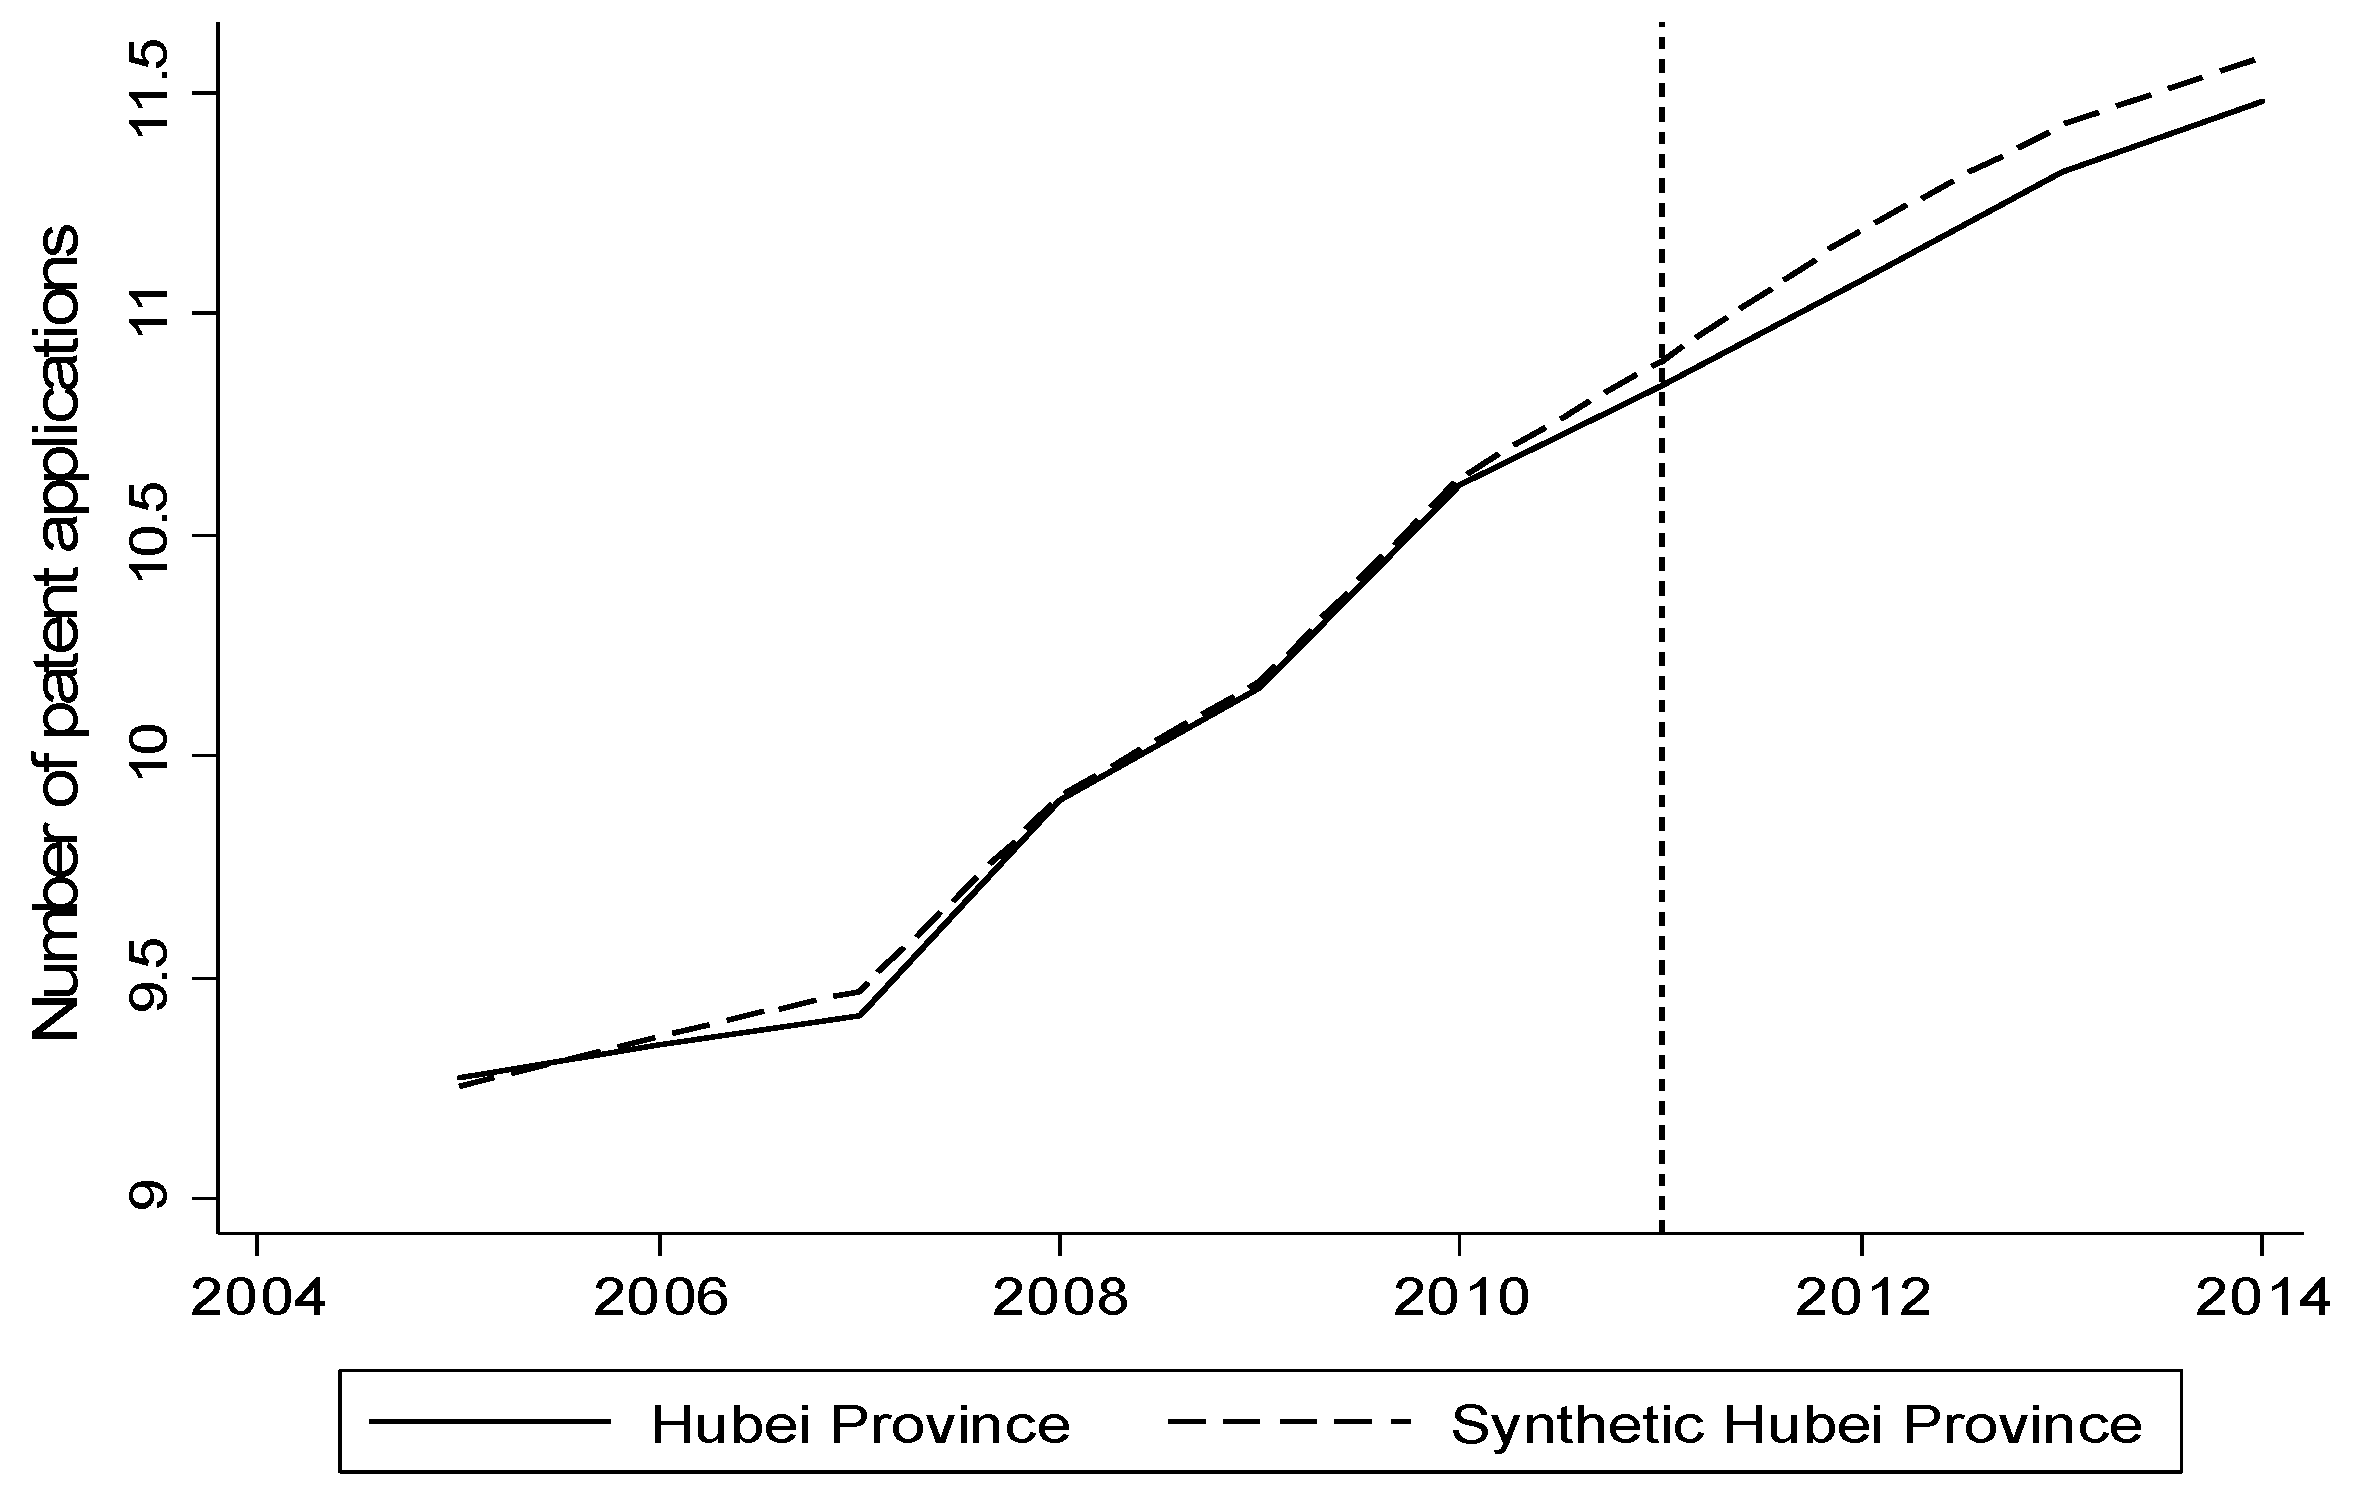
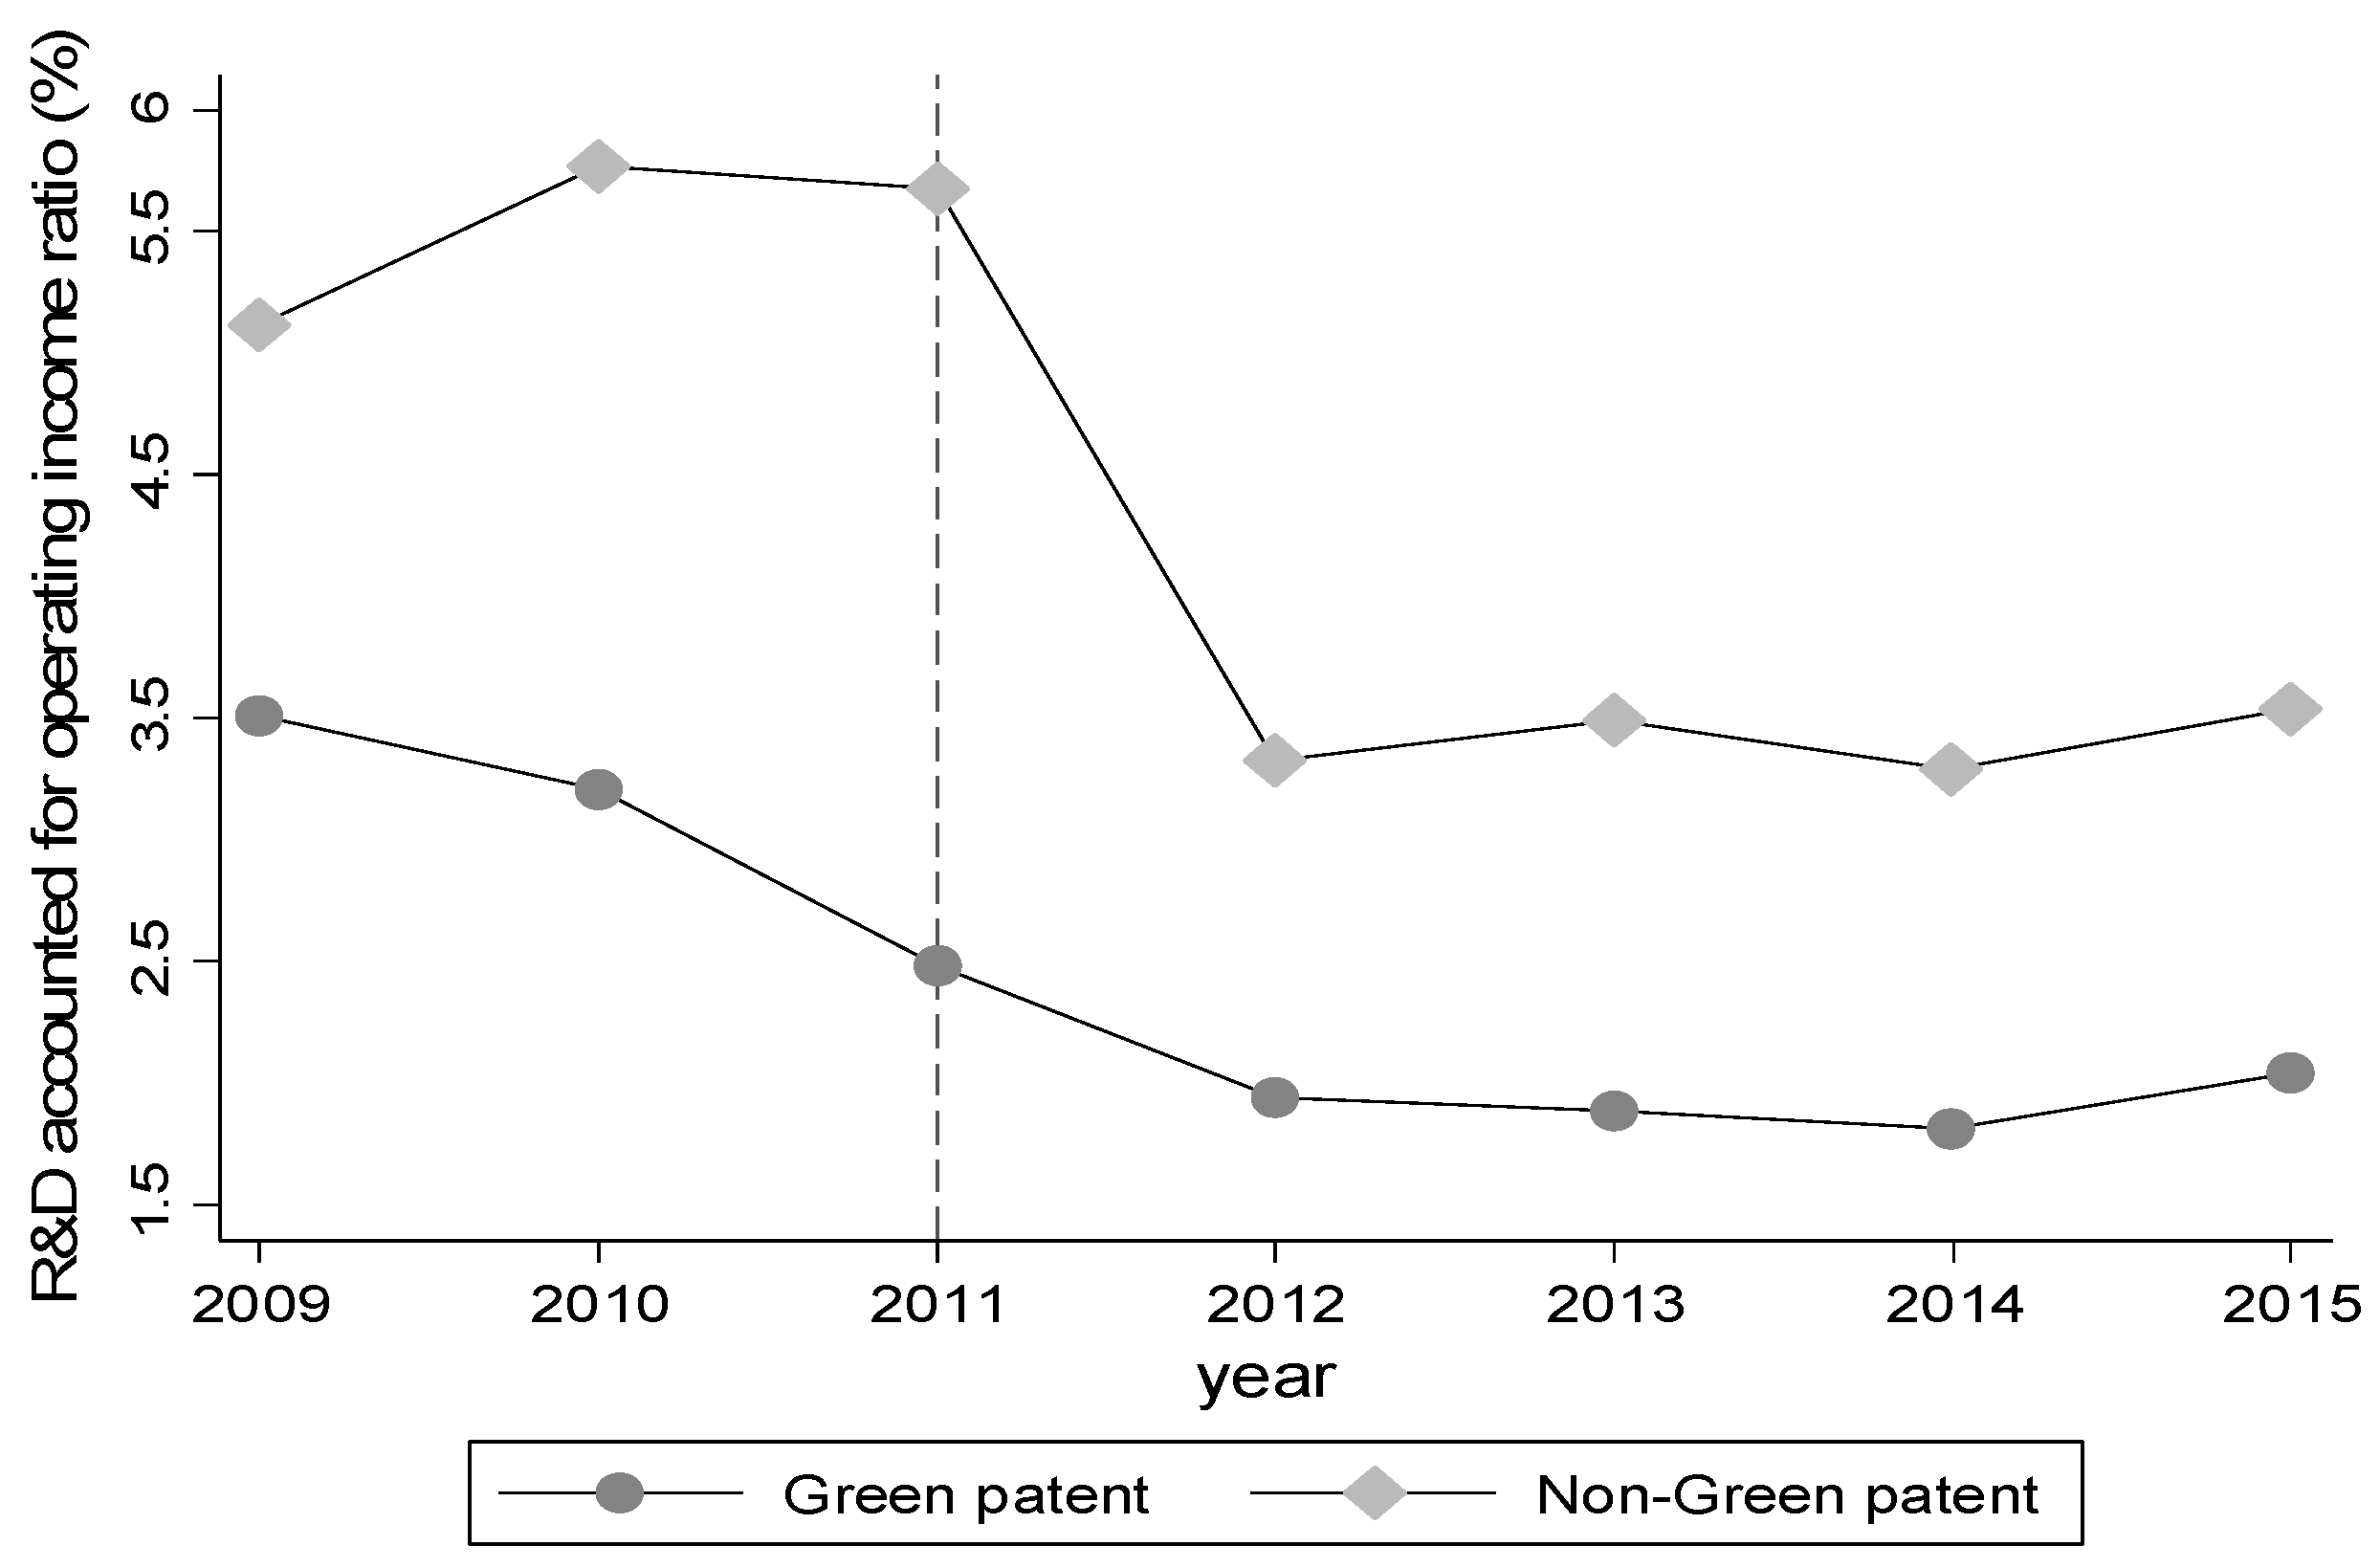
Table 1.
Control groups’ unit weights.
| Province | Anhui | Henan | Hunan | Sichuan |
|---|---|---|---|---|
| Weight | 0.096 | 0.469 | 0.249 | 0.187 |
Table 2.
Predictor balance.
| Variable | The Real Hubei | Synthetic Hubei | Other Provinces |
|---|---|---|---|
| Talent investment | 11.682 | 11.681 | 10.381 |
| R&D investment | 14.851 | 14.667 | 13.26 |
| Enterprise scale | 19.452 | 19.523 | 18.359 |
| Technology introduction | 13.259 | 12.13 | 11.118 |
| Foreign direct investment accounts for the proportion of GDP | 8.276 | 8.027 | 7.036 |
| Import and export trade accounted for the proportion of GDP | 6.787 | 7.059 | 4.786 |
| The proportion of total industrial output value to GDP | 20.148 | 20.162 | 18.246 |
| Local GDP | 10.056 | 10.182 | 8.945 |
Table 3.
The criterion of environmental industry and non-environmental industry.
| Environmental Industry | Non-Environmental Industry | ||
|---|---|---|---|
| Environmental Industry | Coal Mining and Washing Industry | Building Industry | Road Transport Industry |
| Electricity, heat production, and supply industry | Water transport industry | ||
| Paper and paper products industry | Civil Engineering building industry | ||
| Rubber and plastic products industry | Real estate industry | ||
| Gas production and supply industry | |||
| Chemical fiber manufacturing industry | Manufacturing Industrys | Computer, communications, and other electronic equipment manufacturing industry | |
| Oil processing, coking, and nuclear fuel processing industry | Electrical machinery and equipment manufacturing industry | ||
| Chemical raw materials and chemical products manufacturing industry | Railways, ships, aerospace, and other transportation equipment manufacturing industry | ||
| Automotive manufacturing industry | |||
| Special equipment manufacturing industry | |||
| Instrumentation manufacturing industry | |||
| Pharmaceutical manufacturing industry | |||
| General equipment manufacturing industry | |||
| Metal products industry | |||
| Non-metallic mineral products industry | |||
| Mining support activities | |||
| Black metal mining industry | |||
| Other manufacturing industry | |||
| Ferrous metal smelting and rolling processing industry | |||
| Non-ferrous metal smelting and rolling processing industry | |||
| Non-ferrous metal mining industry | |||
| Food Industry | Wine, beverages, and refined tea manufacturing | ||
| Textile and apparel, apparel industry | |||
| Textile industry | |||
| Agricultural and sideline food processing industry | |||
| Food manufacturing industry | |||
| Culture, education, sports, and entertainment supplies manufacturing industry | |||
| Other Industry | Retail industry | ||
| Wholesale industry | |||
| Software and information technology services industry | |||
| Overall | |||
| Water production and supply industry | |||
| Wood processing and wood, bamboo, rattan, brown, grass products industry | |||
| Forestry industry | |||
| Agriculture, forestry, animal husbandry, and fishery services industry | |||
| Animal husbandry industry | |||
| Agriculture | |||
| News and publishing industry | |||
| Telecommunications, radio and television, and satellite transmission services industry | |||
| Radio, television, film, and video recording operations industry | |||
Table 4.
The impact of carbon trading policy on enterprise innovation in different industry sectors.
Table 4.
The impact of carbon trading policy on enterprise innovation in different industry sectors.
| Environmental Industry | Non-Environmental Industry | |||||
|---|---|---|---|---|---|---|
| (4.1) | (4.2) | (4.3) | (4.4) | (4.5) | (4.6) | |
| Patents for Invention | Patents for Utility Model | Patents for Design | Patents for Invention | Patents for Utility Model | Patents for Design | |
| 1.249 *** | 0.538 | 0.897 ** | −0.248 ** | 0.327 ** | 0.570 *** | |
| (0.358) | (0.456) | (0.413) | (0.119) | (0.140) | (0.176) | |
| _cons | 0.700 *** | 0.760 *** | 1.140 *** | 0.820 *** | 2.077 *** | 1.755 *** |
| (0.135) | (0.222) | (0.333) | (0.082) | (0.096) | (0.124) | |
| Time effect | YES | YES | YES | YES | YES | YES |
| Individual effect | YES | YES | YES | YES | YES | YES |
| N | 248 | 245 | 70 | 847 | 802 | 525 |
| F | 52.489 | 18.764 | 2.598 | 121.459 | 61.013 | 15.276 |
| r2_a | 0.68 | 0.43 | 0.297 | 0.576 | 0.417 | 0.218 |
Note: (1) Brackets are standard errors; (2) ** p < 0.05, and *** p < 0.01.
Table 5.
Impact of carbon trading policies on different types of enterprise innovation.
| Green Technical Innovation | Non-Green Technical Innovation | |||||
|---|---|---|---|---|---|---|
| (5.1) | (5.2) | (5.3) | (5.4) | (5.5) | (5.6) | |
| Patents for Invention | Patents for Utility Model | Patents for Design | Patents for Invention | Patents for Utility Model | Patents for Design | |
| 0.595 *** | 0.209 | 1.114 ** | −0.466 *** | 0.258 * | 0.464 *** | |
| (0.217) | (0.286) | (0.450) | (0.134) | (0.151) | (0.178) | |
| _cons | 0.926 *** | 1.344 *** | 1.353 *** | 0.724 *** | 2.099 *** | 1.852 *** |
| (0.100) | (0.143) | (0.299) | (0.095) | (0.107) | (0.126) | |
| Time effect | YES | YES | YES | YES | YES | YES |
| Individual effect | YES | YES | YES | YES | YES | YES |
| N | 460 | 472 | 122 | 635 | 575 | 473 |
| F | 65.861 | 33.249 | 1.532 | 102.825 | 54.945 | 18.131 |
| r2_a | 0.584 | 0.404 | 0.121 | 0.606 | 0.477 | 0.270 |
Note: (1) Brackets are standard errors; (2) * p < 0.1, ** p < 0.05, and *** p < 0.01.
Table 6.
The impact of carbon trading policy on local enterprise innovation: DID estimation.
| Dependent Variable | Innovation | Innovation | Innovation |
|---|---|---|---|
| Column | (A) | (B) | (C) |
| −0.124 ** | −0.158 ** | −0.159 *** | |
| (0.050) | (0.062) | (0.061) | |
| _cons | 5.606 ** | 10.524 *** | 5.547 ** |
| (2.429) | (3.498) | (2.545) | |
| Control variable | YES | YES | YES |
| Time effect | YES | YES | YES |
| Individual effect | YES | YES | YES |
| The number of provinces | 29 | 22 | 27 |
| Observations | 289 | 219 | 269 |
| F value | 398.929 | 309.364 | 357.239 |
| r2_a | 0.963 | 0.964 | 0.962 |
Note: (1) Brackets are standard errors; (2) ** p < 0.05, and *** p < 0.01.
© 2017 by the authors. Licensee MDPI, Basel, Switzerland. This article is an open access article distributed under the terms and conditions of the Creative Commons Attribution (CC BY) license (http://creativecommons.org/licenses/by/4.0/).
Share and Cite
MDPI and ACS Style
Feng, C.; Shi, B.; Kang, R. Does Environmental Policy Reduce Enterprise Innovation?—Evidence from China. Sustainability 2017, 9, 872. https://doi.org/10.3390/su9060872
AMA Style
Feng C, Shi B, Kang R. Does Environmental Policy Reduce Enterprise Innovation?—Evidence from China. Sustainability. 2017; 9(6):872. https://doi.org/10.3390/su9060872
Chicago/Turabian StyleFeng, Chen, Beibei Shi, and Rong Kang. 2017. "Does Environmental Policy Reduce Enterprise Innovation?—Evidence from China" Sustainability 9, no. 6: 872. https://doi.org/10.3390/su9060872
Note that from the first issue of 2016, this journal uses article numbers instead of page numbers. See further details here.