
Effects of Clean Air Act on Patenting Activities in Chemical Industry: Learning from Past Experiences


Department of Industrial Engineering, Gaziantep University, Şehitkamil 27310, Turkey
Sustainability 2017, 9(5), 862; https://doi.org/10.3390/su9050862
Submission received: 11 March 2017
/
Revised: 4 May 2017
/
Accepted: 17 May 2017
/
Published: 19 May 2017
(This article belongs to the Section Economic and Business Aspects of Sustainability)
Abstract
:The chemical industry provides essential goods we use in our daily lives and key ingredients for many diverse industries. On the other hand, their production and use require serious attention while they may be seriously harmful to local air quality. The Clean Air Act (CAA) and its subsequent amendments regulate the emissions of hazardous air pollutants to protect public health and welfare in the U.S.A. since 1970. This study aimed to assess the impact of CAA on the rate of patenting in the chemical industry. With this in mind, basic chemical utility patents were analyzed to detect the effects of CAA on the patenting activities. Subsequent to the fitting of the ARIMA (Autoregressive Integrated Moving Average) model (producing the least square of errors), a significant outlier was detected with the Dixon’s r22 Ratio Test. This outlier was the number of patents granted in 1972. Contextual queries in the text of those patent documents have shown that there was a considerable increase in the patents of chemistry which takes the sustainability relevant terms (air, emission, pollution, etc.) into consideration. It was concluded that companies in the chemistry industry adapted themselves very rapidly to the changes and CAA was an important incentive to create novel technologies.
1. Introduction
The chemical industry produces raw materials and intermediates, along with a wide variety of finished products for industry, business, and individual consumers [1]. Their products are essential, and therefore the industry is a key partner for all sectors of the manufacturing industry [2]. On the other hand, substances and the different forms of them used in a chemical processes should be selected by considering the potential chemical problems, such as “releases, explosions, and fires” [3]. This can be achieved by the development of widely accepted sub-criteria and indicators to assess how substances, materials, processes, and resource requirements comply with the concept of sustainable chemistry [2]. Quantitative determinations of contaminants and pollutants in the environment are another important aspect of chemistry [4]. For instance, hydrophobic chemicals may serve as long-term sources of pollution by absorbing to soils or sediments at contaminated sites; volatile chemicals may serve as air pollution hazards [5]. In this respect, policy arrangements and environmental sustainability regulations have been one of the powerful drivers of sustainability (for further information [6,7,8,9,10] can be read).
The Clean Air Act (CAA) has been one of these regulations that entered into force in 1970, to prevent and reduce the number of accidents and to protect communities. It was strengthened in 1990, gave the federal government the authority to enforce regulations that limit air pollution [11]. CAA amendments have identified several substances listed in the legislation as “hazardous air pollutants” because of their potentially significant effects on ecosystems and human health [12]. One of the unprecedented elements of the CAA acknowledged that existing technologies could be inadequate to meet federally established standards [13]. In this respect, companies could fail to comply with the standards unless they sought to modify their operations, processes, and materials. This search/gap could be fulfilled with the introduction of new technologies, materials or processes. Performance-based regulations have higher impact to activate technological innovation when compared to technology-based regulations while performance targets are given instead of a technology focus [14]. On the other hand, it is still unclear whether this is an incentive to undertake major technological changes to avoid air pollution or not. Although there are studies linking technological change to economic incentives [15] or environmental regulation [3,16,17,18], the impact of several policies on measures of patenting has rarely been studied. Since the policies are likely to have effects on the step and path of technological change, this paper intends to assess the effects of the CAA on the patenting activity in chemistry industry.
The huge increase in the number of basic chemicals utility patents (patents for inventions) in 1972 has been an inspiration for this study. Although there are increases and decreases in the number of patents (as illustrated in Figure 1), there was a 56.67% increase which had never seen in the U.S.A. In this regard, the paper focused on two fundamental research questions: What might be the reason for this increase? Can an assessment approach detect this and similar uncommon changes? After a scan of the history of the chemical industry, it has been understood that the Environmental Protection Agency was established in 1970 and thereby government regulations had entered into force. The year 1970 is accepted as a key year in the consciousness of the American public with the enactment of the Clean Air Act [19]. However, at the beginning, there was no significant support to justify this statement. Subsequent to content search (the terms related to the clean air regulations were searched) in the patented documents, the support for the justification has been obtained as discussed in the case section.
In those earlier studies, any increase in the number of patents is seen as a direct effect of a policy. However, an increase in the number of patents has been very common due to several factors (such as increasing population, increasing number of scientists, increasing awareness about intellectual properties, etc.). Therefore, the methodology proposed in this paper attempts to distinguish the common increase from an uncommon one and present a novel approach to overcome the stated problems. With this in mind, the ARIMA (Autoregressive Integrated Moving Average) model first attempts to provide the actual patterning of the patent counts as a function of time and then outliers are located to see abnormal change.
Even though there may be no need for a methodology to detect this apparent peak, there might be some other significant changes. In this regard, outlier detection test was employed. An ‘outlier’ is can be defined as an observation that is abnormally far from the other values in a sample taken randomly from a population. Nameroff et al. [20] stated that the rapid progress in the U.S. green chemistry patents has appeared after some major revisions in environmental laws in the late 1980s and early 1990s. However, the proposed methodology did not detect a significant deviation for any other years.
This paper begins with a brief discussion of the related works. Section 3 describes the data and the case study employed in this analysis. Section 4 provides a descriptive analysis of the findings and Section 5 discusses the proposed approach to investigate the effect of the CAA and then it concludes with possible future studies.
2. Related Work on the Sustainability Assessment and Patent Information
Patents have been widely used as a variable for measuring “output, technological innovation activity, or the strategy of technology management” [21,22,23,24,25,26,27,28,29,30,31]. They are also seen as one of the data sources that are capable of assessing technological capabilities of competitors [32]. Several papers agreed that patterns of innovation activities can be identified by using the “patent information” at the national level [33] and on a firm level [23].
Patent information can also be used for technology forecasting by using different analytic techniques applied to technical information [34]. In most of the studies, patent indicators have been used to forecast the promising technologies [35].
There are also studies that are assessing the sustainability of technologies through patent analysis. These studies can be categorized into two groups. The first group of studies handles “technology management” as a process and assesses sustainability from the perspective of business. In the other way of saying, sustainability of a technology is assessed through its continuity (trend) [36] or its possible commercialization [35,37].
The second—and much more common—group of studies assesses the technologies that are assistive to developing a sustainable environment, ensuring features such as “pollution free”, “creating local employment”, or “being renewable” [38]. In this regard, their focus is much more on eco-patents/green technologies [39]. Green technologies “use fewer resources, are less polluting, protect and/or rehabilitate the natural environment, recycle materials and waste, and conserve energy and water” [40]. This study can be evaluated under both of the categories. Detected outlier values may indicate a problem regarding the sustainability of a technology for the business. On the other hand, the case results showed that the detected outlier has a relation with the technologies that consider environmental aspects.
3. Method and the Case Study
The case demonstrated in this paper using the counts of utility patents (patents for inventions) for the basic chemicals category (North American Industry Classification System—NAICS Class: 3251) granted in the U.S.A. Data were retrieved from the website of the USPTO. This group includes inventions primarily used in manufacturing chemicals. Chemicals produced in this industry group are usually separate chemical elements or separate chemically-defined compounds. The USPTO states that “Patenting activity in the NAICS industry categories was determined by using the primary U.S. Patent Classification System (USPC) patent classification assigned to each patent and a USPC to NAICS concordance”. However, data cover only the corresponding patent counts for the years between 1964 and 2012 and this can be seen as a limitation of this study. The data do not perfectly fit a normal distribution while it is skewed. However, most of the data lie on the center and its surroundings. This indicates that the deviation is not excessive for most years. The years where there is a lower numbers of grants are relatively many more when compared to the years with higher numbers of patents.
Several studies have shown that it is possible to model the series of patents with ARIMA [41,42,43,44]. Some satisfactory model adjustments can be required to decrease the model residuals. For modeling the number of chemistry patents, different time-series models have been fitted with different parameters to find the best autoregressive model. Since the ARIMA (0,1,1) model with smoothing constant 0.67 (Figure 2) yielded the least sum of squares, it has been considered as the fundamental model that explains the common changing pattern. Researchers extensively employ the ARIMA (0,1,1) model for forecasting purposes due to “its attractive theoretical properties” and “empirical evidence in its support” [45]. The ARIMA (0,1,1) model takes the exponentially weighted moving average of the last few observations in order to remove the noise and more estimate the future values. The findings for our case indicate that the trend component is insignificant and detrending data does not decrease the value of the square of errors. The fitted model indicates an increase/decrease appeared in a certain year is expected to continue in the subsequent years.
While residuals show how much the forecasts stray from the actual values, we can track the data points where the model is incapable of explaining the change. In this regard, residuals of the ARIMA model have also been calculated to detect significant deviations from the fitted curve. Dixon’s r22 Ratio Test (while n ≥ 14) was performed to detect the outlier data. An outlier is an observation that is abnormally far from other values that was taken randomly from a population. Dixon’s Q test, (Q test) can identify an outlier value. Thereby, analyst can decide on the acceptance or rejection of the associated null hypothesis based on p and the preset confidence level [46]. The results are as given in Table 1. It has been seen that the number of granted patents in 1972 is a significant (p = 0.018) outlier for the fitted curve. Subsequent to removal of this outlier data point, the test was repeated to check if there is another outlier. No other data was detected as an outlier.
It is remarkable to state that the ARIMA (0,1,1) model is capable of explaining the change in the number of patents for all of the years under investigation except the year 1972. For instance, the number of patents for the years 1971 and 1972 are increased as expected.
4. Results
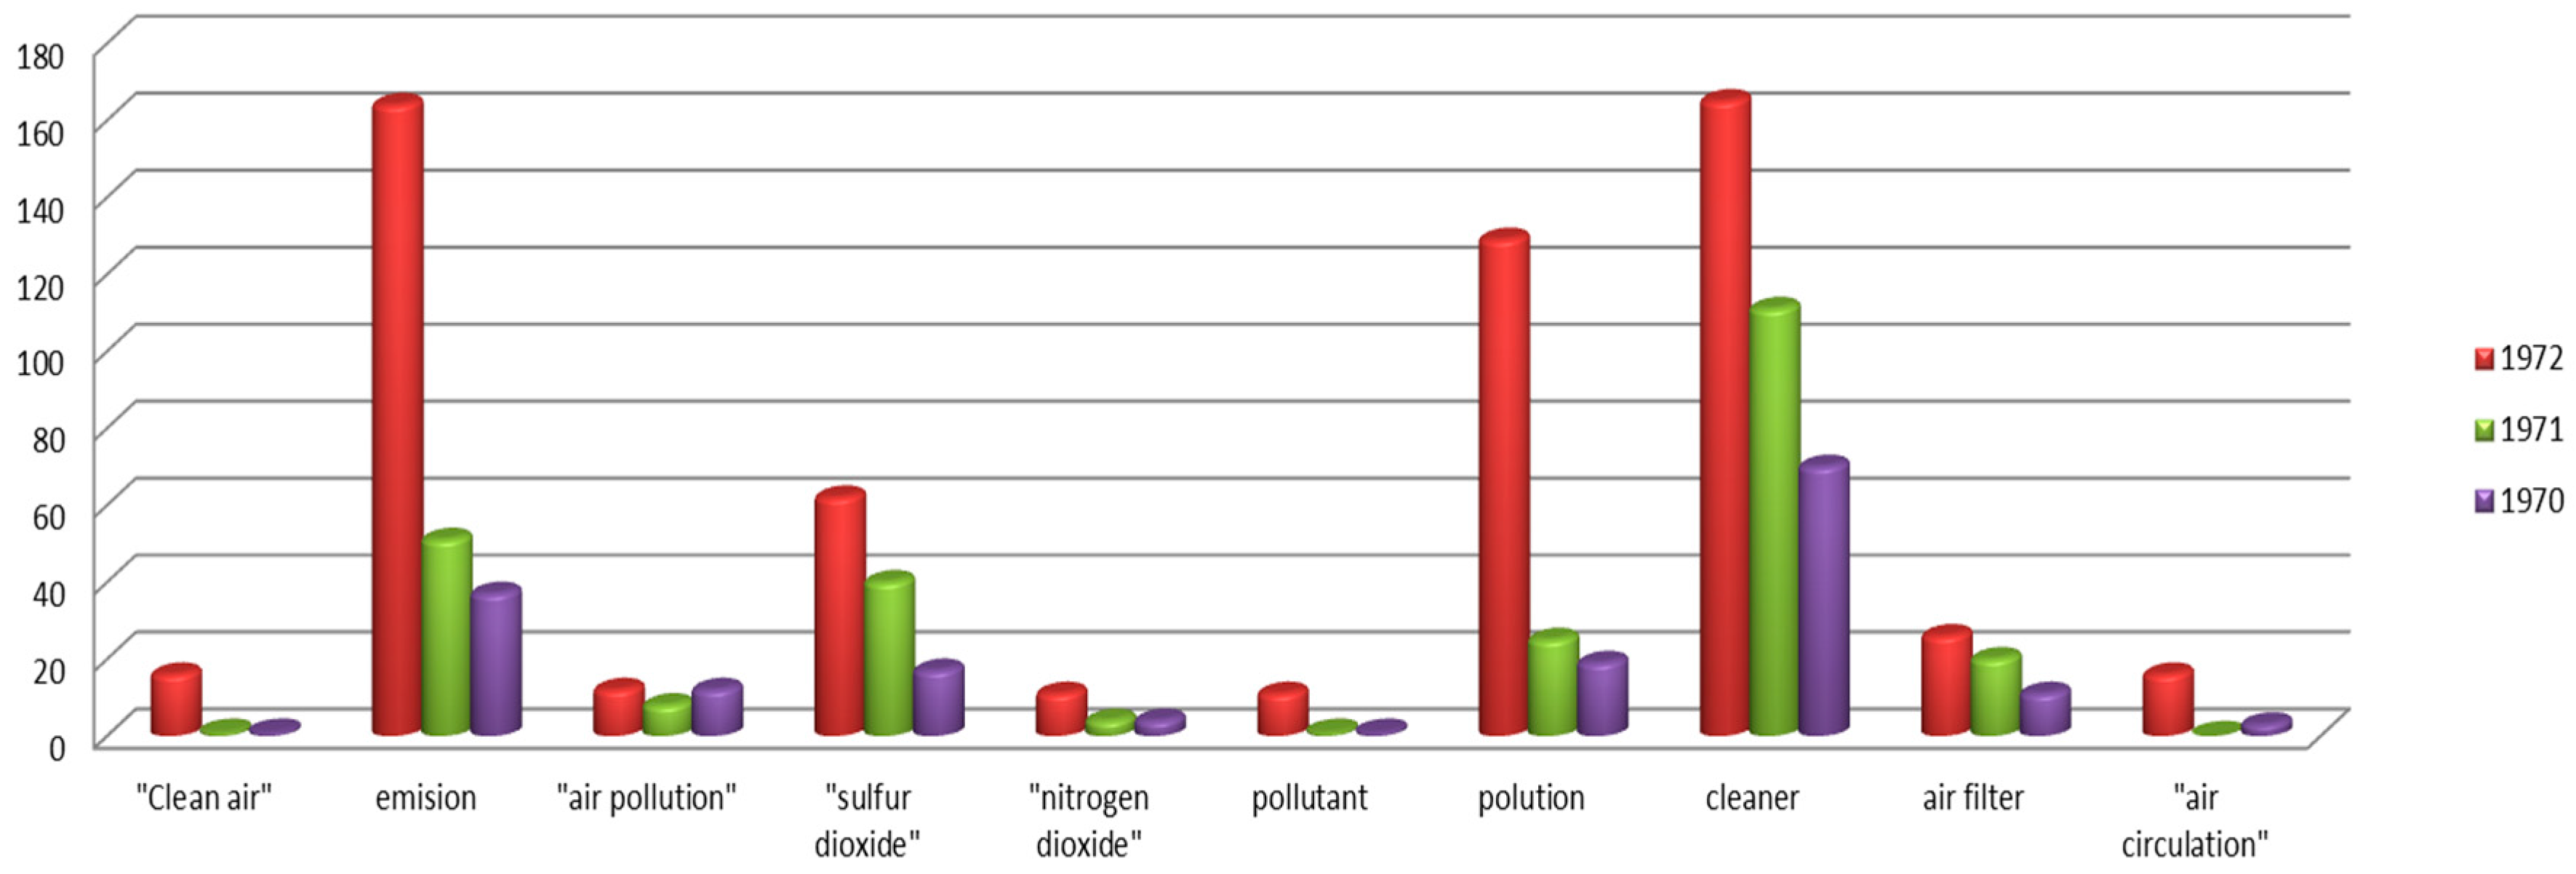
After a quick review of the history of the chemical industry, it has been seen that the Environmental Protection Agency was established in 1970 and thereby several government regulations entered into force. The year 1970 is accepted as a key year in the consciousness of American public with the enactment of 1970 about the Clean Air Act [19]. The impacts of the change in patenting activities appeared two years later, while publication generally takes approximately 18 months for a patent application [33]. A search query in the texts of the granted patents has provided significant support for the hypothesis. The following search terms were queried from the database of ESPACENET, for finding corresponding patent counts for the years 1971, 1972, and 1973:
- “clean air”
- “emission”
- “air pollution”
- “sulfur dioxide”
- “nitrogen dioxide”
- “pollutant”
- “pollution”
- “cleaner”
- “air filter”
- “air circulation”
As illustrated in Figure 3, there was a significant increase in the number of patents including the terms listed in the year 1972 (red colored bars). These terms were searched in the titles, abstract, and the keywords of the patents. The most significant increase has been on the patents related to the “emission” term. There was approximately a 200% increase in the patents that consider “emission”. “Pollution” related patents had also increased considerably.
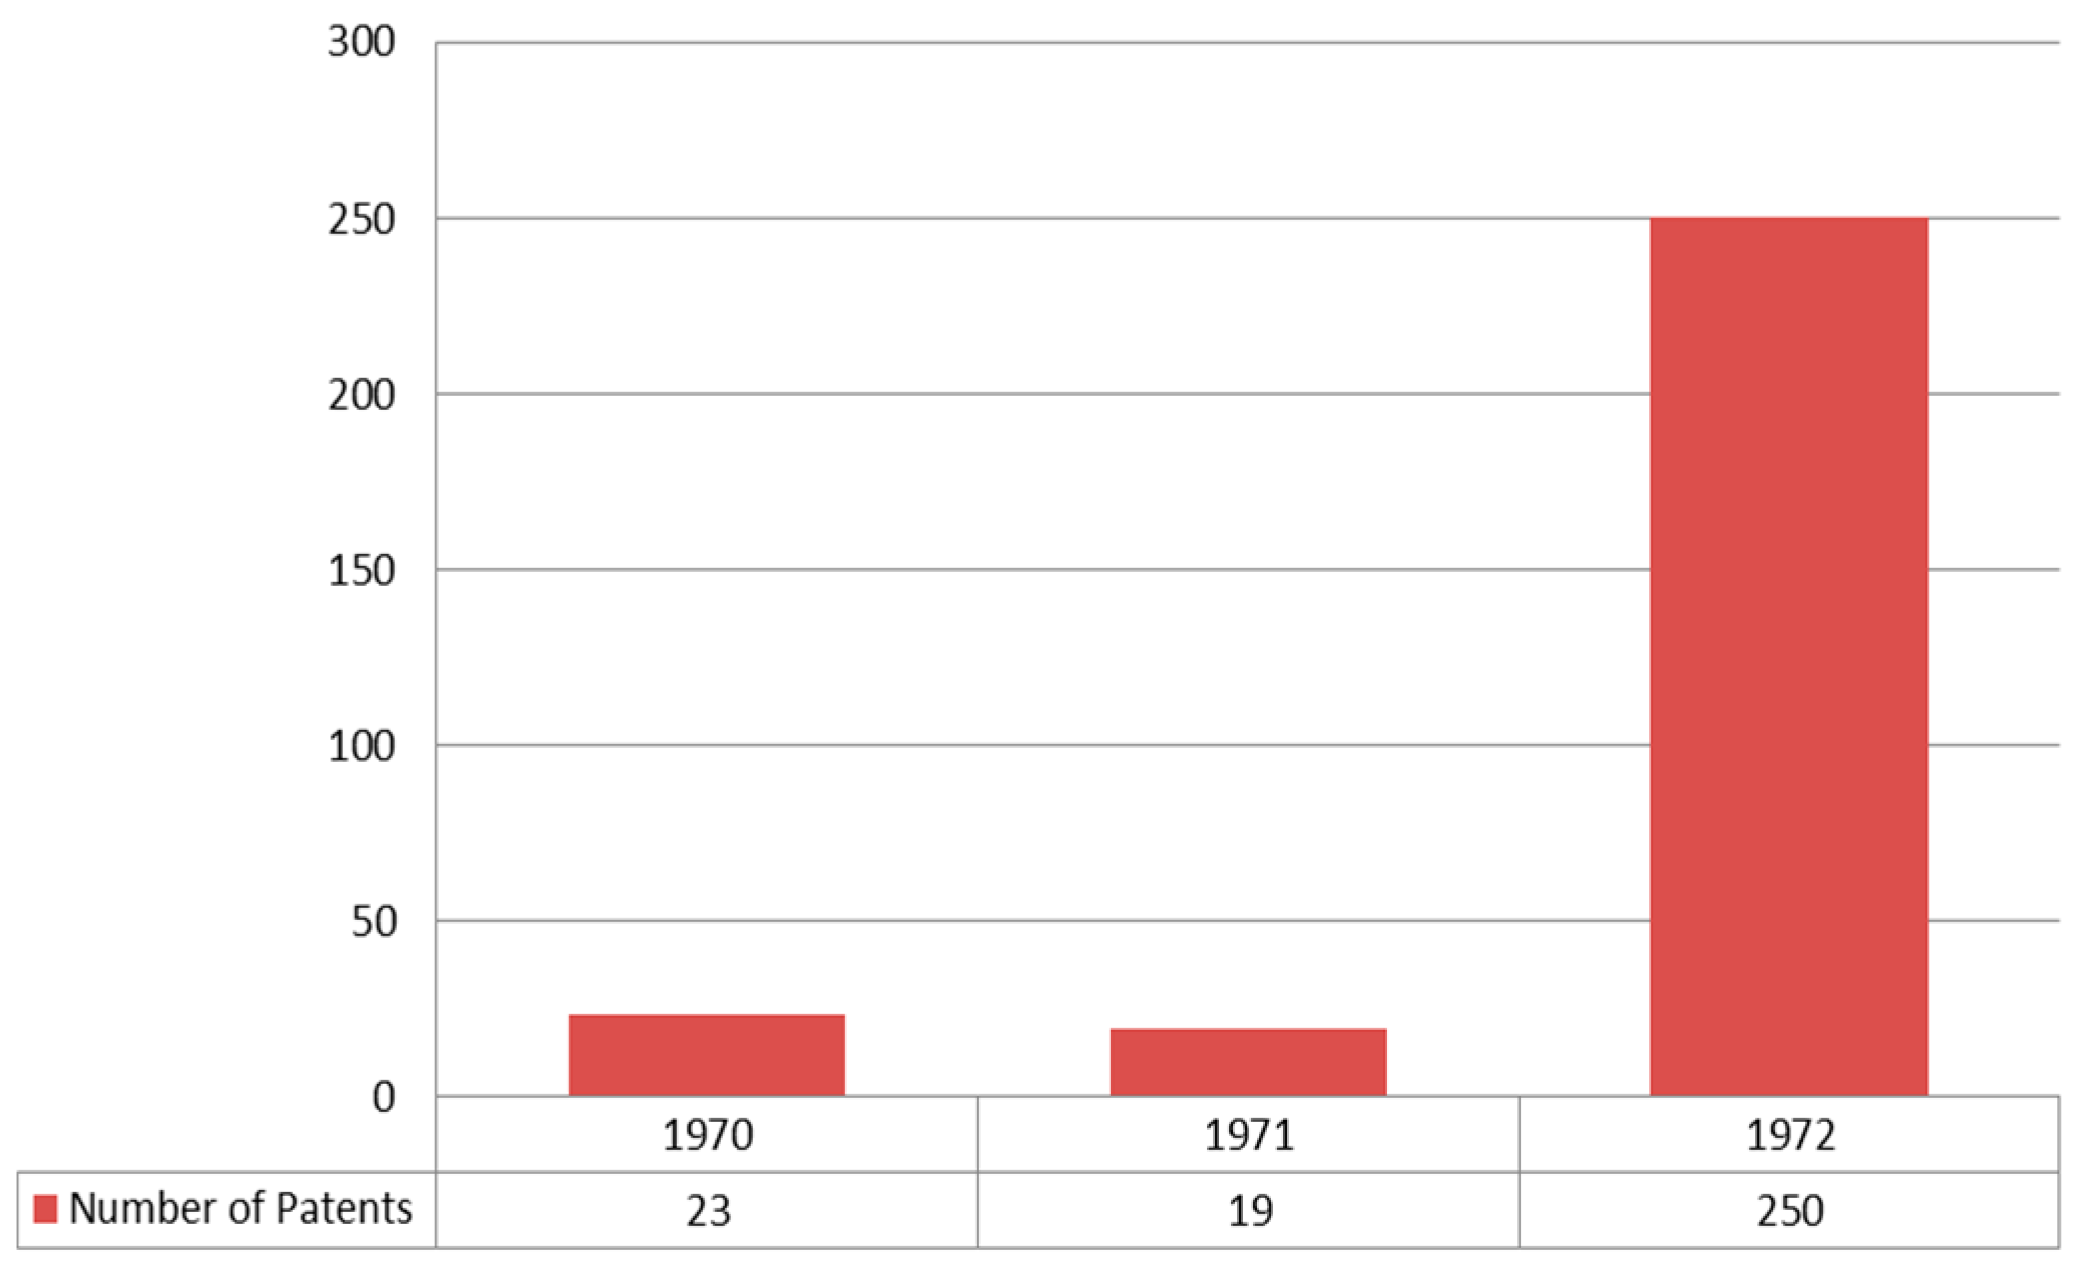
Another considerable issue is the increased number of patents including “air” in their titles/abstract or the keywords in the chemical category. As illustrated in Figure 4, the number of patents increased to 250 from 19 which had a relation with “air”.
5. Discussion
Policy changes may have direct and indirect impacts on the public. New policies and regulations force firms to adapt to the emerging environment accordingly. This adoption is crucial to the survival of the firms. The ones that cannot adapt themselves may face penalties/sanctions and/or may lose their share in the market while customers will be demanding more sustainable products. Technologies that are employed in raw material production are expected to be seriously affected by these changes. In this respect, R&D plans of firms may need major changes while some certain results are expected by the authorities and the customers.
While patents are a good indicator of technological change, effects of policy changes can be seen through the analysis of patent counts. Although there are studies focusing on the effects of regulations on the patenting activities, in most of those studies, any increase in the number of patents is accepted as an effect of policy. However, an increase in the number of patents may be very common due to several factors (such as increasing population, increasing number of scientists, increasing awareness about intellectual properties, etc.). Therefore, the methodology proposed in this paper attempts to distinguish the common change from an uncommon one. In this respect, the ARIMA model attempts to explain the actual patterning of change as a function of time and then outliers are marked to see abnormal change.
This study aimed to associate the impact of CAA on the rate of patenting in the chemical industry. An ARIMA model was fitted to describe the natural/common patterning of patenting activities in chemistry. With the Dixon’s r22 Ratio Test, the number of patents belonging to the year 1972 was detected to be a significant outlier and it was matched with the Clean Air Act (CAA) that regulates the emissions of hazardous air pollutants to protect public health and public welfare in the U.S.A. Content queries have proven that there is a considerable increase in the patents of chemistry which employed the sustainability relevant terms (air, emission, pollution, etc.) into consideration.
It can be concluded that companies in the chemistry industry adapted themselves very rapidly. They also wanted to protect their inventions as patents. This can be associated with the potential commercial potential of their inventions. In this regard, the CAA has been an important incentive to create novel technologies. Some major regulatory changes in the future may also provide new opportunities for firms if they can respond quickly.
Similar significant changes for different area focus may also be sought in future studies. The proposed method is simple and clear and a wide range of complex policy changes can be assessed.
5.1. Lessons Learned
Technology forecasting studies in the literature attempt to fit a curve that is capable of explaining the corresponding changes in the number of patents. However, these curves are not perfect and they cannot explain the change fully. As a consequence, there is a 'forecasting competition” [47] among the scientists to create better models producing less bias. While these models can describe the changes that are on the fitted curve, these detectable changes can be categorized as predictable changes. Predictable changes may be an indicator of the evolution of a technology (incremental change) over time. On the other hand, just one data point (outlier) can seriously affect the accuracy of the model and this may mislead analysts. The proposed approach suggested testing of outlier values and considering them as unpredicted change. In this respect, the first lesson learned can be summarized as below:
Lesson 1: Outlier values should be considered before or after modeling attempts to create robust and valid models.
The outlier data indicates a different/uncommon change that cannot be explained with the existing curves. There may be two types of outliers which correspond to an abnormal increase or an abnormal decrease in the number of patents for a certain industry or technology field. These outliers require further attention and action while they can be signals of emergence or saturation/death of some certain technologies. These considerable changes may be very critical for the survival of the firms. In this respect, the second lesson learned can be summarized as below:
Lesson 2: Technological change should be understood and conceptualized. An outlier value detected by the proposed algorithm may indicate a considerable change in the relevant area and it should provoke managers to think about the reasons behind this significant change.
The second lesson indicates several strategic revisions as listed below:
- Revision of the decision on staying in the market: A change that is indicating the death of a technology often means the death of a business. On the other hand, a timely exit from a business may avoid several financial burdens. If a decision is made to stay in the market, some of the following can be considered.
- Revision of R&D plans: “Technology assessment” plays a fundamental role in the planning phases of the companies [48]. If possible, R&D efforts should be directed/prioritized according to changes in customer needs or legislative issues. Some major regulatory changes may provide new opportunities for firms if their R&D strategy can be directed quickly. New products or services can be developed and commercialized.
- Revision of capital investment plans: Companies with capital investment plans should revise their plans accordingly. If there is no other way to survive, companies may consider new technology investments or R&D investments.
5.2. Limitations and Directions for Future
Although this study has presented the significant role of outliers in technology forecasting, it also has certain limitations. One of the limitations has been the lack of data for the last few years. The United States Patent Trademark Office (USPTO) has discontinued providing industry specific data. Another limitation has been ignorance other factors that may affect the patenting activities. In this respect, studies can be conducted to measure other impacts.
Although patents are known to be a useful [31], their use has also limitations. Obviously, all the inventions are not patented [49]. Patents are usually regarded as more important in high-tech industries than in lower-tech industries [21]. On the other hand, all patented technologies may not be successfully commercialized and their effect on the society may be limited. In future studies, the presented approach can also be adapted for identifying uncommon changes in journal/conference papers or/and patent citations.
Acknowledgments
The author would like to thank the four anonymous reviewers of this journal.
Conflicts of Interest
The author declares no conflict of interest.
References
- Speight, J.G. Industrial Organic Chemistry. In Environmental Organic Chemistry for Engineers; Butterworth-Heinemann: Oxford, UK, 2017; pp. 87–151. [Google Scholar]
- Blum, C.; Bunke, D.; Hungsberg, M.; Roelofs, E.; Joas, A.; Joas, R.; Blepp, M.; Stolzenberg, H.C. The concept of sustainable chemistry: Key drivers for the transition towards sustainable development. Sustain. Chem. Pharm. 2017. [Google Scholar] [CrossRef]
- Nelson, A.; Earle, A.; Howard-Grenville, J.; Haack, J.; Young, D. Do innovation measures actually measure innovation? Obliteration, symbolic adoption, and other finicky challenges in tracking innovation diffusion. Res. Policy 2014, 43, 927–940. [Google Scholar] [CrossRef]
- Warner, J.C.; Cannon, A.S.; Dye, K.M. Green chemistry. Environ. Impact Assess. Rev. 2004, 24, 775–799. [Google Scholar] [CrossRef]
- Yost, E.E.; Stanek, J.; Burgoon, L.D. A decision analysis framework for estimating the potential hazards for drinking water resources of chemicals used in hydraulic fracturing fluids. Sci. Total Environ. 2017, 574, 1544–1558. [Google Scholar] [CrossRef] [PubMed]
- Foteinis, S.; Tsoutsos, T. Strategies to improve sustainability and offset the initial high capital expenditure of wave energy converters (WECs). Renew. Sustain. Energy Rev. 2017, 70, 775–785. [Google Scholar] [CrossRef]
- Davidson, J.; Norbeck, J.M. Federal Leadership in Clean Air Act Implementation: The Role of the Environmental Protection Agency. In An Interactive History of the Clean Air Act; Elsevier: Oxford, UK, 2012; pp. 19–40. [Google Scholar]
- Alonso, R.; Snyder, S.Y. With Victory on Cross State Air Pollution Rule, EPA Continues Campaign Against Coal. Electr. J. 2014, 27, 88–89. [Google Scholar] [CrossRef]
- Epstein, M.J.; Roy, M.-J. Sustainability in Action: Identifying and Measuring the Key Performance Drivers. Long Range Plann. 2001, 34, 585–604. [Google Scholar] [CrossRef]
- Hezri, A.A.; Dovers, S.R. Sustainability indicators, policy and governance: Issues for ecological economics. Ecol. Econ. 2006, 60, 86–99. [Google Scholar] [CrossRef]
- Ross, K.; Chmiel, J.F.; Ferkol, T. The Impact of the Clean Air Act. J. Pediatr. 2012, 161, 781–786. [Google Scholar] [CrossRef] [PubMed]
- Petersen, G.; Munthe, J.; Pleijel, K.; Bloxam, R.; Kumar, A.V. A comprehensive Eulerian modeling framework for airborne mercury species: Development and testing of the Tropospheric Chemistry module (TCM). Atmos. Environ. 1998, 32, 829–843. [Google Scholar] [CrossRef]
- Gerard, D.; Lave, L.B. Implementing technology-forcing policies: The 1970 Clean Air Act Amendments and the introduction of advanced automotive emissions controls in the United States. Technol. Forecast. Soc. Chang. 2005, 72, 761–778. [Google Scholar] [CrossRef]
- Kemp, R. Environmental Policy and Technical Change: A Comparison of the Technological Impact of Policy Instruments; Edward Elgar: Cheltenham, UK, 1997. [Google Scholar]
- Popp, D. Lessons from patents: Using patents to measure technological change in environmental models. Ecol. Econ. 2005, 54, 209–226. [Google Scholar] [CrossRef]
- Chakravorty, U.; Roumasset, J.; Tse, K. Endogenous Substitution among Energy Resources and Global Warming. J. Political Econ. 1997, 105, 1201–1234. [Google Scholar] [CrossRef]
- Lee, J.; Veloso, F.M.; Hounshell, D.A. Linking induced technological change, and environmental regulation: Evidence from patenting in the U.S. auto industry. Res. Policy 2011, 40, 1240–1252. [Google Scholar] [CrossRef]
- Mundaca, L.; Luth Richter, J. Assessing “green energy economy” stimulus packages: Evidence from the U.S. programs targeting renewable energy. Renew. Sustain. Energy Rev. 2015, 42, 1174–1186. [Google Scholar] [CrossRef]
- Paul, R. EPA History: The Clean Air Act of 1970; EPA: Washington, DC, USA, 1990.
- Nameroff, T.J.; Garant, R.J.; Albert, M.B. Adoption of green chemistry: An analysis based on US patents. Res. Policy 2004, 33, 959–974. [Google Scholar] [CrossRef]
- Lee, B.; Won, D.; Park, J.-H.; Kwon, L.; Moon, Y.-H.; Kim, H.-J. Patent-Enhancing Strategies by Industry in Korea Using a Data Envelopment Analysis. Sustainability 2016, 8, 901. [Google Scholar] [CrossRef]
- Choi, J.; Hwang, Y.-S. Patent keyword network analysis for improving technology development efficiency. Technol. Forecast. Soc. Chang. 2014, 83, 170–182. [Google Scholar] [CrossRef]
- Fabry, B.; Ernst, H.; Langholz, J.; Köster, M. Patent portfolio analysis as a useful tool for identifying R&D and business opportunities—An empirical application in the nutrition and health industry. World Pat. Inf. 2006, 28, 215–225. [Google Scholar]
- Dereli, T.; Durmusoglu, A. Alerting Companies through on-Line Patent Trend Analysis. Cybern. Syst. 2010, 41, 371–390. [Google Scholar] [CrossRef]
- Daim, T.; Iskin, I.; Li, X.; Zielsdorff, C.; Bayraktaroglu, A.E.; Dereli, T.; Durmusoglu, A. Patent analysis of wind energy technology using the patent alert system. World Pat. Inf. 2012, 34, 37–47. [Google Scholar] [CrossRef]
- Yoon, B.; Lee, S. Patent analysis for technology forecasting: Sector-specific applications. In Proceedings of the 2008 IEEE International Engineering Management Conference, Estoril, Portugal, 28–30 June 2008; pp. 1–5. [Google Scholar]
- Curran, C.-S.; Leker, J. Patent indicators for monitoring convergence—Examples from NFF and ICT. Technol. Forecast. Soc. Chang. 2011, 78, 256–273. [Google Scholar] [CrossRef]
- Campbell, R.S. Patent trends as a technological forecasting tool. World Pat. Inf. 1983, 5, 137–143. [Google Scholar] [CrossRef]
- Lee, K.; Lee, S. Patterns of technological innovation and evolution in the energy sector: A patent-based approach. Energy Policy 2013, 59, 415–432. [Google Scholar] [CrossRef]
- Grimaldi, M.; Cricelli, L.; Di Giovanni, M.; Rogo, F. The patent portfolio value analysis: A new framework to leverage patent information for strategic technology planning. Technol. Forecast. Soc. Chang. 2015, 94, 286–302. [Google Scholar] [CrossRef]
- Ernst, H. Patent portfolios for strategic R&D planning. J. Eng. Technol. Manag. 1998, 15, 279–308. [Google Scholar]
- Choi, S.; Park, H. Investigation of Strategic Changes Using Patent Co-Inventor Network Analysis: The Case of Samsung Electronics. Sustainability 2016, 8, 1315. [Google Scholar] [CrossRef]
- Oh, Y.; Yoon, J.; Lee, J.-D. Evolutionary Patterns of Renewable Energy Technology Development in East Asia (1990–2010). Sustainability 2016, 8, 721. [Google Scholar] [CrossRef]
- Kim, S.; Jang, D.; Jun, S.; Park, S. A Novel Forecasting Methodology for Sustainable Management of Defense Technology. Sustainability 2015, 7, 16720–16736. [Google Scholar] [CrossRef]
- Choi, J.; Jang, D.; Jun, S.; Park, S. A Predictive Model of Technology Transfer Using Patent Analysis. Sustainability 2015, 7, 16175–16195. [Google Scholar] [CrossRef]
- Jeong, B.; Yoon, J. Competitive Intelligence Analysis of Augmented Reality Technology Using Patent Information. Sustainability 2017, 9, 497. [Google Scholar] [CrossRef]
- Choi, J.; Jun, S.; Park, S. A Patent Analysis for Sustainable Technology Management. Sustainability 2016, 8, 688. [Google Scholar] [CrossRef]
- Andersson, B.A.; Jacobsson, S. Monitoring and assessing technology choice: The case of solar cells. Energy Policy 2000, 28, 1037–1049. [Google Scholar] [CrossRef]
- Hall, B.H.; Helmers, C. Innovation and diffusion of clean/green technology: Can patent commons help? J. Environ. Econ. Manag. 2013, 66, 33–51. [Google Scholar] [CrossRef]
- Marinova, D.; McAleer, M. Modelling trends and volatility in ecological patents in the USA. Environ. Model. Softw. 2003, 18, 195–203. [Google Scholar] [CrossRef]
- Nikolopoulos, K.; Buxton, S.; Khammash, M.; Stern, P. Forecasting branded and generic pharmaceuticals. Int. J. Forecast. 2016, 32, 344–357. [Google Scholar] [CrossRef]
- Hidalgo, A.; Gabaly, S. Use of prediction methods for patent and trademark applications in Spain. World Pat. Inf. 2012, 34, 19–29. [Google Scholar] [CrossRef]
- Havermans, Q.A.; Gabaly, S.; Hidalgo, A. Forecasting European trade mark and design filings: An innovative approach including exogenous variables and IP offices’ events. World Pat. Inf. 2017, 48, 96–108. [Google Scholar] [CrossRef]
- Hidalgo, A.; Gabaly, S. Optimization of prediction methods for patents and trademarks in Spain through the use of exogenous variables. World Pat. Inf. 2013, 35, 130–140. [Google Scholar] [CrossRef]
- Babai, M.Z.; Ali, M.M.; Boylan, J.E.; Syntetos, A.A. Forecasting and inventory performance in a two-stage supply chain with ARIMA(0,1,1) demand: Theory and empirical analysis. Int. J. Prod. Econ. 2013, 143, 463–471. [Google Scholar] [CrossRef]
- Efstathiou, C.E. Estimation of type I error probability from experimental Dixon’s “Q” parameter on testing for outliers within small size data sets. Talanta 2006, 69, 1068–1071. [Google Scholar] [CrossRef] [PubMed]
- Makridakis, S.; Andersen, A.; Carbone, R.; Fildes, R.; Hibon, M.; Lewandowski, R.; Newton, J.; Parzen, E.; Winkler, R. The accuracy of extrapolation (time series) methods: Results of a forecasting competition. J. Forecast. 1982, 1, 111–153. [Google Scholar] [CrossRef]
- Nosella, A.; Petroni, G.; Salandra, R. Technological change and technology monitoring process: Evidence from four Italian case studies. J. Eng. Technol. Manag. 2008, 25, 321–337. [Google Scholar] [CrossRef]
- Markatou, M.; Vetsikas, A. Innovation and Crisis: An Analysis of its Impact on the Greek Patenting Activity. Procedia Soc. Behav. Sci. 2015, 195, 123–132. [Google Scholar] [CrossRef]
Figure 1.
Number of utility patents granted by USPTO in chemicals category.
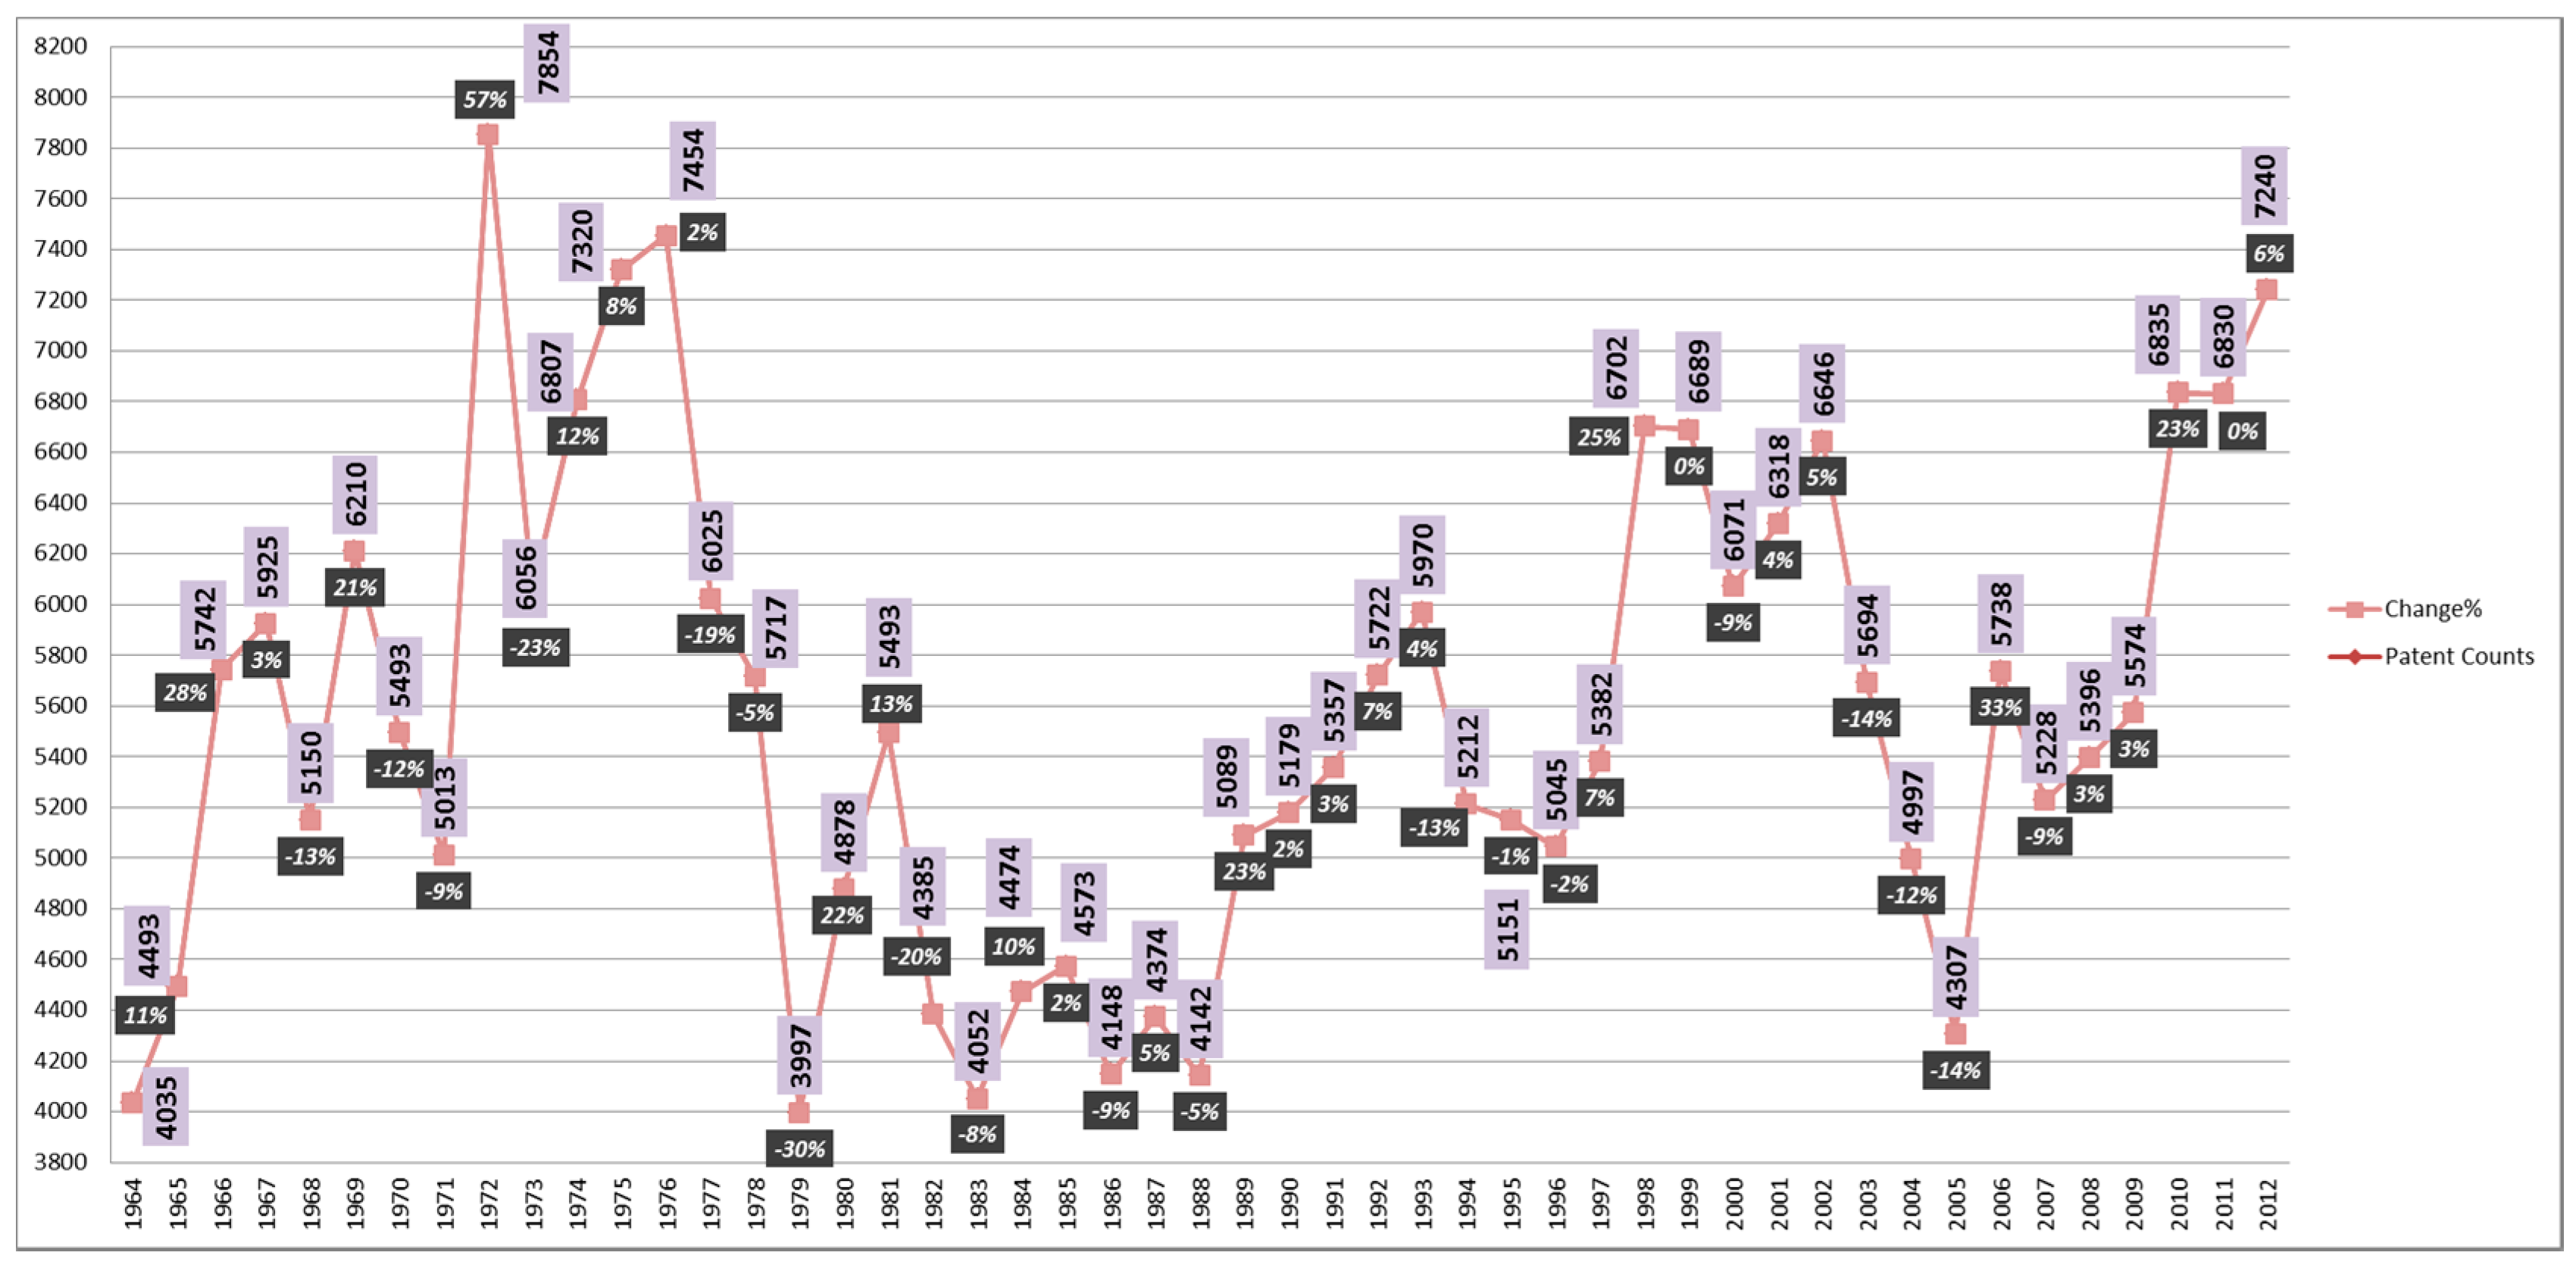
Figure 2.
ARIMA model created for time series.

Figure 3.
Number of patents with respect to selected keyword.

Figure 4.
Number of patents having “air” in their abstract, title or keywords.


Table 1.
Results of the outlier detection test.
| Null hypothesis: | All data values come from the same normal population |
| Alternative hypothesis: | Smallest or largest data value is an outlier |
| Significance level: | α = 0.1 |
| Test Name: | Dixon’s r22 Ratio Test |
| Variable: | N Min x[2] x[3] x[N-2] x[N-1] Max r22 P |
| Residuals: | 49 −1962 −1314 −1008 1369 1410 2637 0.35 0.05 |
| Number of Patents: | 49 3997 4035 4052 7320 7454 7854 0.14 1.00 * x[i] denotes the i-th smallest observation. |
| Outlier Variable/Value: | Residuals Year: 1972 Value: 2637.31 |
© 2017 by the author. Licensee MDPI, Basel, Switzerland. This article is an open access article distributed under the terms and conditions of the Creative Commons Attribution (CC BY) license (http://creativecommons.org/licenses/by/4.0/).
Share and Cite
MDPI and ACS Style
Durmuşoğlu, A. Effects of Clean Air Act on Patenting Activities in Chemical Industry: Learning from Past Experiences. Sustainability 2017, 9, 862. https://doi.org/10.3390/su9050862
AMA Style
Durmuşoğlu A. Effects of Clean Air Act on Patenting Activities in Chemical Industry: Learning from Past Experiences. Sustainability. 2017; 9(5):862. https://doi.org/10.3390/su9050862
Chicago/Turabian StyleDurmuşoğlu, Alptekin. 2017. "Effects of Clean Air Act on Patenting Activities in Chemical Industry: Learning from Past Experiences" Sustainability 9, no. 5: 862. https://doi.org/10.3390/su9050862
Note that from the first issue of 2016, this journal uses article numbers instead of page numbers. See further details here.