1. Introduction
The energy system has developed a wide variety of clean energy solutions. Due to the high cost of emerging technologies, compared with the established ones, most of the emerging power technology is still in the R&D and demonstration phases; thus, it is not achieving large-scale commercial applications in the market. As a result, power technology cost modelling has become a research focus and hotspot that promotes the development of these technologies. First, in the power technology research, we should clarify the technical change trend and then prioritize the development order of technology by implementing the corresponding policies or measures to promote rapid development.
Currently, the main method to acquire information about changes in research and technology is the learning curve, which is used to study aircraft manufacturing technology at the earliest release. The Boston Consulting Group applied a learning curve to management science studies and related fields in 1968. In the 1970s, the learning curve model was gradually applied to the field of energy technology, and its original form was the single-factor equation [
1]. Technological learning rates represented the quantitative relationships, between the cumulative production and technology costs reduction, which better reflected the endogenous changes in technology. The learning rate is associated with the rate of decline of technology costs within a certain period. Along with the deepening and development of the research, some researchers believed that the single-factor learning curve for energy technology had big limitations. Ref. [
2] only considered the extent of demand for the technological learning progress based on the single-factor learning curve, without consideration of the impacts of supply, leading to a certain degree of deviation about learning rate forecasts. Ref. [
3] studied wind power technology by an alternate learning curve model, and thought that the learning rate, predicted by the single-factor learning curve model, was extremely sensitive to statistics and explanatory variables, which means cautious when using this model. In recent years, the study of the learning curve has been extended from single-factor equations to two-factor equations, which considered the effect of learning by researching. Ref. [
4] first put forward that the cumulative R&D and production were two factors driving the technological cost reduction. Refs. [
5,
6,
7,
8] measured the learning rate of energy technology and power generation technology via a two-factor learning curve, and analyzed the technology cost trends by learning from experience and R&D. Through in-depth analysis of these case studies, the learning rate of “learn by researching” was more than the corresponding vector of “learn by doing”. This study demonstrated that strengthening R&D investments was more helpful to improving technical performance, with respect to increasing the use of technology, while some researchers believe that the single-factor equation missed an important variable named R&D investment, by comparing the estimation learning rate of single-factor and two-factor equations, so the learning rate of “learn by doing” was overestimated, causing information distortion in a certain degree.
Foreign studies have shown that the investment cost of wind power gradually declined with the accumulation of knowledge and experience. The development of wind power technology was in line with the learning curve model [
9]. In addition, the development of photovoltaic power generators and other new energy technologies was also in line with the learning curve model [
10,
11]. Therefore, the generic quantitative analysis of renewable energy technology was the learning curve model. Ref. [
12] analyzed wind turbines, solar photovoltaic modules and other renewable energy technology innovation solutions by using learning curves. The study found the likelihood of renewable energy technologies to reduce costs was much higher than traditional energy technologies. To make the wind power and PV power more economical, compared with the conventional power plant, it could take a large upfront investment. Government policy and other methods for achieving a significant decline in technology cost, and accelerated the promotion of renewable energy technologies. Ref. [
13] used the learning curve and the Grey Model (GM) (1, 1) method to predict the change trend of wind power cost, and analyzed the main factors affecting the wind turbines power efficiency, and put forward the corresponding wind power pricing schemes.
In China, the learning curve research of energy technology also had a certain degree of accumulation. Ref. [
14] used the learning curve and the GM (1, 1) model and analyzed the investment cost change trend of wind power in China. Ref. [
15,
16] used the learning curve model to compare the wind power cost in the condition of constant learning rate and changed the learning rate in stages. Ref. [
17] analyzed the timing and scale prediction of wind power and PV power accessed via a smart grid based on the learning curve. Ref. [
18] adopted the learning curve model to calculate the technological learning rate based on the different lowest price scenarios of PV components, and analyzed the relationship between the learning rate and the lowest price. Ref. [
19] established the two-factor learning curve model for solar PV power generation technology, based on the Wright basic learning curve, and deeply analyzed the cumulative production and cumulative R&D investment influenced on the power generation cost of solar PV. Refs. [
20,
21] made the endogenous technology learning module, coupled to the energy system optimization model MARKAL, and researched sustainable energy development and utilization in the western China. Ref. [
22] studied the development path and emission reduction cost of wind power and carbon capture technology based on the learning curve, and discussed the two types of technology that could instigate market competition and the emission reduction potential and cost. Ref. [
23] constructed the single-factor learning curve model to estimate the learning rate of unconventional oil and gas technology in the different paths of “production capacity accumulation” and “technological innovation breakthrough”.
In the last ten years, the energy and the environment policy formed important incentives and constraints to improve technological progress, and the policy makers and researchers gradually began to study the quantitative relationship between the technological progress and the energy policy. The promotion of energy technologies should meet certain laws. Ref. [
24] thinks that the promotion of global technologies follows two laws, one of the laws being that the new technology transforms from the available phase (production to 1000 terajoules (TJ)) to the mature phase (1% of the total energy supply) with an annual average growth rate of 26% in about 30 years, the other being that when the technology has become mature, it begins to increase in a slow linear way. They also pointed out that the technologies always need R&D and demonstration projects by the government before the technologies reach a certain scale, and then the technology costs will become even more important and the government should support the technologies by the market mechanism, until the costs are reduced to the extent that they can compete with other technologies. In related research areas, economists put forth many useful theories and research methods, such as R&D incentive theory [
25,
26,
27], external analysis and measurement of the research process [
28,
29], measurement of the innovation input and output [
30,
31], new technology diffusion [
32,
33], analysis and measurement of the productivity growth [
34,
35], structure effect of the innovation market [
36,
37], economic effect of public research funds [
38], the status of technological progress in endogenous macro-economic growth [
39,
40], etc. In China, domestic research was relatively weak. Ref. [
41] discussed the optimal policy design framework, which mixed the energy-environment policy and technological progress. Ref. [
42] quantitatively analyzed the relationship between biomass power generation policy and learning rate by setting the different policy scenarios. Ref. [
43] studied the endogenous changes of new energy technologies under the emission reduction policies. Ref. [
44] researched the impact of s subsidy policy on the cost evolution and technology diffusion of carbon capture and storage technology based on the integrated model of China's Energy-Economy-Endogenous Technology.
In summary, at home and abroad, the quantitative research on energy technology innovation mainly focused on the learning curve parameters. The technical classification was more detailed, and the technical detail was more specific. However, the relationship study between energy policy and technological innovation was relatively small. Therefore, the future developing direction of this field will focus on the quantitative relationship between different types of energy policy and different developmental stages, and the interaction of energy policy and learning effects caused by technological progress, and the energy policy variables endogenous in the technology learning and concerning on the policy benefits.
The remainder of the paper will be organized as follows.
Section 2 will present the factors analysis and selection of learning curve model.
Section 3 will analyze the dynamic path of cost changes for power technology.
Section 4 will construct the dynamic two-factor learning curve model.
Section 5 will forecast the main power technology learning rate and unit investment cost.
Section 6 will present the study’s conclusions.
2. Factors Analysis and Selection of Learning Curve Model
The independent variable of a single-factor learning curve model is cumulative production, and all factors are expressed by cumulative production. From a statistical point of view, we can derive the relationship between the cumulative production and unit investment cost by regression analysis. However, the single-factor learning curve model did not consider R&D as a factor, thus affecting the cost of energy technology. First, since the model contains only one explanatory variable (cumulative production), it is easy to estimate by “learning by doing” since the efficiency too large in comparison. Based on the research results, it is difficult to obtain the scientific policy guidance and advice about R&D. Second, the cumulative R&D investment and cumulative production are two independent variables; it is difficult to reflect the change of cumulative R&D investment from the cumulative production. Therefore, the single-factor learning curve model that ignoring the R&D factor cannot explain the cost change of energy technology scientifically and there are some limitations.
A two-factor learning curve model, based on a single-factor model, considers the impact of R&D factor on the cost change of energy technology, and to a certain extent, it makes up the shortcomings of the single-factor model. The learning curve model can better describe the development of energy technologies, and explain the phenomenon of the cost-change before the promotion and application of the new energy technology. In addition, due to the inclusion of both cumulative R&D investments and cumulative productions, the conclusions can be used to formulate the new energy R&D program and industrial policy.
A three-factor learning curve model considers cumulative production, cumulative R&D investment and scale effects as three arguments to describe the cost rule of energy technology. In the research, the scale effects are characterized via the unit energy conversion, the mainstream type and unit production of device in a period, such as unit capacity of wind power, developed from 300 kW, 500 kW, 1 MW, 2 MW and other unit scales. The expansion of unit scales can bring down the average cost to a certain extent, but from the root causes and work pattern analysis, it is difficult to consider the scale effects to be an independent variable. In a certain period, the development of unit production and mainstream type is closely related to the R&D (learn by researching). The learning effects produced by the expansion of unit scale cannot be separated from the cumulative production factor (learn by doing). From the root causes of scaling variables, the expansion of the unit scale is driven under the influence of R&D. From the work pattern, the embodiment of the scale effect and cumulative production (learn by doing) are partially overlapping. Therefore, there is a problem that the scale factor has a larger correlation with “learn by doing” and “learn by researching” for three-factor learning curve models.
Four-factor learning curve model considers cumulative production, cumulative R&D investment, scale effects and changes of inputs price. These four arguments describe the cost rule of energy technology. The change of input price is a new variable. The inputs can be divided into the general inputs and key inputs. Among them, the change of general input price conforms to the historical level of inflation, so it can be corrected by the rate of inflation in statistics. In addition, the cost changes of key inputs are influenced by cumulative R&D investment, so the changes of inputs should be included in the factor of cumulative R&D investment.
For energy technology, government subsidy is also an important factor. Governments have adopted different forms of subsidies as the new energy technology support policies to accelerate the development of energy technologies. The subsidy cannot directly have an impact on the energy technology cost; however, it can accelerate the energy technologies into the R&D and production stage, and make the technology cost further reduce as soon as possible in the joint action of “learn by doing” and “learn by researching”. Since this paper focuses on the impact of factors directly on cost changes of energy technologies, and the government subsidy factors that affect the energy technology cost, through advancing the starting time of “learn by doing”. Therefore, the government subsidy will not bring in the study.
The research objective of this paper is wind power generation technology. According to the analysis above, various factors, combined the energy technology feature, the paper selects the independent variable. For the scale factor, it is relevant and overlapping with the cumulative installed capacity and cumulative R&D investment, thus, excluding the scale factor. For the changes of inputs price factor, some scholars have chosen silicon as the key raw material to research the cost changes for solar photovoltaic power generation technology, but several studies showed a negative phenomenon, the analysis displayed that the R&D factors had greater impact on the price changes of key raw materials (silicon). Thus, we see that the price changes of general inputs can be corrected by the rate of inflation over the years. If the key inputs associated with R&D, they should not be seen as independent factors but should be described by the cumulative R&D investment factors. Because the key inputs of energy technologies are all related to the R&D, the paper selected the cumulative installed capacity and cumulative R&D investment as the variables to research the dynamic cost changes of wind power technology.
3. Dynamic Path of Cost Changes for Power Technology
With the increasing cumulative installed capacity, the effect of “learn by doing” was continuous accumulation, and the production efficiency constantly improved, leading to the power technology cost falling. R&D upgraded the energy technologies, and often bought a breakthrough for cost reduction, such as the increasing unit capacity of wind power, which led to the increased production efficiency.
The dynamic evolution of power technology was working under various factors, and each generation of technology was accompanied and competed against. As upgrading technology, the ultimate path of cost changes for power technology was the cost interwoven within each generation technology. Not every generation of technology would be able to have the cost advantages at the early development stage. Under normal circumstances, the old technology was substituted and then exited the history stage, and the cost would not affect the cost evolution of this kind of power technology.
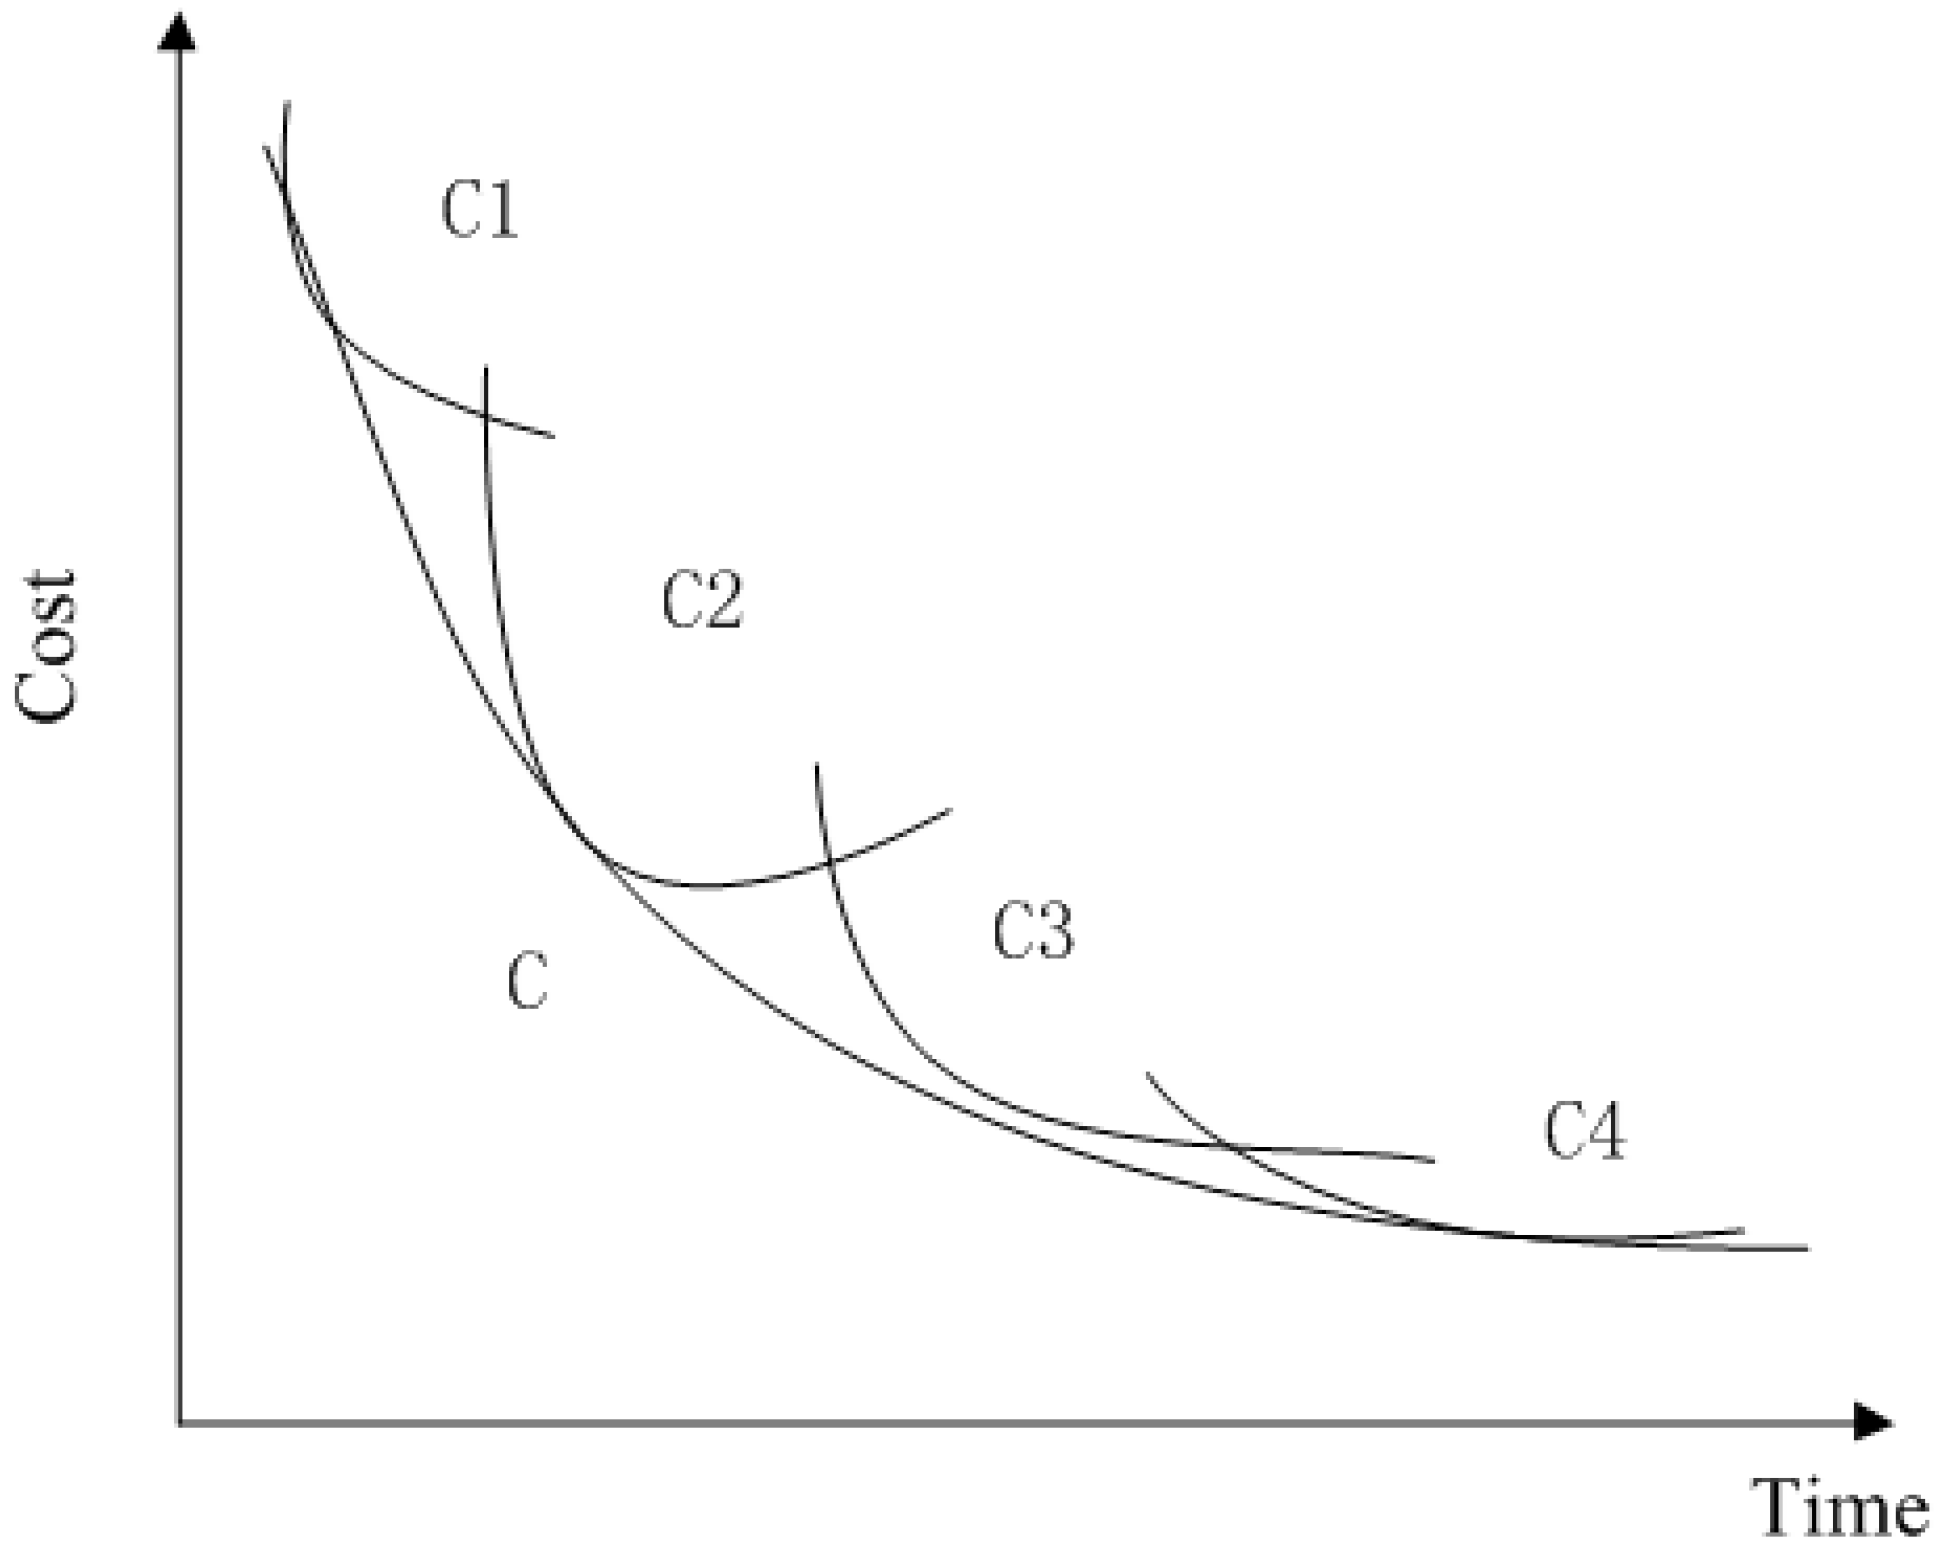
Figure 1 described the dynamic path of cost changes for power technology. Assume the power technology C had experienced technical upgrading four times, and C1, C2, C3, C4, respectively, described the cost of each generation technology. When C1 technology developed a certain stage, C2 technology appeared and its cost in the early development was higher than C1, but due to its advanced nature, the potential of cost reduction was bigger, and, in a moment, instead of C1 being mainstreamed, of C power technology. Similarly, C3 was replaced with C2 technology, and developed the more efficient technology in C4. Throughout the history of C technology, its cost changes were not arbitrarily generated (C1, C2, C3, C4) learning curves, but with the development and update, a comprehensive learning curve C was created.
In addition, several different development stages of the technology, the influence of the cumulative R&D investment and cumulative installed capacity to the technology cost was also dynamic. Technology Improvement Dynamics database (TIDdb) and International Energy Agent (IEA) calculated the cost. R&D investments and installed capacities for 17 kinds of energy technologies during 1971–1998. Due to the different development stage, the learning situation was also different for energy technologies. Among them, the wind power in this period transitioned from the R&D phase to the production phase, and the photovoltaic power was in the stage of R&D and production in parallel, and fuel cells were at the early R&D stage, the economic cost was higher and relied on a larger of R&D investment, which had not yet entered the production phase. The hydropower plant had been in the mature stage with large installed capacity and the economic cost was low. Therefore, in the different development stages of energy technologies, the various factors influenced on the cost change to present the structural characteristics, and there needed to be a leader to manage the learning curve model under different influencing factors for different development phases.
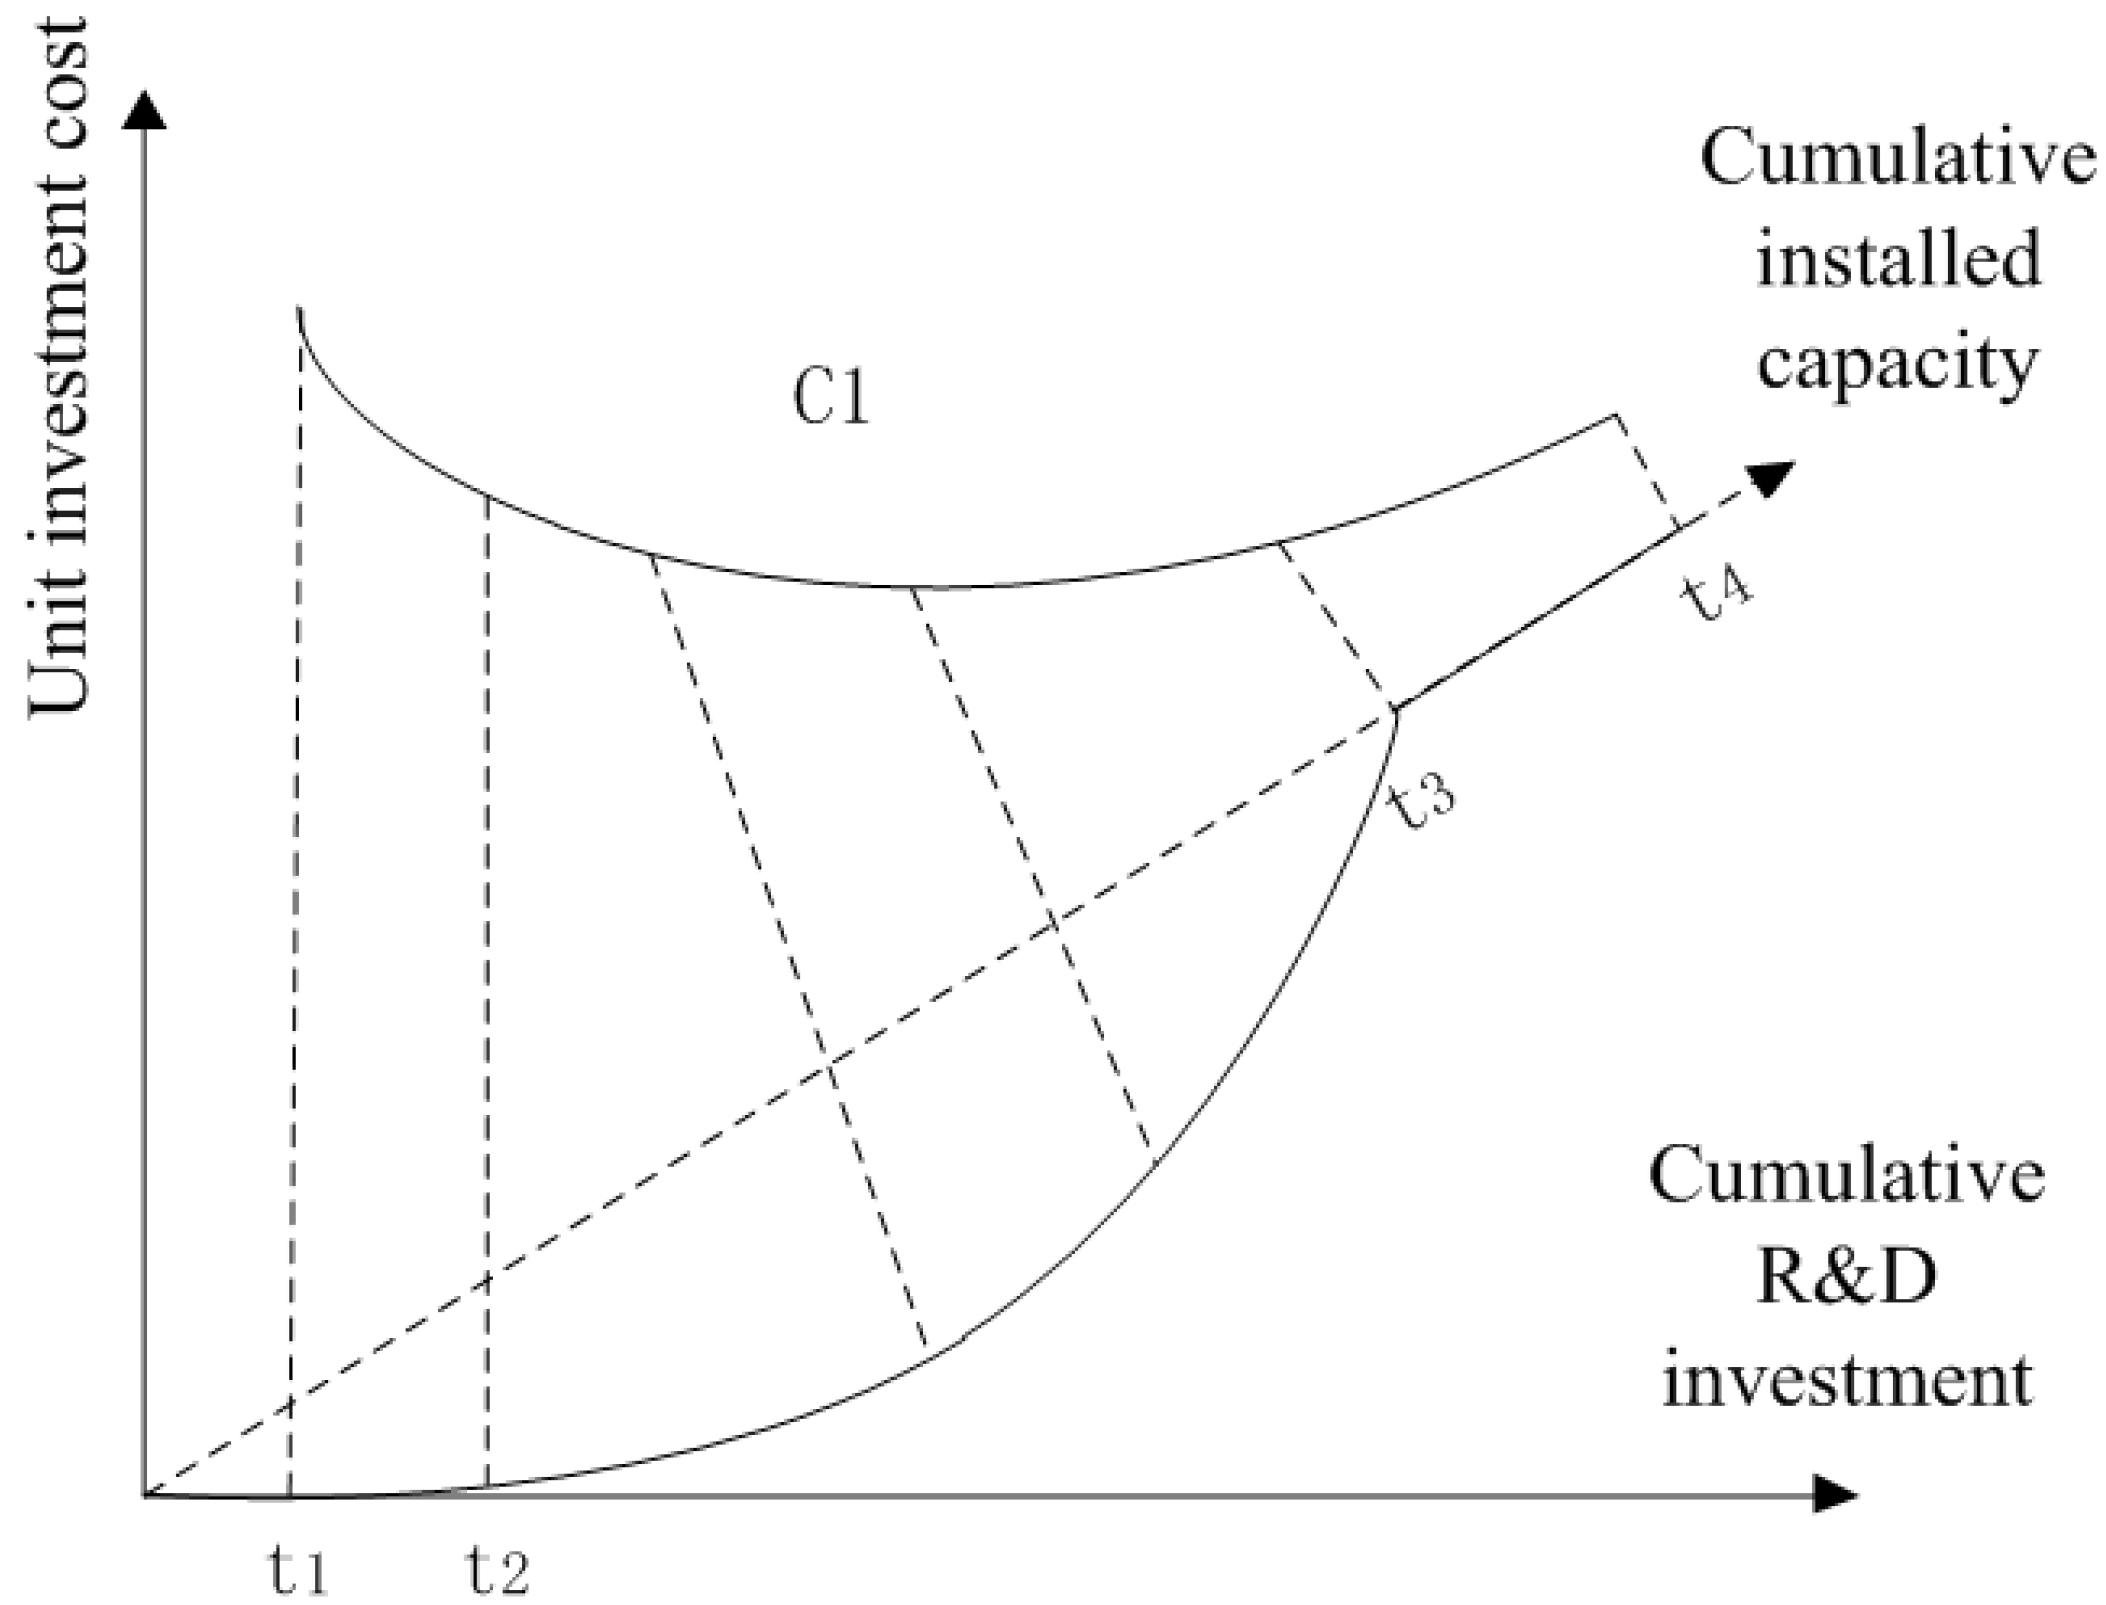
Figure 2 described the impact of cumulative R&D investment and cumulative installed capacity on the power technology costs in the different stages. Curve C1 showed the cost change of power technology A in the three-dimensional space, and t1, t2, t3, t4 represented the time node, and t1–t2–t3–t4 represented a polyline which showed the projection of the curve C1 on the cumulative installed capacity—R&D investment plane. During t1–t2, the power technology A was in the basic R&D stage, with the R&D deepening, the technology A gradually developed and the cost reduced, but there was no cumulative installed capacity, so, in this stage, the cost reduction was completely caused by the factor of cumulative R&D investment. During t2–t3, with continuous development and cost reduction, the technology A gradually entered the market, and the cumulative R&D investment and cumulative installed capacity worked together to promote the continuous cost reduction. During t3–t4, after the long-term development and production practice, technology A had been in the mature and stable stage and no longer conducted R&D investment in the scale, so the cost change was triggered by the cumulative installed capacity.
4. Staged Dynamic Two-Factor Learning Curve Model
The technology progress of power technologies will play an important role in the process of market diffusion, which will also have an important influence on low-carbon power system transition. The reduction of technology cost is the main performance of technological progress. Whether it is in the technical demonstration phase or the mature phase, the technology cost is always one of the primary considerations. The dynamic changes of power technology costs had affected its application, promotion and global energy supply pattern. Therefore, in the process of the power technology development, the general regularity research on the dynamic cost was particularly important. The researchers constructed all forms of the learning curve model to analyze the relationship between power technology cost and various factors to predict the cost trend.
The learning curve model researching the power technology had been applied more widely. The basic logic is that the unit investment cost of new energy technologies is higher than the conventional energy technologies. However, with the development and the cumulative experience of the new energy technologies, the unit cost emerged a downward trend. The learning curve originated in the study for the aircraft industry in the 1930s, and applied to other areas in the subsequent decades.
By analyzing the influencing factors of power technology cost change and its dynamic change path, the paper constructs a staged dynamic two-factor learning curve model that considers the effects of the international technology spillover on the power technology learning to research the learning effect in the development of power technology. The analysis presented in the paper has implications on how to formulate economically robust energy policy with an explicit consideration of new technology learning.
4.1. Staged Dynamic Two-Factor Learning Curve Model of Power Technology
According to the dynamic effect of the cumulative R&D investment and cumulative installed capacity on the technology cost, this paper built the two-factor dynamic learning curve model in stages to analyze the change trend of unit investment cost.
The two-factor dynamic learning curve equation was:
Among them,
represented the initial cost of the power technology;
represented the minimum of the cost reduction;
was for the cumulative installed capacity function as the time changes;
was for the cumulative R&D investment function as the time changes;
was the elasticity coefficient of the cumulative installed capacity;
was the elasticity coefficient of the cumulative R&D investment; and
was the time variable:
In this equation, was the depreciation rate of R&D investment; was the discount coefficient; was the lagging period; and was the R&D investment.
In addition, many empirical studies had shown that, with the increasingly frequent international exchanges and cooperation, technology and knowledge of one country often promoted the other countries across the world to accelerate technological progress. The channels of international technology spillover mainly came from the foreign direct investment (FDI) and transnational R&D activity, and it mainly reflected that the domestic enterprises utilized the advanced technology or new management mode of multinational cooperation to improve their own technological innovation ability. However, the domestic enterprises improved their technical level by imitating innovation activities and other ways under the market competition pressure.
China’s technology innovation and learning experience for many years showed that China’s industrial innovation ability was closely related to the international technology spillovers. However, the international technology spillovers included the foreign R&D spillover effect, export learning effect, etc. Limited by the international statistical data, this paper used the rating method to measure the effects of the international technology spillover on the power technology learning, and divided the effects into three levels, namely, the high level, middle level and low level, and the corresponding coefficients were 1.2, 1.0 and 0.8, respectively, to consider the technical learning rate and the progress rate.
4.2. Learning Curve of Wind Power
The learning curve mainly described the change trend of technology cost, but due to the incomplete statistics, the forecast of learning rate might be some differences with the actual value. Currently, the renewable power is in a high-speed development period, and using the learning curve model can forecast the power technology cost evolution, the time and scale of incorporating the power plan, and policy input in different development stages. It has important guidance and reference values. In accordance with internationally recognized research results, the renewable energy development of wind power and photovoltaic power are in line with the learning curve model.
The United States Department of Energy carried on the statistical analysis of wind power cost. During 1982–2012, the learning rate of wind power in US was 7.2%, and during 1982–2004, the learning rate was 14.1%, and it will still have the decrease space in the future. The IPCC summarized the main the literature about the learning rate of wind power, and the learning rate around the world was 4–32%, and from the point of new period, the learning rate was 9–19%.
From 2006 to 2013, the cost of wind power in China had a declining trend overall. Among them, the investment cost of wind power rebounded during 2007–2009 because of the rising wind turbine cost, labor cost and interconnection cost, etc. In 2009–2013, the excess-demand situation of wind turbine had been eased in China, with the large-scale application and technical progress, the investment cost of wind power returned to a decline trend, and, in 2013, the investment cost had dropped to approximately 8000 yuan/kW.
Ref. [
22] took the installed capacity of wind power in China during 2000–2010 as an example, and the fitting results showed as follows:
Correspondingly, the average annual growth rate of installed capacity for wind power was as high as 67.4%, meaning that in the early promotion stage of wind power, its average annual growth rate was relatively high, which was closely related to the supporting policies at home and abroad. Predictably, the development speed of wind power would be slowing after reaching a certain scale. Ref. [
24] thought that the power technology would develop at a rapid exponential growth way before maturity, and, after reaching maturity, its growth way would remained unchanged, but the exponential growth speed would have fallen sharply. Much of the literature researched that mature technology meant that the technology supply accounted for 1% of the total energy supply. For fitting the development speed of power technology in the mature stage and taking hydropower as an example, in 1980, hydropower production in China accounted for 1.2% of primary energy production. Therefore, fitting the technical learning curve of hydropower since the 1980s, 1990s and 2000s, the results were as follows:
Therefore, the hydropower growth path was not in accordance with the linear trend, and this was mainly due to the accelerating industrialization and urbanization process, the rapid growth of power demand after the reform and the opening up in China. These all strongly pulled the electric power technology scale with the growing exponentially trend.
However, the study above only considered the learning curve of the wind power from the aspects of cumulative installed capacity, and ignored that the new technology needs R&D and governmental scientist demonstration projects that supporting and promoting rapid development before reaching a certain size. Therefore, the paper will consider the cumulative installed capacity and cumulative R&D investment two factors to measure the “learn by doing” and “learn by researching” of wind power. Considering that the early wind power technology was in the R&D and demonstration stage, and the wind power disorderly developed and other factors during 2006–2008, the paper based on the unit investment cost in 2009–2015 to forecast the cost in 2016–2050:
- (1)
The unit investment cost data of wind power (C) was from “The report of wind power construction statistic and evaluation of China in 2013” released by China Renewable Energy Engineering Institute, and the unit is yuan/kW.
- (2)
The cumulative installed capacity (CC) of wind power was from the Chinese Wind Energy Association, and the unit is MW.
- (3)
The R&D investment stock (
KS) was calculated and supplemented according to the research methods of literature [
46], and the unit is billion yuan.
For the time series, the paper used the autoregressive moving average (ARMA) model to simulate the two-factor learning curve of wind power. If the time series is the linear function of its current and previous random error term and the previous values, it can be represented as
This series is called the autoregressive moving average sequence, and Formula (5) is the autoregressive moving average model for the order recorded as ARMA is the autoregressive coefficient, is the moving average coefficient, and they are all the estimated parameters of the model.
For the ARMA model, if the order , the model will be the autoregressive model . If the order , the model will be the moving average model MA(q).
By introducing the lag operator
B, formula (5) is shorthand for
The steady state condition of ARMA
is that the roots of lag polynomial
are all outside the unit circle, and the reversible condition is the roots all outside of the unit circle. We show that the ARMA model is equivalent to the infinite order AR process or the infinite order MA process when meeting the above conditions [
46].
According to
Table 1, Model 1 only considered the effect of cumulative installed capacity on the technological learning, not considering the influence of cumulative R&D investment, and the calculated vector of “learn by doing” was 12.23%. Model 2 considered two factors of cumulative installed capacity and cumulative R&D investment, and the calculated vector of “learn by doing” and “learn by researching”, respectively, were 5.36 and 16.44%. It showed that the effect of the cumulative installed capacity on the unit investment cost reduction below the influence of the cumulative R&D investment, that is, “learn by researching” was the main reason for the decline in unit investment cost of current wind power. However, for the technological progress rate, the effect of “learn by doing” on unit investment cost reduction of wind power was significantly superior to the “learn by researching”. Therefore, “learn by researching” was still the main route of the unit investment cost reduction for wind power in China, but, in the long term, after the saturation of R&D learning, “learn by researching” was difficult to more effectively reduce the unit investment cost, and the installed capacity expansion of wind power would be more conducive to cost reduction.
5. Learning Rates and Unit Investment Cost Forecast for Main Power Technologies in China
Due to the limitation of the content, this paper calculates the future technical learning rate of different power technologies by collecting the cumulative installed capacity and cumulative R&D investment data based on the two-factor dynamic learning curve model. Then, the unit investment costs of various technologies are forecasted.
Under the combined effect of cumulative R&D investment and cumulative installed capacity, the unit investment cost of the main renewable energy power technologies will be gradually reduced. Experiencing the R&D—prototyping and technology demonstration—investment and engineering—commercialization and promotion—and commercial maturity stages, the learning rate for different development stages of “learn by doing” and “learn by researching” are predicted, and adjust the renewable energy power support policy dynamically, in order to ensure the scientific, rational, economic basis to promote the rapid development of renewable energy power industry.
Different power technology learning rates and their corresponding unit investment costs are shown in
Table 2.
Water resources are abundant in China and hydropower is a mature renewable energy technology with stable output, so it has little potential for technical learning. The hydropower in the eastern region and central region has now been developed completely, while the future potential in western region is relatively low. Considering the immigration, environmental protection, construction cycle and other factors, the further development of hydropower will be constrained and gradually slow down. In 2030, the unit investment cost of hydropower will be increasing to 11,000 yuan/kW. Pumped storage is a kind of power source for peak load leveling frequency regulation, phase regulation, accident backup and other functions of flexible operation and fast response. Similar to the hydropower, in 2030, taking into account the increasing development costs, the unit investment cost of pumped storage will be increasing to 4500 yuan/kW.
For coal power, a large number of clean coal power generation technologies are developed, and gradually becoming the mainstream units, such as circulating fluidized bed (CFB), ultra-supercritical (USC), and the coming 700 °C ultra-supercritical (USC), integrated gasification combined cycle (ICCC) + carbon capture and storage (CCS), etc. Considering a variety of emerging technologies, during 2020–2030, USC and USC + CFB will achieve large-scale commercial applications, and 700 °C USC will be in the demonstration phase by the impact of “learn by researching”. The learning rate will be 1.3% and the unit investment costs will decline from 3850 yuan/kW to 3800 yuan/kW. During 2040–2050, based on the two factors of “learn by doing” and “learn by researching”, 700 °C USC technology will realize large-scale commercialization, and the learning rate will be 1.3% while the unit investment costs will drop to 3750 yuan/kW.
For gas power, with cumulative installed capacity and cumulative R&D investment, the single cycle gas unit and steam-gas combined cycle unit have developed rapidly, so the learning rate will reach 3.03% during 2020–2030. Then, the gas distributed generation and grid-connected technology will be becoming increasingly mature, with the acceleration development of combined cooling, heating and power (CCHP), and the learning rate will be 3.13% and the unit investment costs will drop to 3100 yuan/kW.
Nuclear power plays an important role of the serving base load in the power system. During 2020–2030, by the impact of the cumulative installed capacity and cumulative R&D investment, the third generation of nuclear power technology will achieve the closed-loop operation of spent fuel, and also the fourth generation of nuclear power will be in the demonstration stage with “learn by researching”. The learning rate will be 18.75% and the unit investment costs will decline from 16,000 yuan/kW to 13,000 yuan/kW. During 2040–2050, the third generation of nuclear power technology will become fully mature, and the fourth generation of nuclear power technology will transform from the commercial demonstration into large-scale commercial application, so the learning rate will drop to 7.69%.
In China, the wind power technology is almost mature, and “learn by researching” has also been saturated, so the decline of unit investment cost mainly relies on “learn by doing”, or the growth of cumulative installed capacity. Therefore, the learning rate of wind power is 4% and 2.78% during 2020–2030 and 2040–2050, respectively.
Solar power technology includes solar photovoltaic (PV) power generation and concentrated solar power (CSP) generation. The development of solar PV power technology mainly relies on the high-performance cells. On the one hand, the focus is on the development of crystalline silicon cell technology, and production costs will be reduced by improving the cell production technologies and processes, in order to upgrade the cell efficiency. On the other hand, researching and developing the thin film solar cells and new type of solar cells, including the new solar cells still in the laboratory or experimental demonstration stage currently, needs a long time to learn and improve. Thus, with the two factors of the cumulative installed capacity and cumulative R&D investment, the learning rate will continue to decline during 2016–2040 from high level at 16% to low level of 5.56%. After 2040, with the rapid development of new type of solar cells (learn by researching), the learning rate will rise a little bit to 5.88%. The mainstream technical routes of CSP are three categories including trough, disc and tower, according to the way of solar energy collection. The trough solar power system is simple and the technology is more mature which enters the commercial operation firstly. The transfer efficiency of disc solar power is higher than the other two kinds, but due to the complex structure of receiver, the unit investment cost is very high. Now, the tower solar power can not realize the large-scale commercial operation because of the high construction costs, but with the speeding up of technological learning, the investment cost will go down with strong competitiveness in the future. Thus, during 2016–2030, the learning rate will decline from 33 to 25% rapidly, and then rise to 33% into 2040, and drop to 20% into 2050.
6. Conclusions
According to the results shown above, the development of wind power technology focused on “learning by researching” in China. While this approach is the main reason for the decline in wind power investment costs, in terms of technological progress rate, the effect of “learn by doing” is obviously better than “learn by researching” in the decline of wind power investment cost.
Table 2 predicted the learning rate of the power technologies in 2016–2050 under the combined action of cumulative installed capacity and cumulated R&D investment. Among them, the learning rates of nuclear power, PV power and CSP are significantly higher, while the learning rates of wind power, coal power and gas power are relatively lower.
The third generation nuclear power will accelerate technology learning in 2020–2030, and the learning rate will reach 18.75% and then decline after 2030. Compared with solar power, the learning rate of wind power is significantly lower. This is mainly due to the maturity of wind power technology, so future cost reduction relies a lot on the cumulative installed capacity. Solar power is still in the early stage of commercialization because of the high investment costs so its learning potential is higher than wind power.
Compared with solar PV power, CSP needs higher initial investment, but as an emerging technology, it has a bright future with higher efficiency and utilization hours. Because the government has implemented a series of supporting policies, the learning rate of CSP will be significantly higher than PV power in 2016–2050.
From the forecast results, the innovation and diffusion speed of renewable energy power technologies will accelerate in the future in China, and the unit investment cost will show a gradual decline in the trend, which will exert a promising impact of the costs of power generation in China.


