Effect of Irrigation Schemes on Forage Yield, Water Use Efficiency, and Nutrients in Artificial Grassland under Arid Conditions


Abstract
:1. Introduction
2. Materials and Methods
2.1. Study Area
2.2. Experimental Design
2.3. Experimental Measurements
2.4. Data Analysis
3. Results
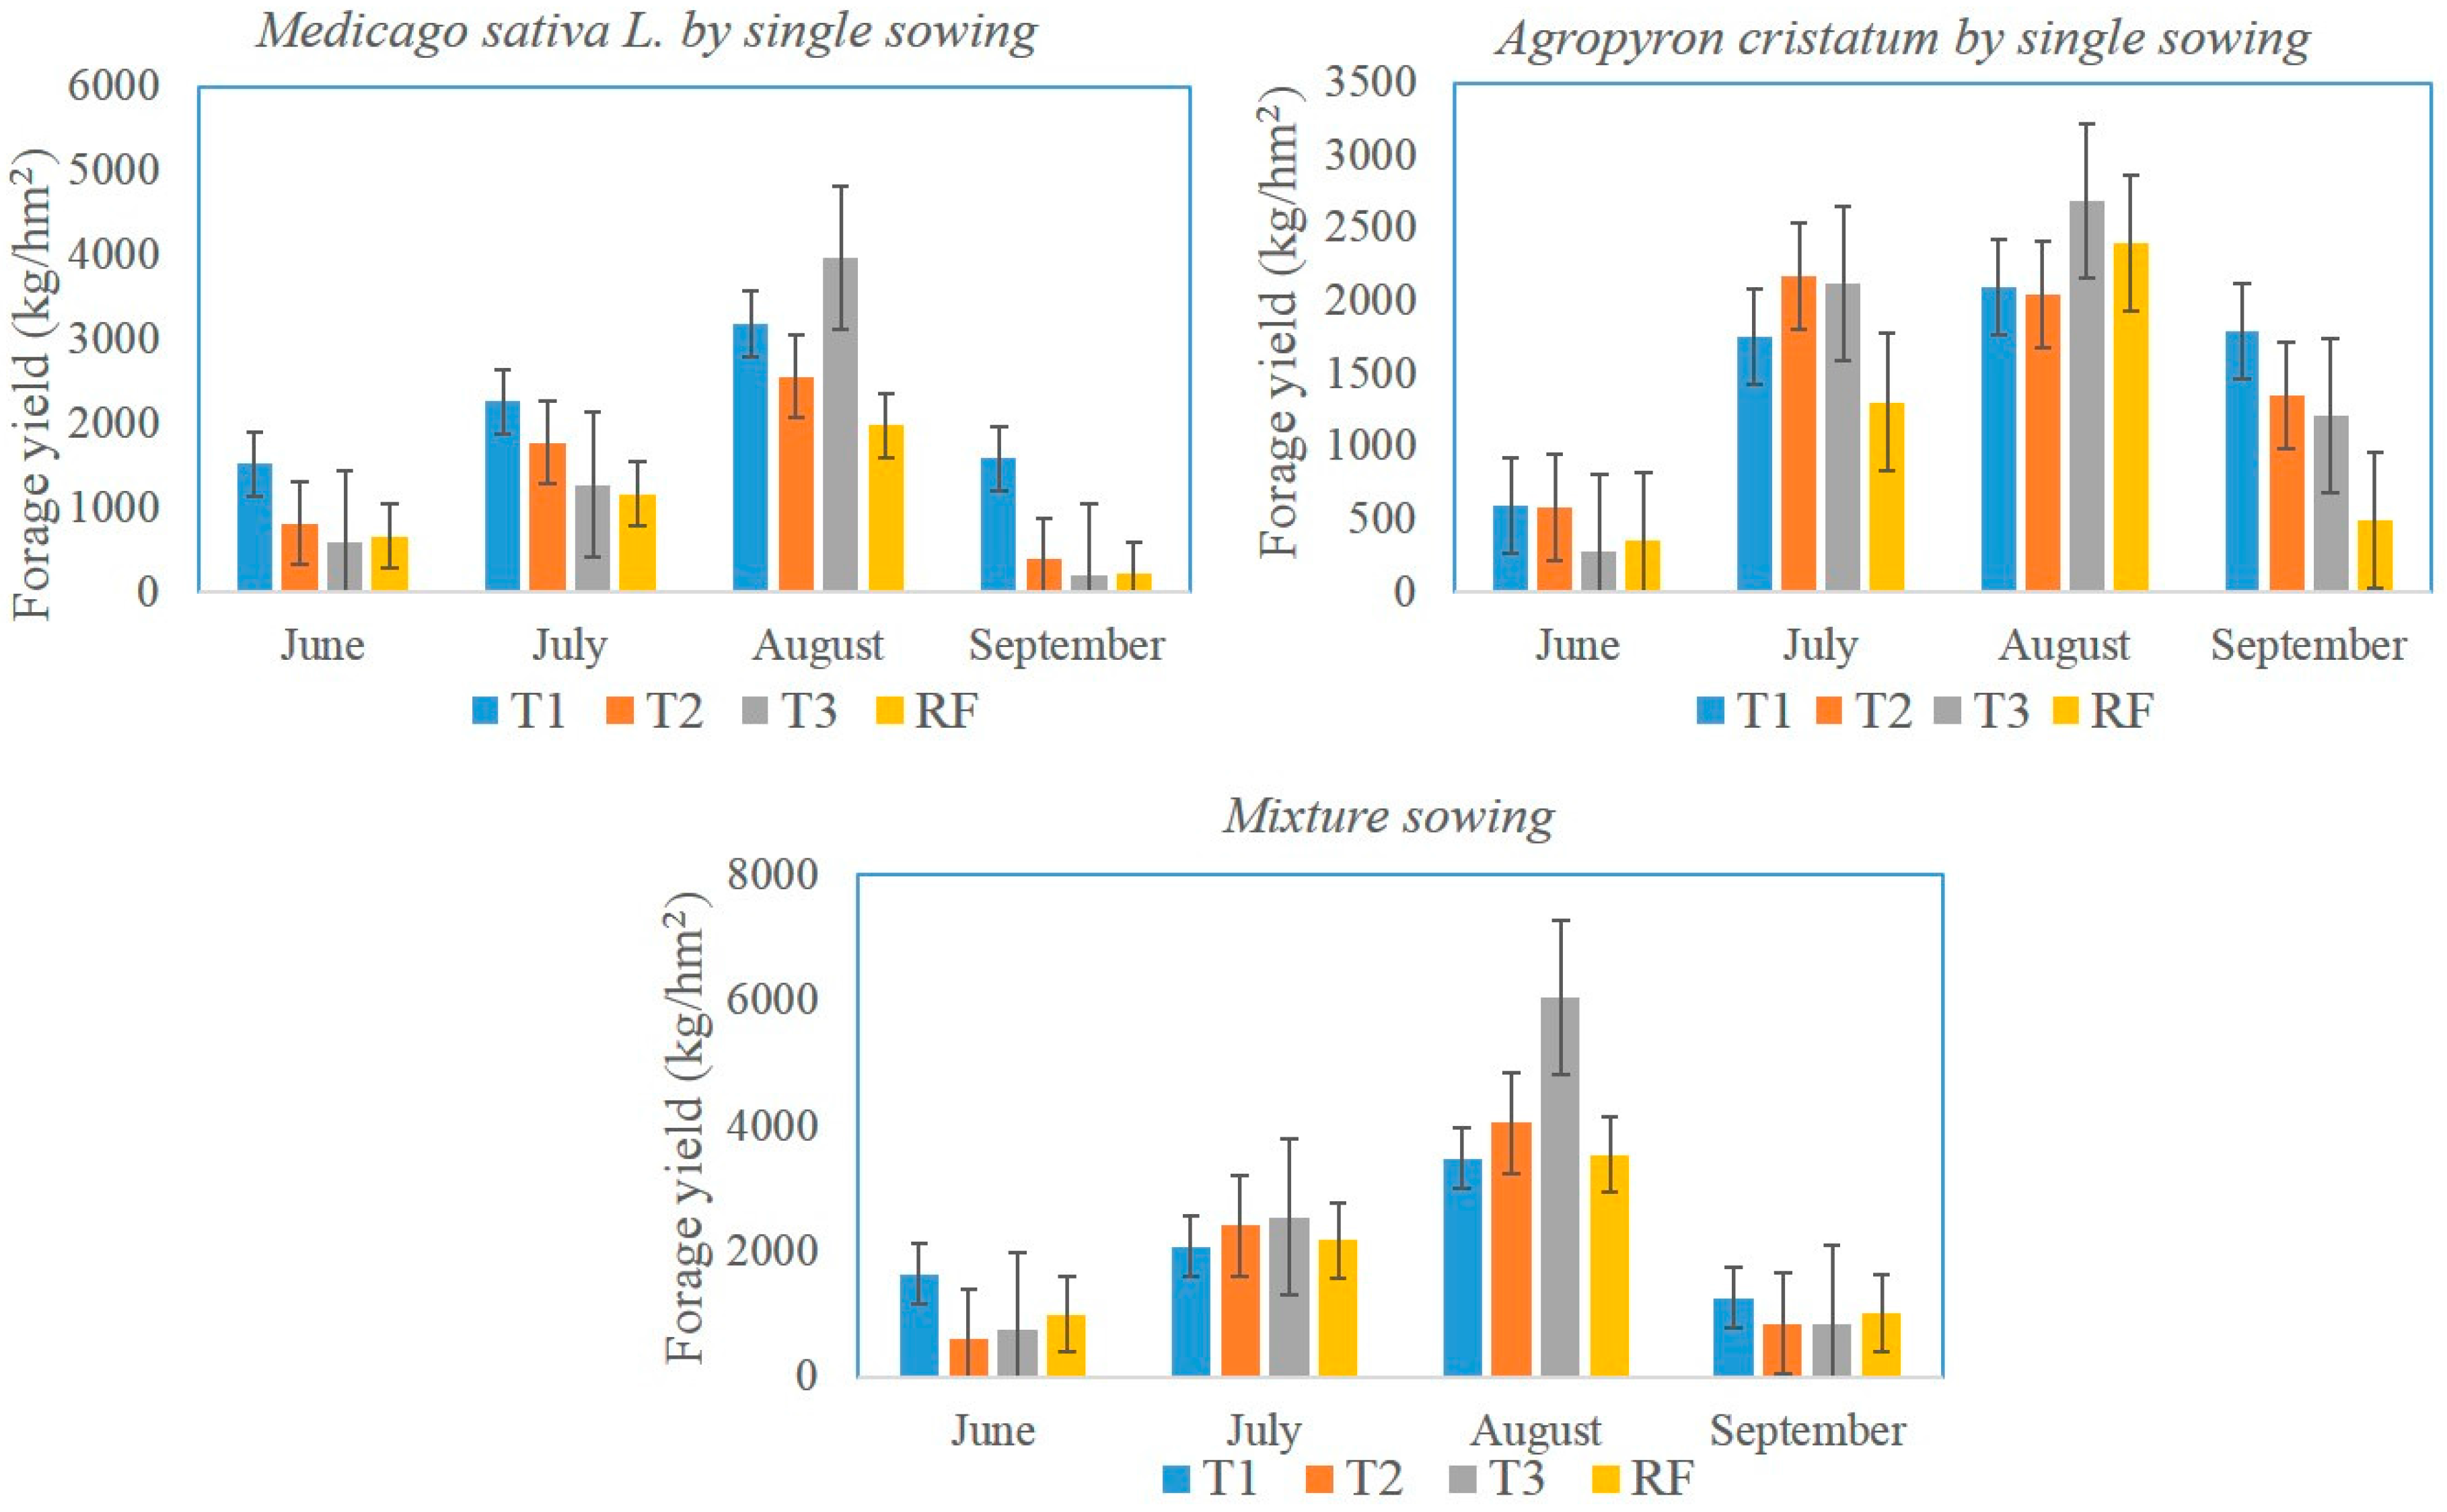
3.1. Impact of Irrigation Schemes on Forage Yield
3.2. Impact of Irrigation Schemes on WUE
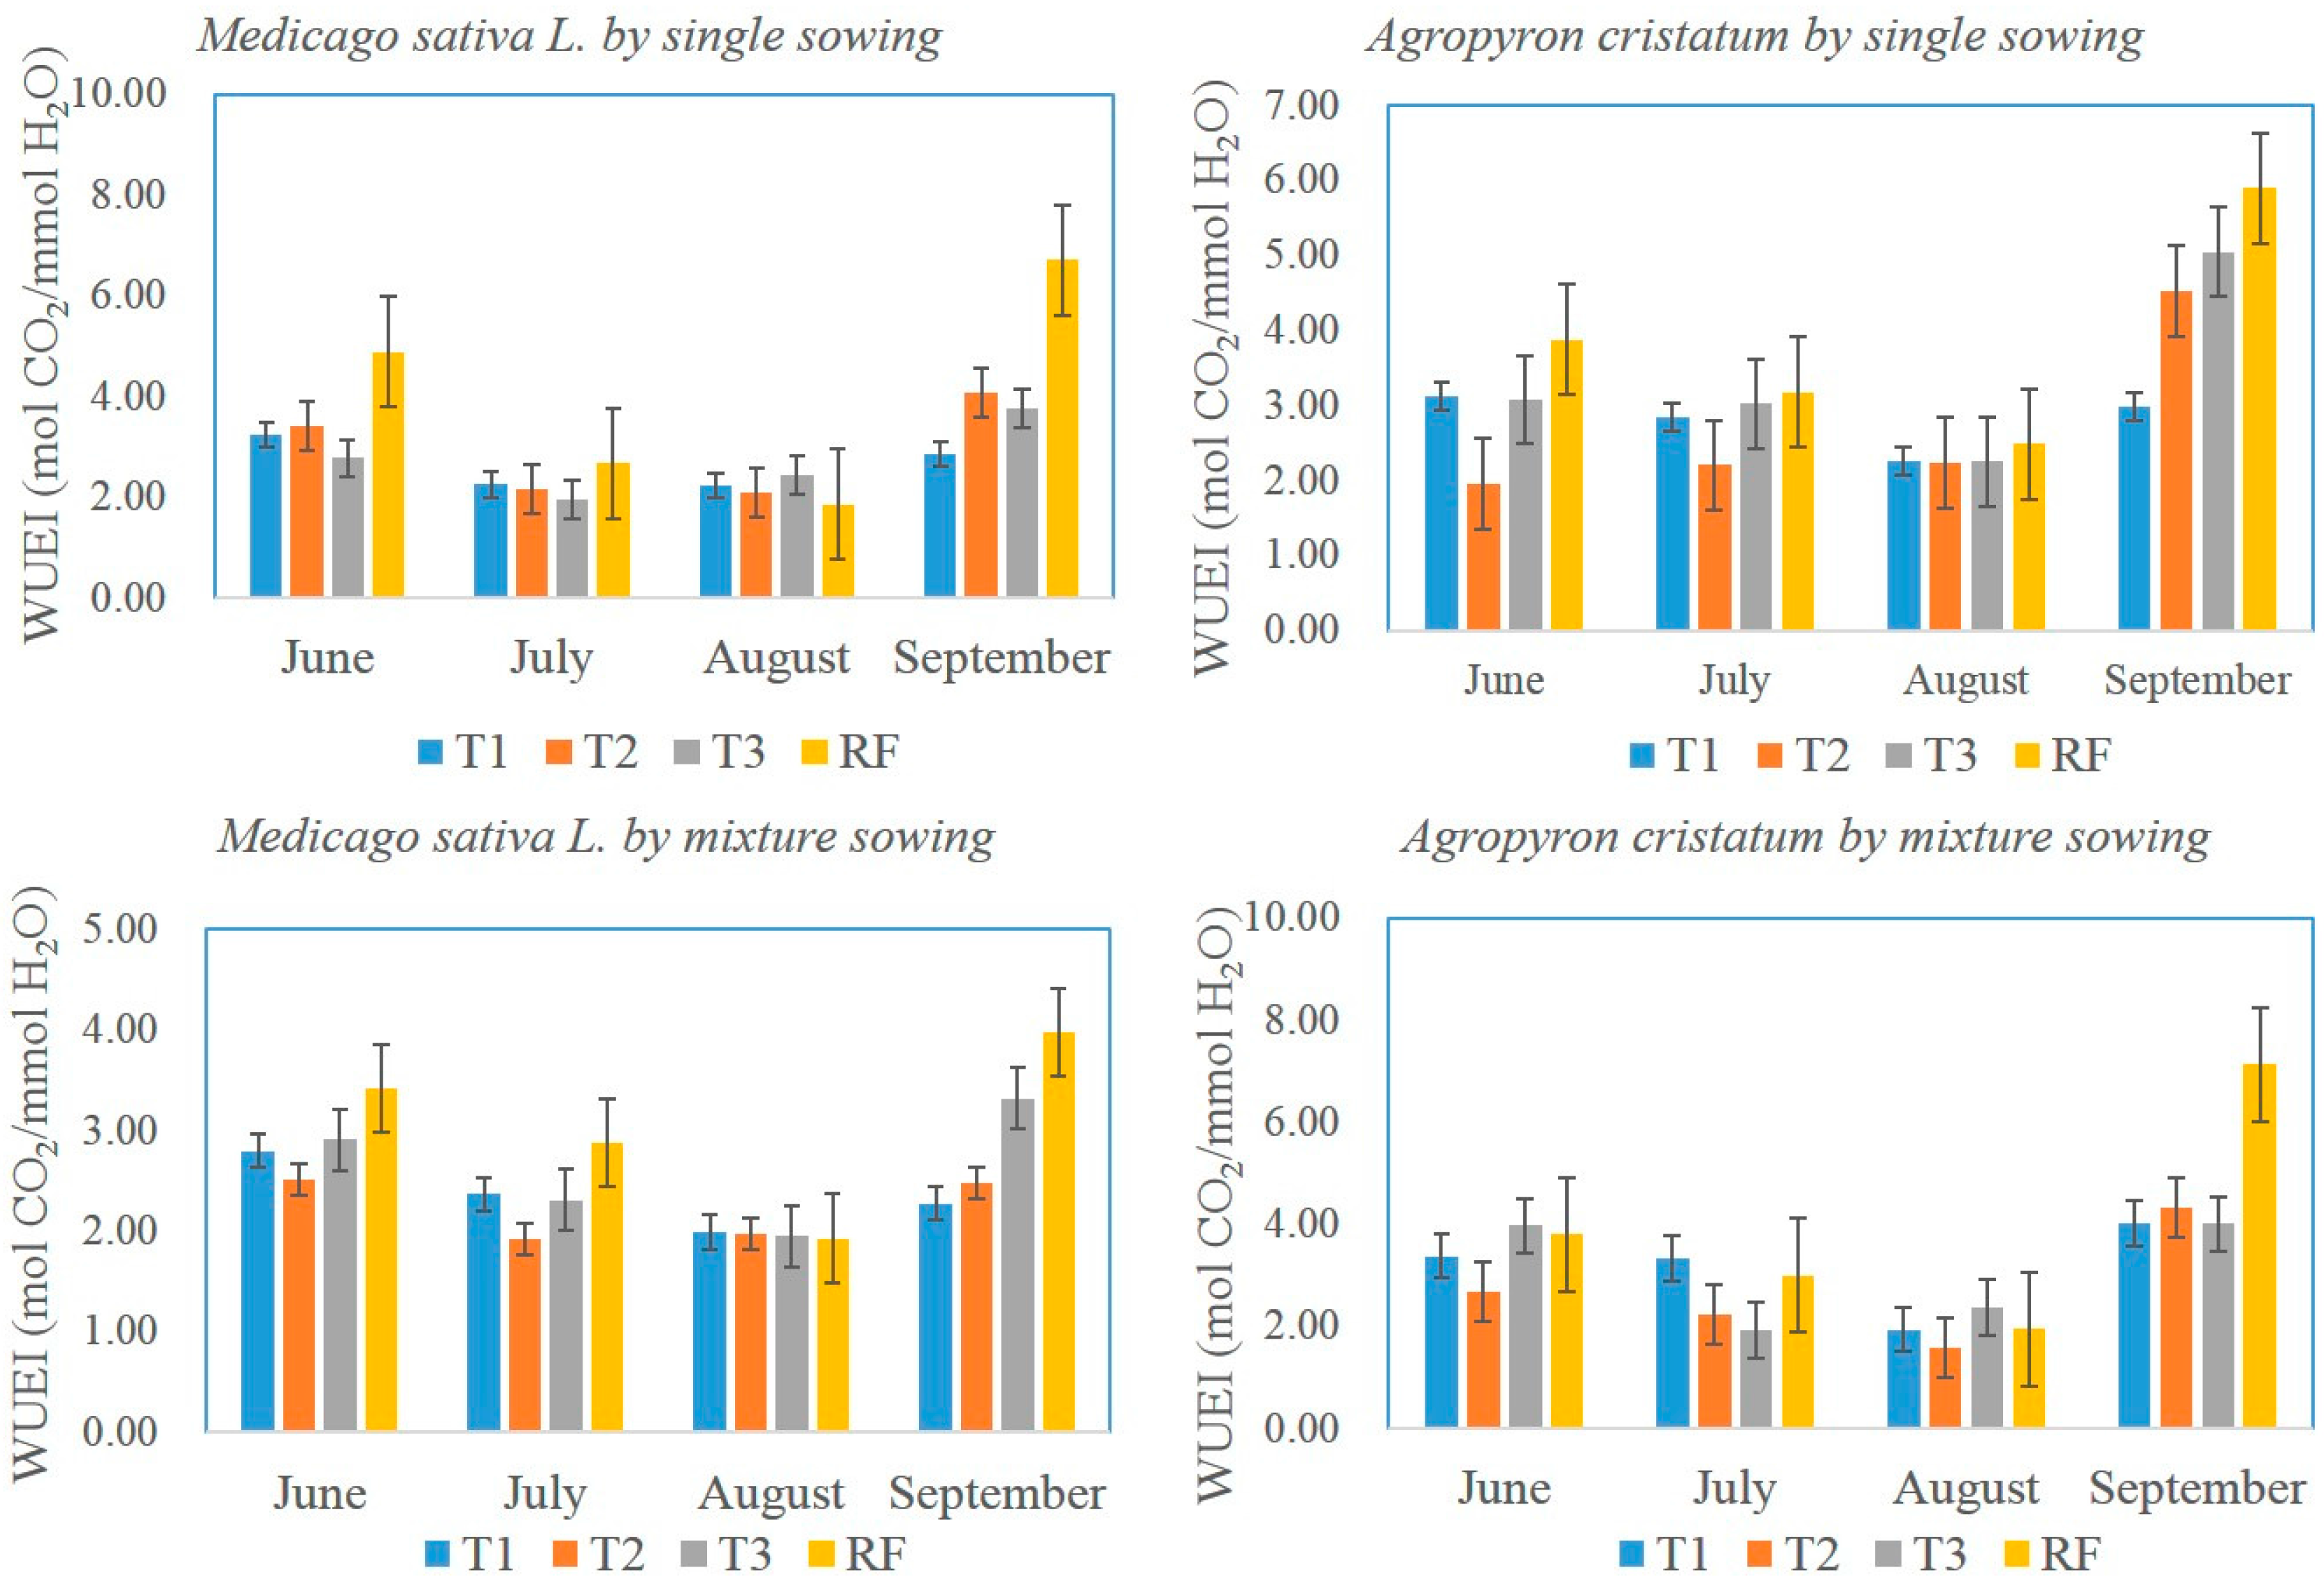
3.2.1. WUEI
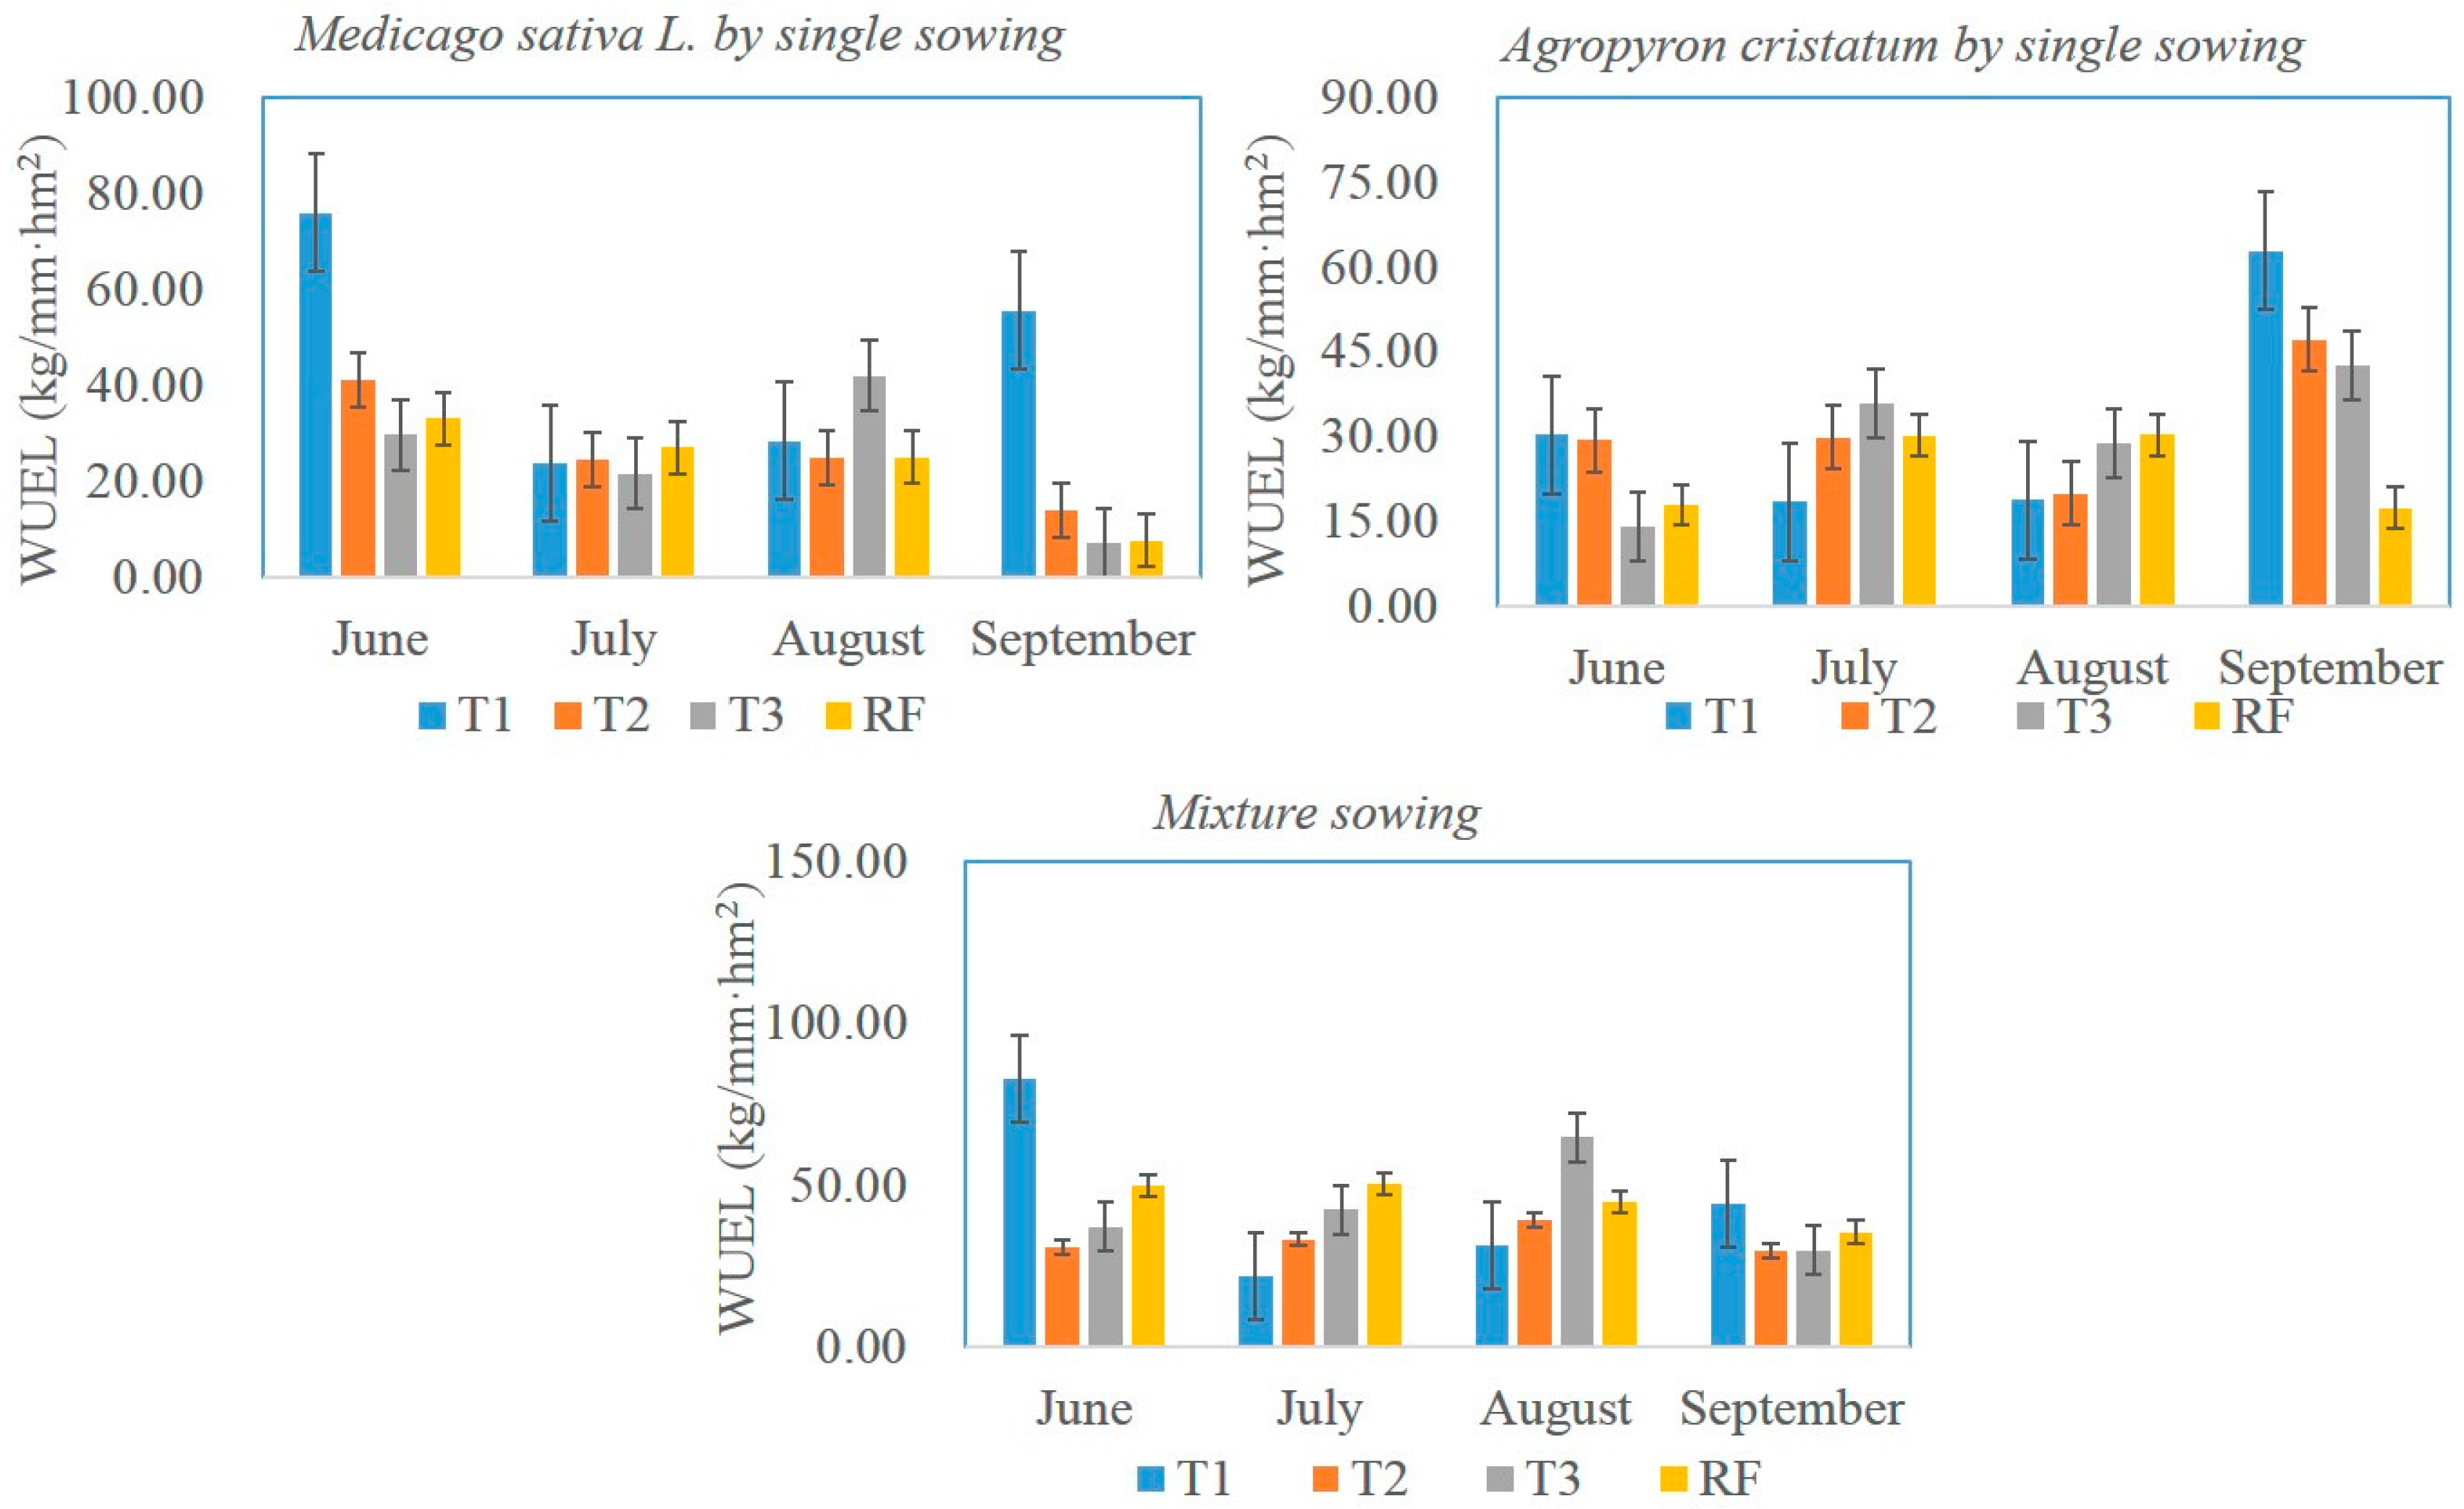
3.2.2. WUEL
3.3. Impact of Irrigation on Forage Nutrient Elements
4. Discussions and Conclusions
4.1. Impact of Irrigation on Forage Yield and Nutritional Level
4.2. Impact of Water Scarcity on Water-Use Efficiency
4.3. Optimum Schedule to Increase Forage Quality and Save Water
Acknowledgments
Author Contributions
Conflicts of Interest
References
- Wang, W.; Fang, J.Y. Soil respiration and human effects on global grasslands. Glob. Planet. Chang. 2009, 67, 20–28. [Google Scholar] [CrossRef]
- Zhang, X.S. China must take the road of the development of artificial grass and grassland agriculture. Impact Sci. Soc. 2010, 3, 18–21. (In Chinese) [Google Scholar]
- Xu, K.K.; Wang, H.; Li, X.B.; Chi, D.K.; Yu, F. Identifying areas suitable for cultivation of Medicago sativa L. in a typical steppe of Inner Mongolia. Environ. Earth Sci. 2016, 75, 341. [Google Scholar] [CrossRef]
- Ates, S.; Tongel, M.O.; Moot, D.J. Annual herbage production increased when sub clover overdrilled into grass-dominant dryland pastures. Proc. N. Z. Grassl. Assoc. 2012, 72, 3–10. [Google Scholar]
- Ren, X.Y.; Xu, Z.W.; Isbell, F.; Huang, J.H.; Han, X.G.; Wan, S.Q.; Chen, S.P.; Wang, R.Z.; Zeng, D.H.; Jiang, Y. Exacerbated nitrogen limitation ends transient stimulation of grassland productivity by increased precipitation. Ecol. Monogr. 2017, 87, 457–469. [Google Scholar] [CrossRef]
- Jensen, K.B.; Asey, K.H.; Waldron, B.L. Dry matter production of orchardgrass and perennial ryegrass at five irrigation levels. Crop Sci. 2001, 41, 479–487. [Google Scholar] [CrossRef]
- Dantas, G.D.; De Faria, R.T.; Dos Santos, G.D.; Dalri, A.B.; Palaretti, L.F. Herbage yield and quality of irrigated Brachiaria in Autumn and Winter. Eng. Agricola 2016, 36, 469–481. [Google Scholar] [CrossRef]
- Sanches, A.C.; Gomes, E.P.; Rickli, M.E.; Friske, E.; Fasolin, L.P. Productivity and nutritive value of Tifton 85 in summer, with and without irrigation under different Nitrogen doses. Eng. Agricola 2017, 27, 246–256. [Google Scholar] [CrossRef]
- Isik, S.; Ates, S.; Gunes, A.; Aktas, A.H.; Keles, G. Effect of deficit irrigation on dry matter and sheep production from permanent sown pastures. In New Approaches for Grassland Research in a Context of Climate and Socio-Economic Changes; Acar, Z., López-Francos, A., Porqueddu, C., Eds.; Ciheam: Zaragoza, Spain, 2012; pp. 327–331. [Google Scholar]
- Zhang, X.; Pei, D.; Li, Z.; Wang, Y. Management of supplemental irrigation of winter wheat for maximum profit. Deficit irrigation practices. FAO Water Rep. 2002, 22, 57–66. [Google Scholar]
- English, M.J.; Musich, J.T.; Murty, V.V.N. Deficit irrigation. In Management of Farm Irrigation Systems; Hoffman, G.J., Howell, T.A., Solomon, K.H., Eds.; ASAE: St. Joseph, MI, USA, 1990. [Google Scholar]
- Zheng, Y.; Zhang, Y.; Wu, J. Yield and quality of Moringa oleifera under different planting densities and cutting heights in southwest China. Ind. Crops Prod. 2016, 91, 88–96. [Google Scholar] [CrossRef]
- Antoniewicz, A.M.; Kowalczyk, J.; Kanski, J.; Gorska-Matusiak, Z.; Nalepka, M. Rumen degradability of rude protein of dried grass and Lucerne forage measured by in sacco incubation and predicted by near infrared spectroscopy. Anim. Feed Sci. Technol. 1995, 54, 203–216. [Google Scholar] [CrossRef]
- Colmenero, J.J.O.; Broderick, G.A. Effect of dietary crude protein concentration on milk production and Nitrogen utilization in Lactating dairy cows. J. Dairy Sci. 2006, 89, 1704–1712. [Google Scholar] [CrossRef]
- Allinson, D.W.; Osbourn, D.F. The cellulose-lignin complex in forage and its relationship to forage nutritive value. J. Agric. Sci. 1970, 74, 23–26. [Google Scholar] [CrossRef]
- Hunt, L.A. Ash and energy content of material from seven forage grasses. Crop Sci. 1966, 6, 507–509. [Google Scholar] [CrossRef]
- Cantore, V.; Lechkar, O.; Karabulut, E.; Sellami, M.H.; Albrizio, R.; Boari, F.; Stellacci, A.M.; Todorovic, M. Combined effect of deficit irrigation and strobilurin application on yield, fruit quality and water use efficiency of “cherry” tomato (Solanum lycopersicum L.). Agric. Water Manag. 2016, 167, 53–61. [Google Scholar] [CrossRef]
- Dourte, D.; Bartel, R.L.; George, S.; Marois, J.J.; Wright, D.L. A sod–based cropping system for irrigation reductions. Renew. Agric. Food Syst. 2016, 31, 485–494. [Google Scholar] [CrossRef]
- Kifle, M.; Gebretsadikan, T.G. Yield and water use efficiency of furrow irrigated potato under regulated deficit irrigation, Astibi–Wemberta, North Ethiopia. Agric. Water Manag. 2016, 170, 133–139. [Google Scholar] [CrossRef]
- Lu, S.; Zhang, X.; Liang, P. Influence of drip irrigation by reclaimed water on the dynamic change of the nitrogen element in soil and tomato yield and quality. J. Clean. Prod. 2016, 139, 561–566. [Google Scholar] [CrossRef]
- Audrey, A.; Humbert, J.Y.; Arlettza, R. Functional response of leaf- and planthoppers to modern fertilization and irrigation of hay meadows. Basic Appl. Ecol. 2016, 17, 627–637. [Google Scholar]
- Niu, J. Relationship between main vegetation types and climatic factors in Inner Mongolia. Chin. J. Appl. Ecol. 2000, 11, 47–52. (In Chinese) [Google Scholar]
- Gong, J.R.; Xu, S.; Wang, Y.H.; Luo, Q.P.; Liu, M.; Zhang, W. Effect of irrigation on the soil respiration of constructed grasslands in Inner Mongolia, China. Plant Soil 2015, 395, 159–172. [Google Scholar] [CrossRef]
- Yang, S. Analysis of Feed and Feed Quality Detection Technology; Beijing Agricultural University Press: Beijing, China, 1993; pp. 4–5. (In Chinese) [Google Scholar]
- Ballester, C.; Castel, J.; Abd El-Mageed, T.A.; Castel, J.R.; Intrigliolo, D.S. Long-term response of ‘Clementina de Nules’ citrus trees to summer regulated deficit irrigation. Agric. Water Manag. 2014, 138, 78–84. [Google Scholar] [CrossRef]
- Panigrahi, P.; Sharma, R.K.; Hasan, M.; Parihar, S.S. Deficit irrigation scheduling and yield prediction of ‘Kinnow’ mandarin (Citrus reticulata Blanco) in a semiarid region. Agric. Water Manag. 2014, 140, 48–60. [Google Scholar] [CrossRef]
- English, M.J.; Solomon, K.H.; Hoffman, G.J. A paradigm shift in irrigation management. J. Irrig. Drain. Eng. 2002, 128, 267–277. [Google Scholar] [CrossRef]
- Zhu, X.; Zhang, C. Main functional proteins in plant responses to water stress. Acta Bot. Boreal. Occident. Sin. 2002, 23, 503–508. [Google Scholar]
- Tari, A.F. The effects of different deficit irrigation strategies on yield, quality, and water–use efficiencies of wheat under semi-arid conditions. Agric. Water Manag. 2016, 167, 1–10. [Google Scholar] [CrossRef]
- Fereres, E.; Soriano, M.A. Deficit irrigation for reducing agricultural water use. Special issue on integrated approaches to sustain and improve plant production under drought stress. J. Exp. Bot. 2007, 58, 147–159, Special issue. [Google Scholar] [CrossRef] [PubMed]
- Blum, F.A. Effective use of water (EUW) and not water–use efficiency (WUE) is the target of crop yield improvement under drought stress. Field Crops Res. 2009, 112, 119–123. [Google Scholar] [CrossRef]
- Geerts, S.; Raes, D.; Gracia, M.; Miranda, R.; Cusicanqui, J.A.; Taboada, C.; Mendoza, J.; Huanca, R.; Mamani, A.; Condori, O.; et al. Simulating yield response of Quinoa to water availability with AquaCrop. Agron. J. 2009, 101, 499–508. [Google Scholar] [CrossRef]


| Irrigation Time | Irrigation Scheme * | % of Field Capacity | Irrigation Amount (m3/hm2) | Survey Time | Precipitation (m3/hm2) | Gross Irrigation Amount (m3/hm2) |
|---|---|---|---|---|---|---|
| Seeding establishment (18 May 2013) | T1 | 100 | 142.9 | Tillering stage (4 June 2013) | 132.1 | 275 |
| T2 | 100 | 142.9 | 132.1 | 275 | ||
| T3 | 100 | 142.9 | 132.1 | 275 | ||
| RF | 100 | 142.9 | 132.1 | 275 | ||
| Tillering stage (23 June 2013) | T1 | 85 | 528.5 | Heading and flowering stage (1 July 2013) | 591.8 | 1263.2 |
| T2 | 65 | 298.9 | 591.8 | 1033.6 | ||
| T3 | 45 | 169.1 | 591.8 | 903.8 | ||
| RF | 0 | 0 | 591.8 | 734.7 | ||
| Heading and flowering stage (28 July 2013) | T1 | 85 | 324 | Squaring stage (9 August 2013) | 1358.9 | 1825.8 |
| T2 | 65 | 232.7 | 1358.9 | 1734.5 | ||
| T3 | 45 | 141.5 | 1358.9 | 1643.3 | ||
| RF | 0 | 0 | 1358.9 | 1501.8 |
| Month | T | Medicago sativa L. by Single Sowing | Agropyron cristatum by Single Sowing | Mixture Sowing | |||||||||
|---|---|---|---|---|---|---|---|---|---|---|---|---|---|
| Yield | WUEI | WUEL | Yield | WUEI | WUEL | Medicago sativa L. | Agropyron cristatum | Yield | WUEL | ||||
| Yield | WUEI | Yield | WUEI | ||||||||||
| June | T1 | 1522.58abcde | 3.50ab | 75.92e | 599.74ab | 3.14ab | 30.22abc | 1409.10abc | 2.90ab | 233.10ab | 3.51abc | 1642.20abc | 82.84b |
| T2 | 820.24abc | 3.70ab | 39.64bcd | 578.59ab | 2.45ab | 29.30abc | 459.82a | 2.45a | 142.49a | 2.74abc | 602.31a | 30.85a | |
| T3 | 590.80abc | 2.51a | 26.77abc | 282.02a | 3.09ab | 14.10a | 540.63ab | 2.61a | 205.96ab | 6.32bc | 746.59ab | 37.17a | |
| RF | 664.92abc | 4.74abc | 33.02abcd | 357.93a | 3.83abc | 17.91ab | 566.14ab | 3.39abc | 427.54ab | 3.73abc | 993.69abc | 49.90ab | |
| July | T1 | 2259.68def | 3.11ab | 23.68abc | 1756.77bcde | 3.17ab | 18.39ab | 1700.53abcd | 2.08a | 382.90ab | 3.24abc | 2083.43abcd | 21.68a |
| T2 | 1774.66bcde | 2.27a | 24.49abc | 2168.29de | 2.30a | 29.84abc | 2090.82bcd | 1.93a | 316.94ab | 2.55ab | 2407.77cd | 33.28a | |
| T3 | 1177.27abcde | 2.03a | 21.42abc | 2123.64de | 2.85ab | 35.69abc | 2077.76bcd | 2.23a | 473.67ab | 2.23a | 2551.42cd | 42.45ab | |
| RF | 1167.68abcd | 2.62a | 27.00abc | 1307.06abcd | 3.12ab | 30.20abc | 1098.07abc | 2.64a | 1083.44b | 2.97abc | 2181.51bcd | 50.50ab | |
| August | T1 | 3178.16fg | 2.47a | 28.33abcd | 2096.58de | 2.83ab | 18.70ab | 2403.02cd | 2.25a | 1073.18ab | 2.34ab | 3476.20de | 31.13a |
| T2 | 2557.80def | 2.31a | 24.81abc | 2050.07cde | 2.29a | 19.92ab | 3168.20de | 2.16a | 883.56ab | 1.99a | 4051.76d | 39.14a | |
| T3 | 3972.73g | 2.70a | 41.96cd | 2693.76e | 2.39ab | 28.94abc | 3858.09e | 2.18a | 2184.78b | 2.84abc | 6042.87e | 64.65ab | |
| RF | 1978.20cdef | 2.41a | 24.94abc | 2396.02de | 2.67ab | 30.22abc | 1518.38abc | 1.78a | 2021.44c | 1.63a | 3539.82de | 44.63ab | |
| September | T1 | 2642.89ef | 4.97abc | 55.50d | 2994.60e | 4.55abc | 62.93d | 1845.51abcd | 2.61a | 252.62ab | 4.52abc | 2098.13abcd | 44.16ab |
| T2 | 662.51abc | 5.68bc | 13.93ab | 2247.31de | 4.81bc | 47.16cd | 626.27ab | 3.89abc | 475.53ab | 6.35bc | 1101.80abc | 29.76a | |
| T3 | 324.80a | 4.86abc | 6.89a | 2027.82cde | 4.60abc | 42.60bcd | 958.53abc | 5.13bc | 465.27ab | 3.36abc | 1423.80abc | 29.93a | |
| RF | 359.96ab | 7.02c | 7.58a | 824.13abc | 6.06c | 17.29ab | 624.71ab | 5.64c | 1066.33ab | 6.72c | 1691.04abc | 35.56a | |
| 2 M (P) | 4 D (0.00) | 4 D (0.00) | 4 D (0.00) | 4 D (0.00) | 4 D (0.01) | 4 D (0.00) | 4 D (0.00) | 4 D (0.02) | 4 D (0.00) | 4 D (0.03) | 4 D (0.00) | LSD (0.21) | |
| 3 F | 6.37 | 2.72 | 4.90 | 4.95 | 2.17 | 3.11 | 4.55 | 2.07 | 5.21 | 1.98 | 9.23 | 1.40 | |
| 5 DF | 47 | 47 | 47 | 47 | 47 | 47 | 47 | 47 | 47 | 47 | 47 | 47 | |
| T | Contents in MSS 2 | Contents in MSM 2 | Contents in ACS 2 | Contents in ACM 2 | ||||||||
|---|---|---|---|---|---|---|---|---|---|---|---|---|
| CP | CA | CL | CP | CA | CL | CP | CA | CL | CP | CA | CL | |
| T1 | 14.15b | 10.81b | 32.85a | 8.58a | 10.49a | 30.07b | 8.08a | 7.44ab | 31.15b | 8.02a | 6.46ab | 32.19b |
| T2 | 8.08a | 7.44a | 31.15a | 11.74b | 12.97b | 29.14b | 12.22a | 9.29b | 26.45a | 8.27a | 6.84b | 32.85b |
| T3 | 13.99b | 10.59b | 30.05a | 15.19c | 15.83c | 28.10ab | 8.08a | 6.58ab | 31.01b | 5.85a | 6.33ab | 25.90a |
| RF | 14.84b | 9.52ab | 27.53a | 15.17c | 12.69b | 23.16a | 8.40a | 4.95a | 27.04ab | 8.32a | 5.51a | 24.27a |
| 1 M (P) | 4 D 0.042 | 4 D 0.048 | LSD 0.216 | 4 D 0.001 | 4 D 0.005 | LSD 0.102 | LSD 0.207 | LSD 0.097 | LSD 0.055 | LSD 0.615 | LSD 0.070 | 4 D 0.005 |
| 3 F | 4.41 | 4.15 | 1.61 | 22.53 | 10.88 | 3.03 | 1.97 | 3.11 | 4.16 | 0.64 | 3.69 | 11.15 |
| 5 DF | 11 | 11 | 11 | 11 | 11 | 11 | 11 | 11 | 11 | 11 | 11 | 11 |
© 2017 by the authors. Licensee MDPI, Basel, Switzerland. This article is an open access article distributed under the terms and conditions of the Creative Commons Attribution (CC BY) license (http://creativecommons.org/licenses/by/4.0/).
Share and Cite
Tian, Y.; Liu, Y.; Jin, J. Effect of Irrigation Schemes on Forage Yield, Water Use Efficiency, and Nutrients in Artificial Grassland under Arid Conditions. Sustainability 2017, 9, 2035. https://doi.org/10.3390/su9112035
Tian Y, Liu Y, Jin J. Effect of Irrigation Schemes on Forage Yield, Water Use Efficiency, and Nutrients in Artificial Grassland under Arid Conditions. Sustainability. 2017; 9(11):2035. https://doi.org/10.3390/su9112035
Chicago/Turabian StyleTian, Yuhong, Yiqing Liu, and Jianjun Jin. 2017. "Effect of Irrigation Schemes on Forage Yield, Water Use Efficiency, and Nutrients in Artificial Grassland under Arid Conditions" Sustainability 9, no. 11: 2035. https://doi.org/10.3390/su9112035
APA StyleTian, Y., Liu, Y., & Jin, J. (2017). Effect of Irrigation Schemes on Forage Yield, Water Use Efficiency, and Nutrients in Artificial Grassland under Arid Conditions. Sustainability, 9(11), 2035. https://doi.org/10.3390/su9112035