Article

Sustainable Cultural Tourism in Urban Destinations: Does Space Matter?

1
School of Engineering, University of the Basque Country UPV/EHU, Alameda de Urquijo, 48013 Bilbao, Spain
2
Faculty of Economics and Business, University of the Basque Country UPV/EHU, Avda Lehendakari Agirre 83, 48015 Bilbao, Spain
*
Author to whom correspondence should be addressed.
Sustainability 2016, 8(8), 699; https://doi.org/10.3390/su8080699
Submission received: 14 May 2016 / Revised: 15 July 2016 / Accepted: 18 July 2016 / Published: 25 July 2016
(This article belongs to the Special Issue Sustainable Management in Tourism and Hospitality)

Abstract

:
Policy makers and tourism developers must understand visitors’ mobility behavior and how they consume space and tourism resources in order to set up sustainable cultural tourism destinations. With this in mind, it should also be pointed out that the mobility patterns of tourists in urban destinations are mainly located in the city center (spatial centrality), the analysis of which enables us to define “how central” the resources (museums, monuments, etc.) are and what the interactions between them are. Comprehending which factors influence visitors’ urban mobility behavior is key to understanding tourists’ consumption of space and their connections with the tourism assets of the city. Furthermore, when tourists visit a destination, they make a mental representation of the destination, constructing a mental map of it. Thus, tourists consume not only spaces but also the image of a city/destination. Moreover, the latter influences the former. The quality of surrounding architecture and urbanism plays a crucial role in enhancing the experiential value of a destination and influencing space consumption preferences. Clearly, visitors are more likely to use/consume environments that are easily navigated and mentally legible. In order to explore these patterns, a real experiment was performed based on visitor behavior in the city of Bilbao. In addition, the central places of Bilbao were determined and an analysis of the spatial interaction between cultural sites was performed, making use of a new methodology based on GPS technologies, network analysis, and surveys. This methodology is the main contribution of this work. The results suggest that (1) easy mobility (walkability, accessibility, different transport modes) of the visited space facilitates the tourist experience; (2) simple and eligible mental maps of the city that are easily perceived by visitors facilitate the rapid consumption of the tourist destination; and (3) the centrality of the tourism resources affects the mobility of visitors and the consumption of the destination. Thus, by understanding how tourist mobility works in a destination and analyzing tourism resources’ centrality, policy makers may better tailor sustainable strategies for cultural tourism destinations.

1. Introduction

One of the main challenges in the field of urban tourism research is to understand what factors lead to more sustainable tourism, sustainability in terms of durability of the tourism activity and in terms of economic profitability. Thereby, the purpose of this research is to meet this challenge by analyzing the following factors: the spatial centrality of tourism resources, urban mobility, and the spatial perception of tourists. These factors were selected because they are key factors for the success and sustainability of a destination as they exert influence on the consumption of space by tourists and their mobility, and this in turn influences the economic activity in the city [1]. In addition, the analysis of tourism in urban (or regional) space emphasizes the importance of spatial centrality and agglomeration economies.
Considering the quantitative importance of urban tourism, very little attention has been given to questions concerning how tourists actually use cities [2] and which factors influence their behavior. Following the experiments performed in this study, we argue that people are more likely to use environments that are easily navigated and mentally legible, as observed by Kevin Lynch in 1960 [3]. That is, mental maps of cities that are easily perceived by visitors facilitate the rapid consumption of space.
The structure of the paper is as follows. Section 2 presents the literature review, the conceptual basis for analyzing the relationship between centrality and urban mobility. Section 3 briefly describes the case study. The city of Bilbao was selected as the case study, since Bilbao is an example of how an iconic architectural and urban design can be used as a means of urban regeneration and urban tourism development. Thus, Bilbao is a suitable subject for the analysis of cultural tourism.
In Section 4, the main contribution of this paper—the methodology—is presented. This methodology is based on the use of GPS technologies, network analysis, and surveys in order to determine the central places of Bilbao and analyze the spatial interaction between cultural sites.
Finally, Section 5 is devoted to presenting the results and discussing the main findings, followed by a conclusion and possible future research.

2. Conceptual Basis for Analyzing the Relationship between Centrality, Urban Mobility, and Tourism Sustainability

The main two concepts addressed throughout this paper are centrality and urban mobility, both of which influence on the sustainability of tourism resources. On the one hand, centrality can have different meanings and, in fact, it is used in three different ways throughout this paper: (1) central spaces (intraurban) or spatial centrality; (2) agglomeration of cultural resources; and (3) centrality in a network—that is, a centrality measure of nodes and connections.
Urban mobility, on the other hand, refers, in this paper, to the mobility of tourists. This mobility is influenced by the image (spatial perception) tourists have about the destination [4]. In order to measure tourists’ mobility, the Global Positioning System (GPS) has been made use of. What follows now is the literature review of these concepts.

2.1. Centrality: Agglomeration Economies, Networks, and the New Economic Geography

Centrality is a multifaceted concept, which requires a multidimensional approach, from Agglomeration Economies, to New Economic Geography, passing through Network Theory.
The concept of agglomeration economies goes back to Alfred Marshall [5,6], who used the concept to describe the fact that successful industrial production was often concentrated in space. In this paper, instead of the concentration of industries, the agglomeration is related to the concentration of tourism and cultural resources. This concept is also connected to a certain extent with Central Place Theory (CPT), in which a central place is any location that offers a service or a product to its surrounding market region [7,8,9]. In urban economics, economies of agglomeration are the benefits that firms obtain by locating in proximity to each other (“agglomerating”). This concept relates to the idea of economies of scale, economies of scope and network effects.
Within this view, New Economic Geography provides an integrated and micro-founded modeling approach to spatial economics [10]. Krugman [11] and Fujita and Mori [12] modeled the interaction between geographical centrality as the first advantage for urban agglomeration economies, using a spatial equilibrium framework. They consider that Geographical Centrality creates an advantageous effect for a location, generating a local peak of market potential around this central location. In addition, agglomeration is also related to the notion of attractiveness. Thus, higher concentration implies higher accessibility and power of attraction, and therefore higher centrality. In fact, many authors argue that the attractiveness of localities is one of the most powerful factors for the organization of tourist networks (See the revision made by Urtasun and Gutiérrez [13]).
Several studies have addressed the role of agglomeration in the evolution of tourist activities [14,15,16,17]. The spatial centrality of tourism resources is a major factor of agglomeration as tourists move and consume mainly within the city center. Centrality refers to the centrality in space (city center) and concentration of services (historic and cultural values, artistic and architectural pieces, transport, restaurants, shops, etc.). Accessibility and centrality will determine the success and sustainability of an urban destination, whereas more peripheral locations will incur much higher transaction costs due to (among other factors) higher transportation costs, higher search costs, fewer specialized inputs in production, and fewer specialized local consumer goods [18]. The sources of agglomeration economies include, among others, information economies, density of transportation networks, shared infrastructure, lower accessibility costs, and lower search costs [13,19]. These concepts of agglomeration and transaction cost are quite complex and they cannot be applied directly to tourism, because, for tourists, there are also other important factors, such as their experience at the tourist destination.
In the literature of Network Analysis, the concept of centrality can have a different meaning [20]. In this case, the centrality concept is more related to network features, such as the number of connections, closeness of connections, influence power of a node, and so on. Freeman [21], in 1979, expounded an argument concerning actor centrality and network centrality. In his essay, the concepts of point and graph centrality in social networks were reviewed, examining measures of centrality, both of points and of entire networks. Wasserman and Faust [22] were among the first to provide a comprehensive coverage of the methodology and applications related to social network analysis.
Network analysis is a useful tool for measuring transaction costs, although it has rarely been applied in the field of tourism. However, there are interesting applications, such as the case of Lee et al. [23] and Shih [24]. The first study identifies and classifies villages/towns according to their spatial centralities and their tourism resources, so as to achieve an integrated tourism management. They develop a spatial tourism interaction model for estimation of the weight of the links in the spatial network. Conversely, the second work presents a quantitative method for investigating the network characteristics of drive tourism destinations. This work shows that network analysis is useful for tourism planning: in order to decide where to locate new facilities, what type of facilities to locate, and what kind of themed touring routes to promote. It is also useful for tourism organizations that seek to design successful multi-destination products.

2.2. Urban Mobility

In this subsection, we address the concepts closely related to urban mobility, such as tourist tracking (GPS) and tourists’ spatial perception. With regard to GPS tracking, it is worth mentioning that it was not until May 2000 that the system became available to individuals and for commercial applications across the globe. During the late nineties, the first studies appeared using GPS technology, such as: Quiroga and Bullock [25], who made a travel time study integrating GPS and geographic information system (GIS) technologies. Additionally, Murakami and Wagner [26] analyzed how GPS technology improved upon trip reporting methods.
Thereafter, several researchers have used GPS to track tourists within an urban destination, analyzing their mobility patterns [27,28]. For instance, Lew and McKercher [29] analyzed urban visitor movements, identifying explanatory factors that could influence the intradestination mobility patterns of tourists (time, budget, personal motivations, interests, travel group composition, and knowledge of the destination) and modeling the range of resulting itinerary patterns. McKercher et al. [30] and Kemperman and Joh [31] study movements differentiating between first time visitors and repeat visitors, finding behavior differences specifically with respect to the order of activities chosen. Shoval et al. [32] examined the impact of hotel location on tourist movements, and this study further illustrates the impact of geomorphic barriers on tourist movements. While it is recognized that tourism is a spatially-selective activity, this study illustrates that spatial selectivity is driven largely by hotel location. Wolf et al. [33] used GPS tracking data to differentiate usage levels in tourist sites, in order to acquire an assessment of tourism-related impacts in natural areas.
Alternatively, in sectors like tourism, it is also necessary to measure intangible factors that shape visitor behavior, such as the tourists’ perception of the city. As proposed by Lynch [3], the tourists’ perception of the city—their mental map—is based on five main elements: Paths which represent lines of movements, such as streets; edges which serve as barriers to movement (transition zones, rivers, waterfronts, etc.); districts which are distinctive city areas; nodes which are strategic meeting points where people may pause or meet up (train stations, etc.); and landmarks which are singular objects where people cannot enter. Lynch noted: “Districts are structured with nodes, defined by edges, penetrated by paths, and sprinkled with landmarks” [3].
Lynch’s work, it should be said, has had a major impact to date and many authors have studied the concept of mental maps related to the five aforementioned elements. For instance, Golledge [34] argues that short-term visitors may learn landmarks first, then link paths to landmarks, and then to districts. The identification of such elements is important because of their implications for environmental design, wayfinding, and general behavior—notably in relation to the movement of people in particular environments [35]. There is certainly a considerable amount of information contained within the mental map of a city, on how people perceive space, use space, and ultimately how people create their own space. Urban space morphology and urban design are gradually becoming significant parameters or resources in urban tourism development [36,37,38]. Urban mobility is mainly determined by the urban morphology, transport network, and tourist behavior.

2.3. Tourism Sustainability

Tourism sustainability is a complex concept because of its multidimensional nature [39]. In the literature there are many definitions of tourism sustainability, with one of the most consensual definition being given by the World Tourism Organization [40], describing a tourism which meets the needs of tourists and the host destination, managing all resources in such a way that economic, social, and aesthetic needs can be fulfilled. As mentioned before, this study covers the economic nature of sustainability, in terms of the durability of the tourism activity and in terms of economic profitability.
Regarding the case of museums and their economic potential, more and more cities in both the U.S. and Europe are creating sustainable development strategies, strategies for the sustainability of museums, in which the main influencing factors are the size of the museum, the museum’s type, and management and marketing strategies [41]. For other authors [1,42,43], the sustainability of these strategies also depends on the uniqueness of the building, the quality of the exhibitions, its visibility in the media, and the city’s transportation connectivity.
Other researches have analyzed the relationship between urban mobility and sustainability [44], spatial perception and mobility [45], and the influence of the centrality of tourism resources [1]. All these factors have been addressed in this work as factors which impact sustainability.

3. Case Study: The Guggenheim Museum and the City of Bilbao

In order to address the questions mentioned above, the city of Bilbao was selected as the case study, since Bilbao is an example of how an iconic architectural and urban design (Frank Gehry’s masterpiece) can be used as a means of urban regeneration and urban tourism development [36]. Bilbao has gained fame with the Guggenheim Museum and, therefore, it may be seen as a suitable case study in which to analyze the spatial perception of a destination and its relation to the movements of visitors. The museum attracts an average of 1,000,000 visitors a year, possibly a world record for any third or fourth-tier city [46].
However, how important is the urban space itself for achieving sustainable cultural destinations? Are tourist mobility patterns key for designing sustainable tourism destinations? In order to provide an answer to these questions, a new methodology has been developed, and it is discussed below.

4. Methods

The methodology followed in this research was based on three main steps: firstly, an interview was carried out in order to discover the main sociodemographic data from tourists and their travel purpose. Secondly, the tourists’ movements were collected by means of GPS tracking devices, obtaining high resolution data. Thirdly, the tracking data analysis was performed, detecting the tourism resources visited, developing a spatial network of these resources and applying a statistical analysis to the network. Each of these steps is explained more thoroughly below.
This study was part of a regional survey on tourist movement. The process of sample gathering was conducted by professional pollsters, who approach visitors staying at hotels. The pollsters approached the visitors in the morning, and filled in a questionnaire with the visitors’ characteristics. A GPS device was given to tourists and they carried it with them for the rest of the day. The tracking device was programmed to record their geographical position every two minutes. Once the visitors went back to the hotel, they gave the device back to the reception desk staff. Participants in this study received a gift as a token of gratitude for their collaboration. The hotels were medium-high category and they were selected semi-randomly, provided they were available for this kind of experiment. The duration of the research covered the most important months for cultural tourism—the summer of 2011, July, August, and September. As a result, for the purpose of this study, a valid sample of 51 tracking data was analyzed.
The tracking data base was linked with the open access Points of Interest (POI) data base, the Open Data Euskadi [47]. This data base provided a detailed description of tourism resources such as museums, monuments, etc., including geographical coordinates. With regard to movement processing, first a data filtering was carried out. This removed erroneous track points and rendered the tracking of each visitor comparable. Then, each GPS log was divided into visits to cultural POIs. To this end, the stop points were identified, and if the visitor spent more than 10 min within the area of influence of the POI, it was understood that the visitor was visiting the POI. To define the area of influence of the POI, the category of the POI was taken into account. To establish stop points, the loss of signal was taken into account, as this usually occurred when people entered a building. After these pre-processed tasks, the visit duration was calculated.
Thereafter, having registered the visited POIs, a network of tourism resources was built, in order to analyze the spatial tourism interaction. Thus, the visited POIs were represented by the nodes and a link was drawn between two nodes, in the case that the tourist visited both of them.
Following this, the network analysis was performed. Briefly explained, a network is mainly composed of a set of nodes and links. Nodes represent individual entities within the network and links represent relationships between the individuals. Thus, spatial network analysis examines the structure of relationships between spatial entities. Network analysis, which is derived from graph theory, attempts to describe the structure of relationships between given entities and applies a quantitative technique to produce relevant indicators and results for the study of characteristics of an entire network, and the position of individual entities within the network structure [24].
In this study, the entities are cultural POIs of Bilbao, and the links represent the relationship between them. It is considered that there is a relationship between two POIs if the tourists visit both of them. Thus, the performed network is formed by 15 nodes or tourism POIs and the 20 links between them. This network of POIs is undirected and no weight is applied.
Furthermore, in this network analysis, four centrality indices (i.e., degree, betweenness, closeness, and eigenvector centralities) were estimated to identify the degree, accessibility, distance, and influence on surrounding cultural POIs. As defined by Freeman in 1979 [21], degree centrality is a count of the number of direct connections of a node. Taking into account the adjacency matrix of the graph (network), the degree centrality of a node (or vertex) j could be calculated as: C DEG ( j ) = i a ij , where a ij are the values of the adjacency matrix. Thus, a ij takes the value 1 if the edge ( i , j ) exists and the value 0 if it does not.
The betweenness centrality measures the accessibility of a node, taking into account if the node is located on the shortest path between the remaining nodes. The betweenness centrality of a node i is given by the expression: C BET ( i ) = j , k b jik b jk , where b jk is the number of shortest paths from node j to node k, and b jik is the number of shortest paths from j to k, passing through the node i.
With regard to closeness centrality, this is a distance measurement between one node and all other nodes. Formally, the closeness of a node i is defined as C CLO ( i ) = j = 1 n ( S ) ij , where S is the matrix of network distances; that is, the matrix whose elements ( i , j ) correspond to the shortest distance from node i to node j.
Last but not least, the eigenvector centrality is a measure of the importance or influence of a node in a network, and it is based on the idea that a node is more central if it is related to nodes that are themselves central [48]. When calculating the eigenvector, it must be taken into account that each connected node is differently weighted, depending on their connections. Thus, the eigenvector score of node v can be defined as: x v = 1 λ t M ( v ) x t =   1 λ t G a v , t x t where M ( v ) is a set of the neighbors of v , λ is a constant and A = ( a v , t ) is the adjacency matrix.
Another interesting index of the network is the average path length (between reachable pairs). This is, the average number of steps along the shortest paths for all possible pairs of network nodes. It stands for a measure of the efficiency of transport on a network. In order to calculate the centrality measures, the network analysis software Gephi [49] was used.

5. Results and Discussion

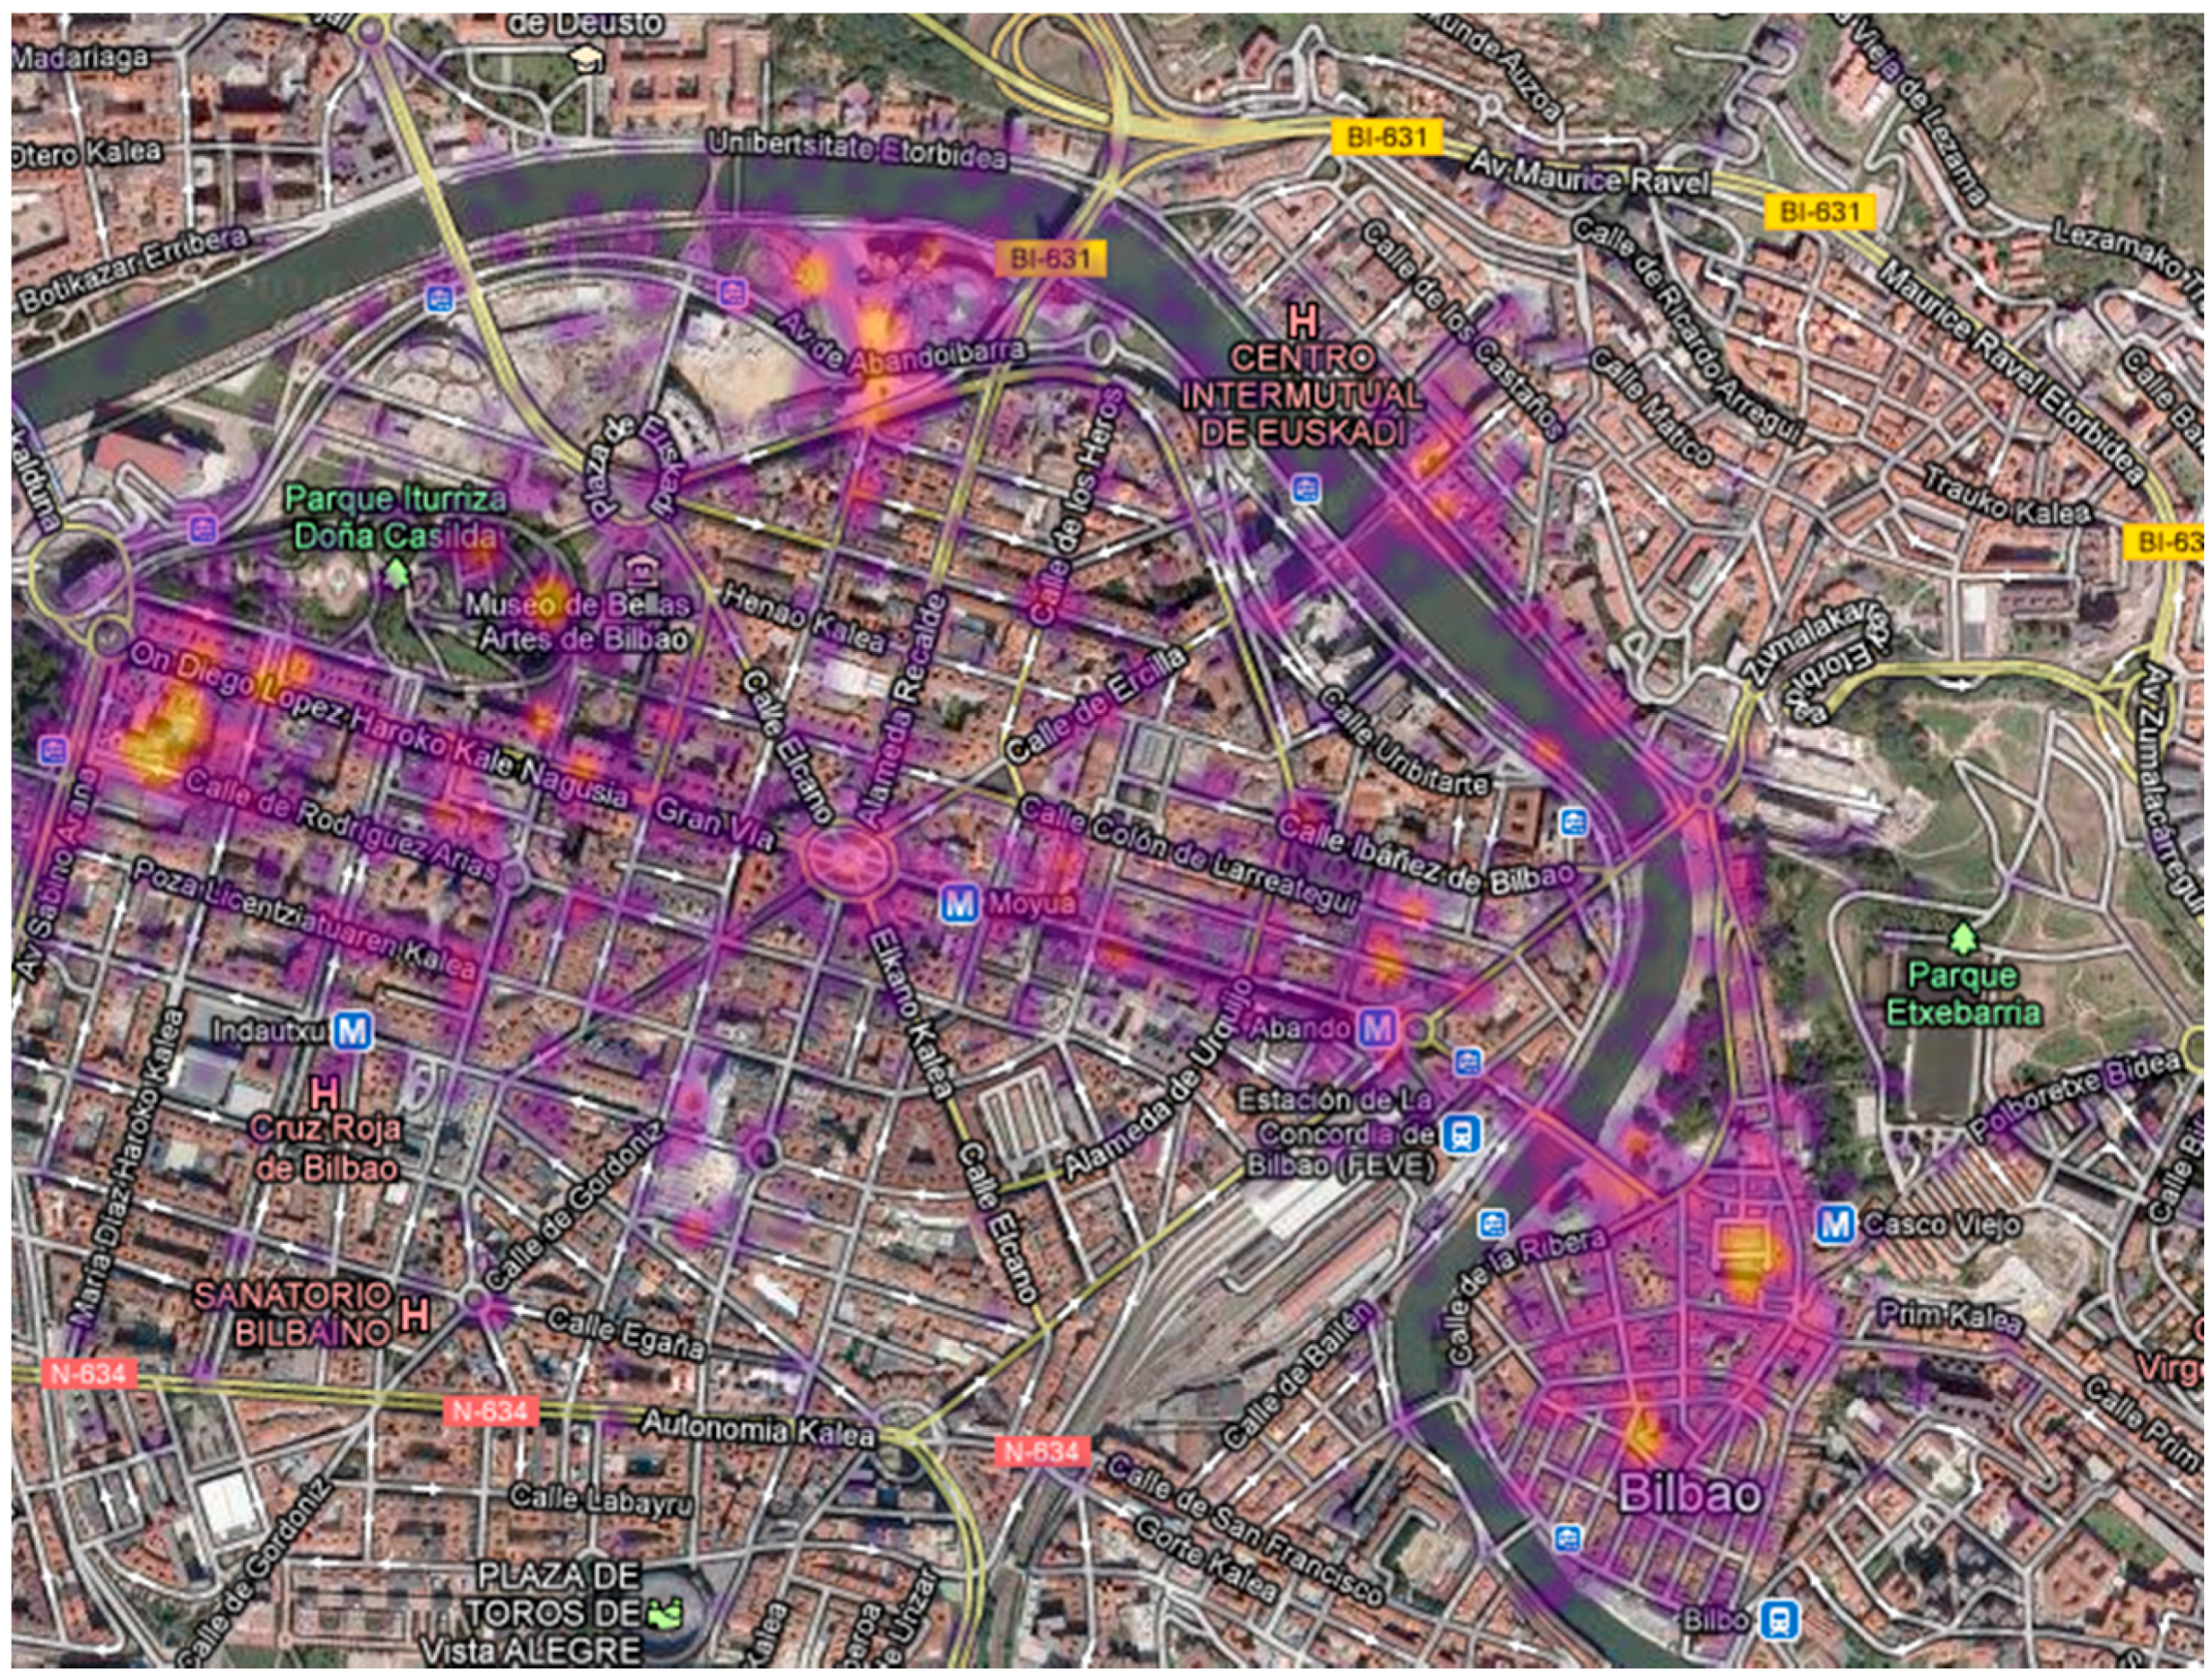
The results obtained can be summarized in the following figures and tables. In Figure 1, all the tracking points recorded with the GPS devices are displayed. The tracking points are recorded every 2.5 min. So, the heat map gives an idea of the consumption of the spaces. As can be seen in this heat map, many of the hot spots are related to the locations of the museums and monuments previously mentioned (Guggenheim, Old Town). These cultural sites are located in the city center. This supports the suggestions by Plaza and Haarich [1], which state that cultural tourism requires a certain degree of urban geographic centrality.
As can be seen in Figure 1, most of the tracking points are located in two districts (Old Town and Abandoibarra), and about 80% of movements take place within these two areas. Therefore, we can say that urban tourists move mainly in the center of the city and therefore consume resources that are in the center.

5.1. GPS Data Analysis

Taking into account the visited POIs detected, a descriptive analysis was carried out in order to better understand the sample and in order to study the influence of different variables on the mobility and the consumption of cultural resources (see Table 1). As can be seen in Table 2, according to the sample, 54.9% of visitors visit some or other cultural site, hence making this a good case study in which to analyze cultural tourism.
For the analysis of cultural tourism in Bilbao, the most appropriate time periods are weekends in Summer because this is the period when Business tourism has less influence on the total tourism activity. In Table 3, the most visited cultural sites by the visitors of the sample are listed, indicating for each one the percentage of visitors and the mean length of visits.
From Table 3, it should be noted that the Guggenheim is not the only principal cultural site, but there are other POIs in the Old Town, such as the Plaza Nueva or the Cathedral of Santiago which are also very popular. With regard to the duration of the visits of the sample, the length of visits to the Guggenheim museum is among the longest. There is one other site with a longer visit duration, the “Palacio de John (Edificio La Bolsa)”, which nowadays is a social and cultural center.
After having analyzed the cultural POIs, Table 4 highlights the influence of tourists’ profiles on the duration of visits. Visitors within the 25–39 age range appear to carry out longer visits than older visitors. Regarding the purpose of travelling, visitors motivated by leisure made longer cultural visits than the others. Examining the travelling party reveals that visitors who travel alone made longer cultural visits. As far as nationality is concerned, it seems that international visitors tend to visit more cultural sites than national ones.
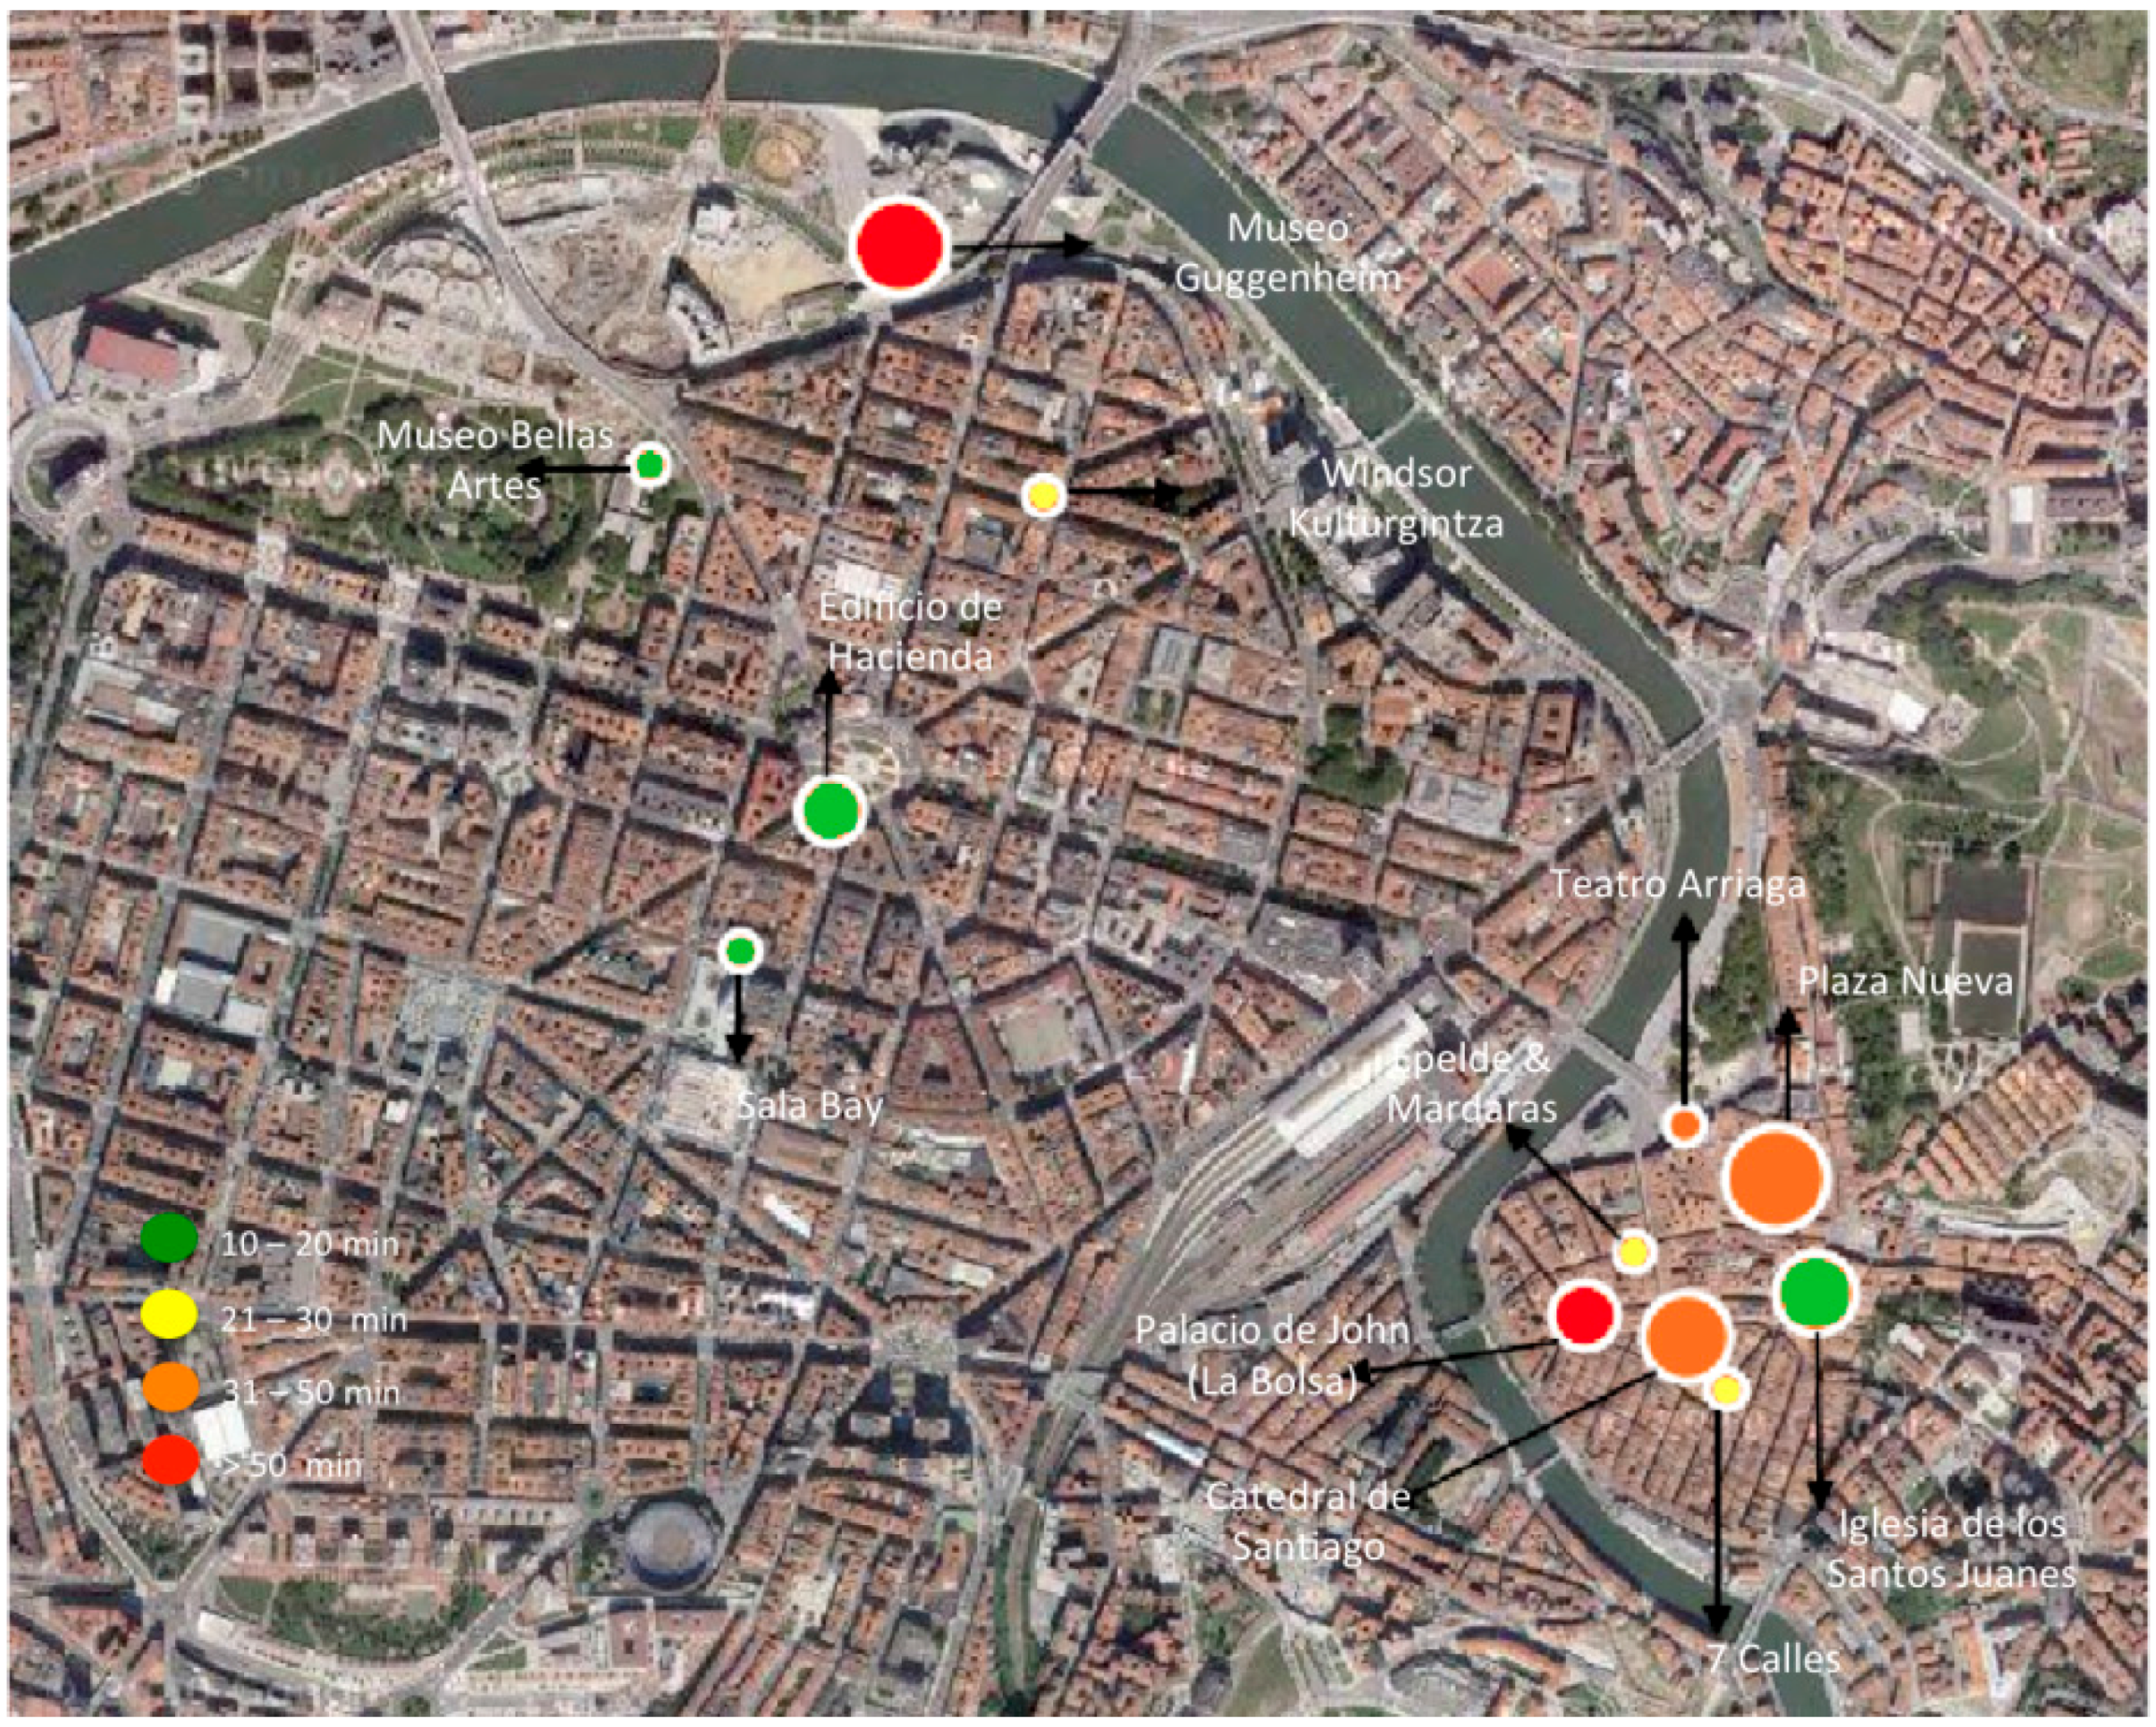
In Figure 2, the visits to the cultural resources have been summarized. This is another way to show the time–space consumption. On this map, the most visited cultural sites from Bilbao are represented by a circle. Note that the size of the circles is proportional to the number of visits for each cultural site, and the length of the visits is shown by the color of the circles. As can be seen, the longest visits are related to the Guggenheim museum and the “Palacio de John (Edificio La Bolsa)”.

5.2. POI Network Analysis

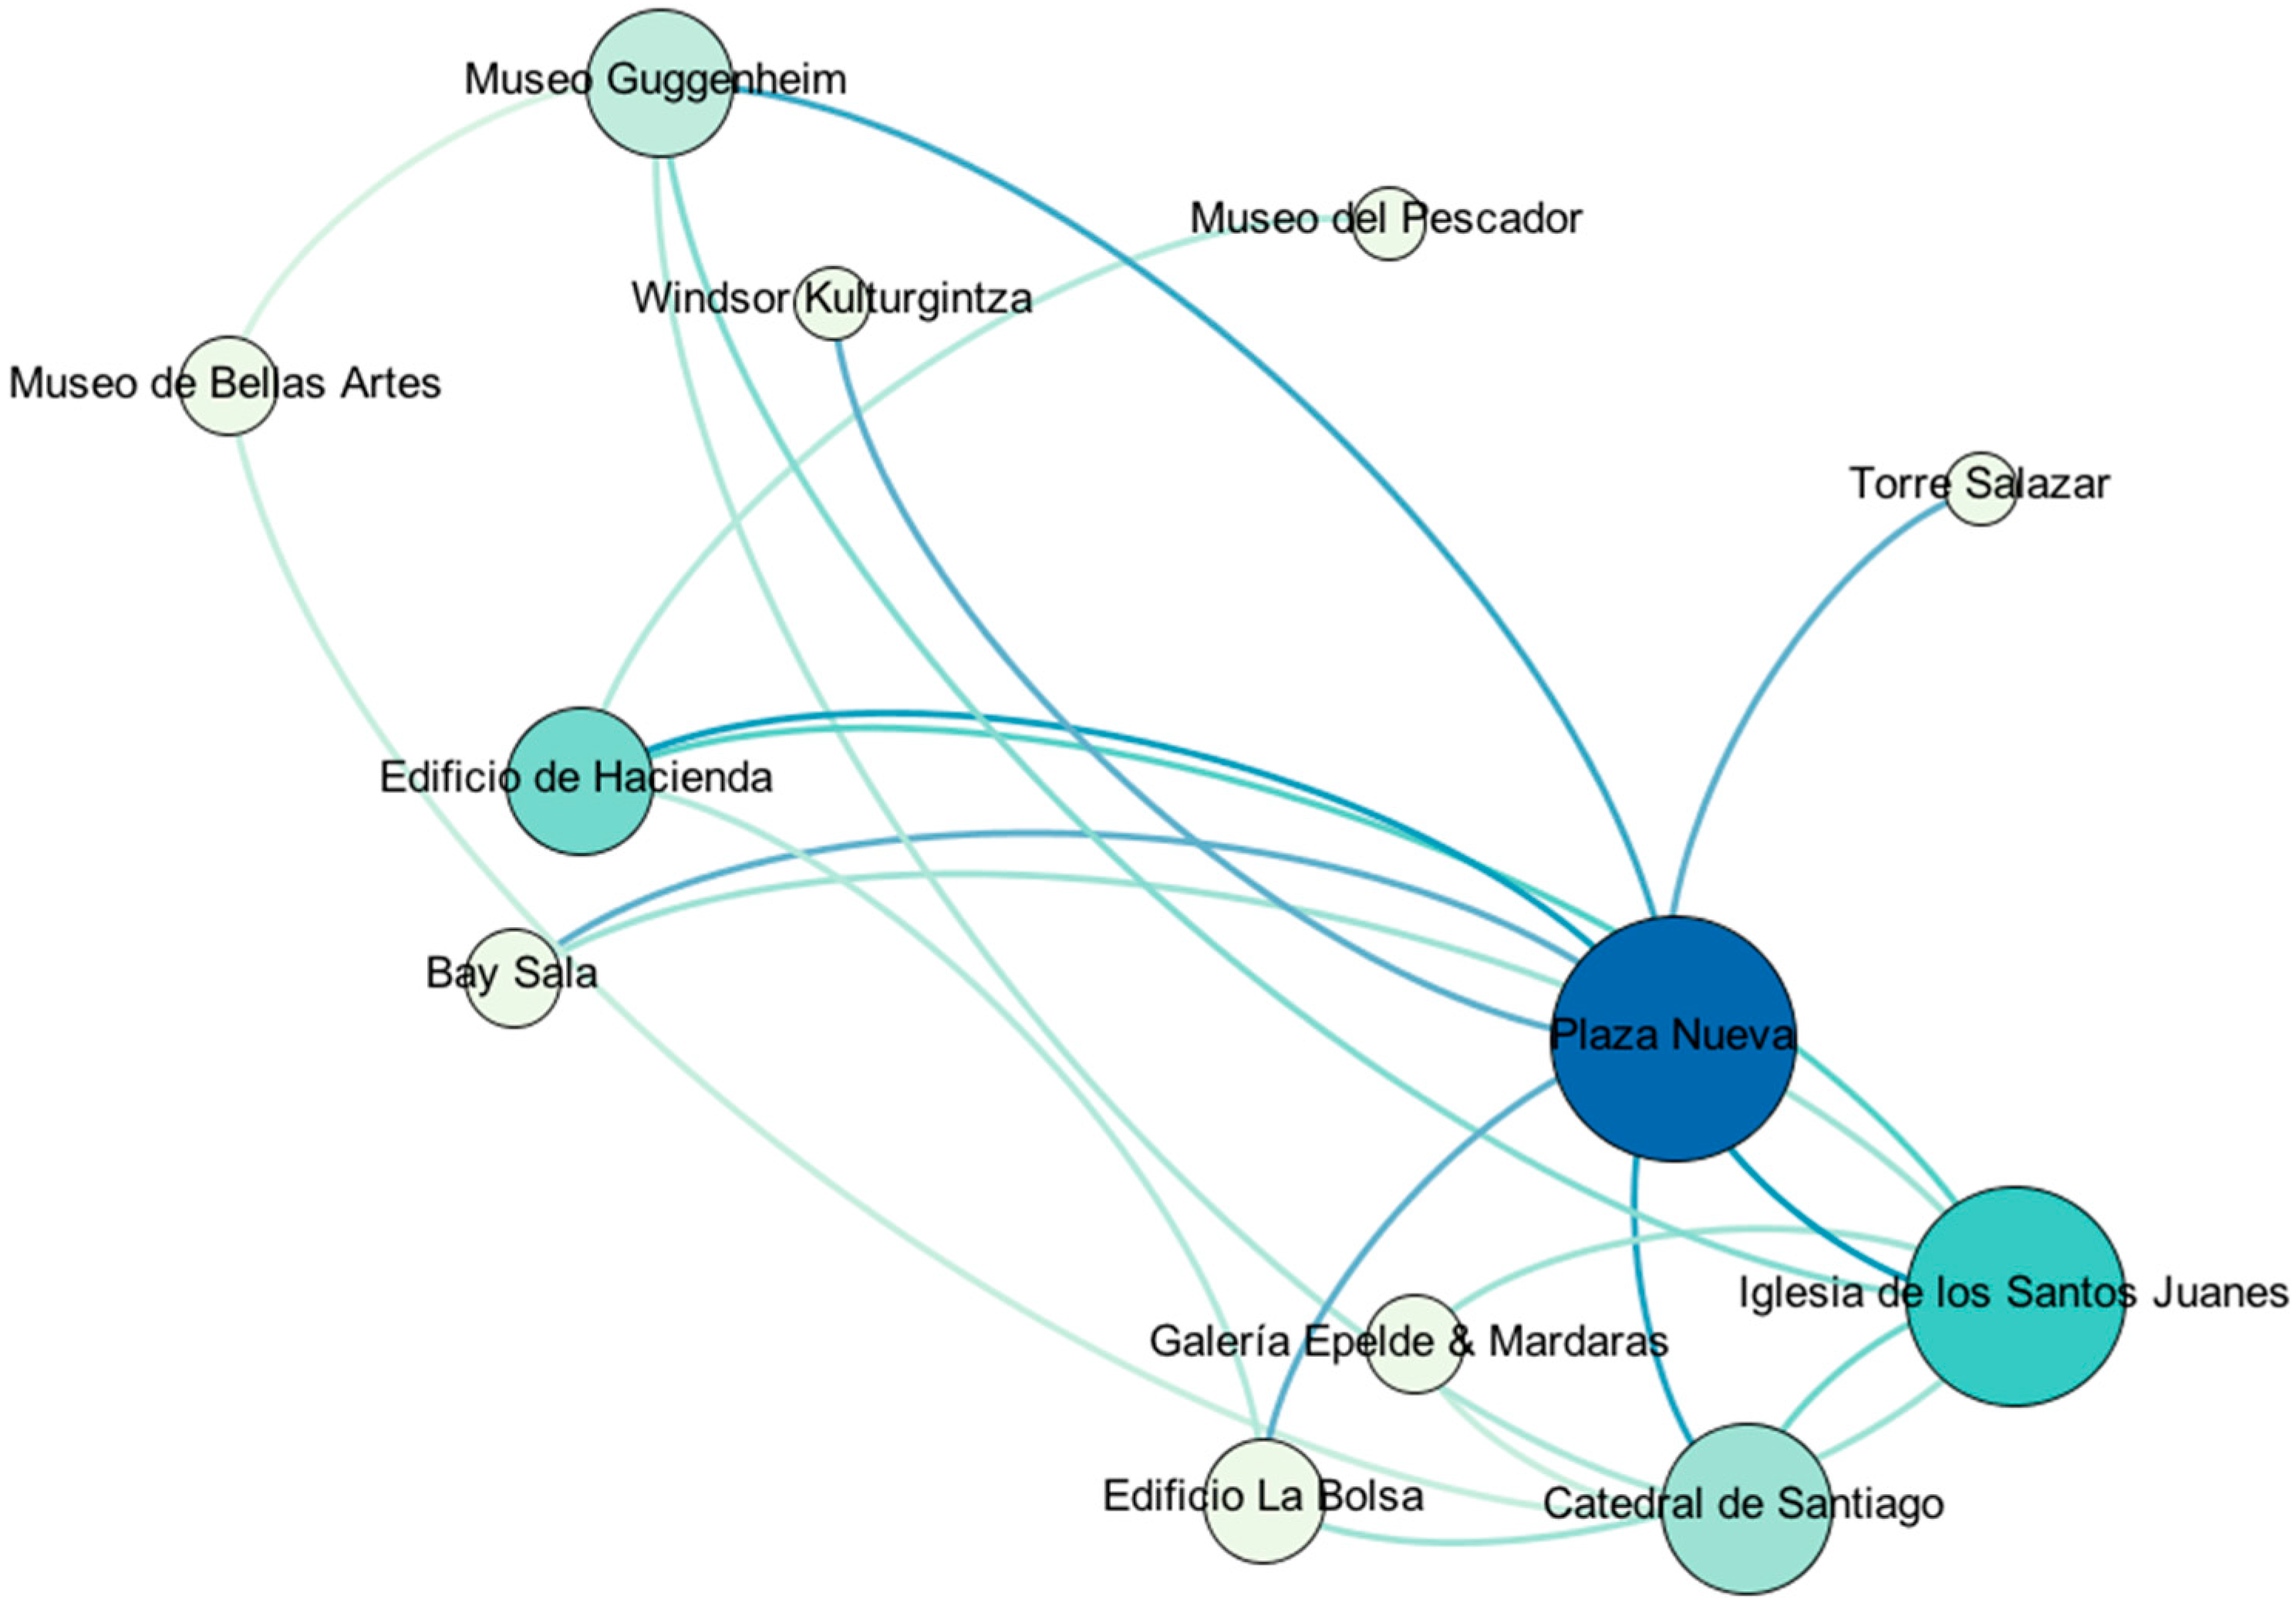
After analyzing the consumption of space by tourists in Bilbao through the GPS tracking data and the detection of visited tourism resources (calculating frequency and duration of the visits), a network analysis was performed (Figure 3) in order to analyze the spatial centrality of the most visited cultural POIs and the spatial interaction between them.
In Figure 3, note that the size of the nodes is proportional to the degree of centrality measurement—namely, the number of direct connections of each node; the color represents the betweenness centrality value of each node (explained later). Thus, regarding the depicted network it can be said that the most central places of Bilbao are those situated in the Old Town (“Plaza Nueva”, “Iglesia Santos Juanes”, and “Catedral de Santiago”), the “Edificio de Hacienda” which is situated in the main high street of Bilbao, and the “Guggenheim Museum”, whose power of attraction situates it in a central place despite being one of the most distant locations from the most visited POIs.
The spatial centrality indices calculated are the following:
As far as degree of centrality is concerned, Plaza Nueva has the highest nDegree (57.14 over 100). This means that 57% of the visitors who visit “Plaza Nueva” visit the remaining 57% of the POIs as well. Any nDegree greater than 20 becomes an interesting POI, such as n12, n6, n3, n4, n10 and n11 in Table 5.
Looking at the betweenness measure, Plaza Nueva has the highest nBetweenness (29.12 over 100). This means that 29% of the visitors (who take the shortest path-length) pass through the “Plaza Nueva” at some point. Any nBetweenness bigger than 0 becomes an interesting POI, such as n12, n6, n4, n3, n10, because all these nodes lie on the shortest path “between” two other nodes. In a way this is measuring the “accessibility” of the nodes within the routes.
With regard to the closeness centrality, this includes not only the direct links of a node, but in fact all the indirect links to all other nodes in the network. Not surprisingly, the nodes have quite a similar nCloseness, which makes sense considering that the center of Bilbao is not a large territory, in which times even for walking distances are short.
Taking into account the main research goal, the two main indices with which to measure the centrality of tourism resources are the average path length and the eigenvector value. On the one hand, the average path length shows how compact the network is and what the average number of nodes is to connect any pair of nodes. In this case, the average path length = 1.92. This means that the tourism resources are concentrated in a small area, and more specifically in the city center. This may also reflect the high walkability of the consumed spaces, implying that the destination is easily navigated and mentally legible.
The eigenvector reflects the importance of relationships or connections and it is indicative of the influence of the node. Regarding the eigenvector values, any resource with an eigenvector value > 0.5, should be taken into account. So, according to the eigenvector values, the most influential POIs are: “Plaza Nueva” (n12), “Catedral de Santiago” (n3), “Iglesia de los Santos Juanes” (n6), and “Guggenheim Museum” (n10). This means, besides being the most important nodes, they are also well interconnected. Therefore, these nodes must be considered as the central places of Bilbao. Taking into account all the centrality indices together, the case of “Edificio de Hacienda” (n4) stands out. Although n4 has a higher betweenness centrality value than n3 and n10, its eigenvector value is lower than n3 and n10. From this it can be concluded that the POIs around n4 are less known and less visited. Another case worthy of mention is the “Museo de Bellas Artes” (n7). Even though n7 is relatively close to the Guggenheim Museum, it has one of the lowest closeness centrality values among all the POIs.

5.3. Mental Maps: The Spatial Perception of the Tourists

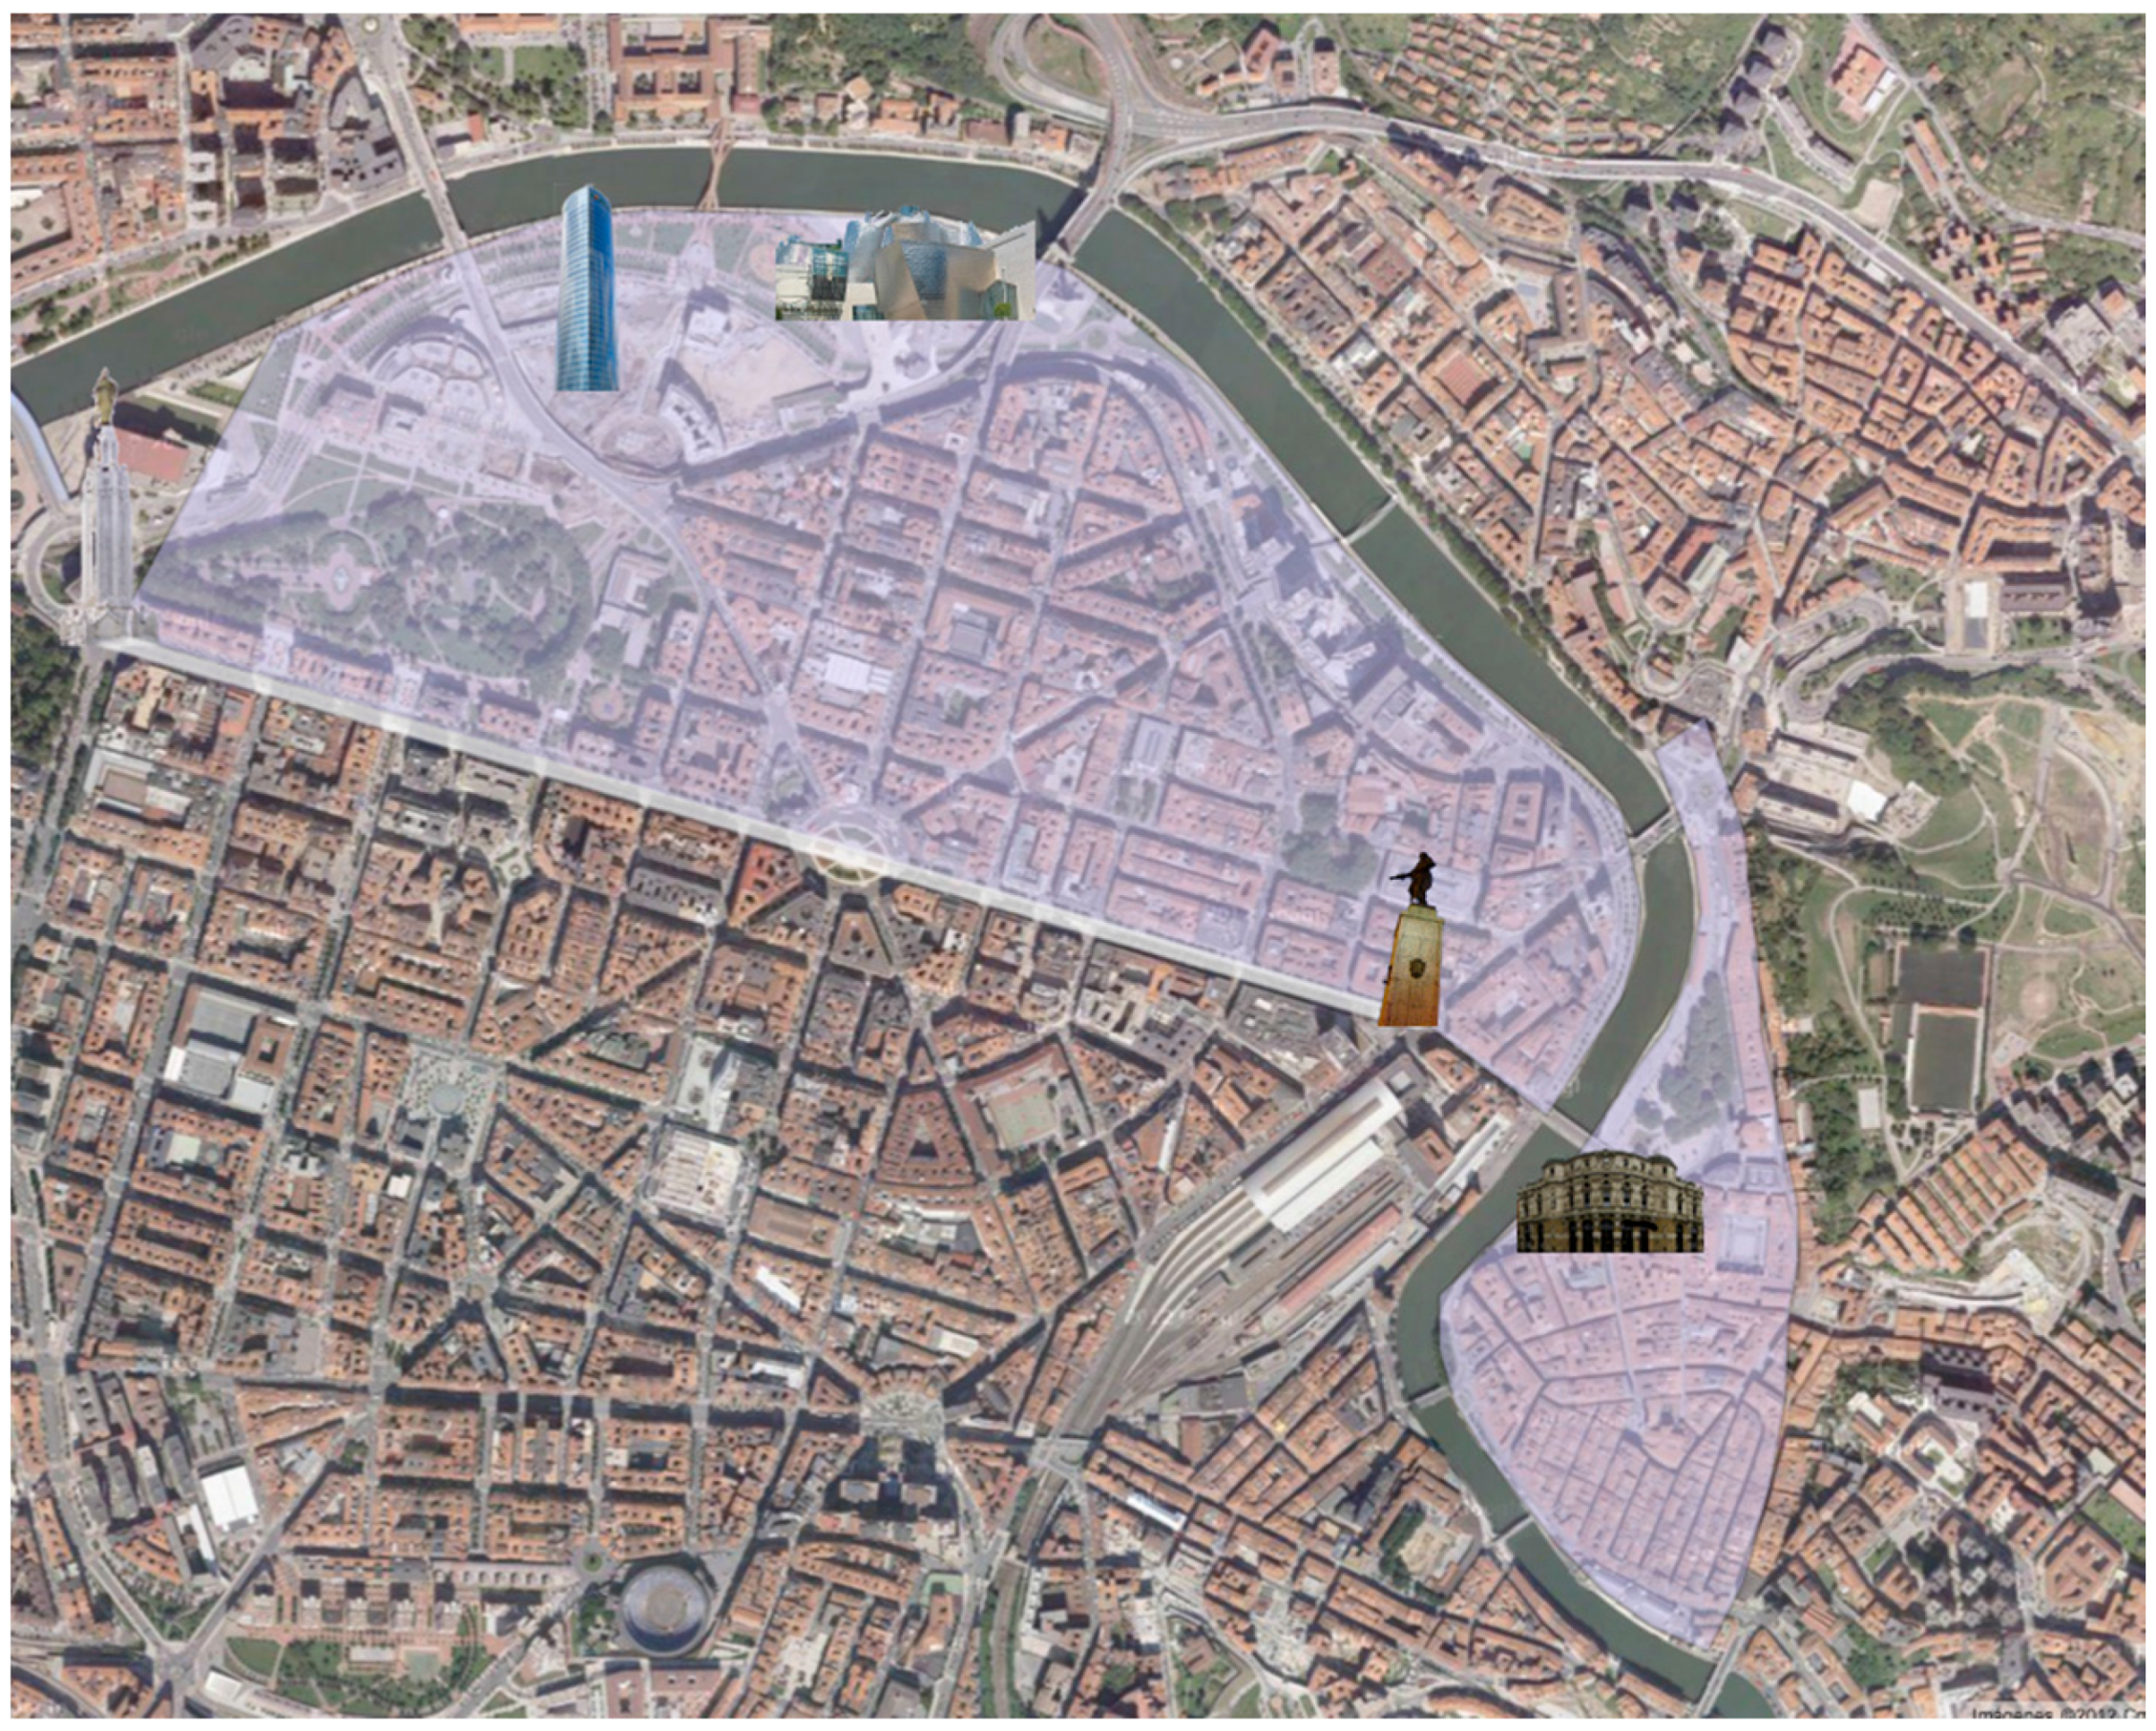
Returning to Lynch’s theory of tourist’s perception of the city from the literature review section, in Figure 4 the main Lynch elements of Bilbao are drawn. These have been selected on the basis of the highest frequency of visits. The main elements identified are the following:
  • Landmarks: Sagrado Corazón, Plaza Circular, Iberdrola tower (the tower was under construction when the tracking took place)
  • Nodes: Guggenheim Museum, Arriaga Theatre
  • Edges: The river
  • Districts: Old Town, Abandoibarra
  • Paths: Gran Via, Riverside
The image of the city space perceived from these elements is relatively simple, and it can be represented with a simple shape (“D-shaped”). This implies that Bilbao as a tourist destination has a simple legibility. Furthermore, examining the tourist maps supplied by the Bilbao tourist offices reveals that about 60% of POIs marked on the map belong to the two main areas analyzed: the Old Town and Abandoibarra. Thus, the visitors integrate the spatial elements of the city and the information of the city that they consume, and each visitor generates their own mental map of the city. To extract a general mental map is not easy, but it can be said (as has been seen in Figure 1 and Figure 3) that the mobility of the tourists is closely associated with these spatial elements and with the consumed information, so mobility is somehow related with the mental map of the visitors.

6. Conclusions

This research has revealed the importance of understanding visitors’ mobility and their spatial perception, in order to develop and manage sustainable cultural tourism in urban areas. Tourist movements recorded by smartphone GPS enabled the analysis of city space consumption. Moreover, this analysis highlights how visitors perceive the city. As can be seen in the results, the destination consumption is strongly influenced by the centrality of tourism resources. The results also suggest that tourists’ spatial perception affects the mobility of visitors and the consumption of the destination, but causality is not proven in this work and requires further research.
The results suggest that:
First, economic sustainability of urban tourism destinations depends on the centrality of the tourism resources, which determines the mobility patterns of visitors and their consumption of the destination. The consumers who make up the cultural tourism market are often well-educated individuals, and their time has a high opportunity cost. Thus, cultural tourists are highly selective with regard to their cultural destinations [51], and also highly selective of their consumption of time and space. Thus, due to the high opportunity cost of travel, cultural tourists consume places and experiences intensively, in short windows of time. They often condense their trips into short weekends. As such, the spatial layout and accessibility of sites play important roles in attracting their visits. Cultural sites must be easily accessible, located within 30–45 min walking distance from any important point of the city center [1].
Second, simple and eligible mental maps of the city that are easily perceived by visitors facilitate the rapid consumption of the tourist destination. It is worth noting that the mental map of Bilbao is relatively simple. This implies that consumption is relatively fast and tourists’ stay in the city tends to be brief. Therefore, in order to extend the stay of visitors in destinations it is necessary for the destination to offer events and/or activities. There are studies measuring the impact of events that support this idea. Some examples of successful events could be the Oktoberfest in Munich, the Biennale of Venice, the BBKLive festival in Bilbao, or Copenhagen’s Fashion Week.
Third, centrality and urban mobility directly impact the environmental sustainability of cultural tourism. The centrality of tourism resources reduces the transportation costs because of the closeness of resources. This source of agglomeration economies includes lower accessibility costs, shared infrastructure, and higher density of transportation networks.
Fourth, methodologically speaking both GPS tracking and Network Analysis methods generate the exact same results. In other words, the GPS outcomes match the Network Analysis outcomes regardless of quantitative differences in calculation procedures, although the network analysis provides further information on the spatial interaction between POIs and the spatial perception of the tourists.
Finally, the agenda for future research requires the repetition of this experiment with different cities, in order to more accurately determine the influence of mental maps on tourist behavior. Future studies may also enable us to shed light on the factors that determine these mental maps, in order to foster the growth of tourism. This may also help us to see whether or not mobility patterns could be improved, and whether all the above aspects are critical for achieving a sustainable and effective tourism destination.

Acknowledgments

The authors acknowledge the financial support from the Ministry of Economy and Competitiveness (MINECOR 2015 CREA-NETWORK CSO2015-65265-C4-3-R). The Art4pax Foundation (Guernica) and the Basque Government (SAIOTEK) provided support for this project. We are grateful to BASQUETOUR (Basque Agency of Tourism), CICtourGUNE and to Silke Haarich (Germany) who kindly read an early draft of the article. They are not responsible for our interpretations.

Author Contributions

All authors contributed equally to this work. All authors read and approved the final manuscript.

Conflicts of Interest

The authors declare no conflict of interest.

Abbreviations

The following abbreviations are used in this manuscript:
GPSGlobal Positioning System
CPTCentral Place Theory
POIPoint of Interest
GISGeographic Information System

References

  1. Plaza, B.; Haarich, S.N. A Guggenheim-Hermitage Museum as an Economic Engine? Some Preliminary Ingredients for its Effectiveness. Transform. Bus. Econ. 2010, 9, 128–138. [Google Scholar]
  2. Ashworth, G.; Page, S.J. Urban tourism research: Recent progress and current paradoxes. Tour. Manag. 2011, 32, 1–15. [Google Scholar] [CrossRef]
  3. Lynch, K. The Image of the City; The M.I.T. Press: Cambridge, UK, 1960; p. 194. [Google Scholar]
  4. Plaza, B.; González-Casimiro, P.; Moral-Zuazo, P.; Waldron, C. Culture-led city brands as economic engines: Theory and empirics. Ann. Reg. Sci. 2015, 54, 179–196. [Google Scholar] [CrossRef]
  5. Marshall, A. Industry and Trade; Macmillan & Co.: London, UK, 1919. [Google Scholar]
  6. Marshall, A. Principles of Economics, 8th ed.; Macmillan & Co.: London, UK, 1920. [Google Scholar]
  7. Christaller, W. Central Places in Southern Germany; Translation into English by Carlisle W. Baskin in 1966; Prentice-Hall: Englewood Cliffs, NJ, USA, 1933. [Google Scholar]
  8. Lösch, A.; Woglom, W.H.; Stolper, W.F. The Economics of Location; Yale University Press: New Haven, CT, USA, 1954; Volume 1940. [Google Scholar]
  9. Berry, B.J.L.; Parr, J.B.; Epstein, B.J.; Ghosh, A.; Smith, R.H.T. Market Centers and Retail Location: Theory and Applications; Prentice Hall: Englewood Cliffs, NJ, USA, 1988. [Google Scholar]
  10. Fujita, M.; Krugman, P.R.; Venables, A.J. The Spatial Economy: Cities, Regions and International Trade; The M.I.T. Press: Cambridge, MA, USA, 1999; Volume 213. [Google Scholar]
  11. Krugman, P. First nature, second nature, and metropolitan location. J. Reg. Sci. 1993, 33, 129–144. [Google Scholar] [CrossRef]
  12. Fujita, M.; Mori, T. The role of ports in the making of major cities: Self-agglomeration and hub-effect. J. Dev. Econ. 1996, 49, 93–120. [Google Scholar] [CrossRef]
  13. Urtasun, A.; Gutiérrez, I. Tourism agglomeration and its impact on social welfare: An empirical approach to the Spanish case. Tour. Manag. 2006, 27, 901–912. [Google Scholar] [CrossRef]
  14. Song, H.; Dwyer, L.; Li, G.; Cao, Z. Tourism economics research: A review and assessment. Ann. Tour. Res. 2012, 39, 1653–1682. [Google Scholar] [CrossRef] [Green Version]
  15. Novelli, M.; Schmitz, B.; Spencer, T. Networks, clusters and innovation in tourism: A UK experience. Tour. Manag. 2006, 27, 1141–1152. [Google Scholar] [CrossRef]
  16. Bernini, C. Convention industry and destination clusters: Evidence from Italy. Tour. Manag. 2009, 30, 878–889. [Google Scholar] [CrossRef]
  17. Zhang, Y.; Qu, H.; Guo, Y. A study of the agglomeration of China’s convention industry: An economic and neoeconomic geography framework approach. Tour. Econ. 2011, 17, 305–319. [Google Scholar] [CrossRef]
  18. Johansson, B.; Quigley, J.M. Agglomeration and networks in spatial economies. In Fifty years of Regional Science; Springer: Berlin, Germany, 2004; pp. 165–176. [Google Scholar]
  19. Henderson, J.V. Community development: The effects of growth and uncertainty. Am. Econ. Rev. 1980, 70, 894–910. [Google Scholar]
  20. Scott, J.P. Social Network Analysis: A Handbook; SAGE Publications: Thousand Oaks, CA, USA, 2000. [Google Scholar]
  21. Freeman, L.C. Centrality in social networks: Conceptual clarification. Soc. Netw. 1979, 1, 215–239. [Google Scholar] [CrossRef]
  22. Wasserman, S.; Faust, K. Social Network Analysis: Methods and Applications, 1st ed.; Cambridge University Press: Cambridge, UK, 1994. [Google Scholar]
  23. Lee, S.-H.; Choi, J.-Y.; Yoo, S.-H.; Oh, Y.-G. Evaluating spatial centrality for integrated tourism management in rural areas using {GIS} and network analysis. Tour. Manag. 2013, 34, 14–24. [Google Scholar] [CrossRef]
  24. Shih, H.-Y. Network characteristics of drive tourism destinations: An application of network analysis in tourism. Tour. Manag. 2006, 27, 1029–1039. [Google Scholar] [CrossRef]
  25. Quiroga, C.A.; Bullock, D. Travel time studies with global positioning and geographic information systems: An integrated methodology. Transp. Res. Part C Emerg. Technol. 1998, 6, 101–127. [Google Scholar] [CrossRef]
  26. Murakami, E.; Wagner, D.P. Can using global positioning system (GPS) improve trip reporting? Transp. Res. Part C Emerg. Technol. 1999, 7, 149–165. [Google Scholar] [CrossRef]
  27. Lau, G.; McKercher, B. Understanding tourist movement patterns in a destination: A GIS approach. Tour. Hosp. Res. 2006, 7, 39–49. [Google Scholar] [CrossRef]
  28. Modsching, M.; Kramer, R.; ten Hagen, K.; Gretzel, U. Using location-based tracking data to analyze the movements of city tourists. J. Inform. Technol. Tour. 2008, 10, 31–42. [Google Scholar] [CrossRef]
  29. Lew, A.; McKercher, B. Modeling Tourist Movements. A Local Destination Analysis. Ann. Tour. Res. 2006, 33, 403–423. [Google Scholar] [CrossRef]
  30. McKercher, B.; Shoval, N.; Ng, E.; Birenboim, A. First and Repeat Visitor Behaviour: GPS Tracking and GIS Analysis in Hong Kong. Tour. Geogr. Int. J. Tour. Space Place Environ. 2012, 14, 147–161. [Google Scholar] [CrossRef]
  31. Kemperman, A.D.A.M.; Joh, C.H. Comparing first time and repeat visitors activity patterns. Tour. Anal. 2003, 8, 159–164. [Google Scholar] [CrossRef]
  32. Shoval, N.; McKercher, B.; Ng, E.; Birenboim, A. Hotel location and tourist activity in cities. Ann. Tour. Res. 2011, 38, 1594–1612. [Google Scholar] [CrossRef]
  33. Wolf, I.D.; Hagenloh, G.; Croft, D.B. Visitor monitoring along roads and hiking trails: How to determine usage levels in tourist sites. Tour. Manag. 2012, 33, 16–28. [Google Scholar] [CrossRef]
  34. Golledge, R.G. Learning about urban environments. Timing Space Spacing Time 1978, 1, 76–98. [Google Scholar]
  35. Walmsley, D.J.; Jenkins, J.M. Mental maps, locus of control, and activity: A study of business tourists in coffs harbour. J. Tour. Stud. 1991, 2, 36–42. [Google Scholar]
  36. Gospodini, A. Urban Design, Urban Space Morphology, Urban Tourism: An Emerging New Paradigm Concerning. Eur. Plan. Stud. 2001, 9, 925–934. [Google Scholar] [CrossRef]
  37. Heidenreich, M.; Plaza, B. Renewal through culture? The role of museums in the renewal of industrial regions in Europe. Eur. Plan. Stud. 2015, 23, 1441–1455. [Google Scholar] [CrossRef]
  38. Franklin, A. Journeys to the Guggenheim Museum Bilbao: Towards a revised Bilbao Effect. Ann. Tour. Res. 2016, 59, 79–92. [Google Scholar] [CrossRef]
  39. Fernández, J.I.P.; Sanchez Rivero, M. Measuring tourism sustainability: Proposal for a composite index. Tour. Econ. 2009, 15, 277–296. [Google Scholar] [CrossRef]
  40. Manning, T. What Tourism Managers Need to Know: A Practical Guide to the Development and Use of Indicators of Sustainable Tourism; World Tourism Organization Pubns: Madrid, Spain, 1996. [Google Scholar]
  41. Pop, I.L.; Borza, A. Factors Influencing Museum Sustainability and Indicators for Museum Sustainability Measurement. Sustainability 2016, 8, 101. [Google Scholar] [CrossRef]
  42. Plaza, B. The return on investment of the Guggenheim Museum Bilbao. Int. J. Reg. Res. 2006, 30, 452–467. [Google Scholar] [CrossRef]
  43. Plaza, B.; Haarich, S.N. The Guggenheim Museum Bilbao: Between regional embeddedness and global networking. Eur. Plan. Stud. 2015, 23, 1456–1475. [Google Scholar] [CrossRef] [Green Version]
  44. Cohen, S.A.; Higham, J.E.S.; Stefan, G.; Peeters, P. Understanding and Governing Sustainable Tourism Mobility: Psychological and Behavioural Approaches; Routledge: Abingdon, UK, 2014; Volume 43. [Google Scholar]
  45. Dias, P.; Ramadier, T. Social trajectory and socio-spatial representation of urban space: The relation between social and cognitive structures. J. Environ. Psychol. 2015, 41, 135–144. [Google Scholar] [CrossRef]
  46. Plaza, B. The Bilbao effect (Guggenheim Museum Bilbao). Music News 2007, 86, 13–17. [Google Scholar]
  47. Gobierno, V. Open Data Euskadi. Available online: http://opendata.euskadi.eus (accessed on 15 July 2016).
  48. Ruhnau, B. Eigenvector centrality a node centrality? Soc. Netw. 2000, 22, 357–365. [Google Scholar] [CrossRef]
  49. Bastian, M.; Heymann, S.; Jacomy, M. Gephi: An open source software for exploring and manipulating networks. ICWSM 2009, 8, 361–362. [Google Scholar]
  50. CICtourGUNE. Centro de Investigación Cooperativa en Turismo. 2011. Available online: http://www.ines.org.es/content/asociaci%C3%B3n-centro-de-investigacion-cooperativo-en-turismo (accessed on 15 July 2016).
  51. Richards, G. Creativity and tourism. Ann. Tour. Res. 2011, 38, 1225–1253. [Google Scholar] [CrossRef]
Figure 1. Space consumption by tourists in the City Center of Bilbao. CICtourGUNE [50].
Sustainability 08 00699 g001
Figure 2. The most visited cultural sites in Bilbao City Centre. CICtourGUNE [50].
Sustainability 08 00699 g002
Figure 3. Network of the most visited cultural POIs in Bilbao.
Sustainability 08 00699 g003
Figure 4. The main Tourism-related Lynch elements in Bilbao: A simple and eligible shape.
Sustainability 08 00699 g004
Table 1. Sample of tourists to Bilbao (1 July 2010–30 September 2010).
Analyzed VariablesNo.%
Age25–392549.02
≥402650.98
Travelling PurposeLeisure4792.16
Others47.84
Travelling PartyCouple3160.78
Family & Friends1835.29
Alone23.92
NationalityDomestic (Spain)3364.71
International1835.29
n = 51 data source: CICtourGUNE [50].
Table 2. Summary of cultural visitors.
Visits to/Visitors toBilbao
Cultural sites54.9%
Museums27.4%
Monuments43.1%
Cultural sites = Museums or monuments.
Table 3. List of most visited cultural points of interest (POIs) in Bilbao.
Cultural POIs% VisitorsMean Duration of Visits (min)
Plaza Nueva42.8630
Museo Guggenheim Bilbao32.1452
Catedral de Santiago21.4333
Iglesia de los Santos Juanes17.8619
Edificio de la Hacienda Estatal10.7112
Palacio de John (Edificio La Bolsa)10.7169
Bay Sala3.5718
Casco Viejo-Siete Calles3.5729
Epelde & Mardaras3.5723
Museo de Bellas Artes de Bilbao3.5711
Teatro Arriaga3.5735
Windsor Kulturgintza3.5725
n = 51 data source: CICtourGUNE [50].
Table 4. Duration of visits by some characteristics.
Analyzed VariablesMean Duration of Visits (min)
Age25–3938.17
≥4025.04
Travelling PurposeLeisure33.96
Others20.63
Travelling PartyCouple30.77
Family & Friends30.16
Alone111.62
NationalityDomestic (Spain)31.68
International37.98
n = 51 data source: CICtourGUNE [50].
Table 5. Properties of the network of cultural interest points of Bilbao.
POInDegreenBetweennessnClosenessEigenvector
Plaza Nueva (n12)57.1429.1278.571.00
Iglesia de los Santos Juanes (n6)50.0014.8373.330.99
Edificio de Hacienda (n4)28.5710.9957.890.60
Catedral de Santiago (n3)35.717.6961.110.75
Museo Guggenheim (n10)28.574.3957.890.68
Bay Sala (n1)14.290.0050.000.44
Casco Viejo (n2)0.000.000.000.00
Galería Epelde & Mardaras (n5)14.290.0047.830.39
Museo de Bellas Artes (n7)14.290.0040.740.32
Museo del Pescador (n8)7.140.0037.930.13
Museo Euskal Herria (n9)0.000.000.000.00
Edificio La Bolsa (n11)21.430.0055.000.58
Teatro Arriaga (n13)0.000.000.000.00
Torre Salazar (n14)7.140.0045.830.22
Windsor Kulturgintza (n15)7.140.0045.830.22

