
A Social Wellbeing in Fisheries Tool (SWIFT) to Help Improve Fisheries Performance

Abstract
:1. Introduction
1.1. Comparing Social Wellbeing Measures
1.2. State of the Art and Contribution to Work in the Area of Wellbeing
2. Methods
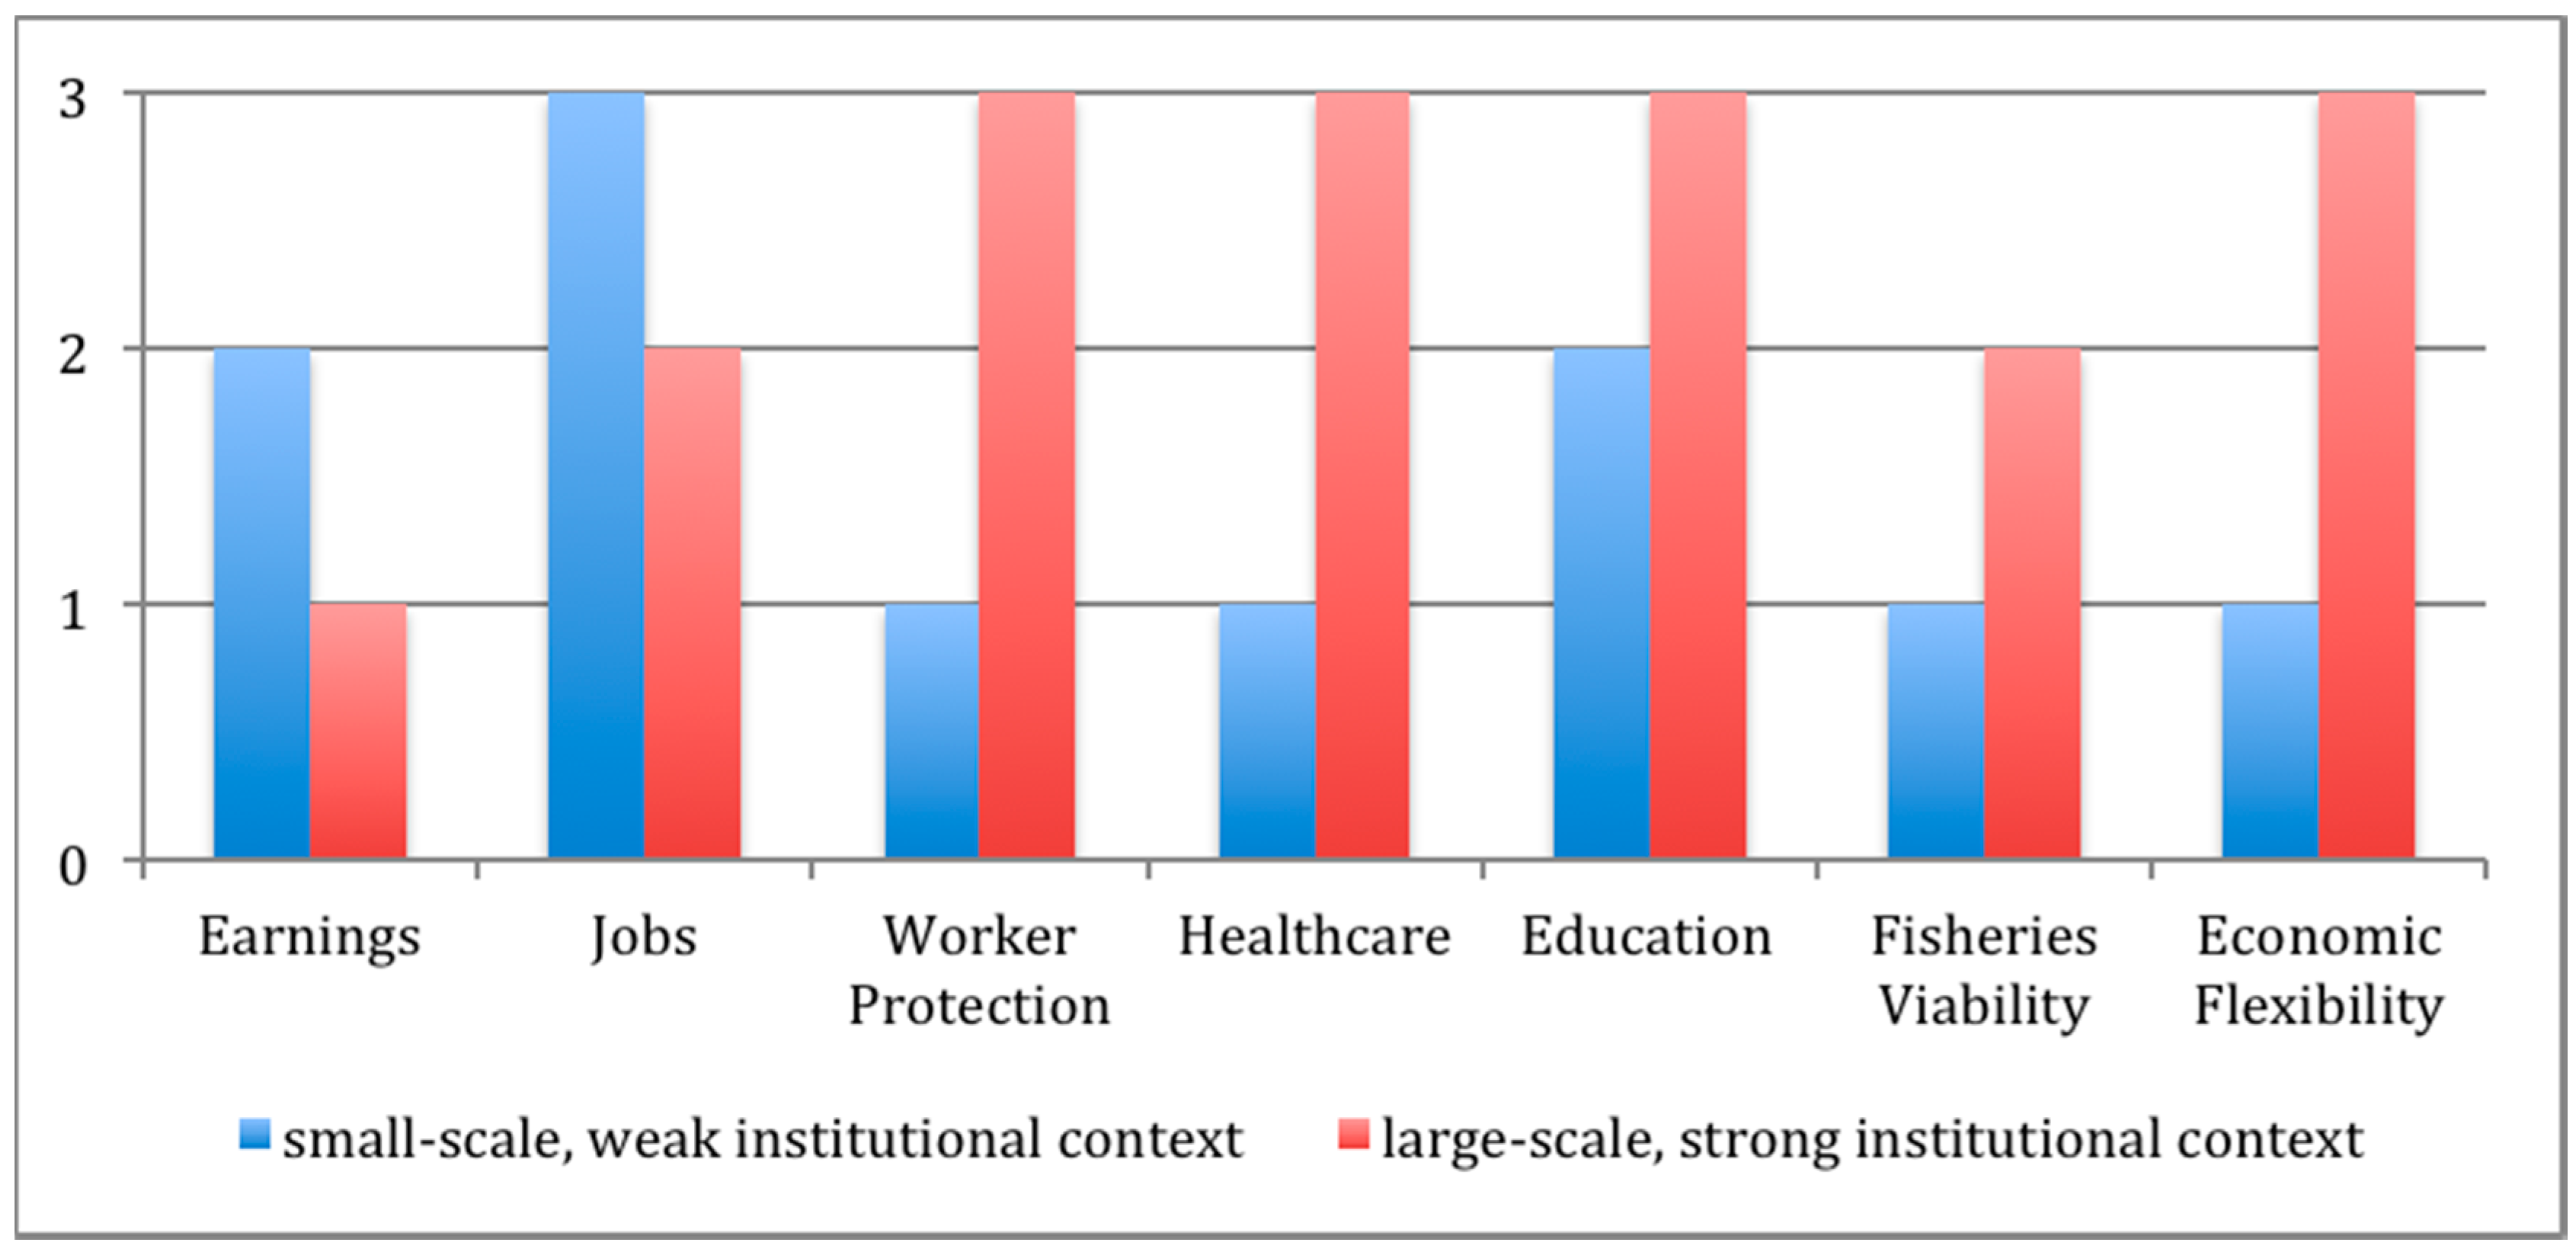
2.1. The Test Cases
- Small-scale fishery test case: a fishery with relatively weak fishery management, governance, and labor institutions. Very large number of fishers in the fishery, and the resource is reported to be over-exploited. Small boats operated by individual fishers sell product to local middlemen. The product has a relatively high value per kilo and processed in country for export and sale under several brands. There is a small domestic market for the product. Women are employed in processing.
- Industrial fishery test case: a fishery context with relatively strong institutions and legal framework protecting citizens. A large number of fishers are employed in the fishery, with the resource reported to be fairly well managed. Industrial vessels employ workers under a contract. The product has a lower value per kilo and is processed overseas, for sale in a highly-competitive commodity market.
2.2. Social Wellbeing and Fisheries Tool (SWIFT) Dimensions
- (1)
- Earnings are fair and stable. This focuses on harvesters and processors at the fishery level; these data are of average difficulty to obtain. Wages are a standard economic measure of wellbeing [15]. If either the harvesting (1.1) or processing (1.2) sectors earn less than the standard wage, then social inequality is being perpetuated in the fishery. Waged-based earning by country and minimum wages for the fisheries sector are tracked [31]. Local variation in earnings for harvesters or between fisheries in a country is not represented and must be found elsewhere. If both harvesting and processing sectors have average earnings lower than the standard, then the fishery is not providing an acceptable living. The standard is for fishers to obtain higher than the national minimum wage except in countries where wage standards are set by collective bargaining (i.e., Scandinavian countries) or if no minimum wage is available. In these cases, estimates can be made using respected publically-available sources. In landings-based earnings, such as small-scale fisheries where fishers work independently or in small groups, landings-based data on stability or increase in price/unit actually paid to fishers for catches over a five-year period is a direct, accessible measure, that can be substituted as a minimum wage (1.1). This information is often collected for fisheries whose products are sold on global markets, and is often collected for fisheries improvement projects (FIPs) seeking to improve marketing opportunities, or implement new policies or practices that may benefit fishers economically [32].
- (2)
- Jobs benefit the communities. This focuses on harvesters and processors at the fishery level and the data is challenging to find. A reasonable measure for jobs benefiting the community is whether more than half of the harvesting (2.1) and primary processor (2.2) workforce is based in the fishery region (vs. outsourced or migrant labor). An underlying assumption is that a local workforce implies that greater fishery wealth and other benefits remain in a fishing community. Reducing local employment by processing fish in another country may affect local wellbeing indirectly as well as directly, by reducing the tax base and, therefore, reducing political leverage for needed social services. Anderson et al.’s measures of nonresident employment follow a similar rationale [24]. We found no common data source for outsourced or migrant labor for fisheries (2.1 and 2.2). Instead, data on workforce composition is possible to find for fisheries with in-depth reports on trade dynamics. Reporting of non-local fleets is likely more common than reports of local ones, and some fisheries may have no public data.
- (3)
- Workers are protected. This focuses on institutions at the fisher and national level. These data are average to challenging to obtain. The most direct measures of basic worker protection are the presence of legitimate legal frameworks at the national level that include rights to strike (3.1) and freedom of collective action (3.2) which, for many countries, can be found in online databases, such as wageindicator.org [31]. As Fair Trade USA’s first requirement makes clear, if there is no organizational structure for workers, then worker protections are less likely to be a concern [23]. The presence of grievance structures (3.3) can be verified through either active fisher organizations that are common in small-scale fisheries and are often FIP participants or stakeholders (see fishsource.com for specific fisheries) [33]. Another source (3.3) of evidence is a formal structure with employers or local regulations that explain grievance mechanisms. Ideally, we would assess how well fisheries are actually upholding these rights, but standardized data would be scarce under the evidence constraints we are working with.
- (4)
- Communities have improving healthcare. The focus is children at the level closest to the fishing community scale, and the fishing community. These data are easy to obtain. Children are the most vulnerable in a population. Goal #4 of the Millennium Development Goals of the United Nations calls to reduce the under-five mortality rate by two thirds, between 1990 and 2015 [34]. While few publically-available datasets are global in scope and can be used as a shared standard for fisheries, child mortality under five years old (4.1) is one of these virtually universal measures regularly collected at the national level, and sometimes at regional and finer resolution (preferred). The Demographic and Health Surveys (DHS) Program’s Spatial Data Repository funded by USAID provides spatially-explicit health and demographic data [35]. Since the under-five mortality rate may vary across areas of large fisheries that encompass multiple geographic regions, the assessor must take the highest under-five mortality rate of all regions associated with the fishery. We set global standard for under-five mortality as higher than 10, which is in line with many developed countries. Faced with the challenge of this performance measure, global production networks may be encouraged to create new partnerships with public health and other agencies. CSR reports can be used to cite legitimate programs to improve local health that are initiated or supported by the seafood industry (4.2).
- (5)
- Communities have improving education. The focus is children at the level closest to the fishing community level, and the fishing community. These data are easy to obtain. As with the health dimension, focusing on children and the community (rather than education levels among the workforce) is likely to be more available through desktop research and more indicative of changes. The first component of this builds on the Millennium Development Goal #2 to achieve universal primary education [34], but these alone do not capture enough variation across countries. Instead we focus on whether less than 10% of the children are not enrolled in primary or secondary school (5.1) using UNESCO’s global trend on numbers of out-of-school children [36,37]. If data are available at finer resolution they should be used. For 5.2, evidence of legitimate industry-led education-related programs for fishers, as well as others in the community, could be obtained from CSR reports.
- (6)
- Fishery will be viable for future generations. The focus is the fishery system as a whole, including fishers, women, and newcomers. These data are challenging to very challenging to obtain, as local reports are required. If fishery employment is seen as a viable source of livelihood, women and men value the fisheries. Conversely, fisheries can, and do, extinguish from attrition when the value is seen as low and when resources are overharvested. Women play a critical role in many fisheries and are often the majority of workers in seafood processing [38]. Such work is often poorly paid and low status. Evidence of women in leadership roles (6.1) in workers’ organizations that represent seafood worker interests or seafood companies are shown in FIP, CSR, or other reports. Whether a mix of age groups is represented (6.2) can likely be found in demographic information that are regularly collected at fisheries levels for socio-economic assessments or national statistics of employment by FAO country profiles [39]. Evidence of training of fishers (6.3) can be found in CSR, fisher association, industry association, or government reports.
- (7)
- Harvesters have economic flexibility. This focuses on harvesters at the fishery level. These data are challenging to very challenging to obtain. Evidence of fishers’ freedom to sell to whomever they choose (7.1) is the absence of information indicating that harvesters are locked into one buyer or loan type (which may lead to unfair lending practices and other exploitation by intermediaries leaving them more vulnerable to cope with challenges [40]). Evidence (7.1) can also be the structural dynamics of the fishery, for example, if there are few processors, or fisheries are contracted to sell to a single processor, or if there are very few middlemen in a large fishery system, the harvesters’ options and ability to negotiate fair terms are severely limited. Evidence of economic flexibility also includes whether harvesters access multiple loan types at good rates (not exceeding government rate) (7.2), which will need to be obtained through socio-economic reports. We also consider as evidence formalized training such as programs in how to add value to fishers’ landings (7.3) that can help harvesters earn more without increasing fishing effort or expenditures. This information can be found in fisher-organization, government, FIP, and CSR reports. We did not include economic fishery analyses, such as cost of entry for fishers, a metric being considered elsewhere [32].
3. Results and Discussion
3.1. Areas for Future Work
3.2. How Can Global Production Networks Improve Social Performance?
4. Conclusions
Acknowledgments
Author Contributions
Conflicts of Interest
References
- ANOVA. Sustainability Report-Fishing and Living: Improving Life in the Fishing Community; ANOVA Holding: Tampa, FL, USA, 2015. [Google Scholar]
- Sustainable Fisheries Partnership. Seafood and Social Development:Engaging the seafood industry in the social development of seafood-producing communities in developing countries. In Proceedings of the Seafood and Social Development Forum, Annapolis, MD, USA, 21–22 September 2015.
- Brinson, A.; Lee, M.Y.; Rountree, B. Direct marketing strategies: The rise of community supported fishery programs. Mar. Policy 2011, 35, 542–548. [Google Scholar] [CrossRef]
- Food & Agriculture Organisation (FAO). Overcoming Factors of Unsustainability and Overexploitation in Fisheries: Selected Papers on Issues and Approaches; Food & Agriculture Organisation: Rome, Italy, 2005; Volume 782. [Google Scholar]
- Folke, C.; Colding, J.; Berkes, F. Synthesis: Building resilience and adaptive capacity in social-ecological systems. In Navigating Social-Ecological Systems: Building Resilience for Complexity and Change; Cambridge University Press: Cambridge, UK, 2003; pp. 352–387. [Google Scholar]
- Chapin, F.S.; Carpenter, S.R.; Kofinas, G.P.; Folke, C.; Abel, N.; Clark, W.C.; Olsson, P.; Smith, D.M.S.; Walker, B.; Young, O.R.; et al. Ecosystem stewardship: Sustainability strategies for a rapidly changing planet. Trends Ecol. Evol. 2010, 25, 241–249. [Google Scholar] [CrossRef] [PubMed]
- Ratner, B.D.; Åsgård, B.; Allison, E.H. Fishing for justice: Human rights, development, and fisheries sector reform. Glob. Environ. Chang. 2014, 27, 120–130. [Google Scholar] [CrossRef]
- Allison, E.H.; Ratner, B.D.; Åsgård, B.; Willmann, R.; Pomeroy, R.; Kurien, J. Rights-based fisheries governance: From fishing rights to human rights. Fish Fish. 2012, 13, 14–29. [Google Scholar] [CrossRef]
- Pickerell, T.; Newman, M.; MacDonald, S. New tools for seafood business to understand human rights risks and improve social compliance. In Proceedings of the Conference at Seafood Expo North America, Boston, MA, USA, 6–8 March 2016.
- Greenfield, K. Success, failure, and corporate responsbility. In Proceedings of the Conference at Seafood Expo North America, Boston, MA, USA, 6–8 March 2016.
- Wingard, J. Community transferable quotas: Internalizing externalities and minimizing social impacts of fisheries management. Hum. Organ. 2000, 59, 48–57. [Google Scholar] [CrossRef]
- Miller, M.; Johnson, J. Hard work and competition in the bristol bay salmon fishery. Hum. Organ. 1981, 40, 131–139. [Google Scholar] [CrossRef]
- Gaynor, J.L. Flexible fishing: Gender and the new spatial division of labor in eastern indonesia’s rural littoral. Radic. Hist. Rev. 2010, 2010, 74–100. [Google Scholar] [CrossRef]
- Jentoft, S.; McCay, B.J.; Wilson, D.C. Social theory and fisheries co-management. Mar. Policy 1998, 22, 423–436. [Google Scholar] [CrossRef]
- Pollnac, R.B.; Abbott-Jamieson, S.; Smith, C.; Miller, M.L.; Clay, P.M.; Oles, B. Toward a model for fisheries social impact assessment. Mar. Fish. Rev. 2006, 68, 1–18. [Google Scholar]
- Millenium Ecosystem Assessement. Ecosystems and Human Well-Being: A Framework for Assessment. Millennium Ecosystem Assessment; Island Press: Washington, DC, USA, 2003. [Google Scholar]
- Millenium Ecosystem Assessement. Ecosystems and Human Well-Being: Synthesis; Island Press: Washington, DC, USA, 2005. [Google Scholar]
- Brown, K. Resilience, Development and Global Change; Routledge: London, UK, 2016. [Google Scholar]
- Biggs, R.; Schlüter, M.; Schoon, M. (Eds.) Principles for Building Resilience: Sustaining Ecosystem Services in Social-Ecological Systems; Cambridge University Press: Cambridge, UK, 2015.
- Association of Southeast Asian Nations (ASEAN) Steering Committee. Fishery Improvement Project Protocol for the ASEAN Region Draft for First Public Comment Period; ASEAN: Jakarta, Indonesia, 2014. [Google Scholar]
- Jepson, M.; Colburn, L.L. Development of Social Indicators of Fishing Community Vulnerability and Resilience in the U.S. Southeast and Northeast Regions; NOAA Technical Memorandum NMFS-F/SPO-129; U.S. Department of Commerce: Washington, DC, USA, 2013. [Google Scholar]
- Himes-Cornell, A.; Kasperski, S. Using Socioeconomic and Fisheries Involvement Indices to Understand Alaska Fishing Community Well-Being. Coast. Manag. 2016, 44, 36–70. [Google Scholar] [CrossRef]
- Fair Trade. Fair Trade USA Capture Fisheries Program; Fair Trade USA: Oakland, CA, USA, 2014. [Google Scholar]
- Anderson, J.L.; Anderson, C.M.; Chu, J.; Meredith, J.; Asche, F.; Sylvia, G.; Smith, M.D.; Anggraeni, D.; Arthur, R.; Guttormsen, A.; et al. The fishery performance indicators: A management tool for triple bottom line outcomes. PLoS ONE 2015, 10, e0122809. [Google Scholar] [CrossRef] [PubMed] [Green Version]
- Food & Agriculture Organisation (FAO). Voluntary Guidelines for Securing Sustainable Small-Scale Fisheries in the Context of Food Security and Poverty Eradication; Food & Agriculture Organisation: Rome, Italy, 2015. [Google Scholar]
- Berkes, F.; Folke, C.; Colding, J. (Eds.) Building resilience for adaptive capacity in social-ecological systems. In Navigating Social-Ecological Systems: Building Resilience for Complexity and Change; Cambridge University Press: Cambridge, UK, 2002.
- Cumming, G.S.; Barnes, G.; Perz, S.; Schmink, M.; Sieving, K.E.; Southworth, J.; Binford, M.; Holt, R.D.; Stickler, C.; Van Holt, T. An exploratory framework for the empirical measurement of resilience. Ecosystems 2005, 8, 975–987. [Google Scholar] [CrossRef]
- Gunderson, L. Resilience, flexibility and adaptive management—Antidotes for spurious certitude? Ecol. Soc. 1999, 3, 7. [Google Scholar]
- Adger, W.N. Social and ecological resilience: Are they related? Prog. Hum. Geogr. 2000, 24, 347–364. [Google Scholar] [CrossRef]
- Crona, B.I.; Van Holt, T.; Petersson, M.; Daw, T.M.; Buchary, E. Using social-ecological syndromes to understand impacts of international seafood trade on small-scale fisheries. Glob. Environ. Chang. 2015, 35, 162–175. [Google Scholar] [CrossRef]
- Wage Indicator. Available online: http//:www.wageindicator.org (accessed on 15 December 2015).
- Metz, S. Developing Economic Scores for FishSource; Sakana Consultants: Brest, France, 2015. [Google Scholar]
- Sustainable Fisheries Parnership. FishSource. Available online: http://www.fishsource.com/ (accessed on 27 May 2016).
- United Nations. Millenium Development Goals Report 2015; United Nations: New York, NY, USA, 2015. [Google Scholar]
- Demographic and Health Surveys. Spatial Data Repository for the Demographic and Health Surveys (DHS) Program. Available online: http://spatialdata.dhsprogram.com/home/ (accessed on 27 May 2016).
- United Nations Educational, Scientific, and Cultural Organization (UNESCO). UNESCO eAtlas of Out-of-School Children. Available online: http://tellmaps.com/uis/oosc/ (accessed on 27 May 2016).
- United Nations International Children’s Emergency Fund (UNICEF). Global Out-of-School Children Initiative Operational Manual Global Initiative on Out-of-School Children; United Nations International Children’s Emergency Fund: New York, NY, USA, 2015. [Google Scholar]
- Griffith, D.; Valdez Pizzini, M. Fishers at Work, Workers at Sea: A Puerto Rican Journey through Labor and Refuge; Temple University Press: Philadelphia, PA, USA, 2002. [Google Scholar]
- Food and Agriculture Organization of the United Nations (FAO). FAO Country Profiles. Available online: http://www.fao.org/countryprofiles/en/ (accessed on 27 May 2016).
- Cinner, J.E.; Sutton, S.G.; Bond, T.G. Socioeconomic thresholds that affect use of customary fisheries management tools. Conserv. Biol. 2007, 6, 1603–1611. [Google Scholar] [CrossRef] [PubMed]
- Norris, F.H.; Stevens, S.P.; Pfefferbaum, B.; Wyche, K.F.; Pfefferbaum, R.L. Community resilience as a metaphor, theory, set of capacities, and strategy for disaster readiness. Am. J. Community Psychol. 2008, 41, 127–150. [Google Scholar] [CrossRef] [PubMed]
- Magis, K. Community Resilience: An indicator of social sustainability. Soc. Nat. Resour. Int. J. 2010, 23, 401–416. [Google Scholar] [CrossRef]
- McCay, B.J. Muddling Through the Clam Beds: Co-operative Management of New Jersey’s Hard Clam Spawner Sanctuaries. J. Shellfish Res. 1988, 7, 327–340. [Google Scholar]

| Approach | Purpose | Main Focus | Audience | Evidence/Source | Unit of Analysis/Scale |
|---|---|---|---|---|---|
| ASEAN [20] (Industry) | Measure social performance | Worker fairness and avoiding resource-use conflict | Industry investors, philanthropists | Self-reporting of compliance certificates; mapping community resources on site | Small and large fisheries (Asian Region) |
| Jepson et al. [21] and Himes-Cornell [22] derived from Pollnac [15] | Assess social impact | Assess management alternatives’ effect on vulnerability, community wellbeing, social disruption | State agencies, fishers | Spatially-explicit census and other datasets | Fishing community (section of a county) (US States) |
| Fair Trade USA [23] | Set Fair Trade certification standards | Governance structure, empowerment, human rights, wages, working conditions and services | Consumers, fishers, industry | Third-party verifies supply network through fieldwork | Certificate holder/fishery organization (Global/Local data) |
| Anderson and colleagues [24] | Measure performance of fishery management systems | Ecology, economy, community in harvest and post-harvest sectors | Governments, industry, researchers | Sixty-eight metrics ranked by experts using key informants | Fishery management rather than fish stock (Global) |
| FAO/United Nations [25] | Provide ethical guidance relevant to small-scale fisheries | Secure tenure, decent work, power relationships, gender equality | Governments, industry, fishers | Document summarizes rights issues in small-scale fisheries) | Small-scale fisheries communities (Local) |
| Sustainable Fisheries Partnership (SWIFT method proposed here) | Measure social wellbeing performance | Flexibility, security, and viability | Industry, investors, philanthropists | Third parties synthesize public data; performance rankings can be challenged and rebutted with evidence | Small and large fisheries (Global-Fishsource data) |
| Wellbeing Dimension | Suggested Measures & Rank Ranges | ||
|---|---|---|---|
| For Each Measure, Determine Which Factor(s) Apply and Note the Appropriate Ranking. | |||
| 1 | 2 | 3 | |
| Less than half of factors are present | At least half of factors are present | All factors are present | |
| 1. Earnings are fair and stable. |
| ||
| 2. Jobs benefit the communities. |
| ||
| 3. Workers are protected. |
| ||
| 4. Communities have improving healthcare. |
| ||
| 5. Communities have improving education. |
| ||
| 6. Fishery will be viable for future generations. |
| ||
| 7. Harvesters have economic flexibility. |
| ||
| Wellbeing Dimension | Suggested Measures & Rank Ranges | Small-Scale | Rank | Industrial | Rank |
|---|---|---|---|---|---|
| 1. Earnings are fair and stable. | Harvesting wages are higher than the standard (national minimum wage) OR if no wages price/weight paid to harvesters is stable or increasing over time over a five year period. | Yes | 2 | No | 1 |
| >10% national average. | Harvesters earn below national average. | ||||
| Processing sector wages are higher than the standard. | No | No | |||
| Less than average daily wage in region. | Outsourced to cheaper labor markets abroad. | ||||
| 2. Jobs benefit the communities. | Harvesting workforce comprised of >50% local people. | Yes | 3 | Yes | 2 |
| >50% local harvesting crew. | National fishing companies own fishing quotas. Strong labor organizations/difficult to employ unregulated workers. | ||||
| Primary processing workforce is comprised of >50% local people. | Yes | No | |||
| >50% local processing workers. | Processing outsourced to other countries. | ||||
| 3. Workers are protected. | National level protection: multiple national level protections for right to strike. | No | 1 | Yes | 3 |
| Only provisions in the labor code, not in trade union/collective action. | Insufficient data on wage.indicator.org, but public strikes suggests strikes allowed. | ||||
| National Level Protection. | No | Yes | |||
| only in the labor code. | Insufficient data on wageindicator.org but salaries are collectively bargained for 80% of workforce. | ||||
| Structure is in place to address worker grievances at local level, or the global production network uses labor contracts and the terms are transparent/public. | No | Yes | |||
| No evidence of fisheries associations to address grievances, & mainly informal contracts. | National fisherman’s association addresses grievances, and strong labor protections present. | ||||
| 4. Communities have improving healthcare. | Made significant improvement in under-five mortality rate at the relevant fishery level or meets global standard (set at 10 deaths per 1000 births). | No | 1 | Yes | 3 |
| DHS Survey data show >85 deaths per 1000 births. | ≤10 deaths per 1000 births or less. | ||||
| Seafood company has implemented programs to improve healthcare at the relevant fishery level. | No | Yes | |||
| none known to be implemented. | CSR program by industry to deliver services such as support for physiotherapist, safe equipment and sponsored sports activities for employees. | ||||
| 5. Communities have improving education. | Less than 10% of primary and secondary school age children are out of school. | Yes | 2 | Yes | 3 |
| Seafood company has implemented programs to improve education. | No | Yes | |||
| Industry does not invest in education initiatives. | CSR program by industry to deliver education programs in finance, information technology (IT), mathematics, and languages for employees. | ||||
| 6. Fishery will be viable for future generations. | Harvesters from a range of age classes are represented. | Yes | 1 | Yes | 2 |
| All working ages are well represented. | All working ages are represented, although. average age for fishers is >40. | ||||
| New fishers are being recruited into the fishery. | No | Yes | |||
| No evidence of new fishery recruits. | Active recruitment of new members. | ||||
| Women are increasingly taking leadership roles in the global production network and fishing communities. | No | No | |||
| No evidence of women in leadership. | No women on management team of large processor or in the board of fishermen’s union. | ||||
| 7. Harvesters have economic flexibility. | Harvesters are free to sell to whomever they wish without retribution. | No | 1 | Yes | 3 |
| Evidence that fishers are not free to sell to whomever they choose. | No evidence to counter that fishers are free to sell to whomever they choose. | ||||
| Harvesters can access loans from at least two types of lenders at interest rates not exceeding the government rate. | No | Yes | |||
| Harvesters only obtain loans from middlemen. | Loans from government and banks. | ||||
| Formalized training is provided to harvesters in how to add value to their landings. | No | Yes | |||
| No evidence of value-added training programs. | Formalized trainings include two years basic education to become a fishermen and training in fish processing and quality. Further education offered in fishing techniques, radio communications and money management. |
© 2016 by the authors; licensee MDPI, Basel, Switzerland. This article is an open access article distributed under the terms and conditions of the Creative Commons Attribution (CC-BY) license (http://creativecommons.org/licenses/by/4.0/).
Share and Cite
Van Holt, T.; Weisman, W.; Johnson, J.C.; Käll, S.; Whalen, J.; Spear, B.; Sousa, P. A Social Wellbeing in Fisheries Tool (SWIFT) to Help Improve Fisheries Performance. Sustainability 2016, 8, 667. https://doi.org/10.3390/su8080667
Van Holt T, Weisman W, Johnson JC, Käll S, Whalen J, Spear B, Sousa P. A Social Wellbeing in Fisheries Tool (SWIFT) to Help Improve Fisheries Performance. Sustainability. 2016; 8(8):667. https://doi.org/10.3390/su8080667
Chicago/Turabian StyleVan Holt, Tracy, Wendy Weisman, Jeffrey C. Johnson, Sofia Käll, Jack Whalen, Braddock Spear, and Pedro Sousa. 2016. "A Social Wellbeing in Fisheries Tool (SWIFT) to Help Improve Fisheries Performance" Sustainability 8, no. 8: 667. https://doi.org/10.3390/su8080667