1. Introduction
Environmental impacts caused by humans have been increasing for decades with serious consequences such as climate change [
1]. During the last decade, some countries have seriously tackled these ecological problems [
2] but their measures have been insufficient partly due to the high rate of development, resources consumption and environmental impact in developing countries [
3].
Nowadays, more than 50 years after Life Cycle Assessment originated [
4], more than 40 years after the 1973 oil crisis and almost 30 years after the 1987 Brundtland Commission report [
5], the importance of sustainability and its assessment is accepted worldwide. Brundtland and other reports that followed [
6] promoted sustainable development in a holistic point of view taking into account economic, environmental and social impacts.
The building sector causes an important part of these impacts during its materials production, the buildings usage phase and the buildings demolition or end of life among other phases [
7]. For this sector, there are several tools, database and methods available to assess sustainability and environmental aspects within the architectural and civil engineering area [
8]. However, there is no unanimity yet as to which criteria and indicators or which method is better to use in each case [
9].
These tools differ both in their scope and approach [
10]. Numerous methods focus on measuring disaggregated indicators in detail [
11]. An important group of well-known tools have been broadly used during decades to assess the environmental impacts within the construction sector. This is the case of the Life Cycle Assessment (LCA) [
12,
13,
14,
15,
16] in which environmental inputs, outputs and impacts are evaluated through the life cycle of a building or part of it. Some important LCA partial steps are: the Life Cycle Inventory (LCI) [
17], which catalogues and quantifies a specific product’s inputs and outputs during its life cycle, and the Life Cycle Impact Assessment (LCIA), which evaluates impacts for a building system throughout the life cycle of a construction product [
18].
On the other hand, Life Cycle Cost (LCC) [
19] is a tool that permits analysts to carry out an economic analysis focusing on the purchasing and operating phases of a building over a period of time; while Life Cycle Energy Analysis allows assessing energy inputs during the life cycle of a building [
8]. Material Flow Analysis (MFA) is a related method that can measure and analytically quantify flows and stocks of construction materials [
20]. Material and Energy Flow Analysis (MEFA) also incorporates the flow of energy [
21]. These tools are exemplary in using scientific methods to measure and apply criteria to assess environmental impacts [
9]. However, numerous researchers agree that is not feasible to apply these LCA related methods for covering the analysis of complete buildings [
22,
23,
24].
Other tools and methods include more than one sustainability requirement. In this regard, methods that add economic and/or social indicators to environmental requirements have increased in the last decade [
25,
26], as well as standards for social indicators [
27]. More recently, some of these tools and assessments also include technical, functional and governance requirements as well [
28]. In this category, there are the certification tools for the building sector [
29].
Table 1 presents eight of these certification tools, which are a representative sample of more than 30 methodologies studied in review papers [
9,
30,
31].
Most of these exemplify this recent tendency since social and economic aspects are incorporated. The acceptance of these methods has shown to be variable, as only two have been internationally applied for decades, while the others are mainly used in the country of origin. The methods gathered within
Table 1 also differ in being credits or percentage based rating tools, the application’s complexity and the outcomes resulting from each method, which is in most of the cases, either a certification with a qualification of satisfaction or a graphic sustainability index.
Most of the mentioned tools and methods can be applied during the design, construction and use phases of a building and mainly rely on experimental and quantitative data. On the other hand, some sustainability assessment studies and research focus on the post occupancy period like Post Occupancy Evaluations [
43], others focus on data from participatory processes [
44,
45] and other studies are advancing in order to incorporate both [
46]. All the aforementioned tools have contributed to advance towards a more sustainable construction sector and to raise awareness of this issue within the sector [
9]. However, most of them are specialized in quantifying specific branches of sustainability, such as the environmental or the economic branch. Only a few methods are capable of quantifying all the different social, economic and environmental requirements that permit researchers to derive a global sustainability index. Finally, when a sustainability assessment requires a specialized tool for a particular study case, the aforementioned tools are scarcely representative.
In this regard, this research paper presents a detailed analysis of the MIVES method (from the Spanish Integrated Value Model for the Sustainability Assessment). MIVES is a Multi-Criteria Decision Making (MCDM) method capable of defining specialized and holistic sustainability assessment models to obtain global sustainability indexes. There have already been numerous applications of MCDM in engineering [
47], most focusing on economic aspects [
48,
49,
50] and fewer about environmental issues [
51,
52,
53] or social aspects [
54,
55]. Some MCDM tools incorporate different sustainability branches [
56,
57] and some are specialized in the construction sector [
58]. The MIVES method is a unique MCDM based on the use of value functions [
59] to assess the satisfaction of the different stakeholders involved in the decision-making process. The use of these functions allows minimizing the subjectivity in the assessment. So far, MIVES has already been used for industrial buildings [
60,
61,
62,
63], underground infrastructures [
64], hydraulic structures [
65,
66], wind towers [
67], sewage systems [
68], post-disaster sites and housing selection [
69,
70] and construction projects [
71,
72]. It should be highlighted that in the current Spanish Structural Concrete Code [
73], MIVES method is proposed for assessing the sustainability of concrete structures [
74]. Finally, it must be added that the MIVES method has even been expanded to include the uncertainties involved in the process of analysis [
75].
This present research paper describes the main advantages and weak points of this method. It also shows these features by presenting two representative examples of MIVES sustainability assessment tools and their potential applications. Finally, this research paper concludes providing the area of application for this MCDM and the main types of sustainability assessment tools.
2. Methodology
MIVES is a methodology that was developed at the start of the new Millennium [
53]. As previously said, it is a unique MCDM because MIVES combines: (a) a specific holistic discriminatory tree of requirements; (b) the assignation of weights for each requirement, criteria and indicator; (c) the value function concept [
59] to obtain particular and global indexes; and (d) seminars with experts using Analytic Hierarchy Process (AHP) [
76] to define the aforementioned parts.
Experts from the field of research and from the different institutions and companies involved in each research project participate in these seminars. These experts use AHP to define: the requirements tree, their criteria and indicators, their weights and their value functions. They bring knowledge and expertise and also take into account related previous research projects and technical bibliography. These seminars by experts bring objectivity, reality and complexity to the resulting assessment tool. For example, when defining the requirements tree this objectivity is crucial in order to obtain the correct assessment. Each case of study needs its own tree that incorporates exclusively its most significant and discriminatory indicators. It is also of great importance that the amount of indicators is not excessive.
2.1. MIVES Process
The assessment of the sustainability index by using the MIVES method should be carried out following these steps: (S1) define the problem to be solved and the decisions to be made; (S2) produce a basic diagram of the decision model, establishing all those aspects that will be part of a requirements tree that may include qualitative and quantitative variables; (S3) establish the value functions to convert the qualitative and quantitative variables into a set of variables with the same units and scales; (S4) define the importance or relative weight of each of the aspects to be taken into account in the assessment; (S5) define the various design alternatives that could be considered to solve the previously identified problem; (S6) evaluate and assess those alternatives by using the previously created model; and (S7) make the right decisions and choose the most appropriate alternative.
Examples of step S1 are explained in
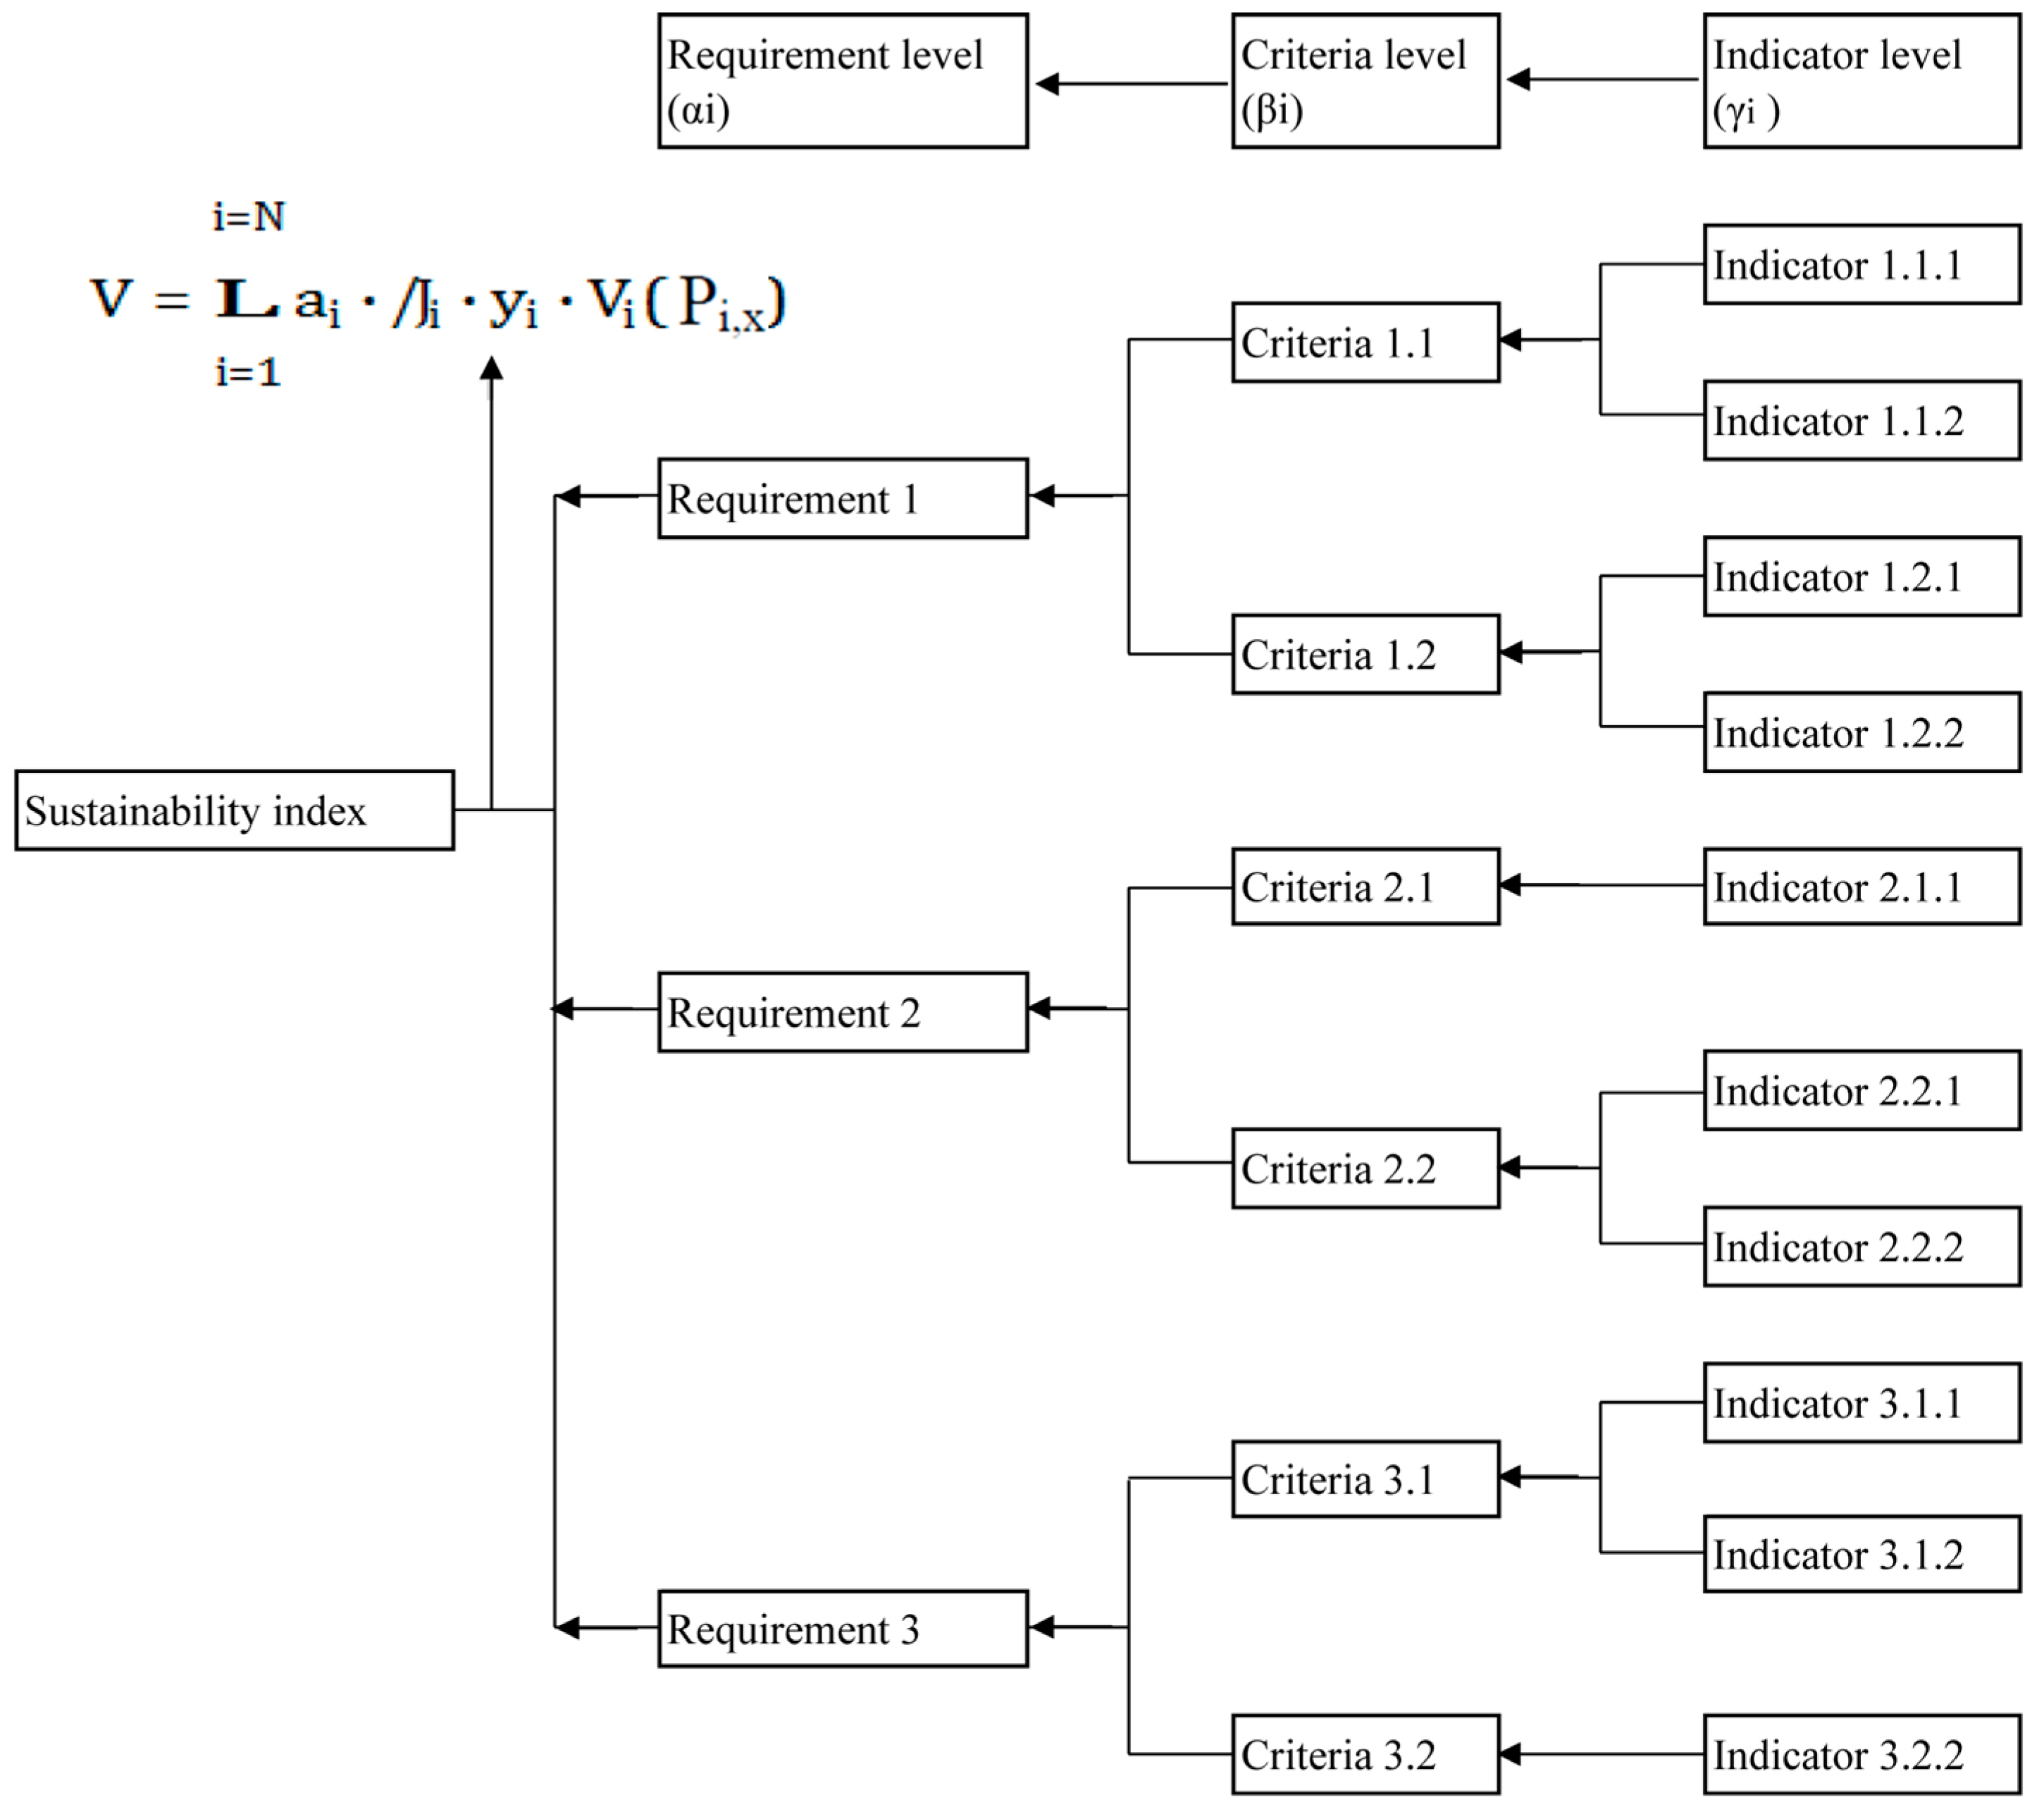
Section 3. The requirements tree in S2 (
Figure 1) is a hierarchical diagram in which the various characteristics of the product or processes to be evaluated are organized, normally at three levels: indicators, criteria, and requirements. At the final level, the specific requirements are defined and the previous levels (criteria and indicators) are included in order to desegregate the requirements; thus permitting: (1) having a global view of the problem; (2) organizing the ideas; and (3) facilitating the comprehension of the model to any stakeholder involved in the decision process. There are also examples of requirements trees in
Section 3.
Afterwards, in S3 the value functions are used to formalize a method to convert the different criteria magnitudes and units into a common, non-dimensional unit that will be called value. In this sense, it should be noticed that this method accounts for both qualitative and quantitative variables related with the indicators.
In any multi-criteria decision problem, the decision maker has to choose between a group of alternatives [
77], these being discrete or continuous. Thus, when the preferences (
x) are known with respect to a set of design alternatives (
X), a value function
V:P → R can be fixed such that
Px > P’x so that
V(Px) > V(P’x),
P being equal to a set of criteria to be evaluated for alternative
x. The problem consists of generating a non-dimensional value function
V(Px) that reflects the preferences of the decision maker for each alternative while integrating all the criteria
Px = (P1,x; P2,x;…; PN,x). The solution is a function
V consisting of the sum of
N value functions
Vi corresponding to the
N criteria which comply with
Vi:P → R so
Pi,x > P’i,x ↔ Vi(Pi,x) > Vi(P’i,x). For the case of problems structured in the form of a requirements tree, the resulting Sustainability Index (
SI) can be assessed using Equation (1).
In Equation (1), V(Px) measures the degree of sustainability (value) of the alternative x evaluated with respect to various criteria Px = (P1,x;P2,x;…;PN,x) considered. αi are the weights of each requirement i, βi are the weights of each criteria i and γi are the weights of the different indicators i. These weights are the preference, respectively, of these requirements, criteria and indicators. Vi(Pi,x) are the value functions used to measure the degree of sustainability of the alternative x with respect to a given criterion i. Finally, N is the total number of criteria considered in the assessment.
A main objective of the Vi functions is to homogenize the different indicators values, which have different measurement units, so to obtain a global sustainability index. In this regard, it is also highly recommended to delimit the values that these functions can generate. In this way, all the criteria have one single scale of assessment, normally between 0 and 1. These values represent the minimum and maximum degree of sustainability, respectively. A second main objective is to make it possible to weigh the Vi functions by weights αi, βi, and γi. It also makes it easier to obtain these weights (αi, βi, and γi) since it will only be necessary to establish the relative priority of certain requirements, criteria, or indicator with respect to other ones, regardless of whether some may present different scales of quantification.
Once the value functions have been defined, it is necessary to calculate weights αi, βi, and γi for each branch of the requirements tree (step S4 of MIVES). To this end, numerical values established by experts in the field are used. These weights are obtained using AHP in seminars as explained in the previous section. First, the weights of each requirement (αi) are calculated. Then, within each requirement, weights βi for the several criteria are calculated, and finally, the same process is done for each criteria to obtain the indicator weights γi. AHP is useful when the resulting initial trees are excessively complex, or discrepancies occur among the experts, or, simply, it is desirable to carry out an organized process to avoid difficulties in establishing the weights. Afterward, to compensate for possible subjective bias because of the use of semantic labels in AHP, a subsequent process of analyzing, comparing and, in case of being necessary, modifying the resulting weights is recommended.
The various alternatives x are defined in the following stage S5. After that, these alternatives are evaluated (step S6), and the sustainability index associated with each of them is calculated using Equation (1).
2.2. Definition of the Value Functions
Defining value functions is also crucial to add homogeneity to different indicators, which have different measurement units in order to obtain sustainability indexes. There is a value function (VIi) for each indicator. Defining each value function requires measuring preference or the degree of satisfaction produced by a certain alternative. Each measurement variable may be given in different units; therefore, it is necessary to standardize these into units of value or satisfaction, which is basically what the value function does. The method proposed a scale for which 0.0 reflects minimum satisfaction (Pmin) and 1.0 reflects maximum satisfaction (Pmax).
To determine the satisfaction value for an indicator [
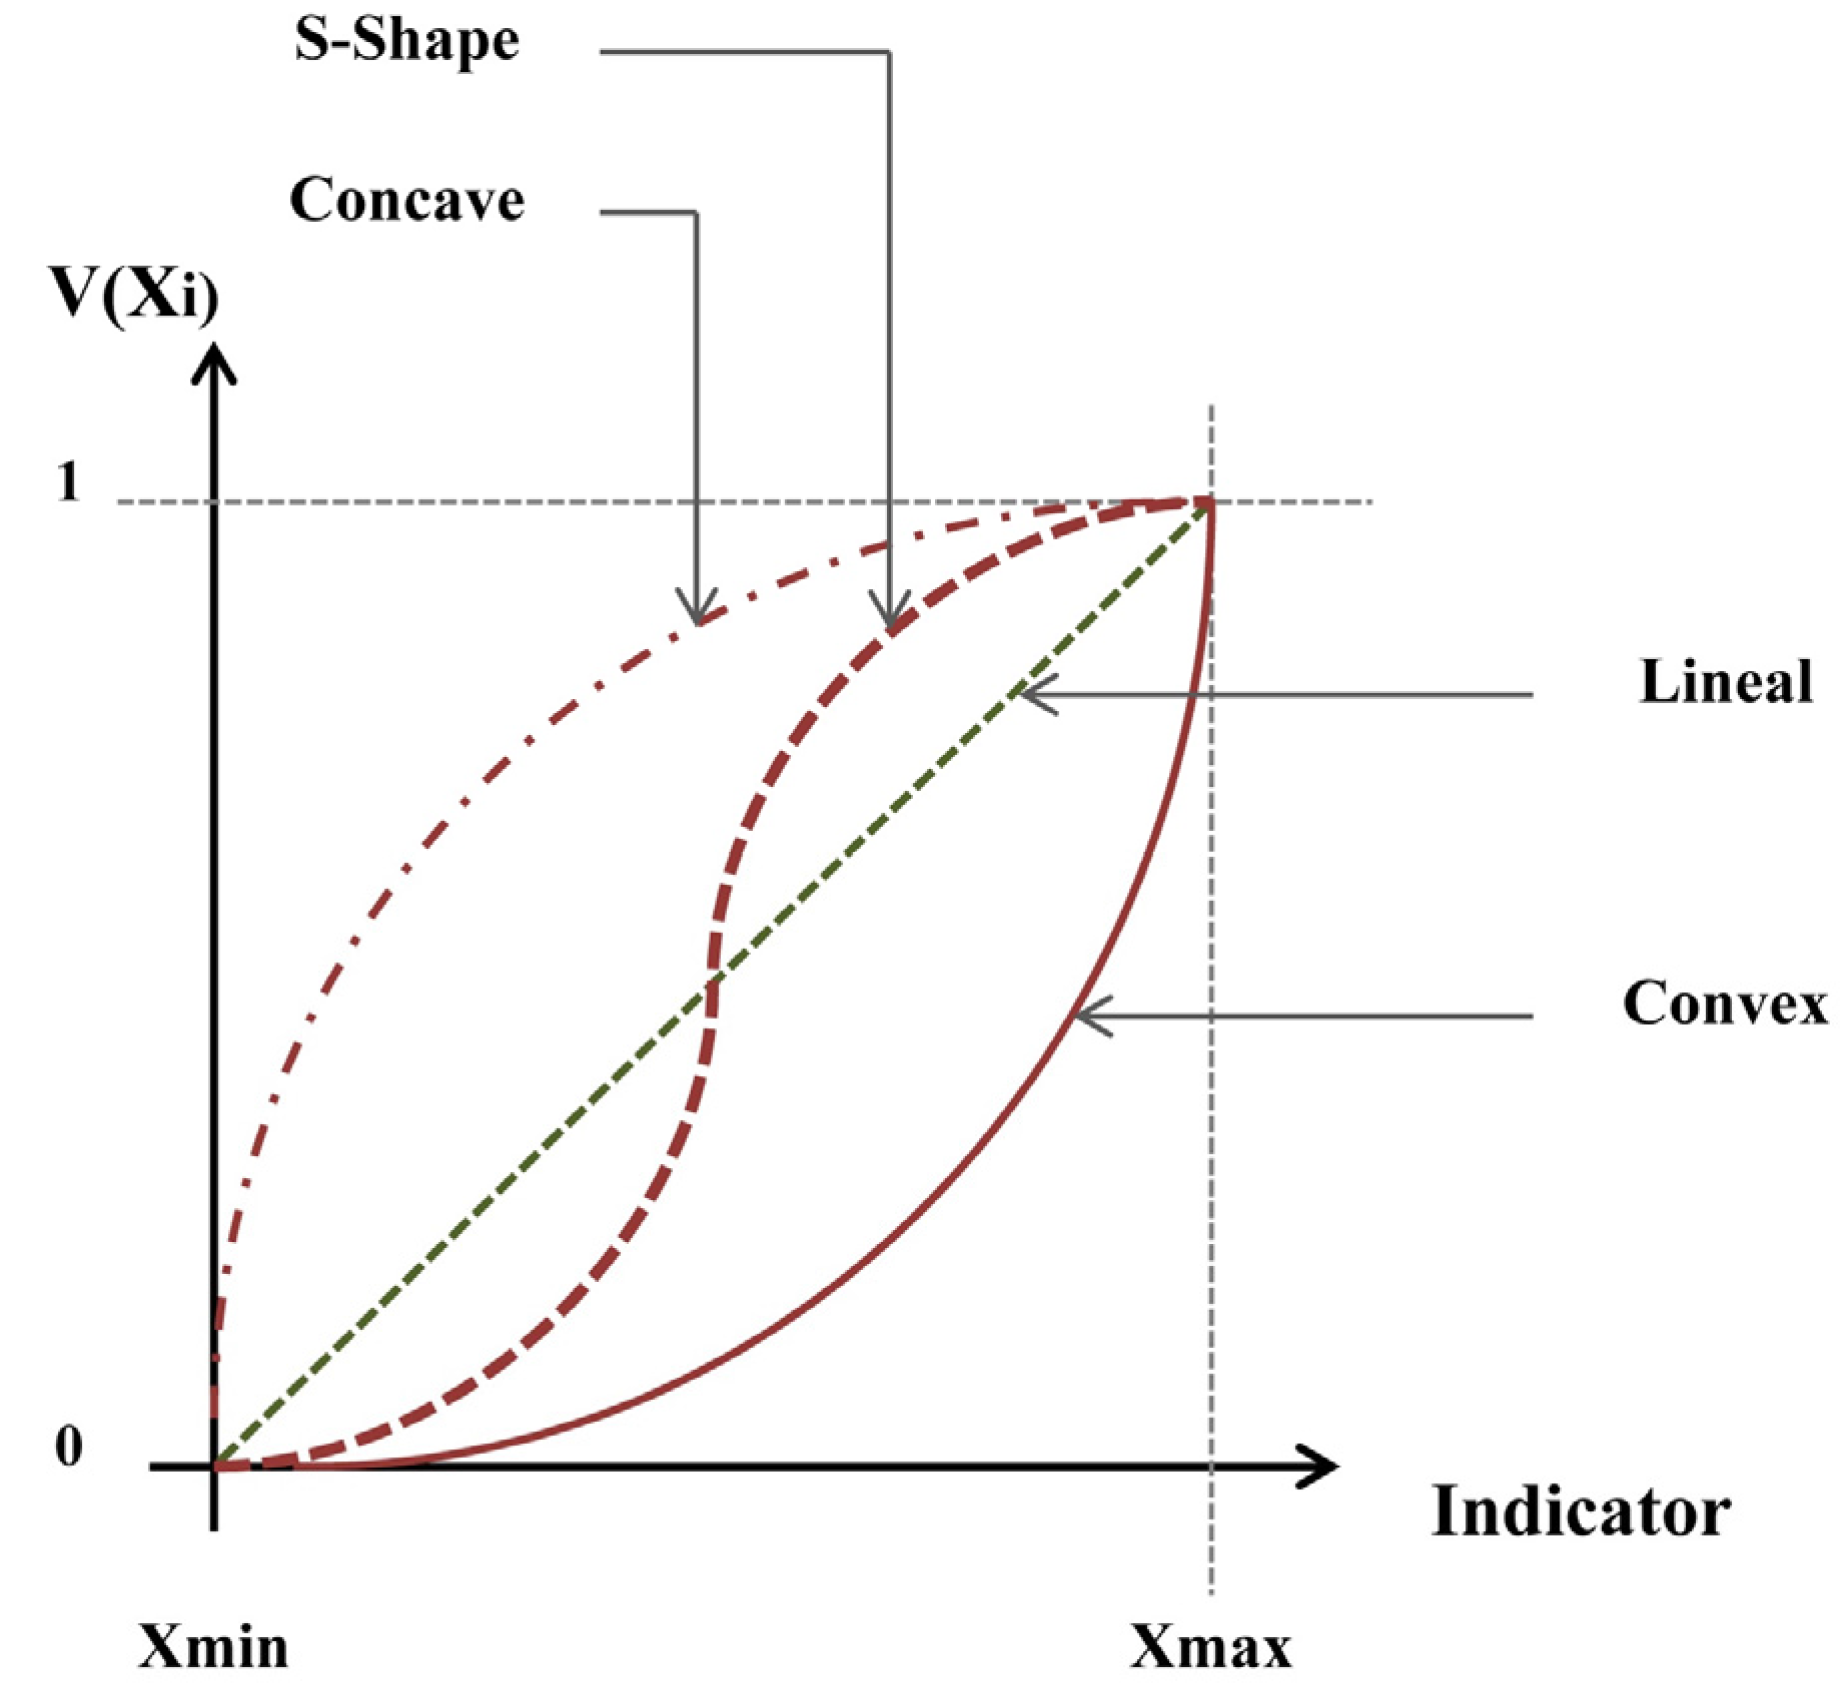
59], the MIVES model outlines a procedure consisting in the definition of: (1) the tendency (increase or decrease) of the value function; (2) the points corresponding to
Pmin and
Pmax; (3) the shape of the value functions (linear, concave, convex, S-shaped); and (4) the mathematical expression of the value function.
The general expression of the value function
Vi used in MIVES to assess the satisfaction of the stakeholders for each indicator corresponds to Equation (2).
In Equation (3), variable
Ki is a factor that ensures that the value function will remain within the range of 0.0–1.0 and that the best response is associated with a value equal to 1.0:
In both Equations (2) and (3): (a) Pi,max and Pi,min are the maximum and minimum values of the indicator assessed. (b) Pi,x is the score of alternative x that is under assessment, with respect to indicator i under consideration, which is between Pi,min and Pi,max. This score generates a value that is equal to Vi(Pi,x), which has to be calculated. (c) Ai is the shape factor that defines whether the curve is concave (Ai < 1), a straight line (Ai ≈ 1) or whether it is convex or S-shaped (Ai > 1). (d) ni is the value used, if Ai > 1, to build convex or S-shaped curves. (e) mi defines the value of the ordinate for point ni, in the former case where Ai > 1.
The geometry of the functions Vi allows establishing greater or lesser exigency when complying with the requisites needed to satisfy a given criterion. For example, the convex functions experience a great increase in value for scores that are close to the minimum value, and the increase in value diminishes as the score approaches the maximum. This type of function is used when one wishes to encourage compliance with minimum requirements. That may be the case, for instance, with sufficiently exacting standards in which mere compliance is highly satisfactory. Another instance may be when the aim is to reward the use of new technologies, and their implementation is seen as very positive (even when it is a partial or a minor one), with a view to encouraging better practices. The maximum and minimum value criteria can be 0, the greatest or worst value of the studied alternatives, etc. depending on each study case.
It can be seen that the shape of the function depends on the values that the parameters
Ai, ni and
mi. The interpretation of these parameters facilitates the understanding and the use of Equation (2).
Table 2 and
Table 3 give characteristic values of these parameters for the definition of increasing and decreasing value functions, respectively. These parameters may vary according to the preferences of the decision maker.
When the shape of the value function for an indicator is unclear, this may be defined by a working group. In these cases, several value functions (discrete or continuous) may be defined according to the members of the group. Therefore, a family of functions is obtained as can be seen in
Figure 2.
The simplest way to solve these differences consists in taking the mean of the different values (after excluding extreme cases). The parameters Ai, Ai, ni and mi can then be estimated through a minimum squares approach. It is also possible to work with a range of values in such a way that two values correspond to each y-value (the mean and the standard deviation). This would require a statistical approach in the subsequent decision process.
This is the explanation that can be applied to study cases that have limited complexity and, therefore, a deterministic approach or for studies with homogeneous alternatives like a same building typology such as school buildings [
71]. Nevertheless, for large and complex cases and assessments with uncertainty there are already developed probabilistic approaches [
75] using MIVES. There are also MIVES methods for heterogeneous alternatives like public infrastructures, which can vary from metro lines to a health center building and require a previous homogenization phase [
65,
66].
3. Applications to the Building Sector
As explained in
Section 2, MIVES has already been successfully applied to study the sustainability in numerous cases within the building sector [
55,
56,
57,
58,
59,
60,
61,
62,
63,
64,
65,
66,
67,
68,
69].
Table 4 presents a representative sample of cases classified in four levels: energy, urban, edifices and building systems and elements. The diversity of these cases, some at an energy or urban level and some about building elements, some assessing broad samples in general and some carrying out analysis in detail,
etc., shows MIVES versatility. This table incorporates the reference where each sustainability assessment is explained thoroughly.
These sustainability assessments have their own particularities. In the following sections, the specific study Cases 6 and 9 are explained in detail. These two cases are representative of the particularities of the different cases shown in
Table 4 and they show the main differentiate characteristics of MIVES. Case 6 assesses a large sample of more than 400 educational edifices while Case 9 analyzes a specific construction element but considering all its constructive and structural characteristics. They both follow all the methodology steps described in
Section 2 but their requirements tree, weights and value functions are particular for each case, as shown in the following sections.
3.1. Sustainable Assessment Applied to Technologies Used to Build Schools
This assessment tool and its application are explained in detail in technical bibliography [
71]. It was a tool designed and applied to assess the sustainability of more than 400 schools built in Spain in the early 2000s [
80]. This tool focused on the analysis of these educational edifices construction processes and the technologies used to build them. These schools were public kindergarten and primary centers for 200 to 400 students, constructed from 2000 to 2014 in short time frames and tight budgets due to an extreme need for new educational centers in short time. They each had a surface from 1500 to 3000 m
2 in which there were: (a) classes and auxiliary spaces for the kindergarten and the primary area; and (b) common areas like a lunchroom, gym, administration and teachers’ area,
etc.These educational edifices were constructed using different technologies. The most representative of which were: on site concrete structure system (NC) [
81], off-site concrete framed structure technology (FC) [
82], off-site steel modules structure system (FS) [
83] and off-site timber structure system (FT) [
84].
Table 5 presents some important characteristics of them.
The definition and application of this MIVES tool solved the endemic necessity of evaluating the economic, social and environmental impact of these school centers and their construction as well as new schools in the future. Therefore, this tool incorporates a simplified Life Cycle Assessment (LCA) [
7].
Table 6 shows the requirements tree of this tool, with its weights and value functions shapes, which were defined during seminars attended by experts from all the involved parties [
71].
The main results of this assessment were the global and the partial sustainability indexes for the construction alternatives. With the global indexes, it was possible to qualify the assessed technologies from more to less sustainable and partial indexes were useful to give advice to their industries in order to improve. These global indexes were: 0.35 for NC; 0.72 for FC; 0.71 for FS and 0.59 for FT. For example, to the studied timber technology, this had an unexpectedly low sustainable index although being a high performance environmental building system.
The reason was its unsuitability for this particular study case due to the unsustainable distance between the production center and the building site. This conclusion demonstrated that technologies are not excellent by themselves but depend on their application. Finally, the authors recommended building future educational edifices following this study sustainability requirement.
3.2. Sustainability Assessment Method Applied to Structural Concrete Columns
This columns sustainability assessment tool was designed to evaluate the sustainability of this single structural component and it is described in detail in technical literature [
72]. Columns are crucial for the mechanical functionality and safety of most buildings, in which they are the structural elements that transmit loads from each floor to the floor below and down to the foundation components. Columns can total up to 25% of the concrete and steel consumption of a building. Therefore, they can significantly reduce a building’s environmental impact by being designed and constructed with the optimum geometry, materials and construction process.
In this sense, this sustainability tool has been applied to analyze alternatives that use fast hardening, self-compacting and high strength concretes. With these advanced concretes it is possible to build columns with smaller cross-sections and higher load capacity. Thus, they permit the building to consume less material, to reduce the columns section and achieve a more optimum profit in available edifice space. These concretes also increase the work performance with shorter construction timeframes. In consequence, several social impact factors such as construction noises and special transportation methods are reduced.
This tool has already been applied to evaluate the sustainability of several alternatives of
in situ reinforced concrete columns for medium size buildings with a maximum of six levels and 500 m
2 per floor. The analysis focuses on the third and fourth floor columns inside the building. These columns are 3 m high and distributed in a 6 m by 6 m structural net. These have mainly moderated compression stresses and not have an excessive reinforcement ratio due to bending loads. Nevertheless, uncertainties such as initial imperfections and building faults have been considered. To do so, as suggested in Model Code 2010 [
85], a minimum eccentricity (e
min) of a value of h/30 has been taken into account, h being the maximum cross-section dimension. These alternatives differ in their cross-section shapes and dimensions, concrete compressive strengths and construction processes. This MIVES tool has also been able to analyze the influence of these variables in the sustainability index of the assessed alternatives, which are presented in
Table 7. The requirements tree, weights and value functions shapes of this tool are shown in
Table 8.
As a result of this assessment we concluded that the most sustainable columns are those with smaller cross-sections and are built using high characteristic compressive strength concretes. This is the alternative Circular 1 with a global sustainable index of 0.85. Analyzing the aforementioned variables we also concluded that: columns executed using self-compacting concretes have a higher sustainability index than those which require being vibrated; circular columns are more sustainable than those square or rectangular shaped due to aesthetic and functional reasons; circular columns have a higher index when using high performance concrete and having small cross-section areas; and square and rectangular alternatives are more sustainable when using conventional concretes and having bigger cross-sections.
4. Discussion
MIVES can generate useful sustainability assessment tools in a broad range of cases within the building sector [
55,
56,
57,
58,
59,
60,
61,
62,
63,
64,
65,
66,
67,
68,
69]. As seen in previous sections, it can define holistic tools for specific samples and study cases. In some of these cases, the suitability of MIVES application has been assessed and this MCDM has proved to be the best sustainable tool to use in those studies [
71]. To use this tool, a rigorous and complete process must be carried out following the seven steps described in
Section 2. This process is the origin of the main weak points of MIVES. These drawbacks are the experts’ time and dedication needed to define each specialized assessment tool following the aforementioned steps. These weaknesses can be overcome with outstanding results, as proven in tight framed cases in which MIVES has already been applied [
69,
70,
71]. Their results prove that these weaknesses exclusively difficult the methodology process but do not have any effect on the resulting tool or its sustainability assessment. Therefore, solutions to these weaknesses are based on advancing the seven steps of this methodology process before the application of the assessment tool. However, in some assessment cases, these drawbacks will result in it not being feasible to apply this MCDM.
This is the case of samples that can be assessed successfully using existing environmental and sustainability assessment tools. The main sample of these tools has been presented in the introduction. As has been explained, there are two main groups with their own field of application:
- (a)
Environmental evaluating tools for detailed specific and particular studies. This is the case of LCA, LCC and similar tools, which are the best options to assess a specific issue during part or the whole life cycle of a construction defined entity. This issue can be the environmental impact, economic impact, energetic consumption, materials flow, etc. The defined entity can be a construction element like a brick, a construction material like concrete, etc.
- (b)
Certification tools that give a qualification of satisfaction of different sustainability aspects that are evaluated of a building. A representative sample of these tools and their main features are presented in the introduction. It can be seen that they differ in their area of application, rating system, complexity, result, etc. Choosing between one tool and another is a complex task but internationally recognized tools have broader experience and reputation while local tools are more sensible to local features.
There is a third more heterogeneous group comprised of specific research projects and studies. Some cases could be solved by following the steps of a previous similar study using MCDM, POE or participatory processes, etc. However, any new study case should be similar to the previous one in which this new study relies on. Moreover, any required changes and adaptations would be important time consuming drawbacks.
Finally, in other cases not described in the previous paragraphs, no other tools have been found that could be used to carry out the assessment.
5. Conclusions
A thorough review of sustainability assessment tools confirms that there is a lack of a general method capable of covering all assessment cases. Contrarily, it has been highlighted that each tool is rather oriented to specific purposes: (a) environmental evaluating tools for detailed specific and particular studies; (b) certification tools for sustainability certifications of buildings; (c) MIVES for holistic sustainability assessments of specific cases; and (d) a more heterogeneous group comprised of particular sustainability research projects and study cases. It has also pointed out that the sustainability assessment of some cases cannot be dealt representatively with the existing tools. This means that from now on there is still work to do to cover all sustainable assessments, either increasing the application capacity of the existing tools or defining new ones.
In this research paper, a complete analysis of MIVES has been carried out. This methodology has been studied in detail by showing and discussing its phases, its area of application and two study cases. This analysis concludes that MIVES can define complete, objective and easy to apply sustainability assessment methods for most samples within the construction sector. These methods are specific for each case, can be deterministic or probabilistic, assess homogenous or heterogeneous alternatives and give integrated sustainability indexes. These MCDM advantages rely on a rigorous defining process that requires time and dedication from multidisciplinary experts. In consequence, MIVES is not applicable to urgent assessments that need a new specific tool. This limitation is common to first time applied tools that need a definition process prior to the assessment, like previously mentioned MCDM, POE, etc. Nevertheless, as shown in previous sections, several MIVES study cases have already solved this limitation anticipating the defining process of each new tool.


