Article

Analysis of Environmental Impact for Concrete Using LCA by Varying the Recycling Components, the Compressive Strength and the Admixture Material Mixing

1
Building and Urban Research Institute, Korea Institute of Civil Engineering and Building Technology, Daehwa-dong 283, Goyandae-Ro, ILsanseo-Gu, Goyang-Si 10223, Korea
2
School of Architecture & Architectural Engineering, Hanyang University, Sa 3-dong, Sangrok-Gu, Ansan-Si 04763, Korea
*
Author to whom correspondence should be addressed.
Sustainability 2016, 8(4), 389; https://doi.org/10.3390/su8040389
Submission received: 21 March 2016 / Revised: 13 April 2016 / Accepted: 13 April 2016 / Published: 20 April 2016
(This article belongs to the Special Issue Life Cycle Assessment on Green Building Implementation)

Abstract

:
Concrete is a type of construction material in which cement, aggregate, and admixture materials are mixed. When cement is produced, large amounts of substances that impact the environment are emitted during limestone extraction and clinker manufacturing. Additionally, the extraction of natural aggregate causes soil erosion and ecosystem destruction. Furthermore, in the process of transporting raw materials such as cement and aggregate to a concrete production company, and producing concrete in a batch plant, substances with an environmental impact are emitted into the air and water system due to energy use. Considering the fact that the process of producing concrete causes various environmental impacts, an assessment of various environmental impact categories is needed. This study used a life cycle assessment (LCA) to evaluate the environmental impacts of concrete in terms of its global warming potential, acidification potential, eutrophication potential, ozone depletion potential, photochemical ozone creation potential, and abiotic depletion potential (GWP, AP, EP, ODP, POCP, ADP). The tendency was that the higher the strength of concrete, the higher the GWP, POCP, and ADP indices became, whereas the AP and EP indices became slightly lower. As the admixture mixing ratio of concrete increased, the GWP, AP, ODP, ADP, and POCP decreased, but EP index showed a tendency to increase slightly. Moreover, as the recycled aggregate mixing ratio of concrete increased, the AP, EP, ODP, and ADP decreased, while GWP and POCP increased. The GWP and POCP per unit compressed strength (1 MPa) of high strength concrete were found to be about 13% lower than that for its normal strength concrete counterpart. Furthermore, in the case of AP, EP, ODP, and ADP per unit compressed strength (1 MPa), high-strength concrete was found to be about 10%~25% lower than its normal strength counterpart. Among all the environmental impact categories, ordinary cement was found to have the greatest impact on GWP, POCP, and ADP, while aggregate had the most impact on AP, EP, and ODP.

1. Introduction

Concrete is a construction material manufactured by the mixing of cement, aggregate, mixed water, and admixture materials. In the process of producing cement, which is the main composition material for concrete, not only do natural resources such as limestone and clay become depleted, but environmental impact substances are also emitted during clinker manufacturing through pyro process due to large amounts of energy use [1]. Additionally, the extraction of natural aggregate can lead to soil erosion or ecosystem destruction, while the waste sludge and wastewater emitted from a concrete batch plant have harmful effects on the water ecosystem [2].
As concrete has several impacts on the environment, the selection of various environmental impact categories is needed. When only a single environmental impact is evaluated, the limited assessment could lead to false interpretations of concrete’s eco-friendliness. Therefore, efforts and investment to develop a design standard from the perspective of the life cycle of concrete to minimize its environmental impact are being conducted. In environmentally advanced nations such as the U.K. and Sweden, the Royal Institute of British Architects (RIBA) [3] and the Swedish Environmental Management Council [4] are developing Product Category Rules (PCRs) and conducting certification focused on construction products from their production to their disuse. The development of the draft version [5] of ISO 13315-2 (environmental management for concrete and concrete structures), an international standard regarding concrete, is ongoing. However, in Korea, quantitative studies on the environmental impact in the concrete industry are at their starting points, and data for policymaking and technological support to turn the concrete industry into a sustainable industry are also lacking [6]. Most research has a strong tendency to be focused on global warming wherein greenhouse gas emissions are evaluated. In addition to those concerning global warming, studies on product category rules and standards development on acidification, ozone layer destruction, and eutrophication are also in their primary stages [7,8]. The object of this study is to evaluate the effects of the increase in compressive strength, admixture material mixing, recycled aggregate mixing, and the amount of binder on environmental impact in a quantitative manner. The environmental impact assessment on concrete was based on the life cycle assessment process suggested in the ISO 14040 series [9,10], and environmental impact assessment index was based on “Korean Eco-indicator methodology” suggested by the Ministry of Environment in Korea [11]. Environmental impacts (global warming, acidification, eutrophication, ozone depletion, photochemical ozone creation, and abiotic depletion) were evaluated in a quantitative manner using 1000 concrete designs of a mix proportion database, and the major causes of environmental impact were analyzed.

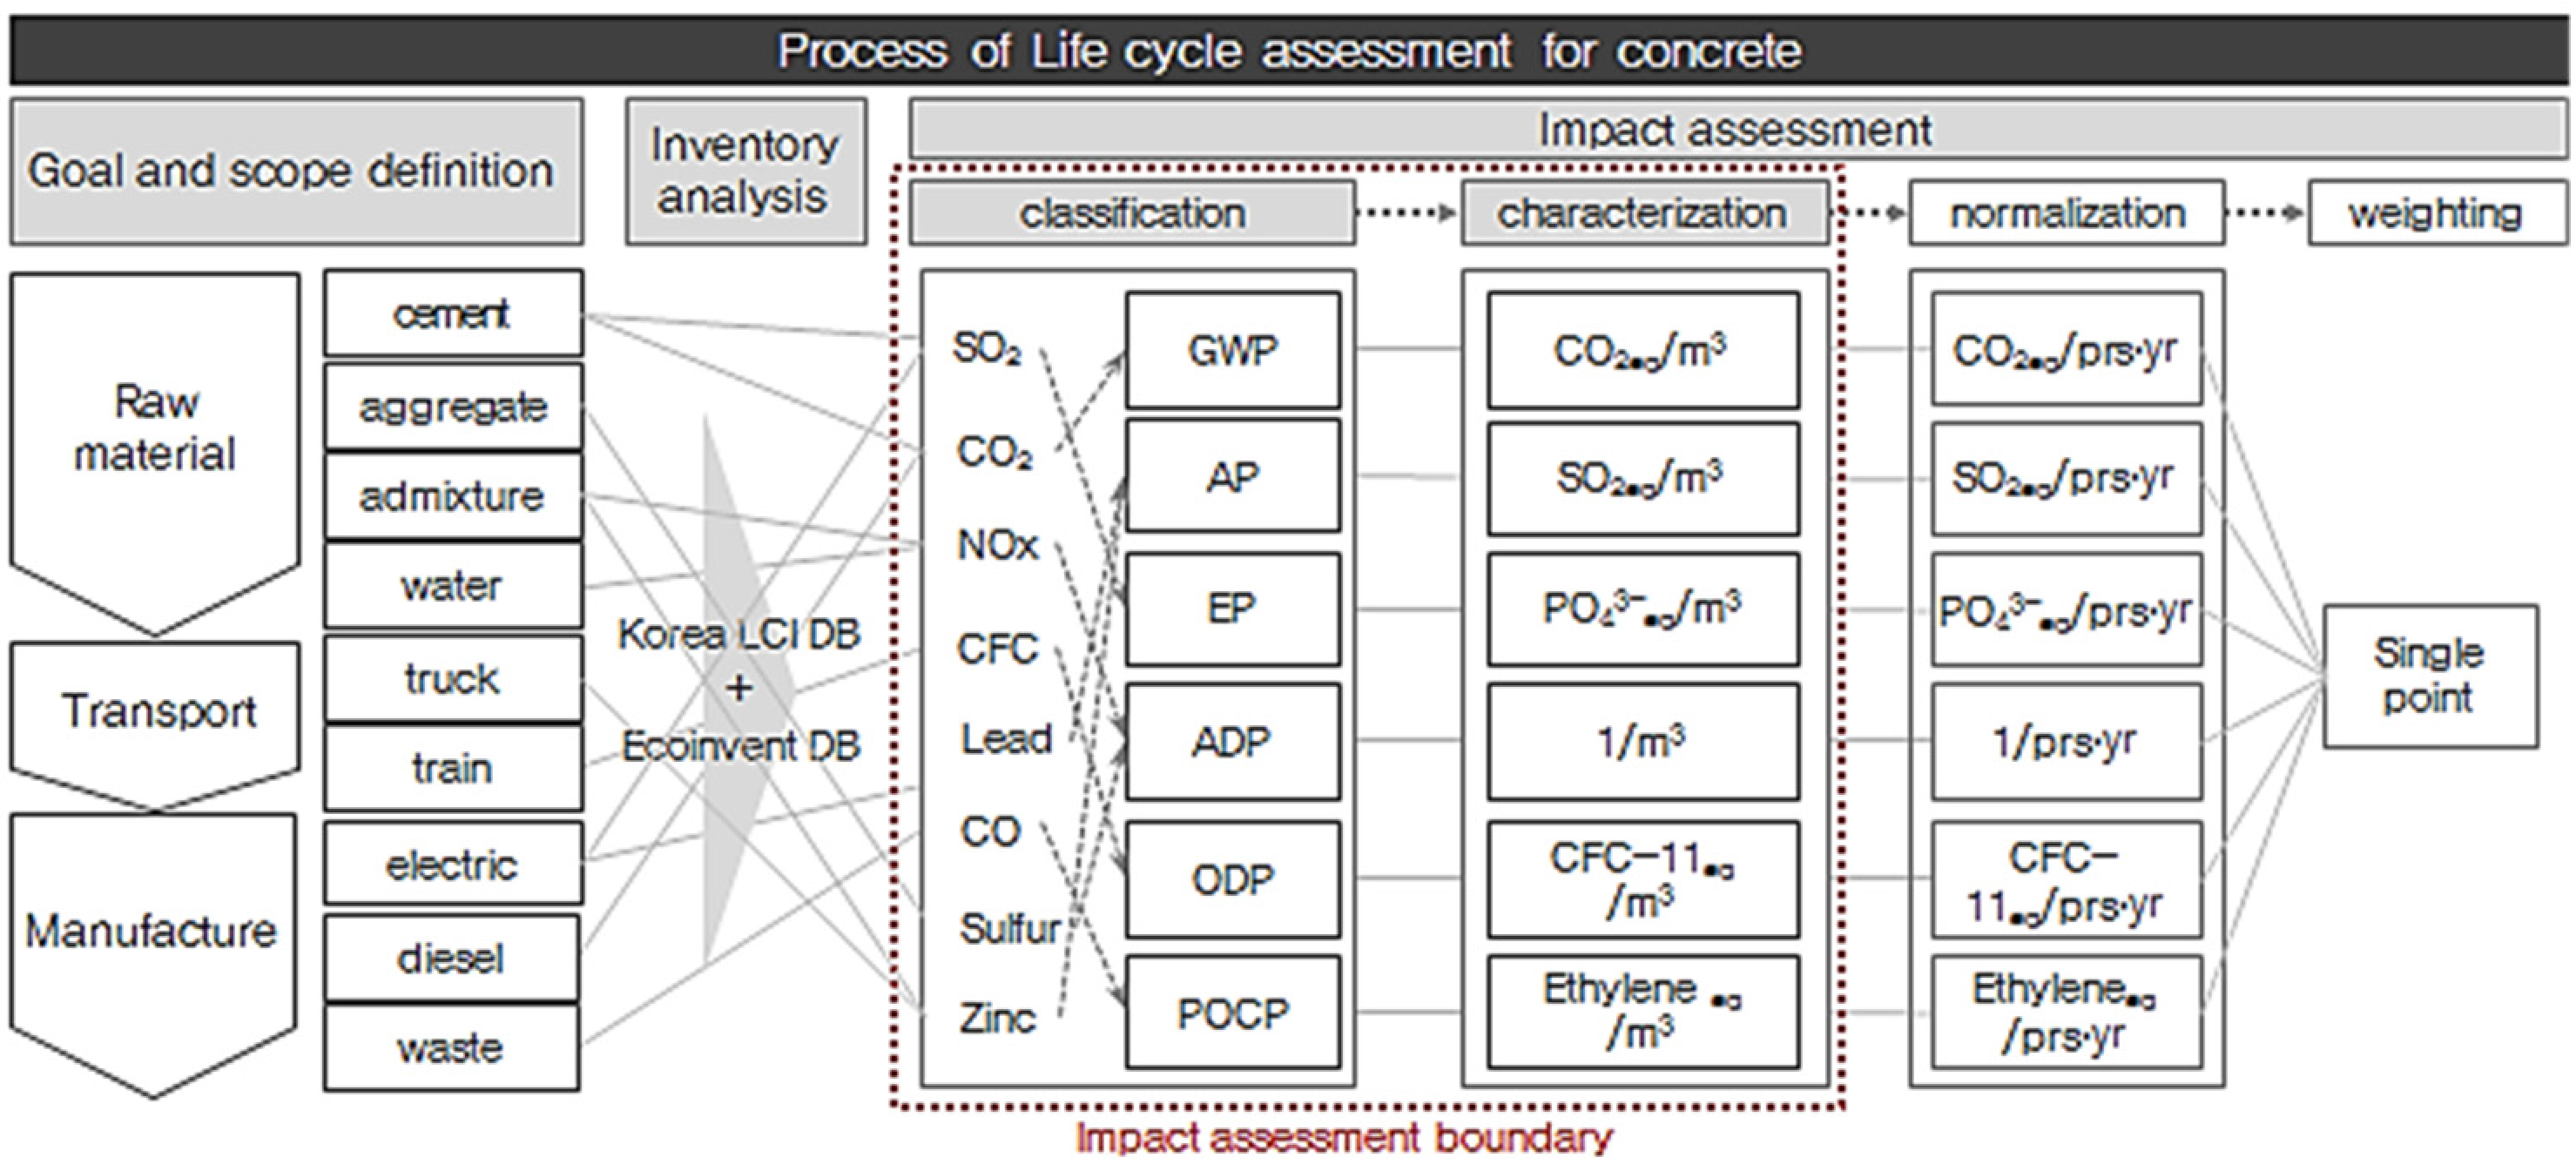
2. Method of Environmental Impact Assessment for Concrete

2.1. Goal and Scope Definition

The product selected for environmental impact assessment was ordinary concrete, and based on various functions of concrete, concrete structures and the formation of concrete products were selected as major functions. Concrete size of 1 m3 was selected as the functional unit.
The product stage of concrete (Cradle to Gate) was selected as the system boundary for the life cycle assessment of concrete, as can be seen in Figure 1. Furthermore, the production stages of concrete were divided into raw material, transportation, and manufacturing stages, and the environmental impact of factors in each stage on air and water systems was evaluated [12].

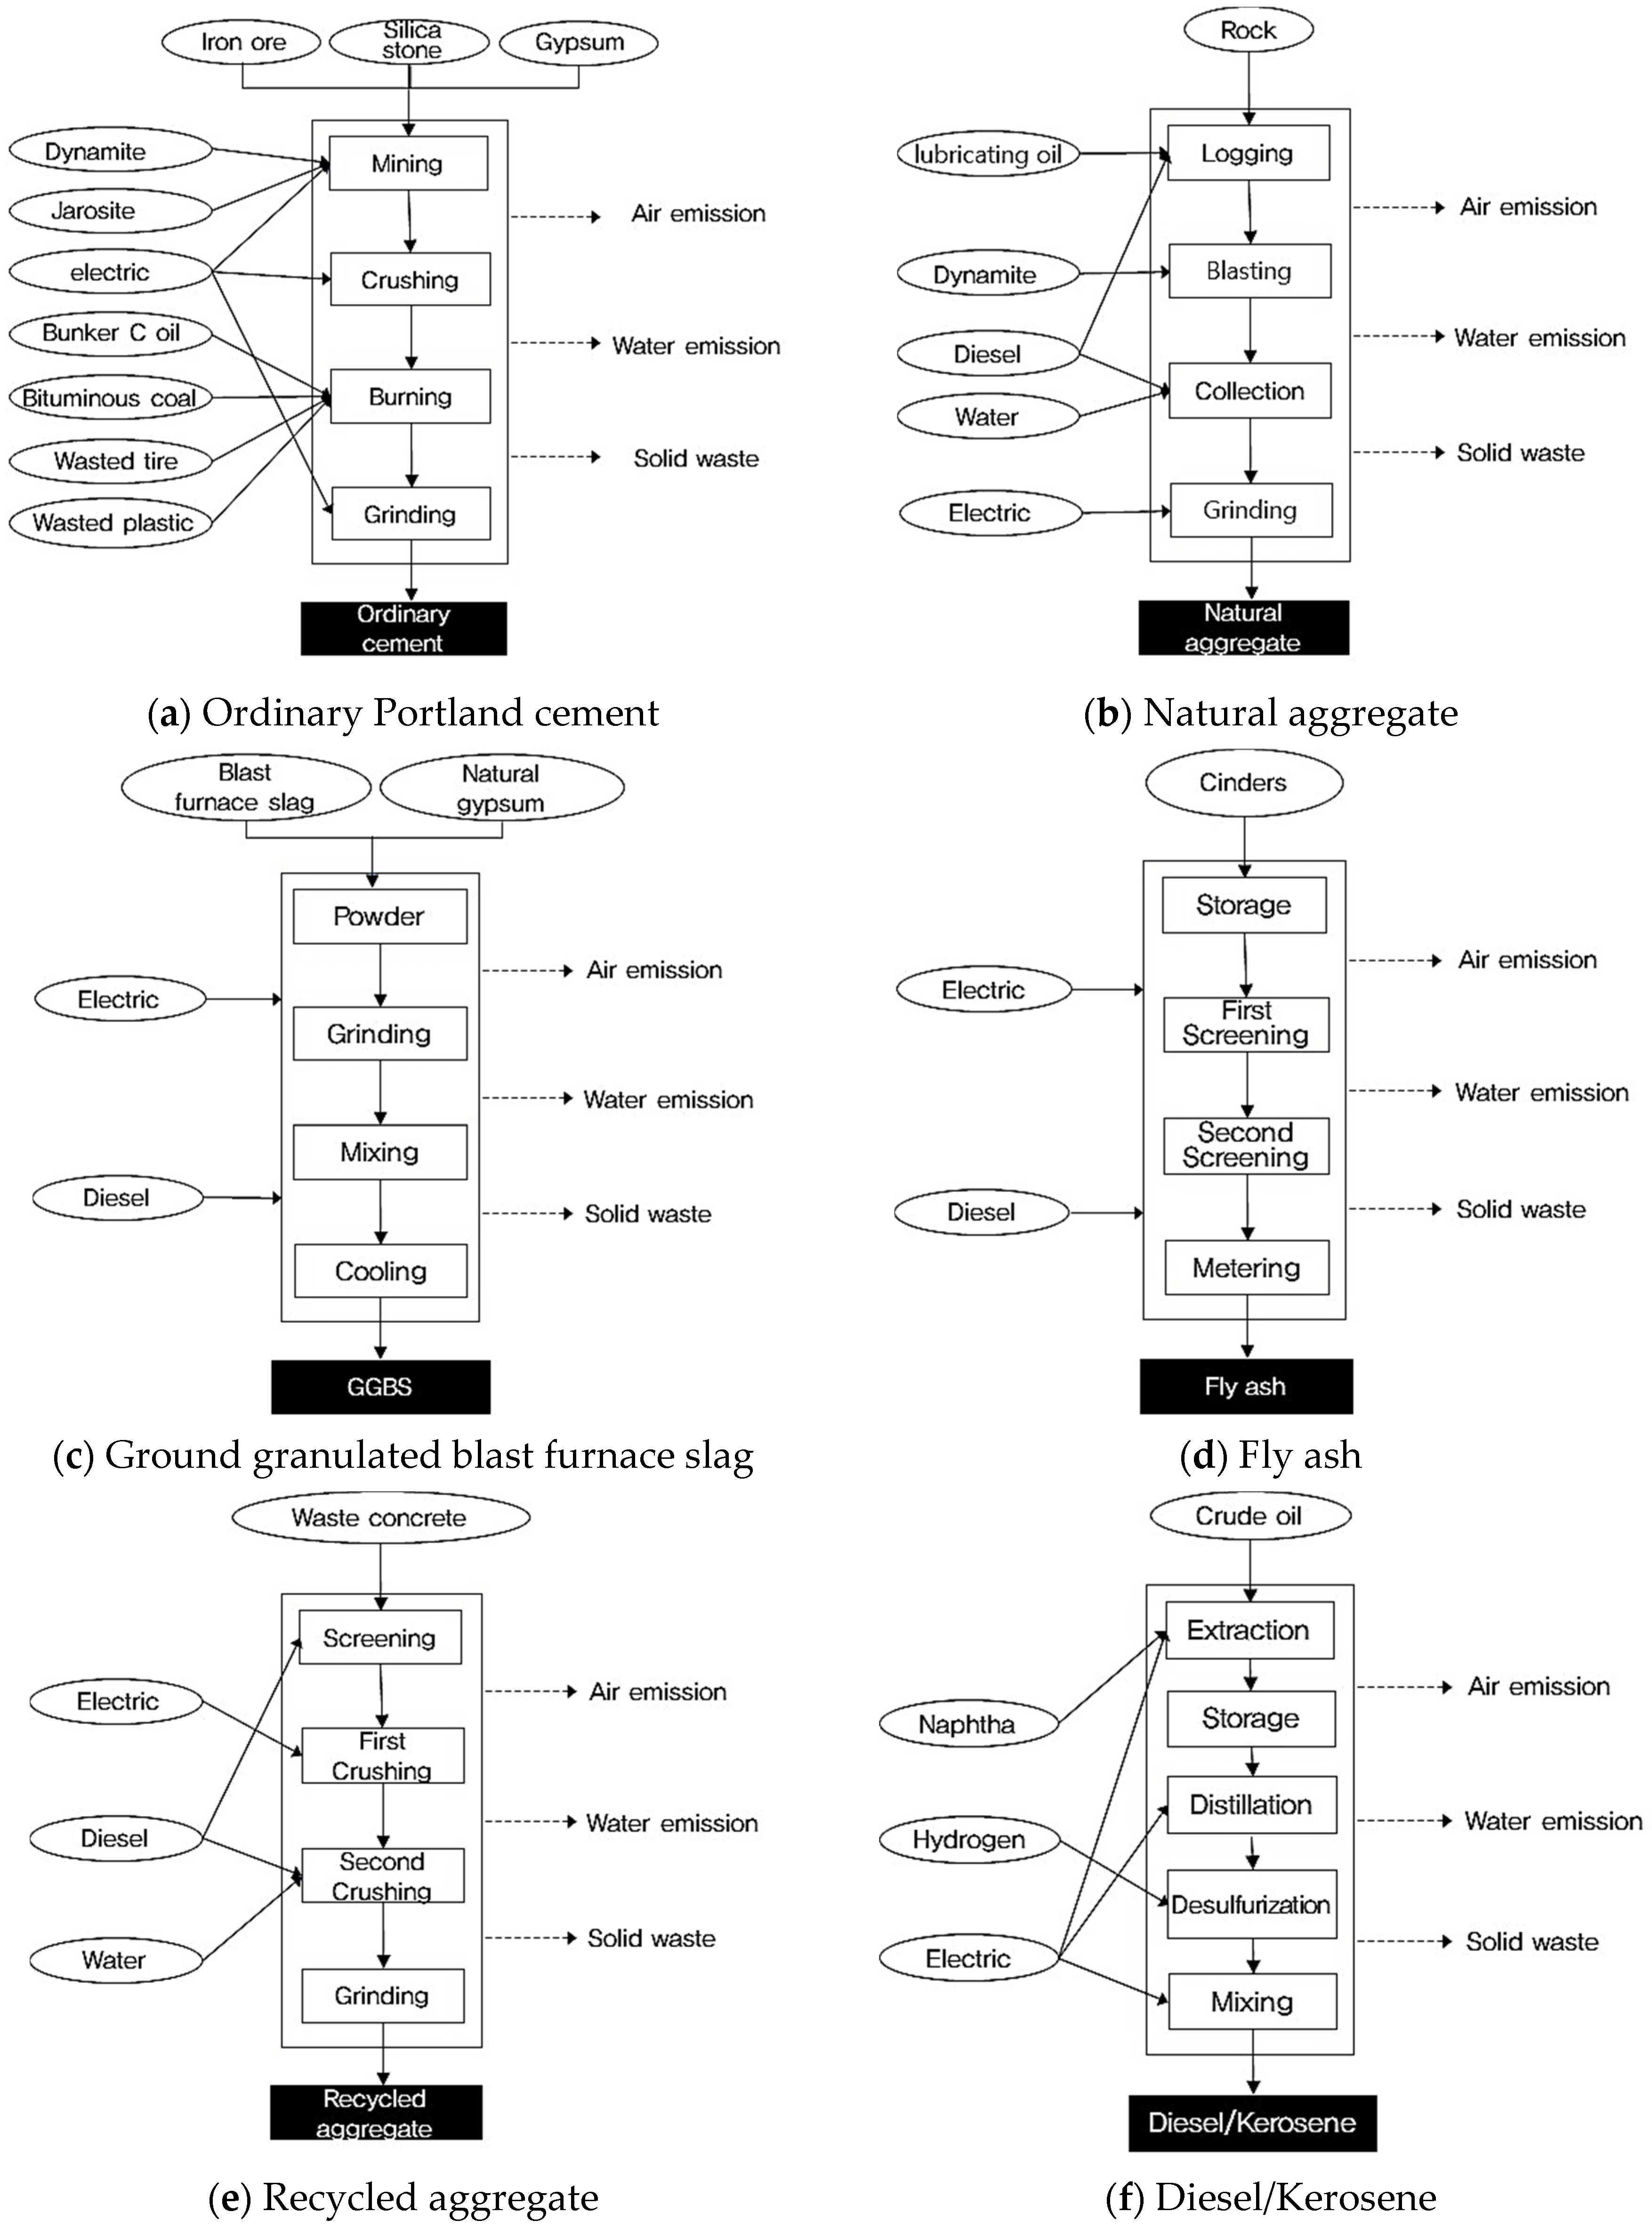
2.2. Inventory Analysis

Based on the life cycle assessment ranges (system boundary) of concrete, input factors and output factors such as energy, raw material, product, and waste were analyzed. To this end, as can be seen from Table 1, the LCI DB (Life Cycle Index Database) on each of the input materials and energy sources in concrete production was investigated.
The LCI DB on the input materials and energy sources used in this life cycle assessment utilized the existing data of Korea’s Ministry of Land, Infrastructure, and Transport [13] and Ministry of Environment [14]. As the LCI DB is different for each country, the DB offered in one’s own country should be used. However, the LCI DB on ground granulated blast-furnace slag, fly ash, and admixture in Korea’s LCI DB has not been established yet. Therefore, the DB [15] of ecoinvent, an overseas LCI DB, was used.

2.3. Environmental Impact Assessment

In general, an impact assessment is divided into the following stages: classification, in which list items elicited from the list analysis are gathered into corresponding impact categories; characterization, in which the items are categorized into impact categories, and the impact for each category is quantified; normalization, where the environmental impact of each impact category is divided by the total environmental impact of a specific area or period and, lastly; weighting, where the relative advantage among the impact categories is identified. Here, the classification and characterization stages are essential components as per the standards of ISO 14044, while the normalization and weighting stages can be applied as optional components. Currently, as normalization and weighting factors customized for concrete are not yet developed, this study evaluated up to the characterization stage. Environmental problems arising from this are global warming, ozone depletion, photochemical ozone creation, abiotic depletion, eutrophication, and acidification. Therefore, as seen in Table 2, based on the reference material and impact index of the six environmental impact categories such as Global Warming Potential (GWP), Abiotic Depletion Potential (ADP), Acidification Potential (AP), Eutrophication Potential (EP), Ozone Depletion Potential (ODP), and Photochemical Ozone Creation Potential (POCP), characterization values for each environmental impact category of concrete were calculated. As for the reference material and impact index for each environmental impact category, they were based on the database adopted by Korea’s Ministry of Environment’s Environmental Declaration [16], and classification and characterization were conducted using the LCI DB selected beforehand.
Classification consists of classifying and gathering impact materials according to environmental impact categories. Generally, when impact materials taken from LCI DB are classified by their environmental impact category, and when they are grouped according to the categories of environmental impact, the impact pattern of each material on the environment can be clearly identified. From the classification details of concrete LCI DB of this study, based on the reference material and impact index on each environmental impact category, Table 3 shows examples of ordinary cement and coarse aggregate. The IPCC (Intergovernmental Panel on Climate Change) guideline [17] defines 23 types in total, including carbon dioxide (CO2), methane (CH4), and nitrous oxide (N2O), as substances that have an impact on global warming, while the reference material is carbon dioxide (CO2). Resource depletion is based on the standard suggested by Guinee (1995) [18], and considers 89 types of resource items in total including crude oil, natural gas, and uranium (U). As for the acidification impact index, while it differs by regional characteristics and atmospheric environment, the impact index suggested by Heijung et al. and Hauschild and Wenzel [19] was applied as it is applicable to any region. Twenty-three impact materials in total, including sulfur dioxide (SO2), hydrogen sulfide (H2S), and hydrogen fluoride (HF), all appear as sulfur dioxide (SO2), the reference material.
As for the eutrophication impact index, Heijung et al. and Hauschild and Wenzel’s impact index was applied, just as it had been applied in the acidification impact index. Among a total of 11 types of impact materials such as phosphate (PO43−), ammonia (NH3), and nitrogen oxides (NOx), the reference material was phosphate (PO43−). In the case of ozone depletion, the impact index suggested by World Metrological Organization (WMO) [20] was selected, which considers a total of 23 types of impact materials such as CFC (chlorofluorocarbon)-11, Halon-1301, and CFC-114, and takes CFC-11 as the reference material. Among a total of 128 types of impact materials, including ethylene, NMVOC (Non-methane volatile organic compounds), and ethanol, photochemical ozone creation takes ethylene as reference material, and the impact index suggested by Derwent et al. (1998) [21] and Jenkin and Hayman (1999) [22] was applied. Characterization is the process of quantifying the environmental traits of classified impact materials according to each environmental impact category. In the classification stage, the corresponding impact materials in each environmental impact category were identified and linked to, but as the impact index of each impact material is different, it was hard to identify the extent of impact in a quantitative manner. Therefore, the characterization value of concrete was calculated in a quantitative manner by multiplying the environmental load of impact materials with the impact index for each environmental impact category, and adding all of them. This process is shown in Equation (1), and here, CIi equals the characterization value, Loadj equals the impact material j’s environmental load, and eqvi,j equals the environmental impact index of the impact material j that is within the environmental impact category of i. Table 3 shows an example of the environmental impact characterization value of raw material used in the production of concrete in this study.
CIi = ∑CIi,j = ∑(Loadj · eqvi,j)
Here, CIi is the size of impact that all the list items (j) included in the impact category i have on the impact category in which they are included. CIi,j is the size of impact that the list item j has on impact category i, Loadj is the environmental load of the jth list item, and eqvi,j is the characterization coefficient value of jth list item within impact category I [23].

(1) Global Warming Potential (GWP)

Global warming is a phenomenon that refers to the rising average surface temperature of the Earth, primarily due to the increasing level of GHG (Greenhouse Gases) emissions. The standard substance for GWP is CO2. Global warming causes changes in the terrestrial and aquatic ecosystems and in coastlines due to rising sea levels. The category indicator of GWP is expressed by Equation (2):
GWP = ∑ Load(i) × GWP(i)
where Load(i) is the experimental load of the global warming inventory item (i) and GWP(i) is the characterization factor of global warming inventory item (i).

(2) Ozone Depletion Potential (ODP)

Ozone depletion refers to the phenomenon of decreasing ozone density through the thinning of the stratospheric ozone layer (15–30 km altitude) as a result of anthropogenic pollutants. This leads to increased UV (Ultraviolet Ray) exposure of human skin, which implies a potential rise in incidence of melanoma. The standard substance for ODP is CFCs, and the category indicator of ODP is expressed by Equation (3):
ODP = ∑ Load(i) × ODP(i)
where Load(i) is the experimental load of the ozone depletion inventory item (i) and ODP(i) is the characterization factor of inventory item (i) of the ozone depletion category.

(3) Acidification Potential (AP)

Acidification is an environmental problem caused by acidified rivers/streams and soil due to anthropogenic air pollutants such as SO2, NH3, and NOx. Acidification increases mobilization and leaching behavior of heavy metals in soil and exerts adverse impacts on aquatic and terrestrial animals and plants by disturbing the food web. The standard substance for assessing AP is SO2. The category indicator of AP is expressed by Equation (4):
AP = ∑ Load(i) × AP(i)
where Load(i) is the experimental load of the acidification inventory item (i) and AP(i) is the characterization factor of inventory item (i) of the acidification category.

(4) Abiotic Depletion Potential (ADP)

Input materials (natural resources) required for concrete production are classified into renewable resources, such as groundwater and wood, and nonrenewable resources, such as minerals and fossil fuels. Abiotic depletion refers to the exhaustion of nonrenewable resources and the ensuing environmental impacts. The category indicator of ADP is expressed by Equation (5):
ADP = Load(i) × ADP(i)
where Load(i) is the environmental load of the ADP inventory item (i) and ADP(i) is the characterization factor for the ADP inventory item (i).

(5) Photochemical Oxidant Creation Potential (POCP)

Photochemical oxidant creation refers to the reaction of airborne anthropogenic pollutants with sunlight that produces chemical products such as ozone (O3), leading to an increase in ground level ozone concentration; this causes smog that contains chemical compounds adversely affecting ecosystems and hazardous to human health and crop growth. Ethylene is used as the standard substance for POCP. The category indicator of POCP is expressed by Equation (6):
POCP = ∑ Load(i) × POCP(i)
where Load(i) is the environmental load of the POCP inventory item (i) and POCP(i) is the characterization factor for the POCP inventory item (i).

(6) Eutrophication Potential (EP)

Eutrophication is a phenomenon in which inland waters are heavily loaded with excess nutrients due to chemical fertilizers or discharged wastewater, triggering rapid algal grow and red tides. The standard substance for EP is PO43−. The category indicator of EP is expressed by Equation (7):
EP = ∑ Load(i) × EP(i)
where Load(i) is the environmental load of the EP inventory item (i) and EP(i) is the characterization factor for the EP inventory item (i).

3. Environmental Impact Analysis of Concrete

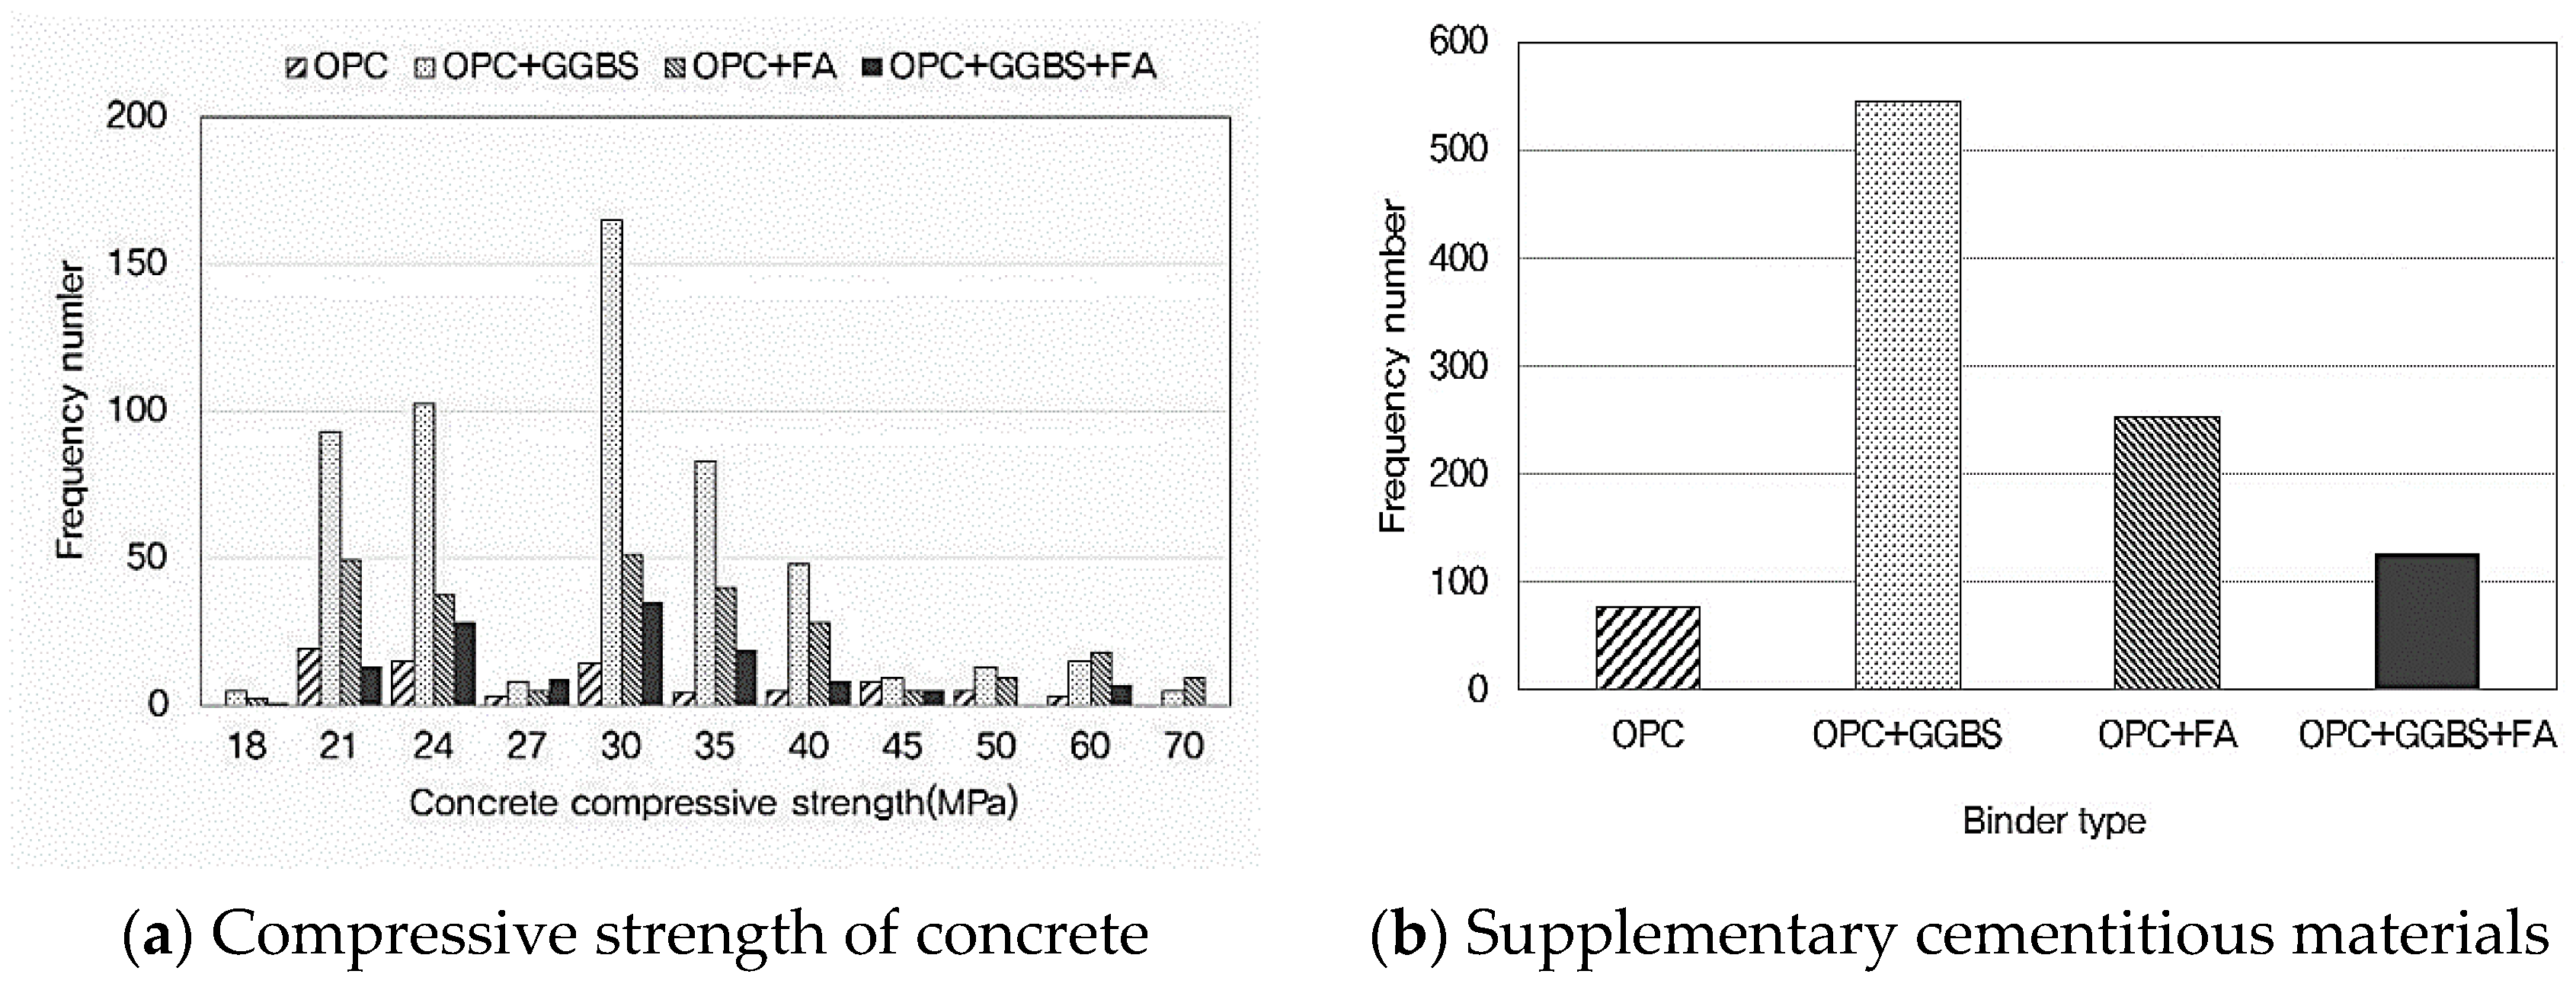
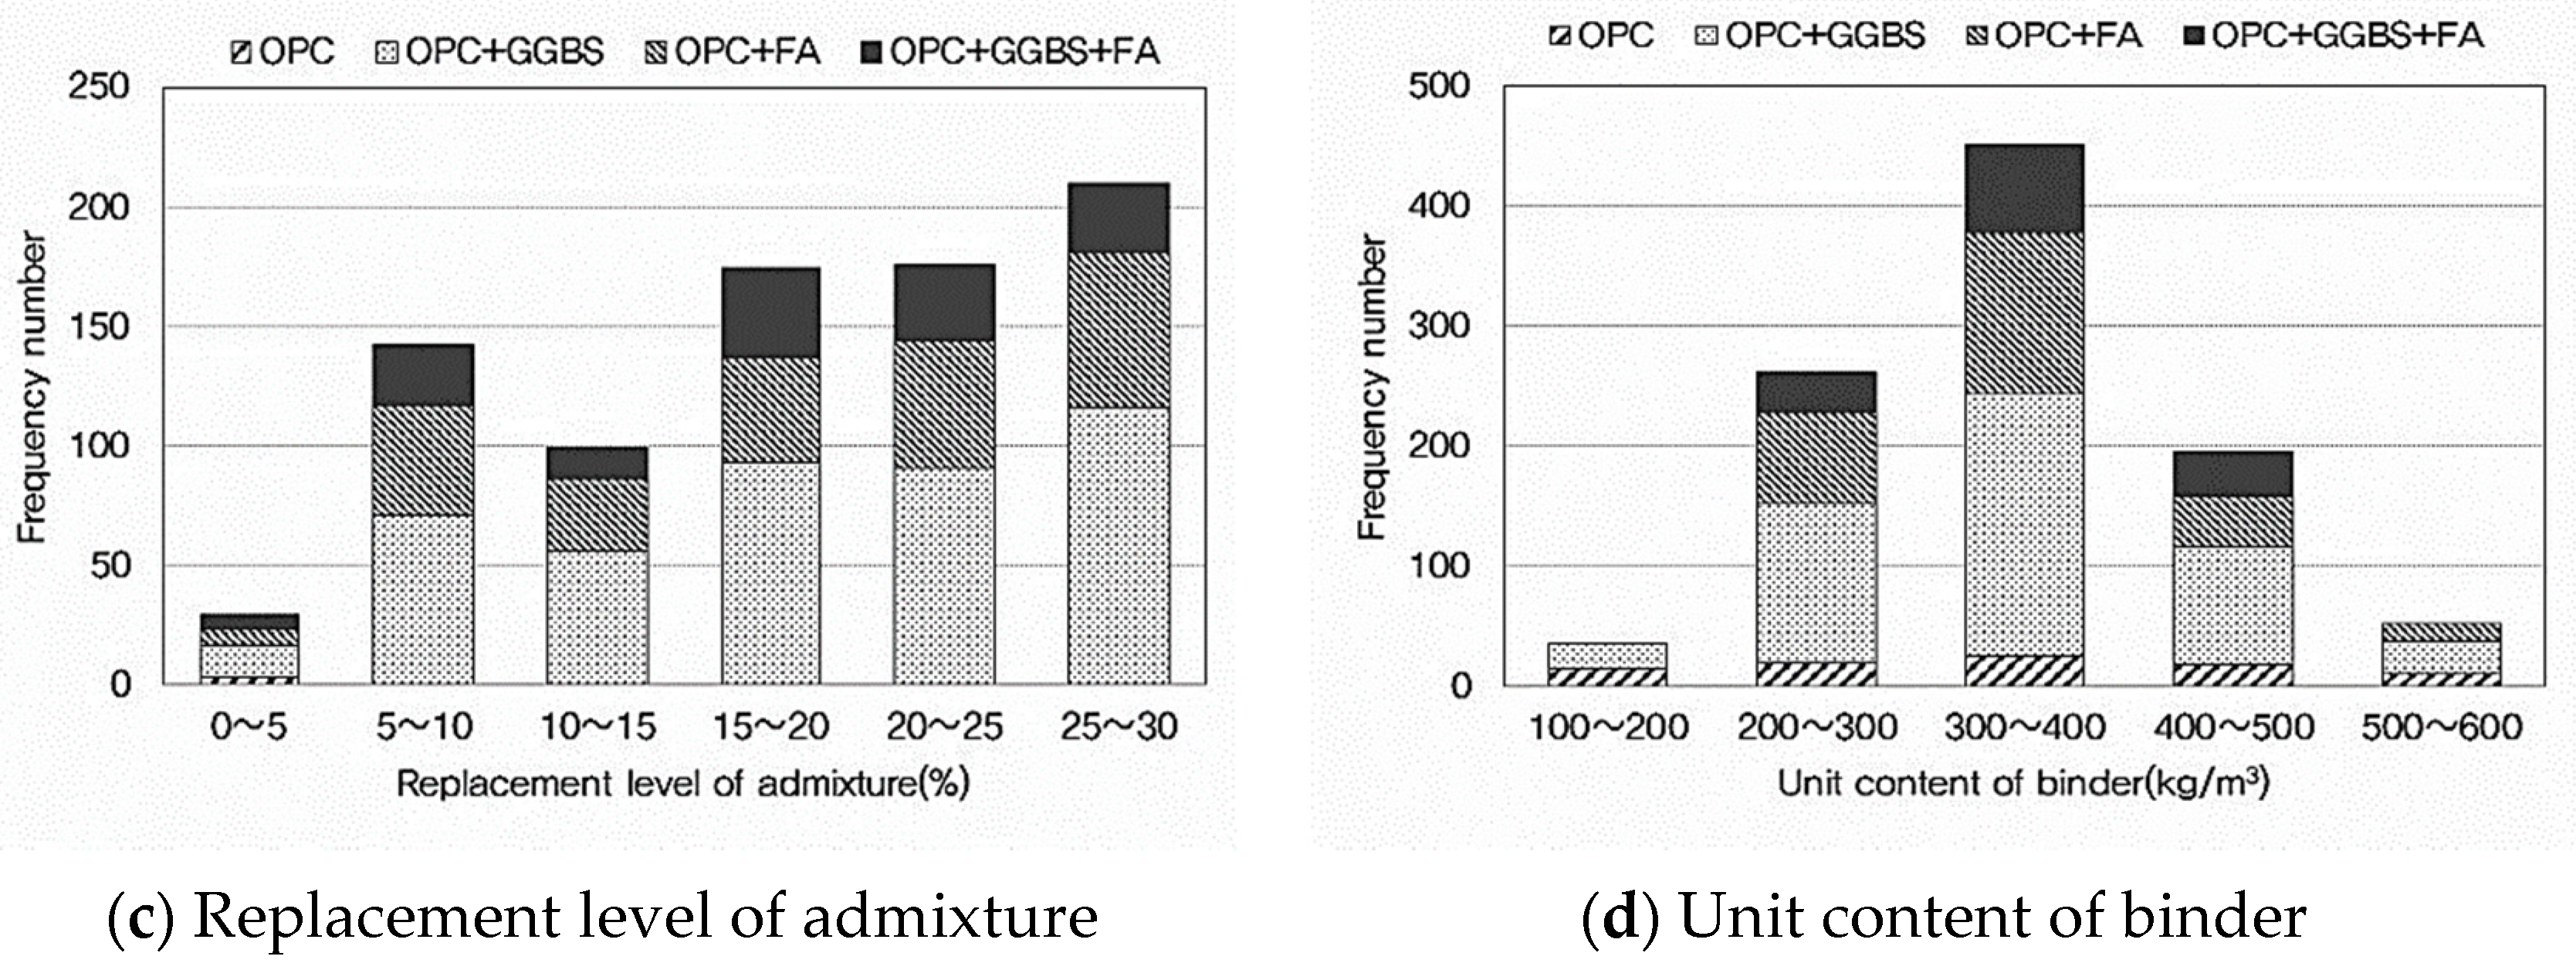
3.1. Mix Design Database

In order to evaluate the life cycle environmental impact of concrete, about 1000 concrete mix designs were surveyed. As shown in Figure 2, the range of compressive strength is 18 MPa~80 MPa. Among them, 800 are normal strength (below 18~40 MPa) concrete mix, and 200 are high-strength (40~80 MPa) concrete mix.
Furthermore, there are 76 concrete mixes that use only OPC (Ordinary Portland Cement) as binder, 546 concrete mixes in which GGBS (Ground Granulated Blast furnace Slag) is mixed, 253 concrete mixes where fly ash is mixed, and 125 concrete mixes where both GGBS and fly ash are mixed. The range of unit binder amount was distributed the most in 300~400 (kg/m3), and the least in 500~600 (kg/m3). The effect of the admixture mixing ratio on the unit binder amount was not very significant. Also, based on the Korean statute regarding the mandatory amount of recycled aggregate to be used, the recycled aggregate mixing ratio was divided into 0%, 10%, 20%, and 30%.

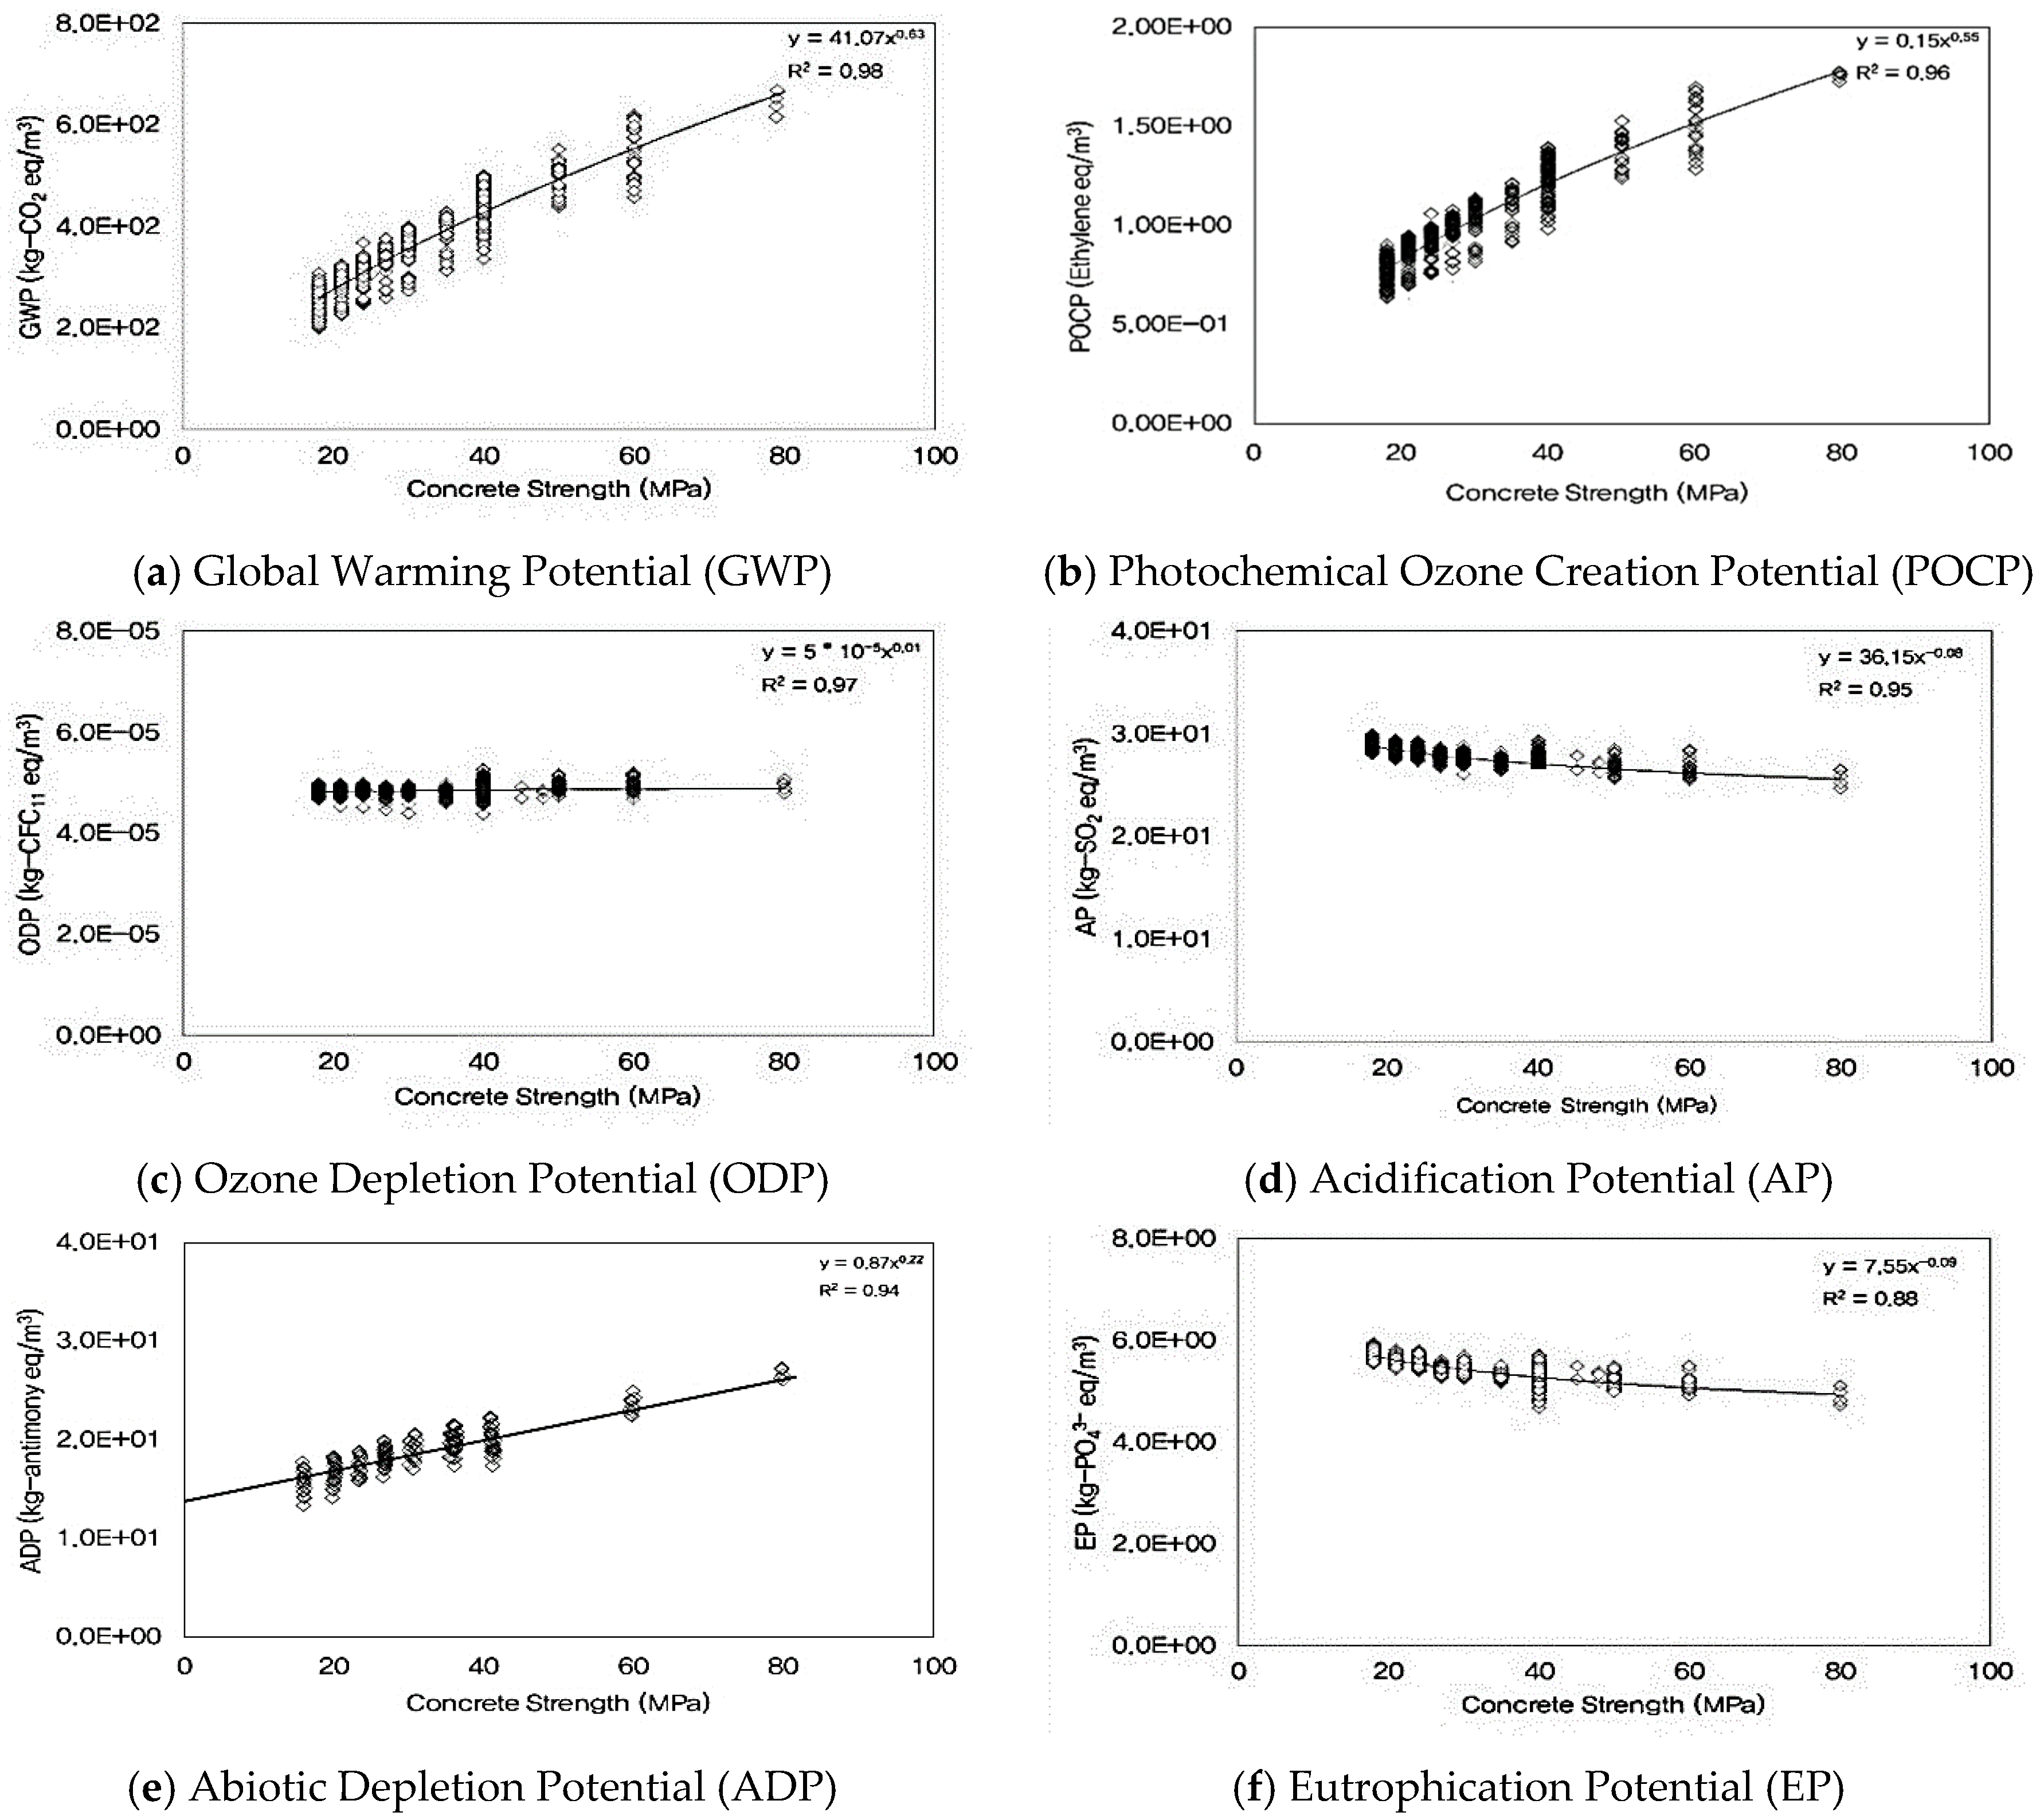
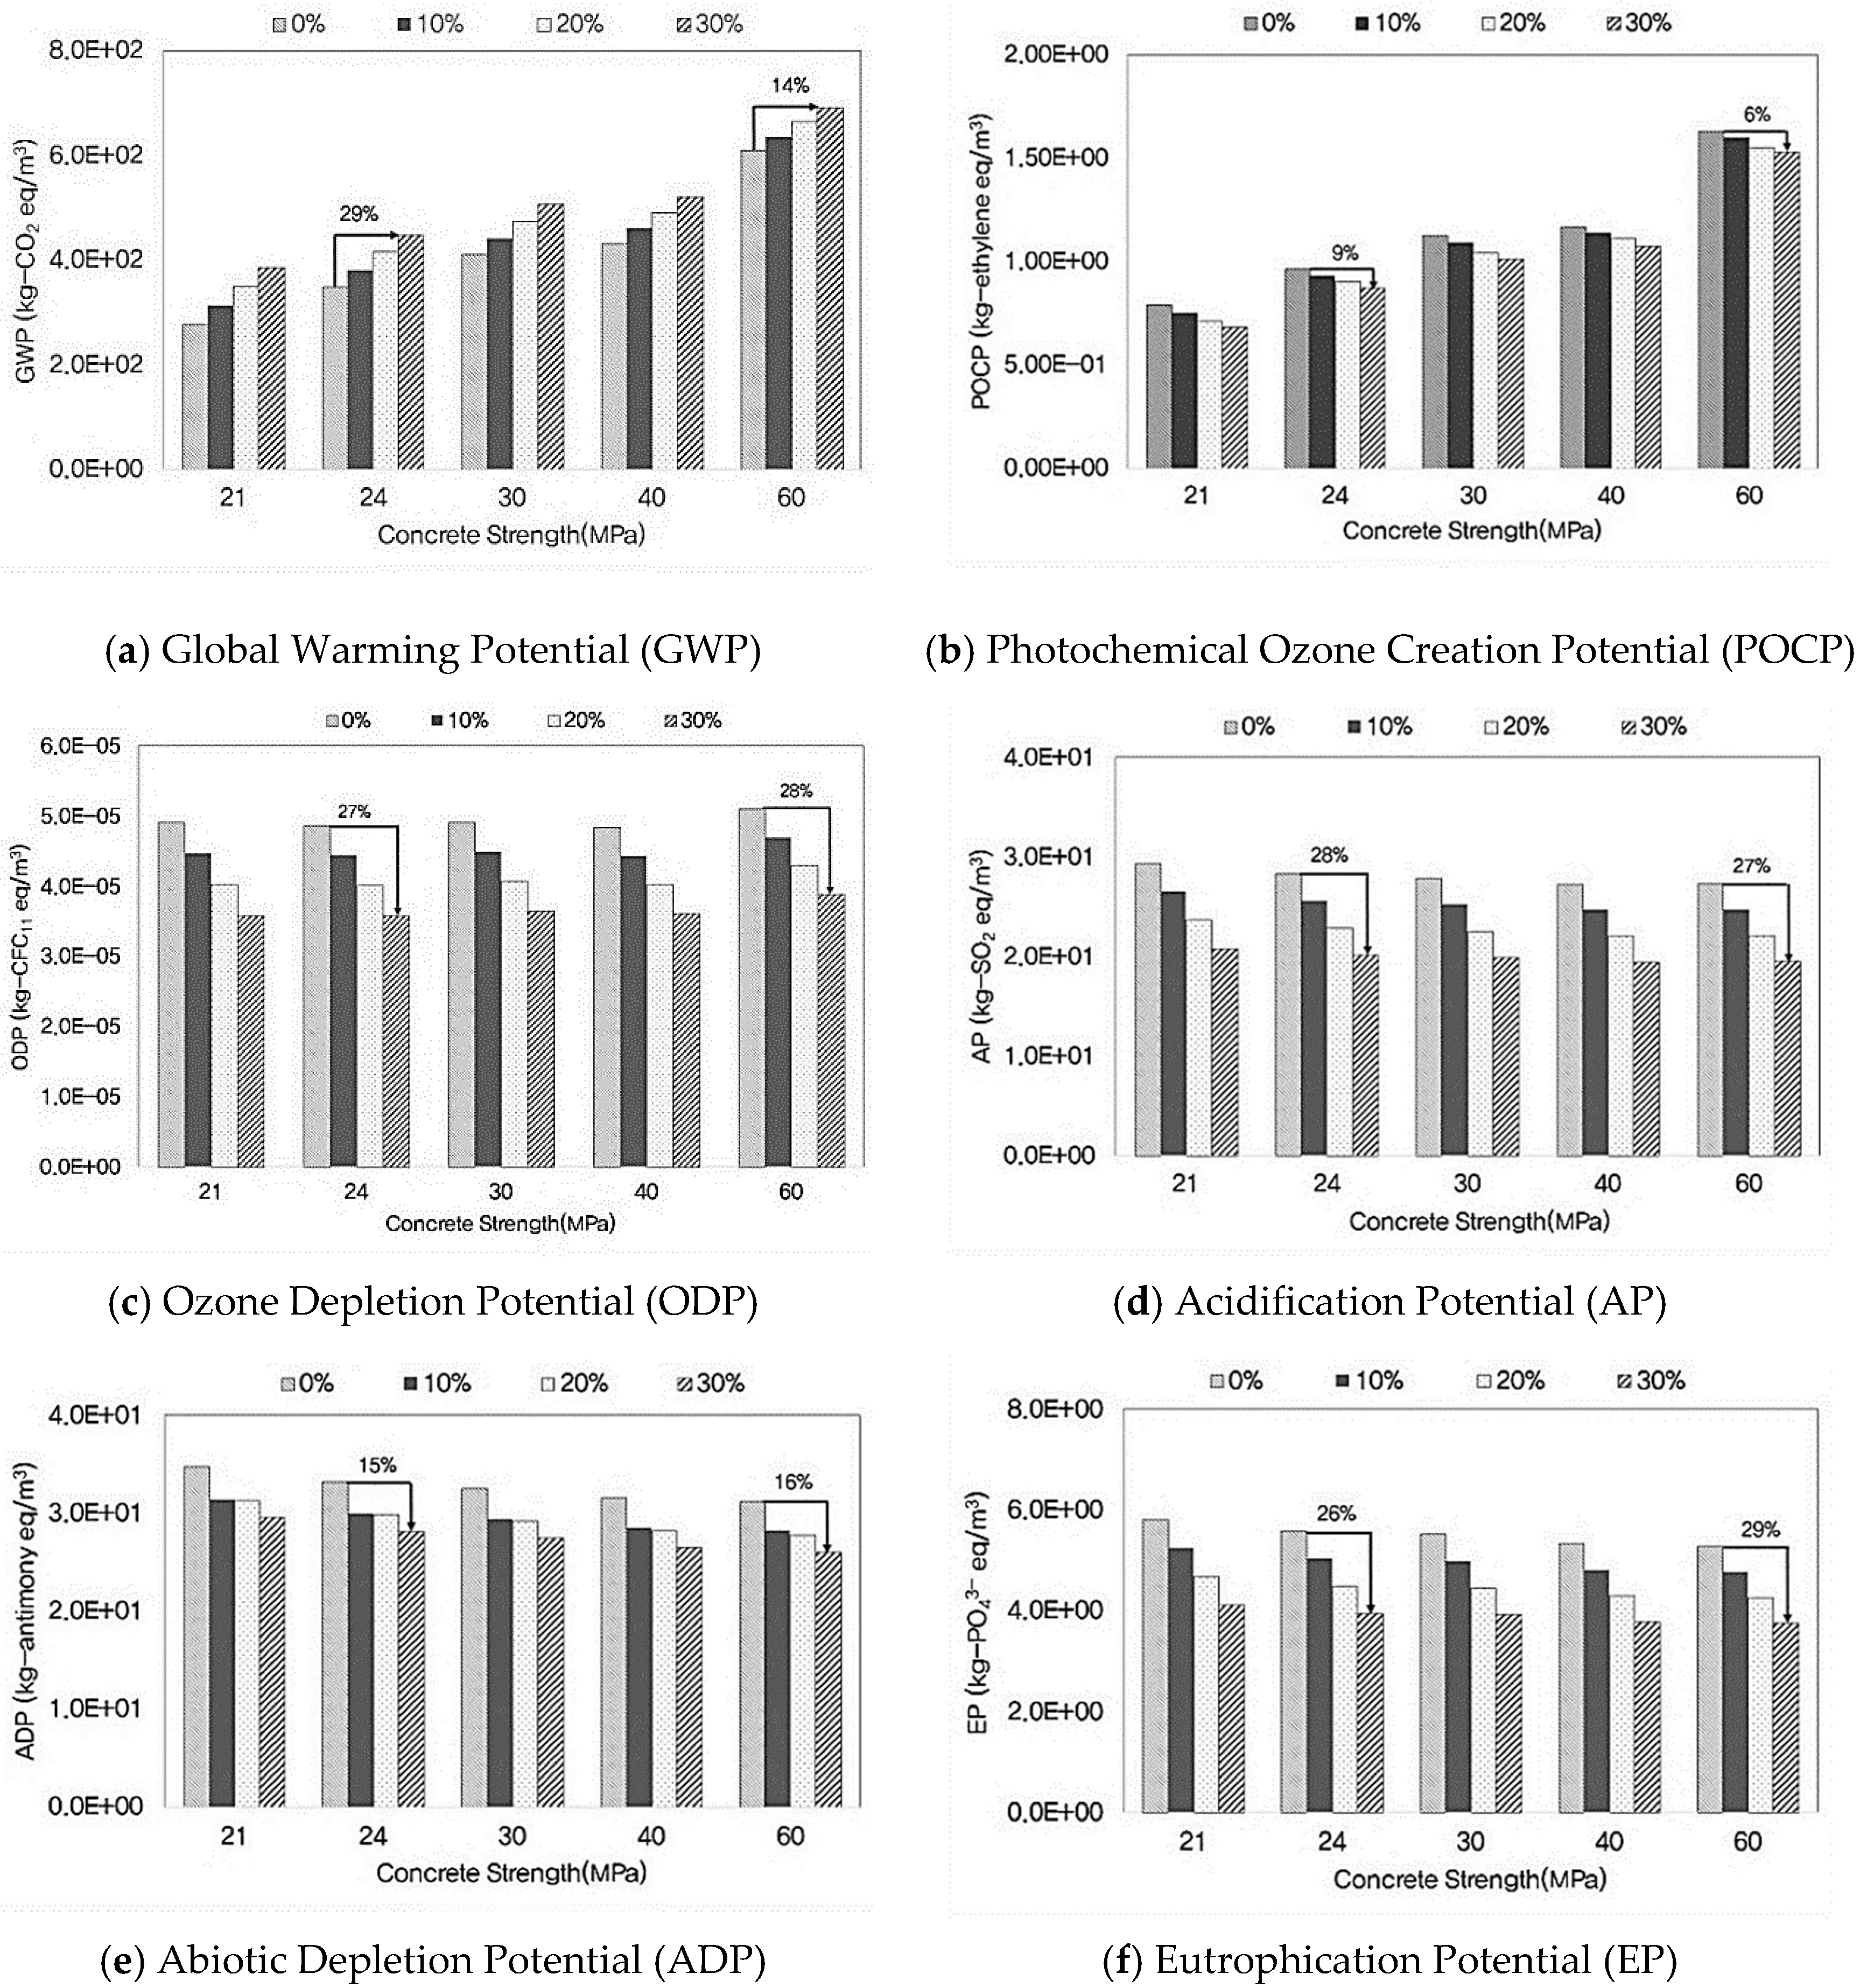
3.2. Environmental Impact According to Concrete Strength

The stronger the concrete was, the greater tendency it had to increase the global warming potential (GWP), photochemical ozone creation potential (POCP), and abiotic depletion potential (ADP). According to existing research results, it was found that the mixing amount of ordinary cement had the greatest impact on the increase of GWP, POCP, and ADP [24,25]. As shown in Figure 3a, when extracting limestone and iron ore, which are the main raw materials for ordinary cement, sulfur dioxide and sulfuric acid are emitted due to the use of dynamite, which is composed of sulfuric acid, nitric acid, and sulfur substances. Also, due to the energy used in extracted ore and clinker crushing plants, NOx and PO43− are emitted. During the production of ordinary cement, the pyro process is the stage where maximum energy is inputted and the most materials with an environmental impact are emitted [26]. This is because, in the process of increasing the rotary kiln temperature up to 1000~1450 °C in order to produce clinkers, the input of fuels such as Bunker-C Oil, bituminous coal, waste tires, and waste plastics emits environmental impact substances such as carbon dioxide (CO2) and ammonia (NH3). This is because most fuels used are mainly composed of carbon and hydrogen, and are made from crude oil that contains oxygen and sulfur [27]. Also, the amount of cement put in high strength concrete (40~80 MPa) was about 20% more than in normal strength concrete (below 18~40 MPa). Therefore, as natural resources such as limestone, iron ore, and gypsum, which are the major elements of cement, were used, abiotic depletion potential (ADP) increased. However, the higher the strength was, the acidification potential (AP) and eutrophication potential (EP) indices showed a tendency to become slightly decreased, as shown in Figure 4d,f. It was found that the coarse aggregate mixing amount of concrete had the greatest impact on AP and EP. Generally, as coarse aggregate mixing amount of concrete decreased to 850~880 kg/m3 when its strength was increased to 890~910 kg/m3 on an average, it was found that environmental impact substances produced in coarse aggregate production process also decreased. As shown in Figure 3b, lubricating oil and dynamite, which were used in logging and blasting processes to produce aggregate, were mainly made up of coal-type mineral and sulfuric acid. Hence, sulfur dioxide (SO2), sulfuric acid (H2SO4), and nitrate (NO3), which have an impact on acidification and eutrophication, are emitted. Also, when extracting and crushing the blasted rocks, the use of light oil emits ammonia (NH3), ammonium (NH4), phosphate (PO43−), and nitrogen oxides (NOx).

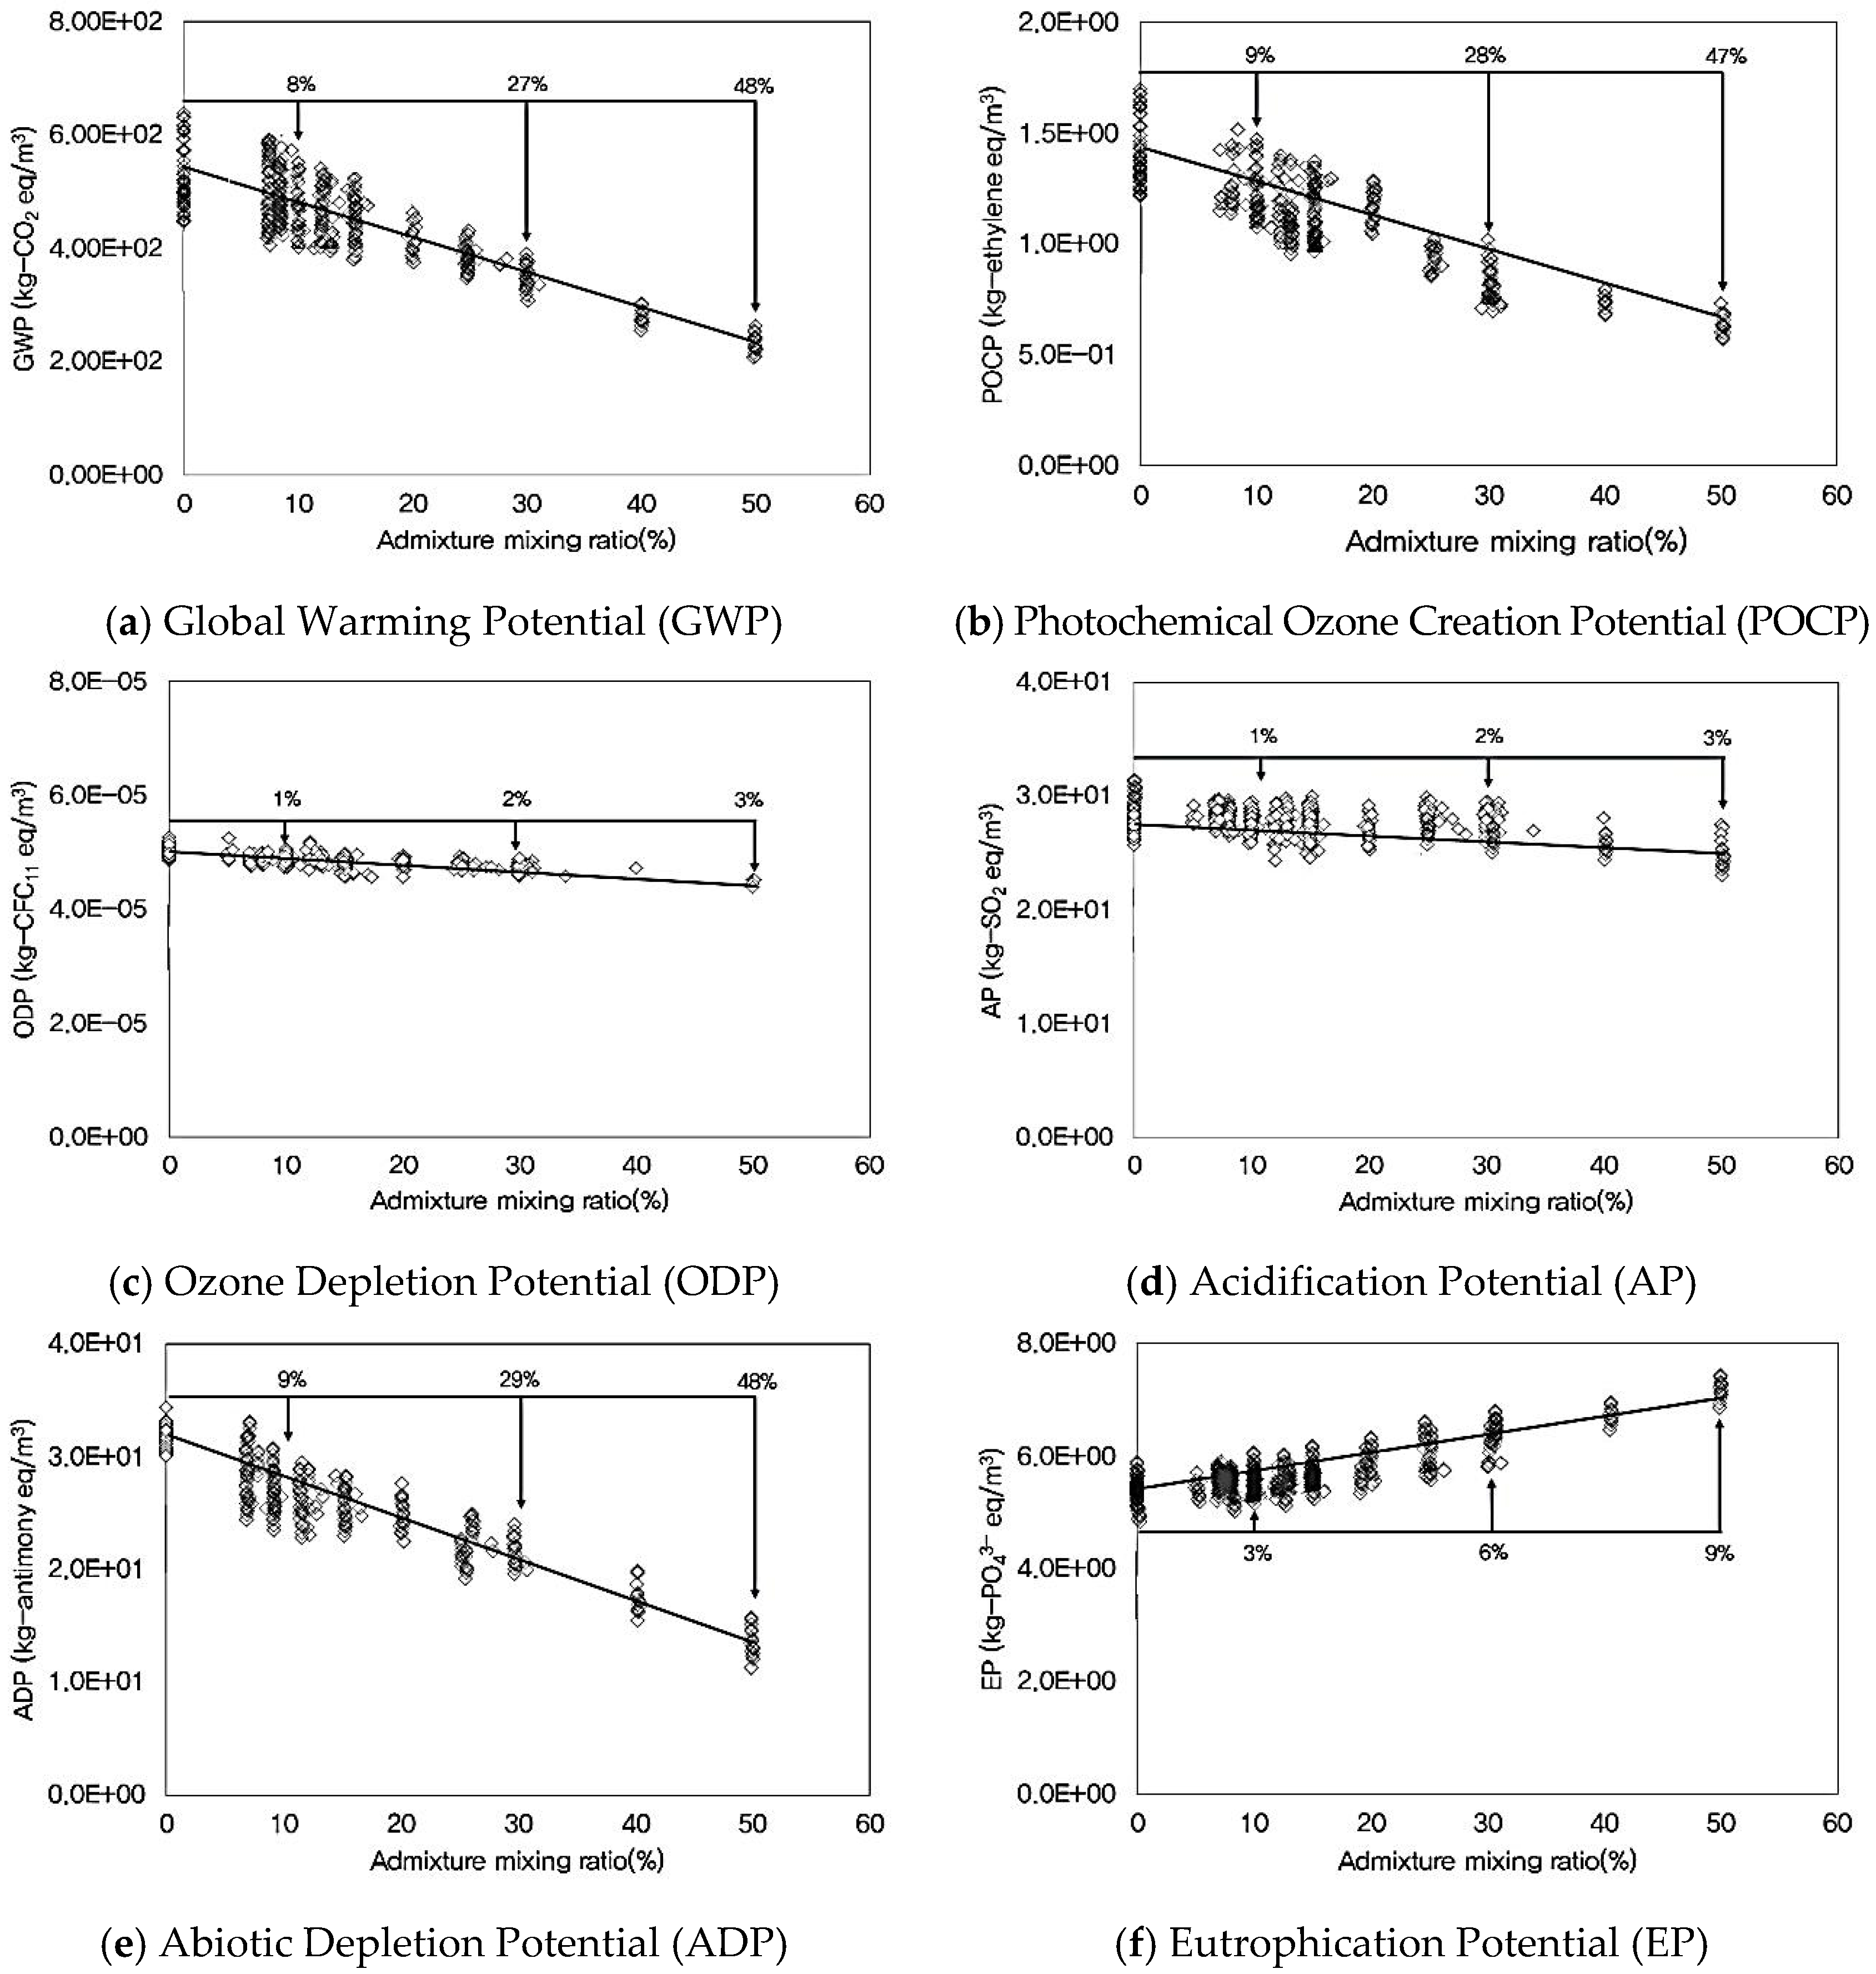
3.3. Environmental Impact According to Admixture

The higher the admixture mixing ratio of concrete was, the lower the global warming potential (GWP), acidification potential (AP), ozone depletion potential (ODP), abiotic depletion potential (ADP), and photochemical ozone creation potential (POCP) became. But the eutrophication potential (EP) index showed a tendency to increase slightly [28,29].
As shown in Figure 5a,b,e, as the admixture mixing ratio increased to 10%, 30%, and 50%, compared to OPC (mixing ratio 0%), GWP, POCP and ADP were found to be decreased to as much as about 10% to 28%. This was because, when producing GGBS and FA (Fly ash), the effect of by-products of other industrial products, such as CO2, CH4, N2O, CO, S, soft coal, hard coal, and crude oil on global warming potential (GWP), the photochemical ozone creation potential (POCP), and abiotic depletion potential (ADP) were very small compared to the process of ordinary cement production. As shown in Figure 3c, GGBS is produced by crushing, mixing, and cooling blast-furnace slag, the by-product of iron ore, and natural gypsum together [30]. As shown in Figure 3d, FA is produced by saving, selecting, and scaling fly ash, the by-product. Manufacturing plants of GGBS and FA used electricity and light oil as their energy sources, and it was found that substances emitted due to the use of light oil and electricity were of 45 types including carbon dioxide (CO2), methane (CH4), sulfuric acid (S), ammonia (NH3), and nitrogen oxide (NOx).
As shown in Figure 5c,d, it was found that, compared to OPC, AP and ODP were reduced to about 1%~3% as the admixture mixing ratio increased. In the process of GGBS production, nitrogen oxide (NOx), sulfur dioxide (SO2), halon, and CFC, the major impact materials of AP and ODP, were emitted in lesser amounts compared to the production process of ordinary cement, but there was no considerable difference. As shown in Figure 5f, it was found that compared to OPC, EP increased up to about 3%~9% as the admixture mixing ratio increased. This was due to the fact that emissions of NH4, NH3, NO3, N2, and PO43−, the main materials that have an impact on EP in the production process of GGBS and FA, were greater than when ordinary cement was produced [31].

3.4. Environmental Impact According to Recycled Aggregate

As the recycled aggregate mixing ratio of concrete increased, acidification potential (AP), eutrophication potential (EP), ozone depletion potential (ODP), and abiotic depletion potential (ADP) decreased, but the global warming potential (GWP) and photochemical ozone creation potential (POCP) increased [32].
As shown in Figure 6a, when the recycled aggregate mixing ratio was increased, GWP was found to have increased to up to about 14%~29% compared to concrete in which only natural aggregate was mixed. This was because, in the production process of recycled aggregate, major impact materials in terms of global warming potential (GWP) such as CO2, CH4, and N2O, were emitted more than in the case of natural aggregate production process. As shown in Figure 3e, recycled aggregate is produced by crushing, separating, and selecting waste concrete from the demolition of building structures. The amount of light oil and electricity used in the complicated process of making 1 ton of recycled aggregate thus becomes greater than the amount of energy used to produce 1 ton of natural aggregate. As shown in Figure 6c–f, when the mixing ratio of recycled aggregate was increased to 10%, 20%, and 30%, compared to the concrete in which only natural aggregate was mixed, AP, EP, ODP, and ADP were reduced to as much as about 9%~29%. Analysis revealed that it was because, in the process of producing recycled aggregate, NOx, NH3, SO2, NH4, halon, and CFC, the major impact materials of AP, EP, ODP, and ADP, were emitted less compared to the production process of natural aggregate. In particular, as natural resources were not used in recycling waste concrete which was construction waste, it was found that soft coal, hard coal, and crude oil, the major impact materials of abiotic depletion potential (ADP), were significantly reduced. As shown in Figure 6b, as the recycled aggregate mixing ratio was increased, compared to OPC, POCP was found to be reduced to about 2%~9%. CH4, CO, S, and C4H10, the major impact materials of photochemical ozone creation potential (POCP) in recycled aggregate production process, were emitted less than in the case of natural aggregate production process, but there was not much difference.

4. Conclusions

(1) By using the concrete life cycle assessment (LCA) technique suitable for the Korean situation, the effects of increase in strength, admixture material mixing, recycled aggregate mixing, and the amount of binder on environmental impact (global warming, acidification, eutrophication, ozone depletion, photochemical ozone creation, and abiotic depletion) were evaluated in a quantitative manner.
(2) It was found that the higher the strength of the concrete, the higher were the indices of global warming potential (GWP), photochemical ozone creation potential (POCP), and abiotic depletion potential (ADP). However, the acidification potential (AP), and eutrophication potential (EP) indices showed a tendency to decrease slightly.
(3) As admixture mixing ratio of concrete increased, the global warming potential (GWP), acidification potential (AP), ozone depletion potential (ODP), abiotic depletion potential (ADP), and photochemical ozone creation potential (POCP) decreased, but the eutrophication potential (EP) index showed a tendency to increase slightly.
(4) As the recycled aggregate mixing ratio of concrete increased, the acidification potential (AP), eutrophication potential (EP), ozone depletion potential (ODP), and abiotic depletion potential (ADP) decreased, but the global warming potential (GWP), and photochemical ozone creation potential (POCP) increased.
(5) GWP and POCP per unit compressive strength (1 MPa) of high-strength concrete (60 MPa) were found to be about 13% lower than that of normal strength (24 MPa). Also, in the case of AP, EP, ODP, and ADP per unit compressive strength (1 MPa), high-strength concrete (60 MPa) was found to be about 10%~25% lower than that of normal strength (24 MPa).
(6) Among the six environmental impact categories, it was found that ordinary cement had the greatest impact on global warming potential (GWP), photochemical ozone creation potential (POCP), and abiotic depletion potential (ADP), and aggregate had the most effect on acidification potential (AP), eutrophication potential (EP), and ozone depletion potential (ODP).

Acknowledgments

This research was supported by Basic Science Research Program through the National Research Foundation of Korea (NRF) funded by the Ministry of Science, ICT & Future Planning (No.2015R1A5A1037548) and the National Research Foundation of Korea (NRF) grant funded by the Korea government (MSIP) (No.20110028794).

Author Contributions

All authors contributed substantially to all aspects of this article.

Conflicts of Interest

The authors declare no conflict of interest.

References

  1. Dayoung, O.; Takafumi, N.; Ryoma, K.; Wonjun, P. CO2 emission reduction by reuse of building material waste in the Japanese cement industry. Renew. Sustain. Energy Rev. 2014, 38, 796–810. [Google Scholar]
  2. Federica, C.; Idiano, D.; Massimo, G. Sustainable management of waste-to-energy facilities. Renew. Sustain. Energy Rev. 2014, 33, 719–728. [Google Scholar]
  3. Global BRE. Methodology for Environmental Profiles of Construction Products-Product Category Rules for Type 3 Environmental Product Declaration of Construction Product; BRE Press: Watford, UK, 2011. [Google Scholar]
  4. International EPD system. Product category rules-Concrete. 2013. Available online: http://www.environdec.com/PCR/ (accessed on 13 April 2016).
  5. ISO/DIS 13315-2. In Environmental Management for Concrete and Concrete Structures)-Part 2: System Boundary and Inventory Data; ISO: Geneva, Switzerland, 2013.
  6. Ministry of government legislation. Law of Low-Carbon on Green growth. 2013. Available online: http://www.moleg.go.kr/english/korLawEng?pstSeq=54792 (accessed on 13 April 2016). [Google Scholar]
  7. Sakai, K.; Kawai, K. Recommendation of Environmental Performance Verification for Concrete Structures, JSCE Guidelines for Concrete No. 7. Available online: http://www.jsce.or.jp/committee/concrete/e/newsletter/newsletter06/newsletter06.asp (accessed on 13 April 2016).
  8. Van den Heede, P.; De Belie, N. Environmental impact and life cycle assessment (LCA) of traditional and “green” concretes: Literature review and theoretical calculations. Cem. Concr. Compos. 2012, 34, 431–442. [Google Scholar] [CrossRef]
  9. Organización Internacional de Normalización. ISO 14025: Environmental Labels and Declarations-Principles and Procedures; ISO: Geneva, Switzerland, 2006. [Google Scholar]
  10. Organización Internacional de Normalización. ISO 14044: Life Cycle Assessment-Requirements and Guidelines; ISO: Geneva, Switzerland, 2006. [Google Scholar]
  11. Youngche, H.; Sangwon, S.; Sangwon, H.; Keonmo, L. Determination of normalization values for korean eco-indicator. Korean Soc. Life Cycle Assess. 2000, 2, 69–78. [Google Scholar]
  12. Korea Concrete Institute. Concrete and Environment; Kimoondang Publishing Company: Seoul, Korea, 2011; pp. 16–30. [Google Scholar]
  13. MOLIT. National Database for Environmental Information of Building Products; Ministry of Land, Transport and Maritime Affairs of the Korean Government: Sejong-si, Korea, 2008.
  14. National Life Cycle Index Database Information Network. Available online: http://www.edp.or.kr (accessed on 11 August 2015).
  15. The Ecoinvent Database. Available online: http://www.ecoinvent.org/database (accessed on 11 August 2015).
  16. Eco-Labeling. Available online: http://www.edp.or.kr/edp/edp_intro.asp (accessed on 11 August 2015).
  17. IPCC guidelines for national greenhouse gas inventories. 2006. Available online: http://www.ipcc-nggip.iges.or.jp/public/2006gl/ (accessed on 13 April 2016).
  18. Guinee, J.B. Development of a Methodology for the Environmental Life Cycle Assessment of Products: With a Case Study on Margarines. Ph.D. Thesis, Leiden University, Leiden, The Netherlands, 1995. [Google Scholar]
  19. Heijungs, R.; Guinée, J.B.; Huppes, G.; Lamkreijer, R.M.; Udo de Haes, H.A.; Wegener Sleeswijk, A.; Ansems, A.M.M.; Eggels, P.G.; van Duin, R.; de Goede, H.P. Environmental Life Cycle Assessment of Products. Guide (Part1) and Background (Part 2); CML Leiden University: Leiden, The Netherlands, 1992. [Google Scholar]
  20. World Metrological Organization (WMO). Scientific Assessment of Ozone Depletion: Global Ozone Research and Monitoring Project; WHO: Geneva, Switzerland, 1991; p. 25. [Google Scholar]
  21. Derwent, R.G.; Jenkin, M.E.; Saunders, S.M.; Piling, M.J. Photochemical ozone creation potentials for organic compounds in Northwest Europe calculated with a master chemical mechanism. Atmos. Environ. 1998, 32, 2429–2441. [Google Scholar] [CrossRef]
  22. Jenkin, M.; Hayman, G. Photochemical Ozone Creation Potentials for oxygenated volatile organic compounds: Sensitivity to variation is in kinetic and mechanistic parameters. Atmos. Environ. 1999, 33, 1275–1293. [Google Scholar] [CrossRef]
  23. Ministry of Government Legislation. Details of Laws and enforcement ordinance and regulations on recycling promotion of construction wastes. 2010. Available online: https://www.google.com/url?sa=t&rct=j&q=&esrc=s&source=web&cd=1&ved=0ahUKEwiB1u7mwJDMAhULjiwKHRZTDXgQFggdMAA&url=http%3a%2f%2fwww.meti.go.jp%2fenglish%2finformation%2fdownloadfiles%2fcRecycle3R20403e.pdf&usg=AFQjCNE3tzbP17a8V2s7OVD1biXT4gN6KQ&sig2=8AccAo4Gl6buk49UI46BKw (accessed on 11 August 2015). [Google Scholar]
  24. Taehyoung, K.; Sungho, T.; Seongjun, R. Assessment of the CO2 emission and cost reduction performance of a low-carbon-emission concrete mix design using an optimal mix design system. Renew. Sustain. Energy Rev. 2013, 25, 729–741. [Google Scholar]
  25. Sungho, T.; Sungwoo, S.; Ganghee, L. The Environmental Load Reduction Effect of the Reinforced Concrete Structure Using High-Strength Concrete. Korea Inst. Ecol. Archit. Environ. 2008, 8, 61–66. [Google Scholar]
  26. Junghoon, P.; Sungho, T.; Taehyoung, K. Life Cycle CO2 Assessment of Concrete by compressive strength on Construction site in Korea. Renew. Sustain. Energy Rev. 2012, 16, 2940–2946. [Google Scholar]
  27. Gazquez, M.J.; Bolivar, J.P.; Vaca, F.; Garcia-Tenorio, R.; Caparros, A. Evaluation of the use of TiO2 industry red gypsum waste in cement production. Cem. Concr. Compos. 2013, 37, 76–81. [Google Scholar] [CrossRef]
  28. Owaid, H.M.; Hamid, R.B.; Taha, M.R. A review of sustainable supplementary cementitious materials as an alternative to all-Portland cement mortar and concrete. Aust. J. Basic Appl. 2012, 6, 2887–3303. [Google Scholar]
  29. Taehyoung, K.; Sungho, T.; Seongjun, R. Life Cycle Assessment for Carbon Emission Impact Analysis of Concrete Mixing Ground Granulated Blast-furnace Slag (GGBS). Archit. Inst. Korea 2013, 29, 75–82. [Google Scholar]
  30. Yang, K.H.; Seo, E.A.; Jung, Y.B.; Tae, S.H. Effect of Ground Granulated Blast-Furnace Slag on Life-Cycle Environmental Impact of Concrete. Korea Concr. Inst. 2014, 26, 13–21. [Google Scholar] [CrossRef]
  31. Korea Ground Granulated Furnace Slag Association. Technical Report. 2015. Available online: http://www.asa-inc.org.au/news-and-events/connections (accessed on 11 August 2015).
  32. Jongsuk, J.; Jaesung, L.; Yangjin, A.; Kyunghee, L.; Kisun, B.; Myunghun, J. An Analysis of Emission of Carbon Dioxide from Recycling of Waste Concrete. Archit. Inst. Korea 2008, 24, 109–116. [Google Scholar]
Figure 1. Process of environmental impact assessment.
Sustainability 08 00389 g001
Figure 2. Distribution of main parameters in the database.
Sustainability 08 00389 g002aSustainability 08 00389 g002b
Figure 3. Production process of raw material and oil.
Sustainability 08 00389 g003
Figure 4. Environmental impact analysis by concrete strength.
Sustainability 08 00389 g004
Figure 5. Environmental impact analysis by admixture (GGBS + (fly ash) FA) mixing ratio.
Sustainability 08 00389 g005
Figure 6. Environmental impact analysis by recycled aggregate mixing ratio.
Sustainability 08 00389 g006
Table 1. Life Cycle Index (LCI) Database.
DivisionReferenceNation
Raw materialCementNational LCIKorea
Coarse aggregateNational LCIKorea
Fine aggregateNational LCIKorea
Blast furnace slagEcoinventSwiss
Fly ashEcoinventSwiss
WaterNational LCIKorea
Chemical admixtureEcoinventSwiss
EnergyElectricNational LCIKorea
DieselNational LCIKorea
TransportationTruckNational LCIKorea
Table 2. Characterization value of composition material for concrete.
Composition MaterialUnitEnvironmental Impact Categories
GWP (kg-CO2eq/unit)AP (kg-SO2eq/unit)EP (kg-PO43−eq/unit)POCP (kg-Ethyleneeq/unit)
Cementkg9.48 × 10−11.28 × 10−31.34 × 10−42.43 × 10⁻³
Fine aggregatekg1.49 × 10−31.10 × 10−21.92 × 10−31.07 × 10⁻⁴
Fly ashkg1.50 × 10−21.16 × 10−46.94 × 10−56.57 × 10⁻⁵
Waterkg1.14 × 10−11.94 × 10−46.57 × 10−54.86 × 10⁻⁷
Table 3. Classification value of composition material for concrete. The six environmental impact categories are as follow: Global Warming Potential (GWP); Abiotic Depletion Potential (ADP); Acidification Potential (AP); Eutrophication Potential (EP); Ozone Depletion Potential (ODP); and Photochemical Ozone Creation Potential (POCP).
Inventory ListEnvironmental Impact CategoriesComposition Material
GWPADPAPEPODPPOCPCementAggregate
Ammonia (NH3) 6.95 × 10⁻⁷
Carbon dioxide (CO2) 9.31 × 10−13.40 × 10−1
CFC-11 2.05 × 10−94.02 × 10−13
Methane (CH4) 1.71 × 10−25.57 × 10−4
Sulfur dioxide (SO2) 1.27 × 10−24.42 × 10−4
Phosphate (PO43−) 4.22 × 10⁻⁸

