1. Introduction
As a kind of strategic resources, water resources are not only an important condition of economic and social sustainable development, but also a precondition of improving ecological environment. Water utilization structure is one of the most important elements in water resources and effective water resources management.
Analysis of water utilization structure was prevalent in some scientific literatures. Liu
et al. [
1] qualitatively analyzed the change of water utilization structure of Beijing from 1980 to 2000. Jenerette [
2] asserted that the water utilization form depended on population, livestock, climate change, and ecological water supply condition etc. This author judged that there would be continuous water supply crisis in most cities, so attention must be paid to sustainable water resources management. Su
et al. [
3], Ma
et al. [
4] and Zheng
et al. [
5] discussed the water utilization structure of Guanzhong area using information entropy. Lv
et al. [
6] used grey correlation degree to analyze the driving forces of water utilization structure change in Zhengzhou. Chen [
7] used information entropy and grey correlation degree to analyze the change of water utilization structure and its impact factors respectively in Xiamen. Furthermore, the impact factors of water utilization structure were chosen by principal component analysis to satisfy the requirement of water resources management. On this basis, Yun
et al. [
8] built a compositional data linear regression model based on partial least-squares regression, and demonstrated the connection coherence between water utilization and industrial structure. Hereafter, Liu
et al. [
9] used a variable stability test, the co-integration and Granger causality test to study the relationship between water utilization structure and industrial sustainable development. Zhai
et al. [
10] not only considered industrial, agricultural and domestic water consumption, but also explored the influence of ecological water consumption on water utilization structure. Indeed, ecological water consumption is very important for sustainable ecological development. Paola
et al. [
11,
12] presented a multi-objective approach for the automatic partitioning of a water distribution network into District Metering Areas (DMAs). On this base, Paola
et al. [
13] presented a model for valve setting in water distribution networks (WDNs), with the aim of reducing the level of leakage. Focusing on an African case, Paola
et al. [
14] analyzed the problem of the sustainable design and development of urban storm-water systems in response to the climate change and anthropic modification. Finally, Nunez
et al. [
15] presented a system of two-stage processing for the detection of acoustic emissions and the localization of the sources, which is also instructive.
Water consumption and its impact factors were discussed in some literatures. In general, water consumption can be divided into four categories: industrial, agricultural, domestic and ecological. Marios [
16] supposed that the impact factors of water consumption included population growth, sustainable economic development, technical progress, land use pattern, urbanization progress etc. Through logarithmic mean Divisia index Method (LMDI), Liu
et al. [
17] analyzed the industrial water consumption of Anhui province by considering economic scale, industrial structure and water quota. On this basis, Zhang
et al. [
18] added water intensity and industrial water saving effect to those impact factors, and explained the change of industrial water in Anhui Province. Arbues
et al. [
19] calculated the weight of domestic water consumption. Cui
et al. [
20] proposed that the impact factors of domestic water consumption mainly included resident income and water price. Adding drinking water and family population, Xu [
21] built a regression model to research the impact factors of domestic water consumption in Beijing.
Above results were meaningful, but the impact factors of water utilization structure should be further perfected. The impact factors from different literatures were complementary. Based on these impact factors and the data we could get (mainly from
Tianjin Statistical Yearbook 2005–2014 [
22]), the impact factors were filtered. Besides, in
Tianjin Statistical Yearbook 2005–2014 [
22], some indexes did not appear in above literatures, but they had influence on the water consumption of Tianjin. These kinds of indexes also could be used as impact factors. This study took the water consumption of Tianjin from 2004 to 2013 as sample [
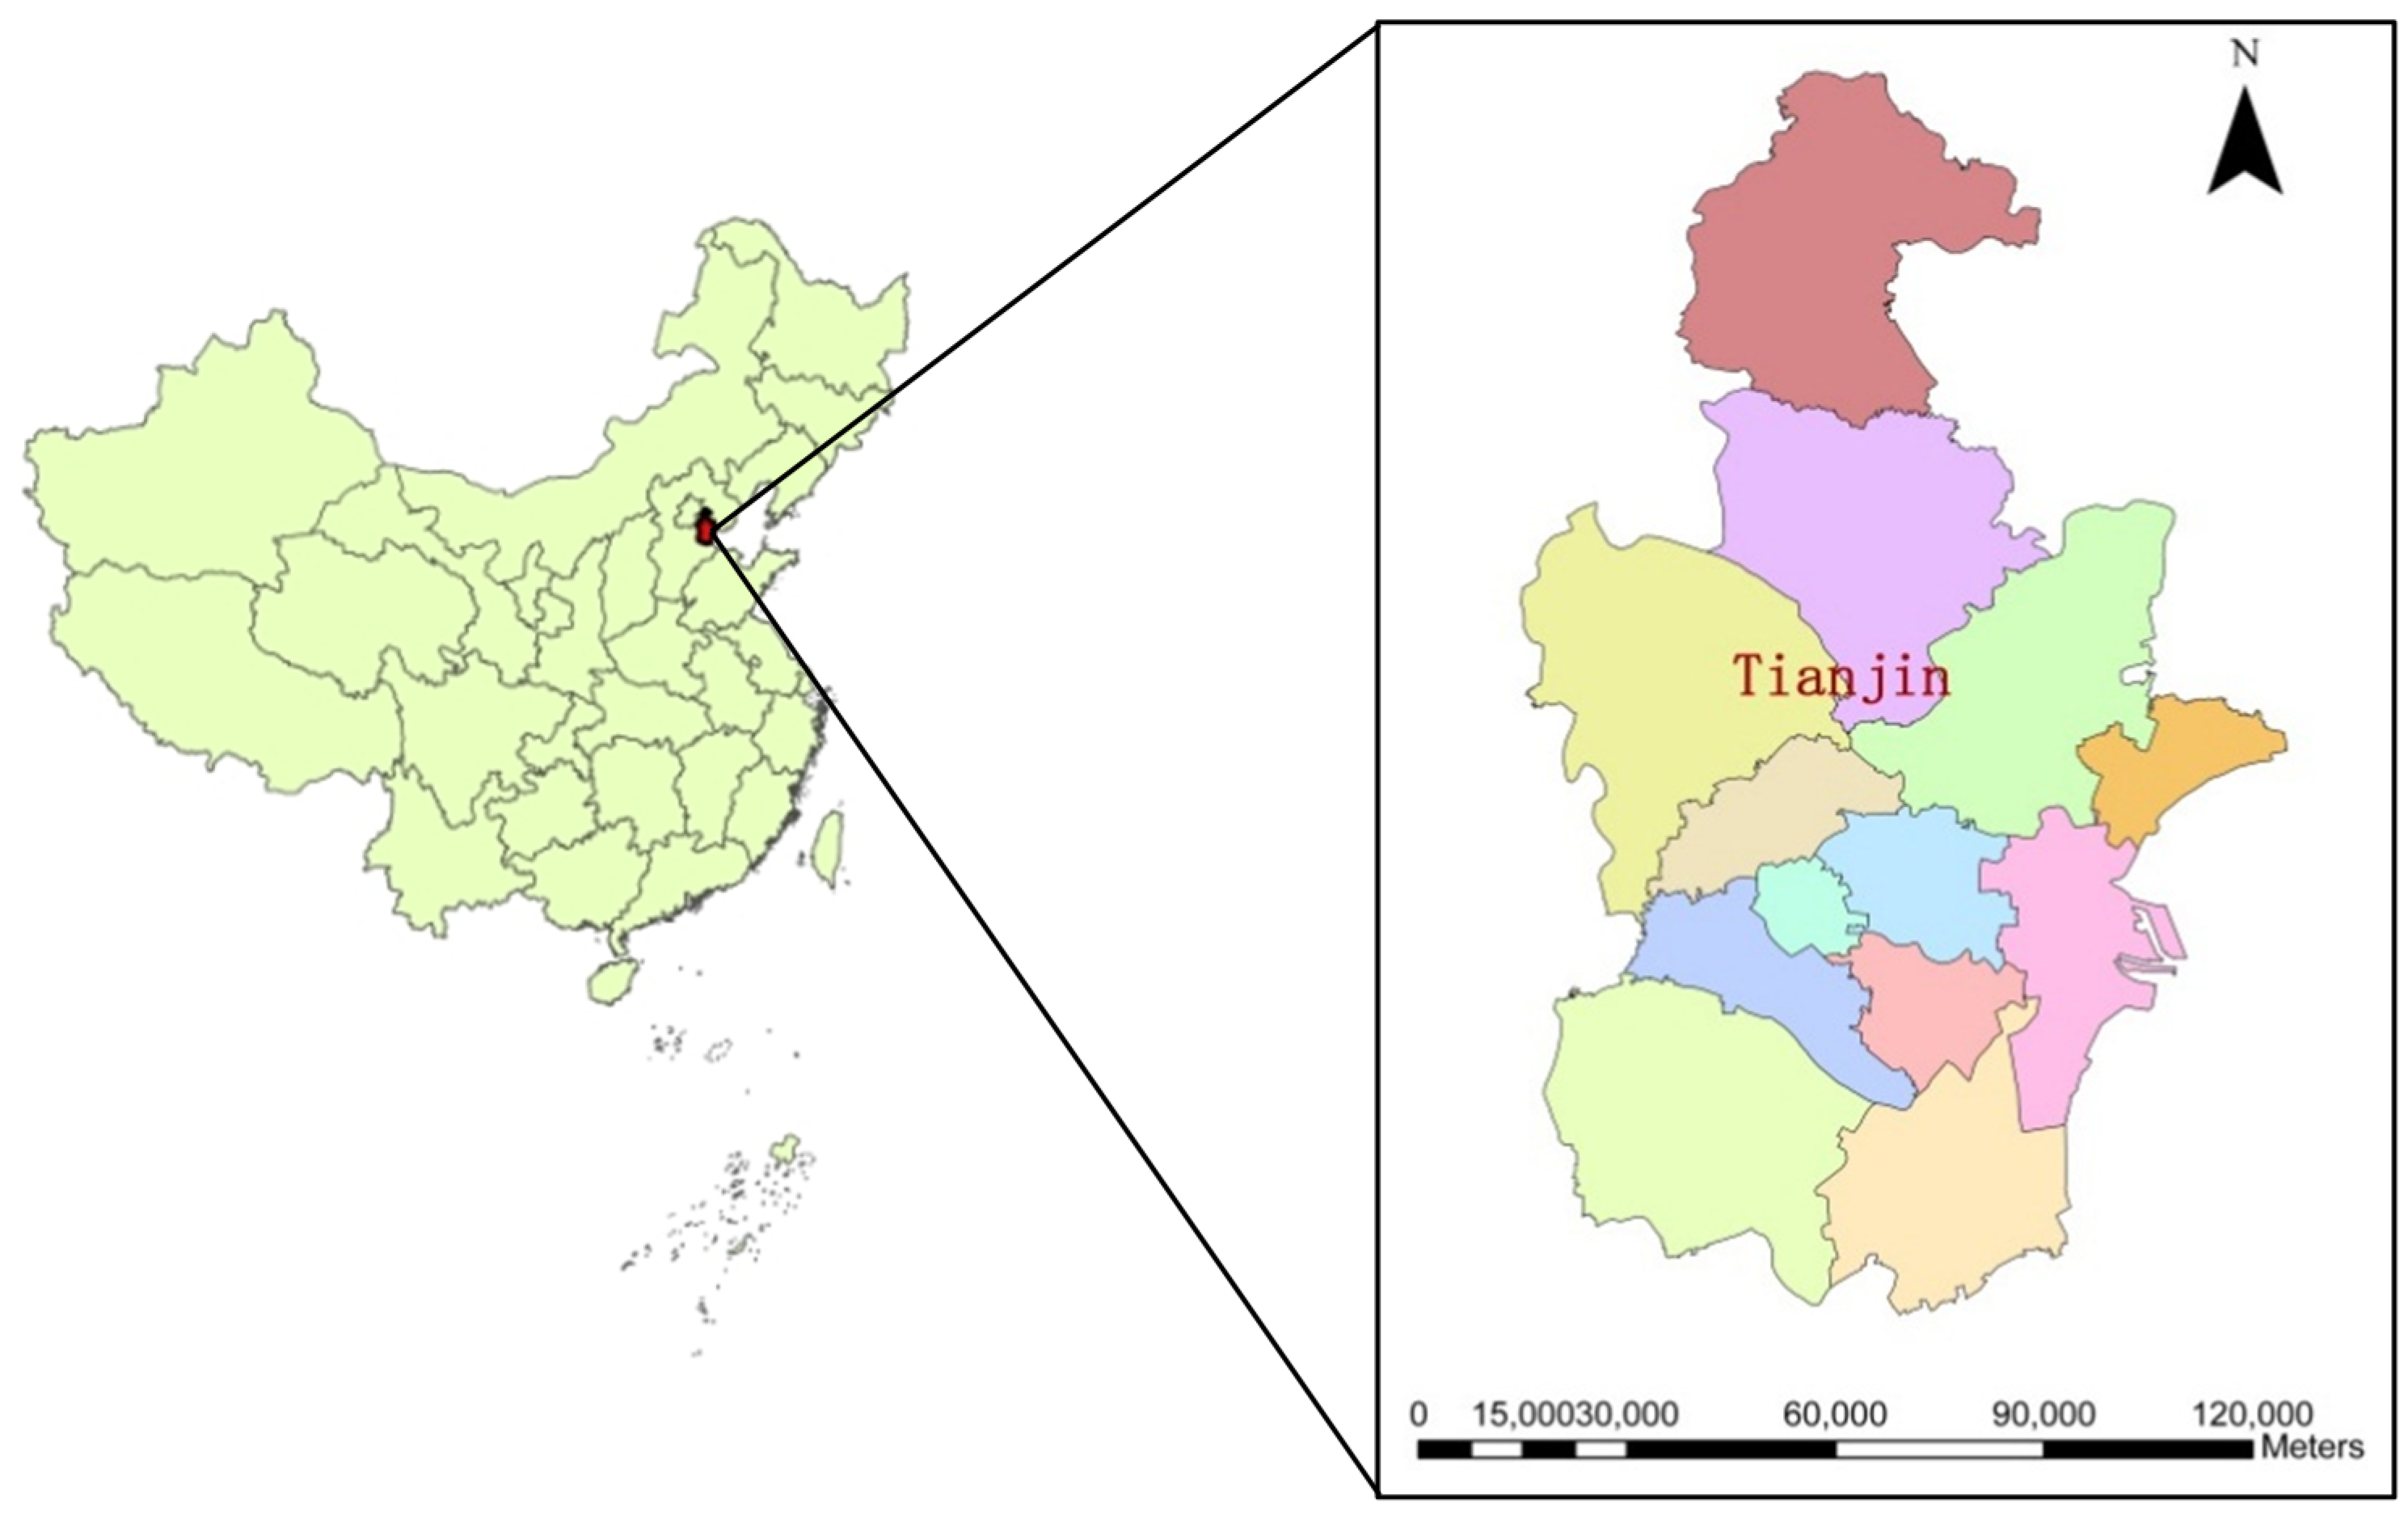
22]. Tianjin is located in the northeast of North China Plain and in the center of Bohai economic circle. As the largest port city of North China, Tianjin is an important communication hub, directly connecting Beijing to Northeast China, East China and the Pacific Ocean. In this study, the change of water utilization structure in Tianjin was analyzed, and its main impact factors were identified afterwards. These impact factors of water utilization structure are essential for us to conduct effective water resources management and sustainable development in Tianjin.
The study period was from 2004 to 2013. Due to the limitation of water quantity monitoring and resources management abilities, agricultural, industrial, domestic and ecological water consumption data of Tianjin before 2004 was unavailable.
4. The Water Consumption and Its Impact Factors
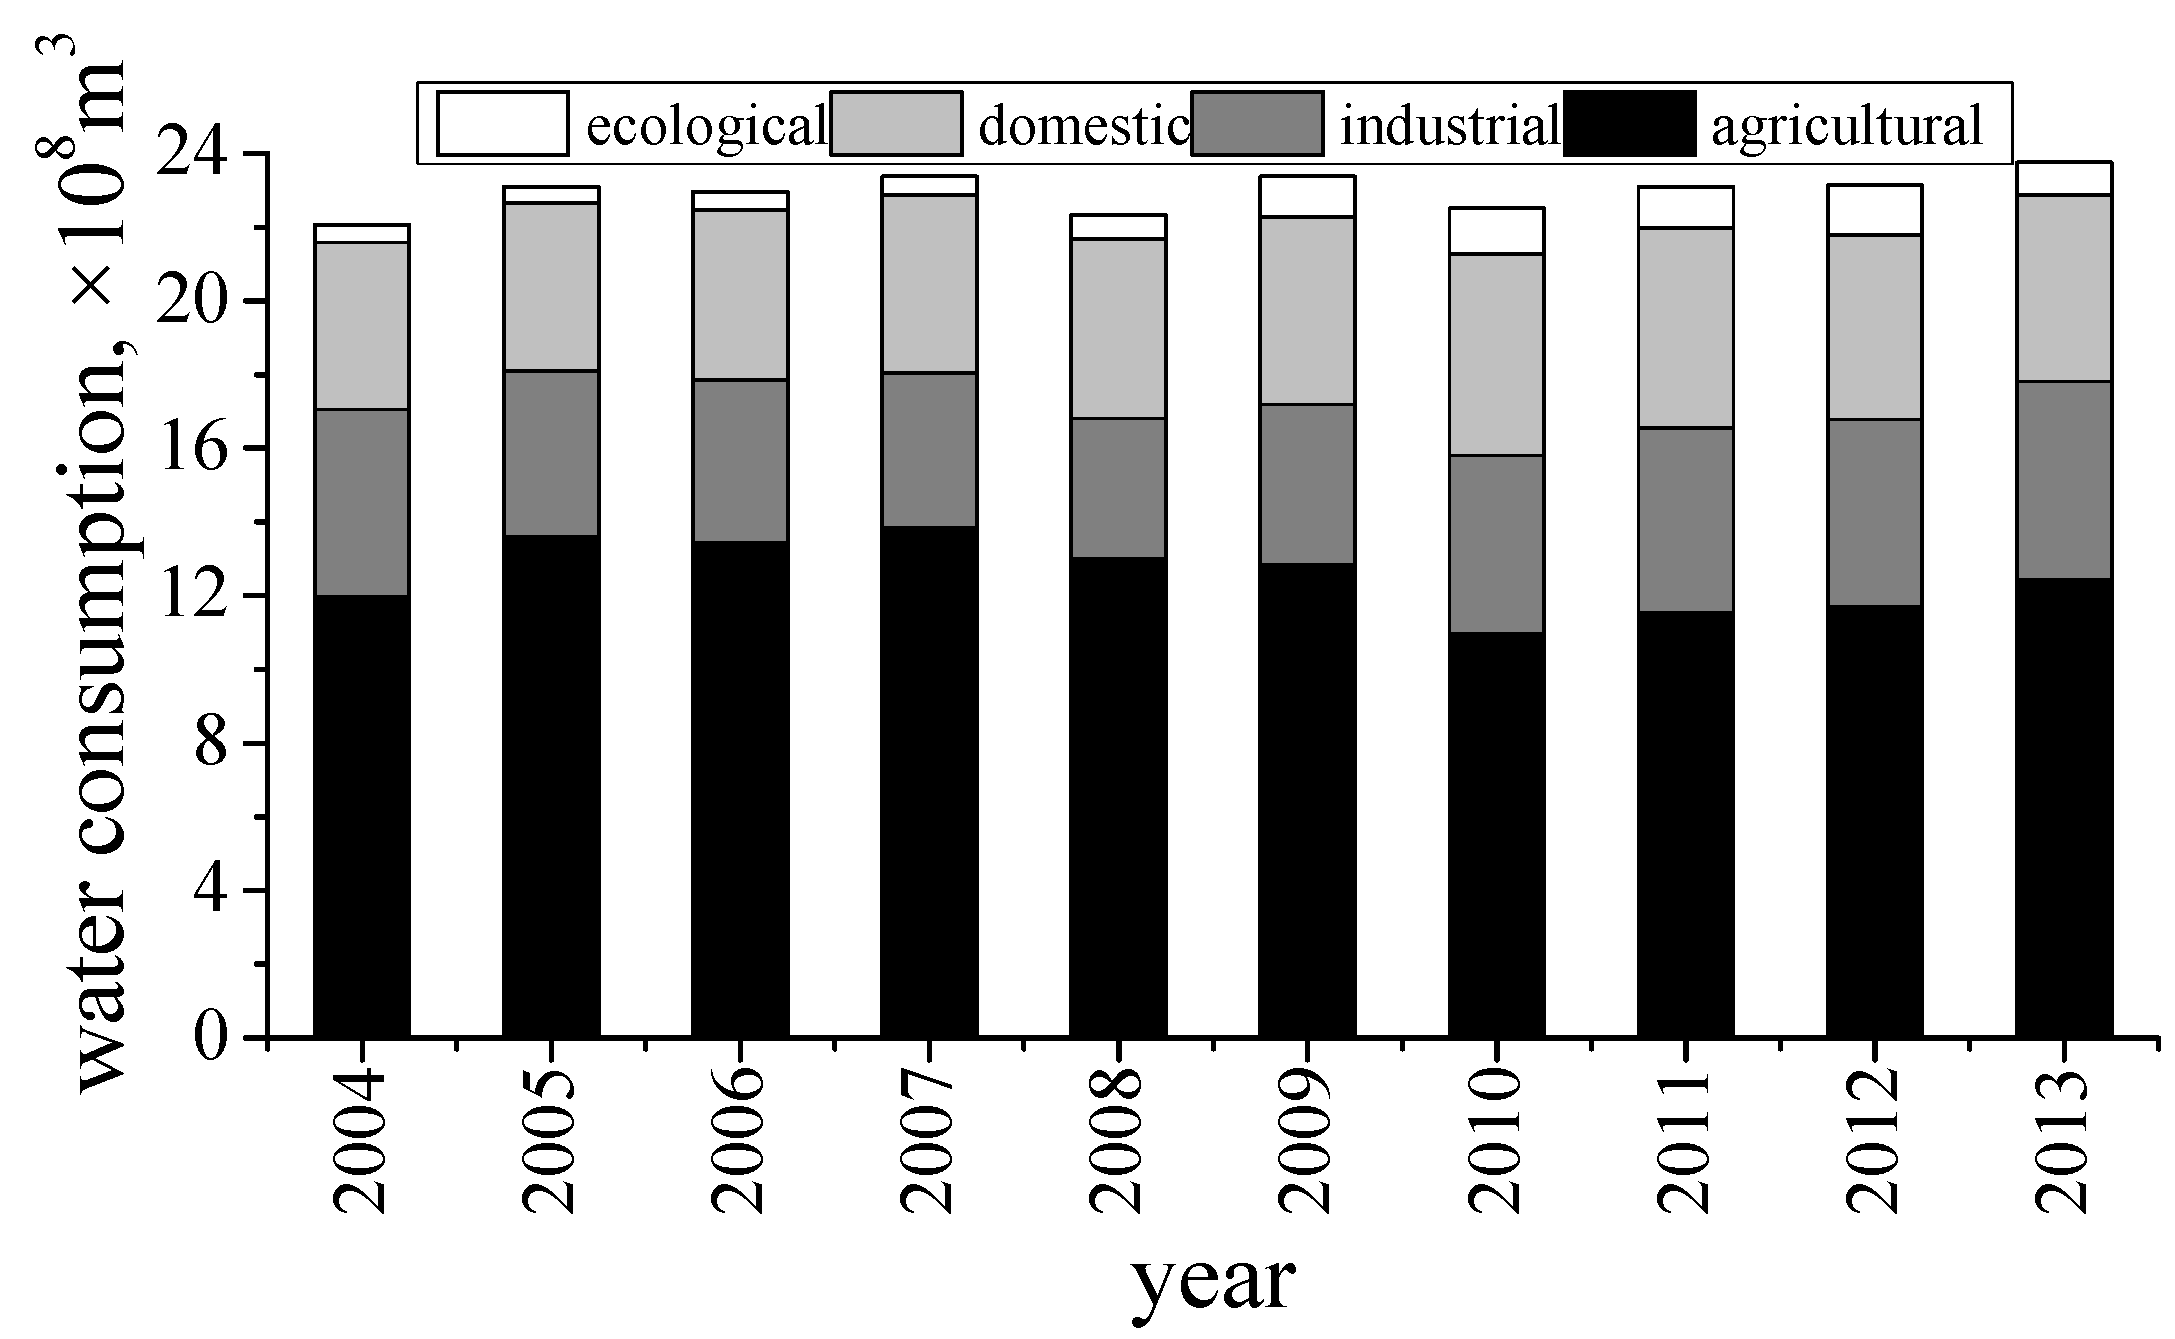
The total water consumption of Tianjin increased from 2.206 billion m
3 in 2004 to 2.337 billion m
3 in 2007. Its annual growth rate was 1.94% on average. The total water consumption of Tianjin in 2008 and 2009 fluctuated slightly. From 2010 to 2013, the annual growth rate was 1.85% on average (
Figure 2).
4.1. Agricultural Water Consumption
From 2004 to 2013, the agricultural water consumption of Tianjin accounted for 48%–59% of the total water consumption, and it was the largest water user in Tianjin. The change of agricultural water consumption could be divided into three stages. From 2004 to 2007, it increased from 1.198 billion m3 to 1.384 billion m3, and the annual growth rate was 4.93% on average; after 2007, it decreased to 1.097 billion m3, and the annual growth rate was 7.45% on average; hereafter, it increased slightly.
The agricultural water consumption changed because the decrease of cultivated area and effective irrigation area and the increase of efficient water saving irrigation area. Indeed, the cultivated area of Tianjin decreased from 0.42 million hm2 in 2004 to 0.39 million hm2 in 2013, and its annual change rate was −0.63% on average; the effective irrigation area decreased from 0.35 million hm2 in 2004 to 0.31 million hm2 in 2013, and its annual change rate was −1.5% on average; efficient water saving irrigation area increased from 0.19 million hm2 in 2004 to 0.29 million hm2 in 2013, and its annual growth rate was 5.16% on average. In addition, the agricultural electricity consumption increased from 4.84 billion kWh in 2004 to 6.92 billion kWh in 2013, and its annual growth rate was 4.05% on average; the output value of primary industry increased from 22.14 billion CNY in 2004 to 40.20 billion CNY in 2013, and its annual growth rate was 6.86% on average.
Fishery output value had weak correlation with agricultural water consumption. Other impact factors had moderate correlation with agricultural water consumption (
Table 2). It appeared that the adjustment of agricultural structure and the improvement of water saving irrigation technology influenced the agricultural water consumption. In these years, Tianjin City conducted the strategic layout of taking planting as a foundation and taking breeding industry as a sustainable development emphases. With the promotion of water saving irrigation technology, unreasonable irrigation methods were eliminated. On this basis, supposing that, the agricultural water of Tianjin developed in a sustainable direction.
4.2. Industrial Water Consumption
From 2004 to 2013, the industrial water consumption of Tianjin accounted for 17%–23% of total water consumption. Its change could be divided into two stages: from 2004 to 2008, it reduced from 0.507 billion m3 to 3.81 billion m3, and its annual change rate was 6.89% on average; from 2008 to 2013, it increased from 0.381 billion m3 to 0.537 billion m3, and its annual growth rate was 7.11% on average.
The change of industrial water consumption was significantly influenced by the policy and regulation. In order to achieve sustainable water resources management, Tianjin City proposed “regulations on water saving of Tianjin” in 2002, which was the first local regulation on water saving in China. From 2004 to 2013, the industrial output value of Tianjin increased from 168.59 billion CNY to 727.55 billion CNY, while the water consumption of 10,000 CNY industrial output value decreased from 30.07 m3 to 7.38 m3. The water saving technology was improved and the industrial structure was adjusted. Consequently, from 2004 to 2008, the industrial water consumption decreased. However, in 2009, the administrative division of the New Coastal Region of Tianjin was reformed. The rapid development of the New Coastal Region of Tianjin accelerated the industrial economic development of Tianjin. At this time, the industrial output value of Tianjin was 398.78 billion CNY, and the New Coastal Region of Tianjin accounted for only 9.2% of Tianjin; in 2013, the industrial output value of Tianjin was 727.55 billion CNY, and the New Coastal Region of Tianjin accounted for 70.6% of Tianjin. The supernormal development of the New Coastal Region of Tianjin was an important explanation for the increase of the industrial water consumption of Tianjin after 2008. As a large industrial city, controlling total water consumption while ensuring the economic development was a challenge for Tianjin.
All of the impact factors had moderate correlation with the industrial water consumption of Tianjin (
Table 3). Thus, the industrial economic quality had a significant influence on total water consumption in Tianjin. This finding suggested that improving industrial economic quality would promote the improvement of water resources management.
4.3. Domestic Water Consumption
From 2004 to 2013, the domestic water consumption of Tianjin accounted for 20%–25% of the total water consumption. The change of the domestic water consumption could be divided into two stages: In the first stage, the domestic water consumption increased steadily, while in the second stage, it reduced with fluctuation. Specifically, from 2004 to 2010, it increased from 0.453 billion m3 in 2004 to 0.548 billion m3 in 2010, and its annual growth rate was 3.22% on average; and from 2010 to 2013, it decreased from 0.548 billion m3 to 0.515 billion m3, and its annual change rate was 2.69% on average.
The basic explanation for the change of the domestic water consumption of Tianjin was population growth. The resident population increased from 10.24 million in 2004 to 14.72 million in 2013, and the annual growth rate was 4.12% on average. With the simultaneous improvement in living standard, per capita domestic water consumption increased from 123.6 m3 in 2005 to 142.34m3 in 2013.
All of the impact factors had moderate correlation with the domestic water consumption of Tianjin (
Table 4). With the adjustment of fertility policy and the improvement of income level, the domestic water consumption of Tianjin would be increased in the future. Green lifestyle could be very important in forming sustainable water resources management.
4.4. Ecological Water Consumption
Given the importance of ecological environment protection and sustainability, the ecological water consumption of Tianjin was also studied. It increased from 48 million m3 in 2004 to 136 million m3 in 2012, and its annual growth rate was 13.9% on average; in 2013, it reduced by 33.8%. Certain factors may explain this change in ecological water consumption. For example, the per capita green area of Tianjin increased from 13.87 m2 in 2004 to 15.76 m2 in 2013, and its growth rate was 13.6% on average; the garden green area increased from 14238.1 hm2 in 2004 to 23916 hm2 in 2013, and its annual growth rate was 5.93% on average; the park area increased from 2424 hm2 in 2004 to 7279 hm2 in 2013, and its annual growth rate was 13% on average.
Garden green area had a moderate correlation degree with the ecological water consumption. Park area had a weak correlation degree with the ecological water consumption (
Table 5). Ecological environment is essential for sustainable development.
6. Conclusions
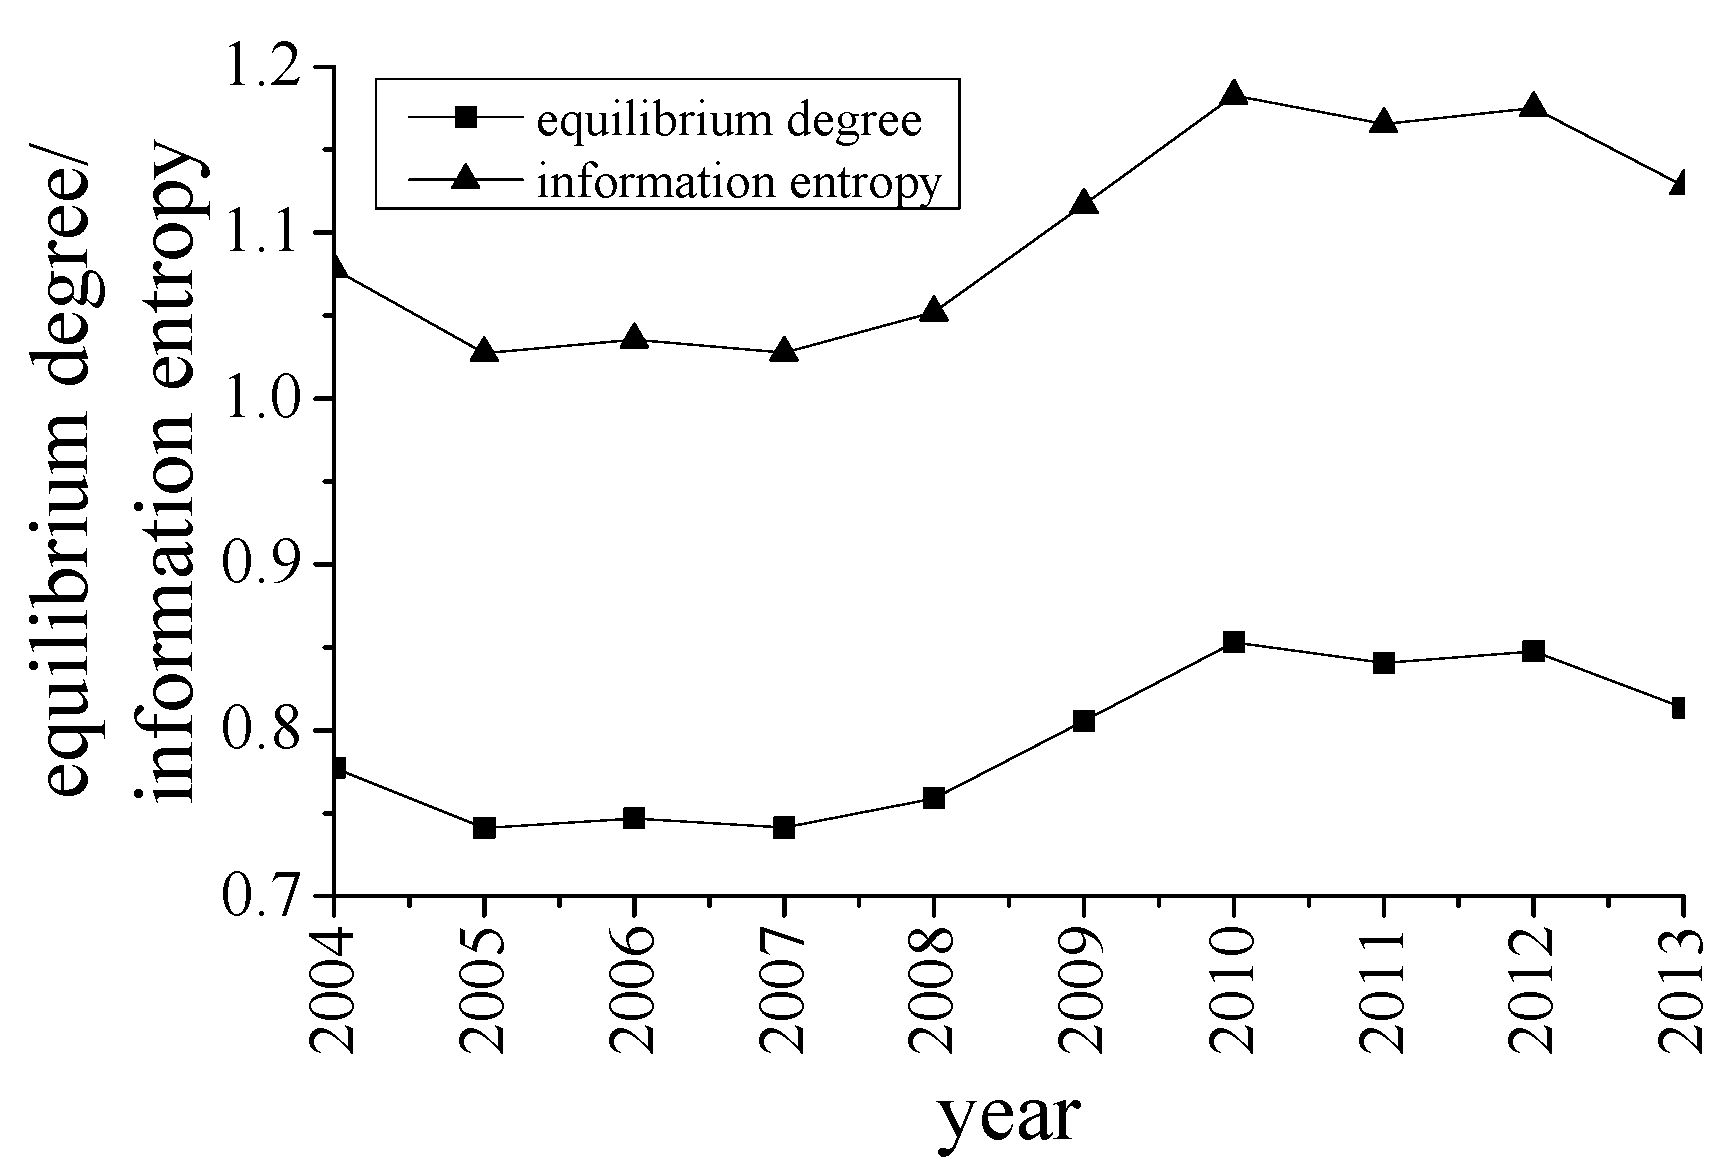
Tianjin has an important position in China and an undeniably good foundation of water quantity monitoring in China, making it an ideal study site. Through information entropy analysis and grey correlation analysis method, the changing process of water consumption was studied, thereafter the evolution law and the impact factors of the water utilization structure were discussed. Compared with previous studies, the impact factors of the water utilization structure in this study were more comprehensive. The results of this study were meaningful for adjusting water consumption and optimizing water utilization. The water utilization structure reflected the level of water resources management sustainable development to some extent.
From 2004 to 2010, the water utilization structure of Tianjin tended to be disordered and balanced. It meant that the dominance of a single water consumption type decreased and the equilibrium degree increased generally. In general, the water utilization structure of Tianjin developed in a sustainable direction. It also demonstrated that the water resources management tended to be more sustainable. From 2011 to 2013, the relatively high information entropy implied that the water utilization structure of Tianjin was relatively mature, and influence of single factors reduced continuously.
From 2004 to 2013, rural electricity consumption, cultivated area, garden green area, agricultural output value, water consumption of 10,000 CNY industrial output value, light industry output value, per capita green area, per capita green area, water consumption of 10,000 CNY industrial added value, resident population, heavy industry value and animal husbandry output value had strong correlation with the water utilization structure of Tianjin. These results could be used to adjust water consumption and further optimize water utilization structure.
In the future, if the water consumption data is plentiful and the related technologies are mature, the water utilization structure could be predicted accurately, and its impact factors will be identified effectively.


