Article

Experimentally Investigating the Effect of Temperature Differences in the Particle Deposition Process on Solar Photovoltaic (PV) Modules

Renewable Energy Research Group, Department of Building Services Engineering, The Hong Kong Polytechnic University, Kowloon, Hong Kong, China
*
Author to whom correspondence should be addressed.
Sustainability 2016, 8(11), 1091; https://doi.org/10.3390/su8111091
Submission received: 23 May 2016 / Revised: 9 October 2016 / Accepted: 18 October 2016 / Published: 25 October 2016
(This article belongs to the Special Issue Renewable Energy Applications and Energy Saving in Buildings)

Abstract

:
This paper reports an experimental investigation of the dust particle deposition process on solar photovoltaic (PV) modules with different surface temperatures by a heating plate to illustrate the effect of the temperature difference (thermophoresis) between the module surface and the surrounding air on the dust accumulation process under different operating temperatures. In general, if the temperature of PV modules is increased, the energy conversion efficiency of the modules is decreased. However, in this study, it is firstly found that higher PV module surface temperature differences result in a higher energy output compared with those modules with lower temperature differences because of a reduced accumulation of dust particles. The measured deposition densities of dust particles were found to range from 0.54 g/m2 to 0.85 g/m2 under the range of experimental conditions and the output power ratios were found to increase from 0.861 to 0.965 with the increase in the temperature difference from 0 to 50 °C. The PV module with a higher temperature difference experiences a lower dust density because of the effect of the thermophoresis force arising from the temperature gradient between the module surface and its surrounding air. In addition, dust particles have a significant impact on the short circuit current, as well as the output power. However, the influence of particles on open circuit voltage can be negligible.

1. Introduction

Recently, a common solar energy utilization technology, solar photovoltaic (PV) modules that can convert solar radiation into usable electricity by traditional semi-conductor solar cell, has been widely used because it can continuously provide clean and green energy. PV modules can be installed almost anywhere to make full use of solar radiation, such as rooftops and external walls.
The performance of PV modules is influenced by certain environmental parameters. For instance, wind velocity is an important parameter because higher wind velocity has a stronger cooling effect on operating PV modules and thus increases the energy conversion efficiency [1]. In addition, the presence of accumulated dust is a significant factor because of its shading effect on the received solar radiation. Research on the effect of accumulated dust on PV modules has been conducted for more than decades of years. Sayigh et al. have stated that the efficiency degradation of PV modules by accumulated dust was 25% in one month in Saudi Arabia [2]. In addition, a 15% decrease in the PV module output over two months has been reported, also in Saudi Arabia [3]. Furthermore, the efficiency reductions ranging from 17% to 65% for different tilt angles in one month in Kuwait have been reported due to local severe dust conditions [4]. Salim et al. reported a nearly 32% decrease in energy output in eight months because of dust accumulation [5]. El-Nashar studied the effect of dust accumulation on the performance of solar collectors over different time periods in the United Arab Emirates and found that the monthly decline rate in glass transmissivity was 10% in summer and 6% in winter [6]. Hassan et al. [7] have found that the degradation velocity is large in the first 30 days. In addition to outdoor studies, laboratory experiments have been conducted in recent years to investigate the performance of accumulated dust. Jiang et al. [8] have studied the effect of dust on three different kinds of PV modules under controlled conditions in laboratories and have pointed out the relationship between deposition density and energy output reduction. Thus, it appears that the decreased influence of accumulated dust on the output of PV modules is significant [9,10,11,12,13,14,15]. In addition to directly decreasing the intensity of solar irradiation, accumulated dust can have a negative effect on solar mirrors, which is especially so in concentrating solar power plants (CSPs) rather than PV modules. The first reason for this negative effect is the direct damage of the deposition process by airborne dust particles [16,17,18]. Karim et al. reported that solar mirror surface wear depends on the properties of the sand particles, such as diameter shape, hardness, and density [19]. Apart from the properties of dust particles, the effects of impact speed and angle and the erosive sand particles have been comprehensively investigated [20]. Another reason is in the cleaning process. When cleaning an accumulated dust-affected PV module surface, no matter what mechanism is used, be it wiping with a soft medium or washing with water, surface damage is inevitable. Thus, too much cleaning over time negatively impacts solar mirrors and output power. Finally, it is interesting to measure the reduction effect of accumulated dust. Cristaldi et al. evaluated the impact of both aging and dust deposition by analyzing the differences between actual power production and theoretical power output [21].
Additionally, PV modules produce electricity when subjected to solar radiation, the temperature of the surface rises due to the heating effect. This produces a noticeable effect on the temperature difference between the surface of the PV modules and ambient air. This temperature difference can lead to an obvious temperature gradient near the surface and to a force called thermophoresis force. Thermophoresis force can be applied to submicron particles moving toward a cold surface or blowing away from a hot surface at a given temperature gradient. Therefore, the rising temperature difference may reduce dust accumulation density and increase power output of PV modules due to the direction of thermophoresis force. Thus, this influence is worthy of experimental study via indoor particle deposition experiments. In fact, dust deposition behaviors and processes on solar PV modules are quite complicated and can be influenced by many factors, such as wind velocities, the inclination of PV modules, thermophoresis induced by the temperature difference during the day and night, and electrophoresis due to the electricity generation of PV modules [22]. However, it is challenging to investigate the effects of all of the influencing factors in the dust deposition process at the same time. Therefore, this paper mainly examines the influence of thermophoresis on the dust accumulation behaviors and tries to obtain in-depth results and address mechanisms.
In the study presented in this paper, an indoor particle deposition experiment was designed and conducted to study the effect of the temperature difference between the module surface and the local air temperature on the dust accumulation process. In addition, weighting results of accumulation density and the energy output power of tested PV modules were analyzed to illustrate the influence of temperature difference. This work can help researchers and engineers to further understand the detailed relationship between temperature difference and the dust accumulation process. This research can also instruct them as to when dirty PV modules should be cleaned and how frequently the effect of temperature differences should be considered.

2. Experimental Methodology and Material

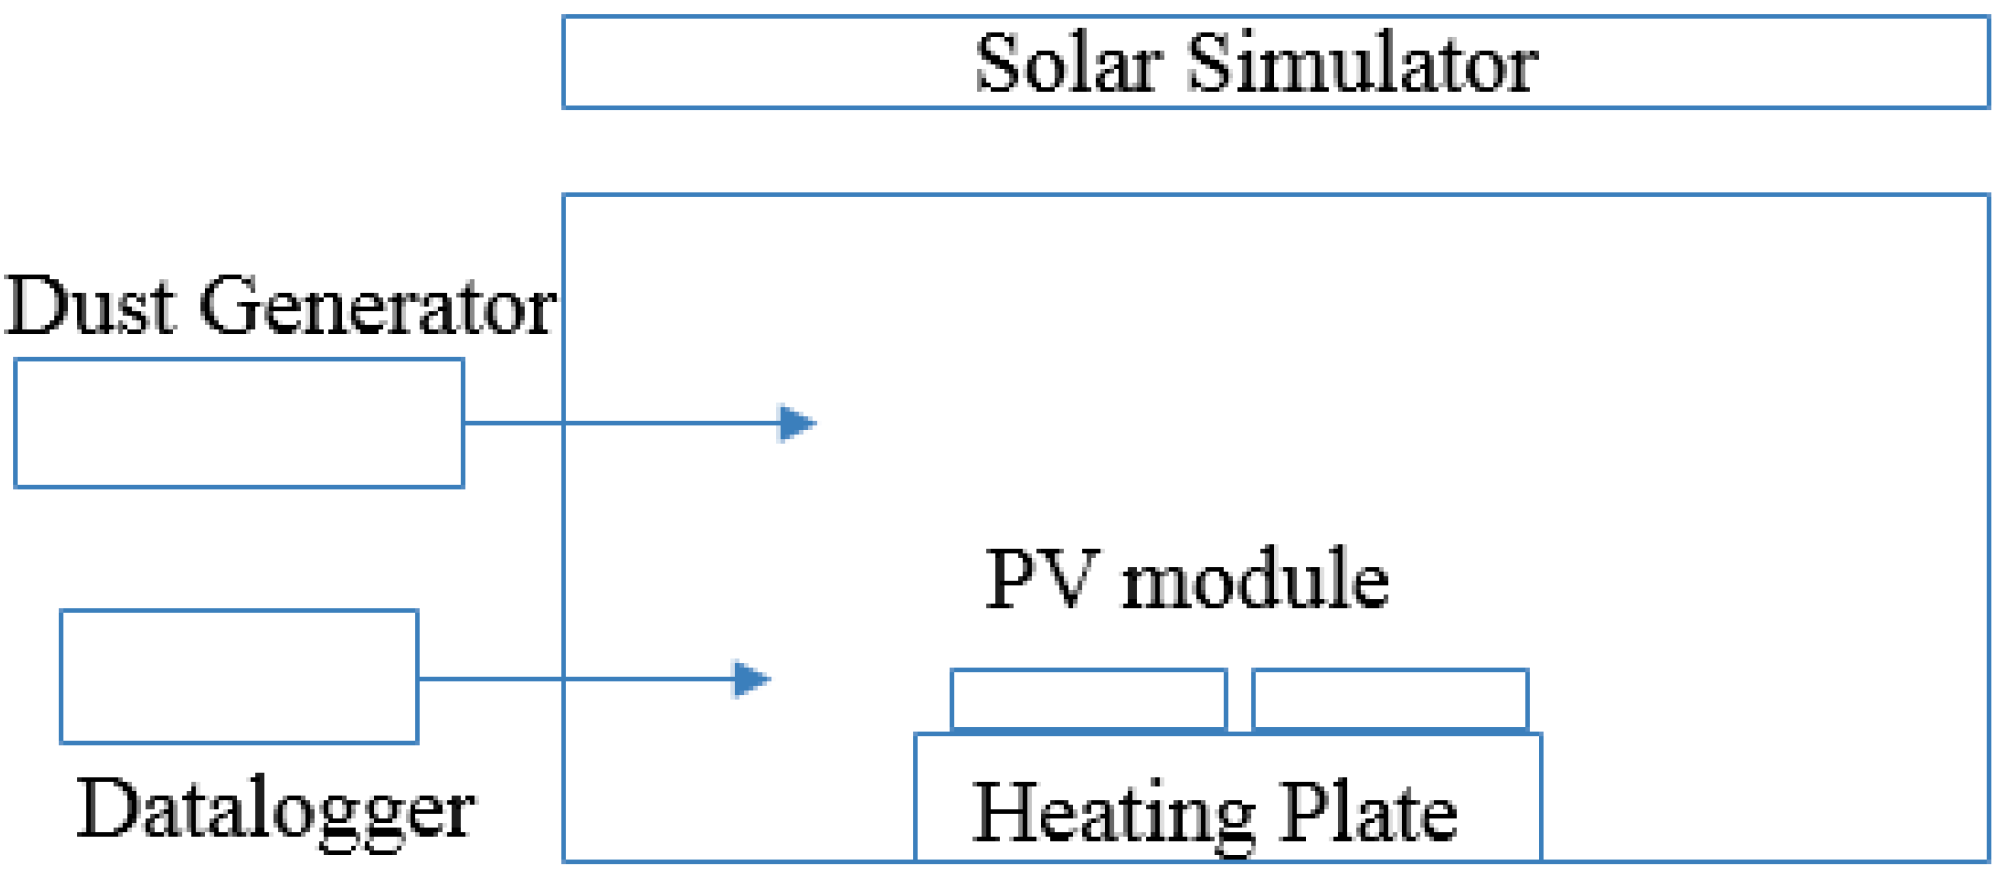
2.1. Experimental Procedure

Two small identical monocrystalline silicon PV modules were chosen as test samples in this experiment. The modules were 135 mm × 135 mm because this is the basic size unit adopted by common commercial solar cells on the market.
As mentioned above, for PV modules, the long-term operation under strong solar irradiance can cause a temperature rise in the solar cells and in glass covers. In order to simulate the temperature differences between the upper surface and the surrounding air, a heating plate was used to heat these samples and keep the surface temperature unchanged during the experimental time. This heating plate can produce any temperature from room temperature to 350 °C with an accuracy within 1 °C. Using this heating plate to provide the required temperature differences for this experiment is therefore convenient and reliable. Temperature differences can reach up to 50 °C when the solar radiation is strong enough. Since the ambient temperature during the experiment will be set at 23 °C, the heating temperatures in the experiment will range from 23 °C to 90 °C. The experimental facilities consist of a test chamber and an airborne particle generator. Figure 1 presents the illustration of this test rig. The size of the test chamber with an anti-static layer on its inner surface is 1 m × 0.6 m × 0.9 m. Standard tested particles will be injected into the chamber by the particle generator (PALAS GmbH, RBG 1000, Karlsruhe, Germany). The Arizona test dust (Powder Technology Inc., 0–100 μm ATD, Minnesota, MN, USA) was chosen to act as the natural dry dust. Figure 2 shows the particle diameter distribution by volume percentage. The test dust is distributed in sizes between 1 µm to 100 µm. The volume of dust with a size of 20 µm is about 20%, and the sum volume of dust less than 20 µm is about 74%. Industrial dust is mainly composed of SiO2 and Al2O3.

2.2. Experimental Procedure and Protocol

The experimental protocol for each aerosol deposition process in the chamber can be summarized as follows. Firstly, the heating plate was placed in the center of the chamber and test samples placed on the heating area. After the temperature of the surrounding air and the chamber were measured, the heating plate was then turned on. Two temperature sensors connected with one data logger measured and recorded the PV module actual surface temperatures and the ambient air temperature because the ambient temperature could be increased by the heating plate. When the temperature difference had increased to the required level, the sensors were removed. In order to eliminate the effect of wind on particle deposition process, the indoor air-conditioning system and lights were turned off to ensure a dark and windless environment and to prevent the production of any small amount of heat by the PV samples under the room light. When all the experimental facilities were well established, the aerosol generator was turned on, and dust particles were injected into the chamber for about 20 min. Aerosol particles then deposited onto the test sample surface placed on the heating plate. To provide sufficient dust for the deposition process, the above injection procedure was repeated twice.
After 4 h, it was assumed that the particle deposition process had finished and the weight of deposited dust would not increase any further. The heating plate was turned off, and the PV samples cooled in a clean and tight container until the surface temperature reached ambient temperature. The samples were then sent to an indoor environmental quality laboratory (IAQ Lab) for dust weight measurement. The dust was measured by a high-accuracy digital microbalance (Precisa, Model 40SM-200A, Dietikon, Switzerland).
After the above procedure, the solar simulator (spectrum can be seen in Figure 3) was turned on, and the illumination intensity left unchanged. PV modules were placed under the irradiation of the solar lamp, and the output power results analyzed with a MP-160 I-V Tracer (EKO Instruments, Tokyo, Japan). The accumulated dust was then cleaned away by a cloth, and the weight and the energy performance were recorded as described above. The heating temperature was then changed to provide a new required temperature difference and the whole process was repeated precisely for each temperature difference scenario.

3. Results and Discussions

3.1. Densities of Particles Deposited

Table 1 presents the average deposited dust particle densities on the test silicon PV modules. Different temperature differences exist between the module and the surrounding air. The average particle deposition densities range from 0.54 g/m2 to 0.85 g/m2. When the surface temperature equals the surrounding air temperature, the deposited density is at its highest. Another significant finding is that particle deposition densities decrease with the increase in temperature difference. Hence, the module with the highest temperature difference has the lowest particle deposition density. The reason for this phenomenon is that the particle deposition process is influenced by a force, i.e., the thermophoresis force. This force is caused by the temperature difference between the PV module and its ambient air. In addition, the direction of the thermophoresis force is from the high temperature area to the low region. Thus, the thermophoresis force can drag particles from areas with higher temperatures to the zones with lower temperatures. There is no doubt that dust accumulation is less a PV module surface when it is converting solar energy.

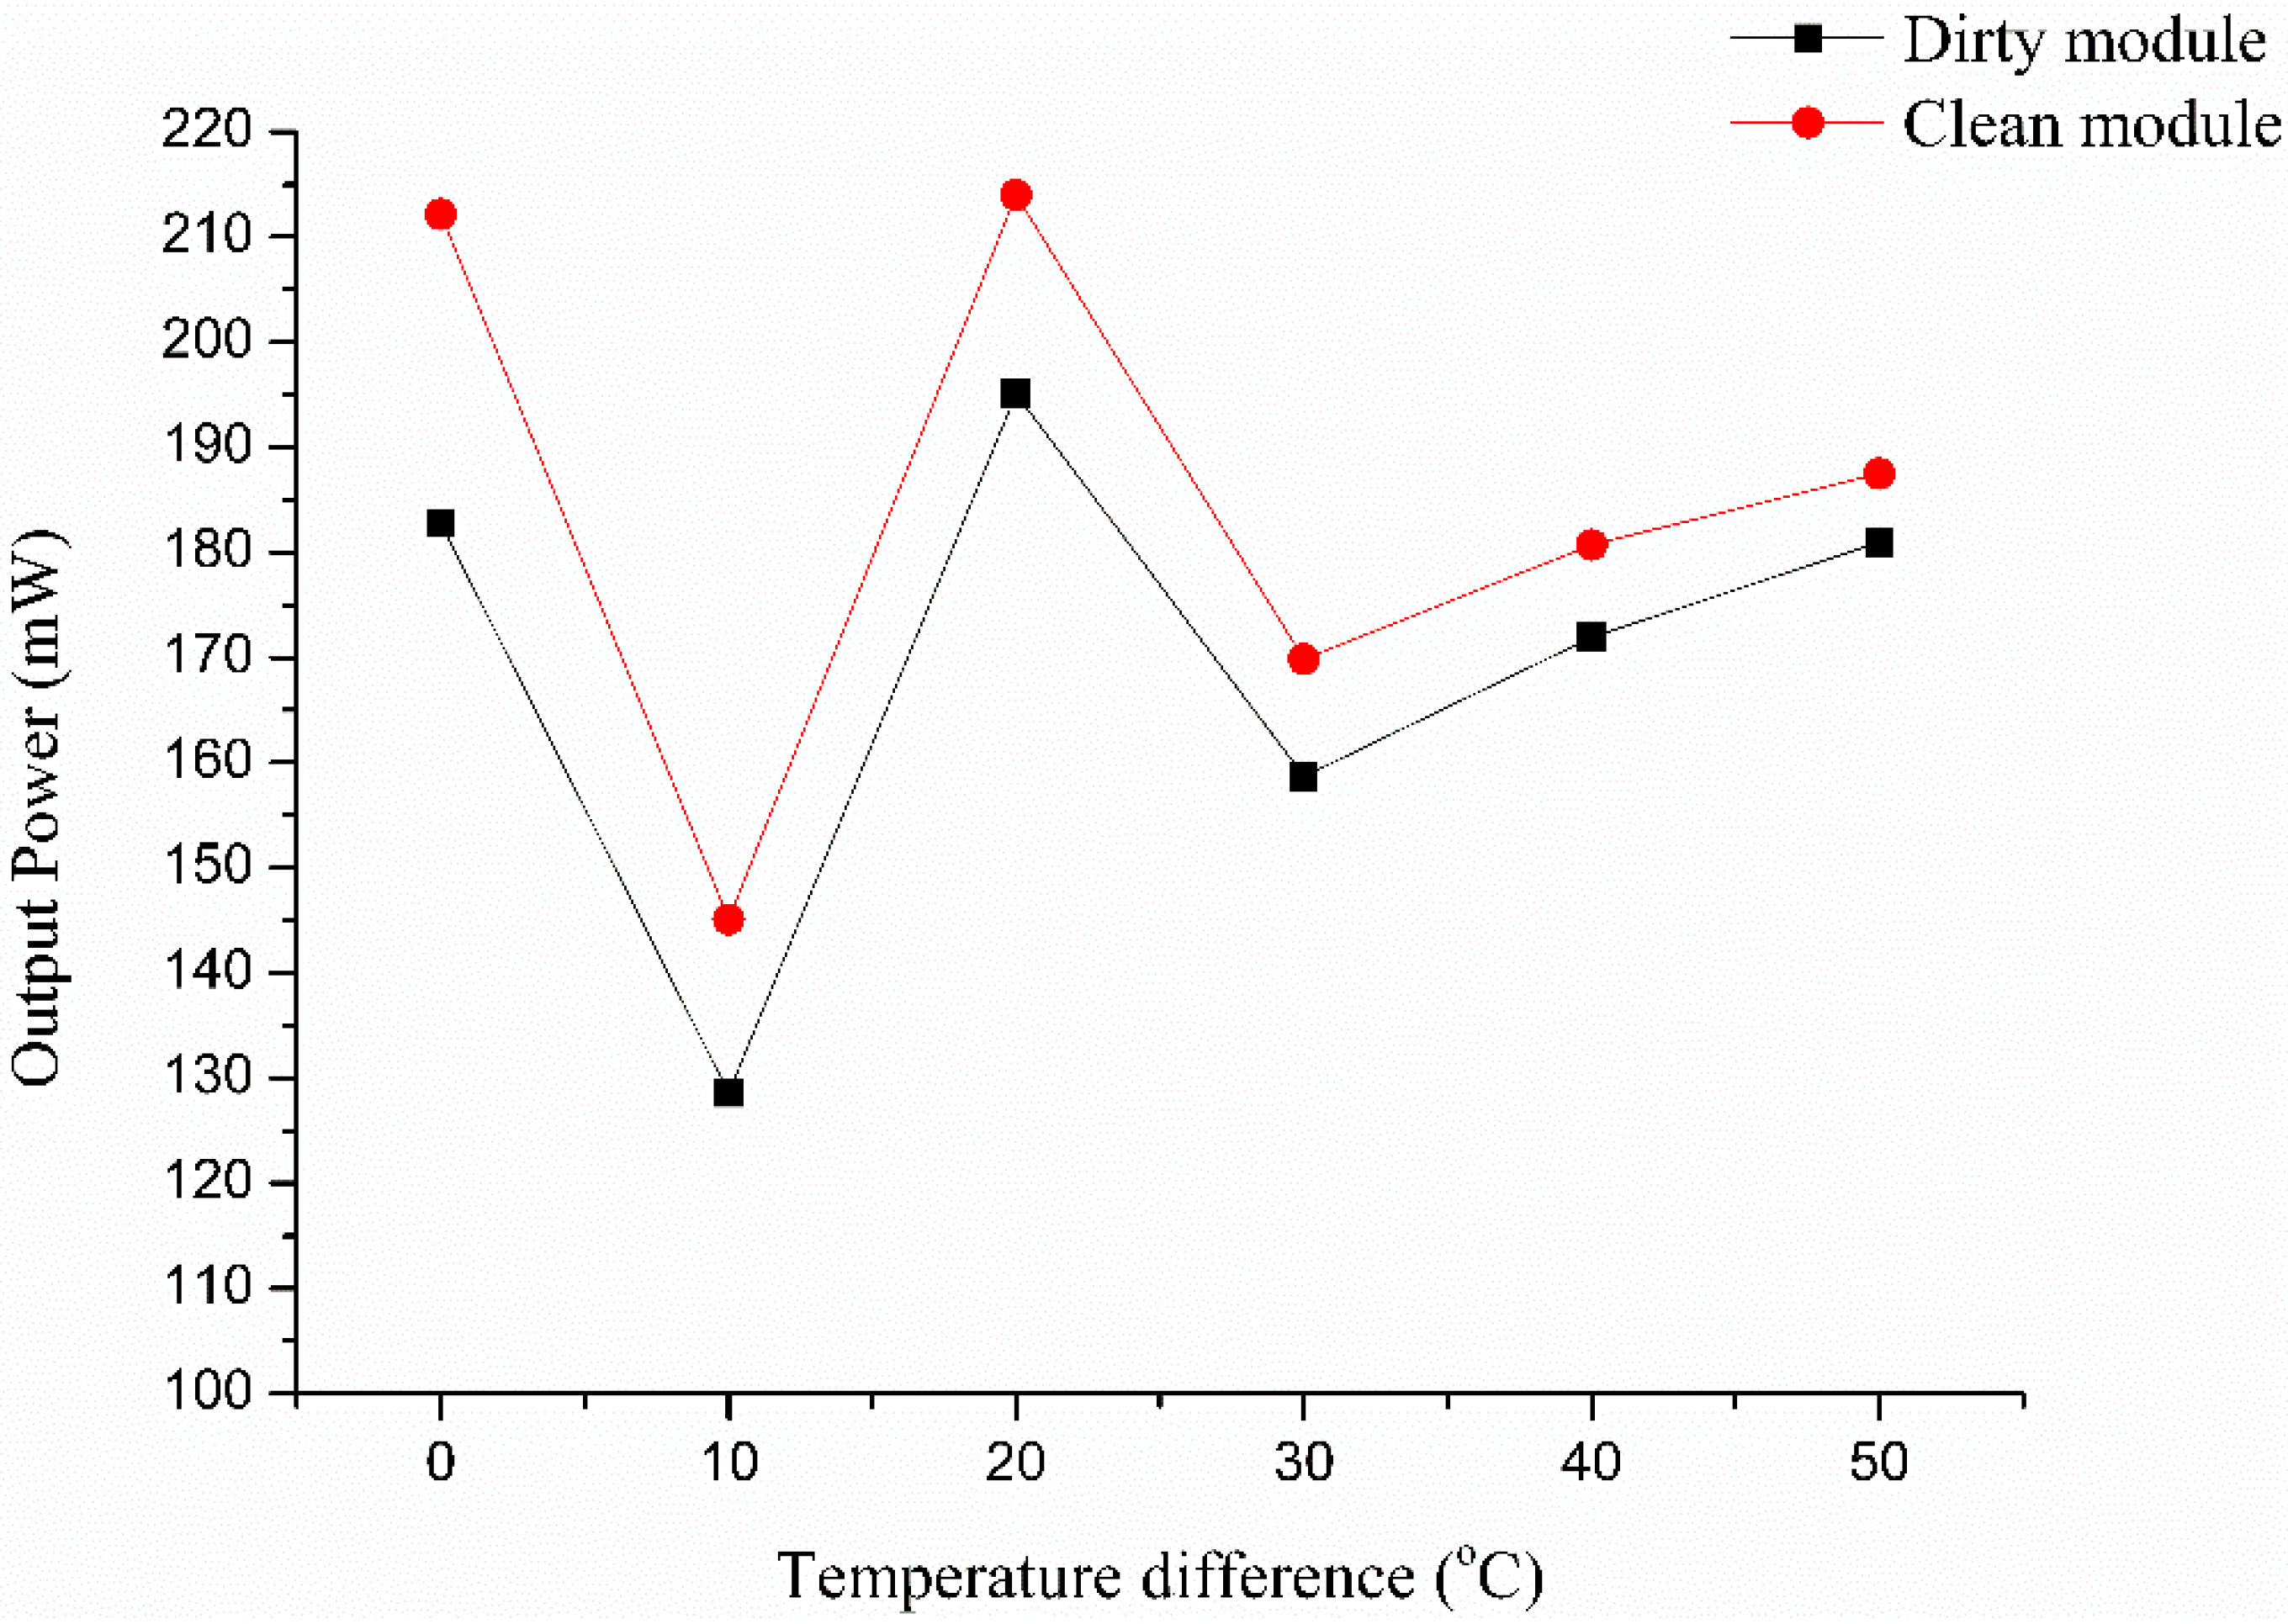
3.2. Results of Power Performance

Due to the reduction of the deposited dust particles on PV modules, the output power of dirty versus clean PV modules under a certain intensity of solar radiation is an important consequence. To compare the output power of the tested module effectively, the “output power ratio” (ƞ) is defined to describe the difference of energy output due to dust accumulation, as follows:
η = PA/PC
where PA is the output power of a PV module with deposited dust particles, and PC is the output power of a clean PV module. Generally, a lower output power ratio means a reduction in output power due to deposited dust particles and higher dust deposition densities. Because the differences between the two identical test results were small, the results listed below and used in the figures are the averages of two samples.
Figure 4 and Table 2 present the output power results of the PV module studied for different imposed surface temperatures. Table 3 shows the relative uncertainty of the output parameters. In general, the output power ratios are found to range from 86.1% to 96.5%. Because the received solar radiation is different for each measurement, the curve in Figure 4 is up and down. For the clean PV module, it is obvious that output power is higher than the identical dusty one because dust particles can greatly reflect and absorb the available solar light and thus decrease the total received energy and the output power of the PV module, as shown in Figure 5. However, the power conversion efficiency of solar cells decreases due to the higher surface temperature. Hence, trying to use a thermal insulation coating to reduce the particle deposition density is not economic for solar power stations.
For short circuit current and open circuit voltage of the tested module, Figure 6 and Figure 7 present the results for all experimental temperature differences. For the short circuit current, the clean sample clearly produces higher currents. The reason is that the short circuit current is influenced by the received solar irradiation, and the deposited dust particles effectively reduce the solar incident light by reflecting and absorbing some of the incident energy.
However, the open circuit voltages are nearly the same for dirty or clean PV modules. Open circuit voltage depends highly on the temperature of the PV modules but not on the solar radiation intensity. In this experiment, the output of PV module’s temperature was tested at room temperature; thus, the effect of deposited dust on the open circuit voltage can be neglected.
For engineers, to maintain a high energy output and conversion efficiency of PV modules, cleaning the accumulated dust on the surface of PV modules is important. As shown in this study, the higher temperature differences due to the heating leads to less particle deposition. Hence, during the day or in the summer, when the sun’s radiation is sufficiently strong, engineers should take measures for cooling the high temperature to keep up a high energy conversion efficiency. However, at night or in the winter, when the sun’s radiation is weak, the accumulation velocity of dust particles is larger and engineers should clean more often, especially in desert areas where the accumulated dust is extremely high.

4. Conclusions

Even though a high temperature causes a significant reduction in energy conversion, a high temperature difference between the PV module surface and ambient air can decrease dust accumulation on PV modules. This paper firstly conducts experiments to investigate the effect of temperature differences of dust particle deposition on the solar PV module and finds that the high surface temperature can greatly decrease particle deposition. In the experiment, the dust particle deposition density variable was controlled by a careful dust deposition process in a tight container, and the PV output power was measured accordingly. The main findings are summarized as follows:
(1)
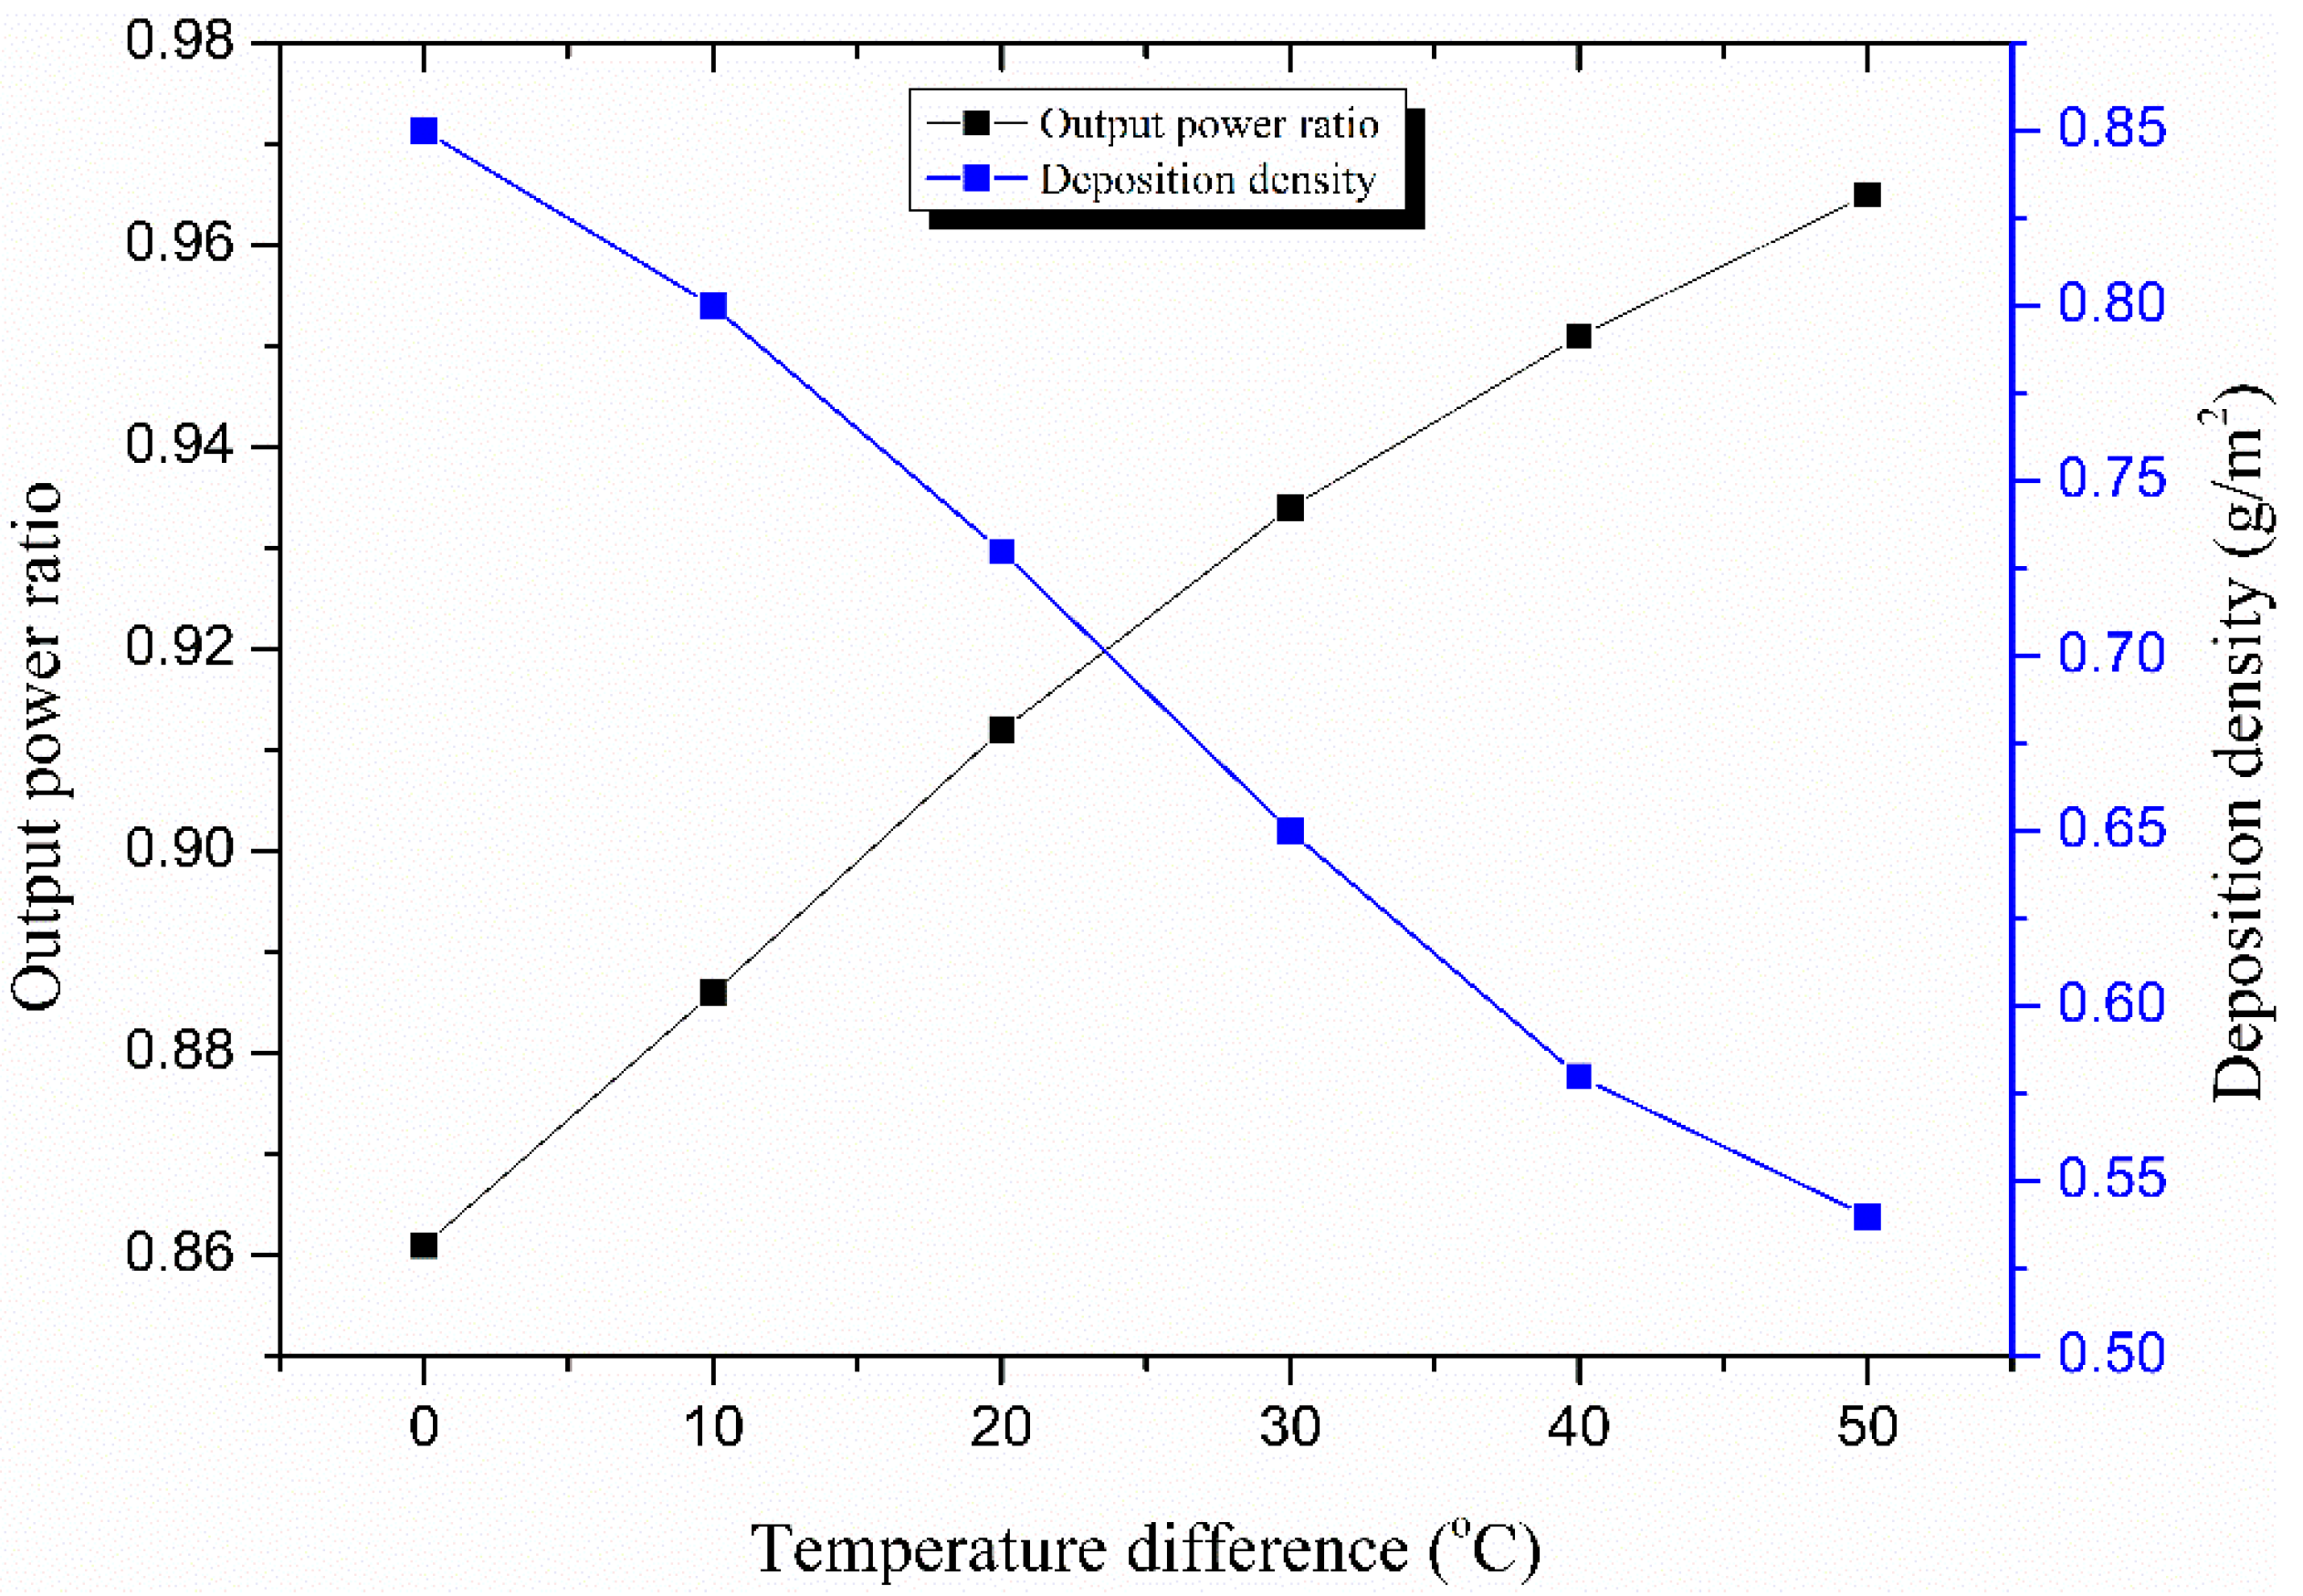
The measured deposition densities of fine particles ranged from 0.54 g/m2 to 0.85 g/m2 under the experimental conditions. The PV module with a higher surface temperature experienced a lower dust density due to the effect of thermophoresis arising from the temperature difference.
(2)
The output power ratios increased from 0.861 to 0.965 with an increase in temperature difference from 0 to 50 °C. The results also show a similar dust deposition trend due to the thermophoresis force in the particle deposition process.
(3)
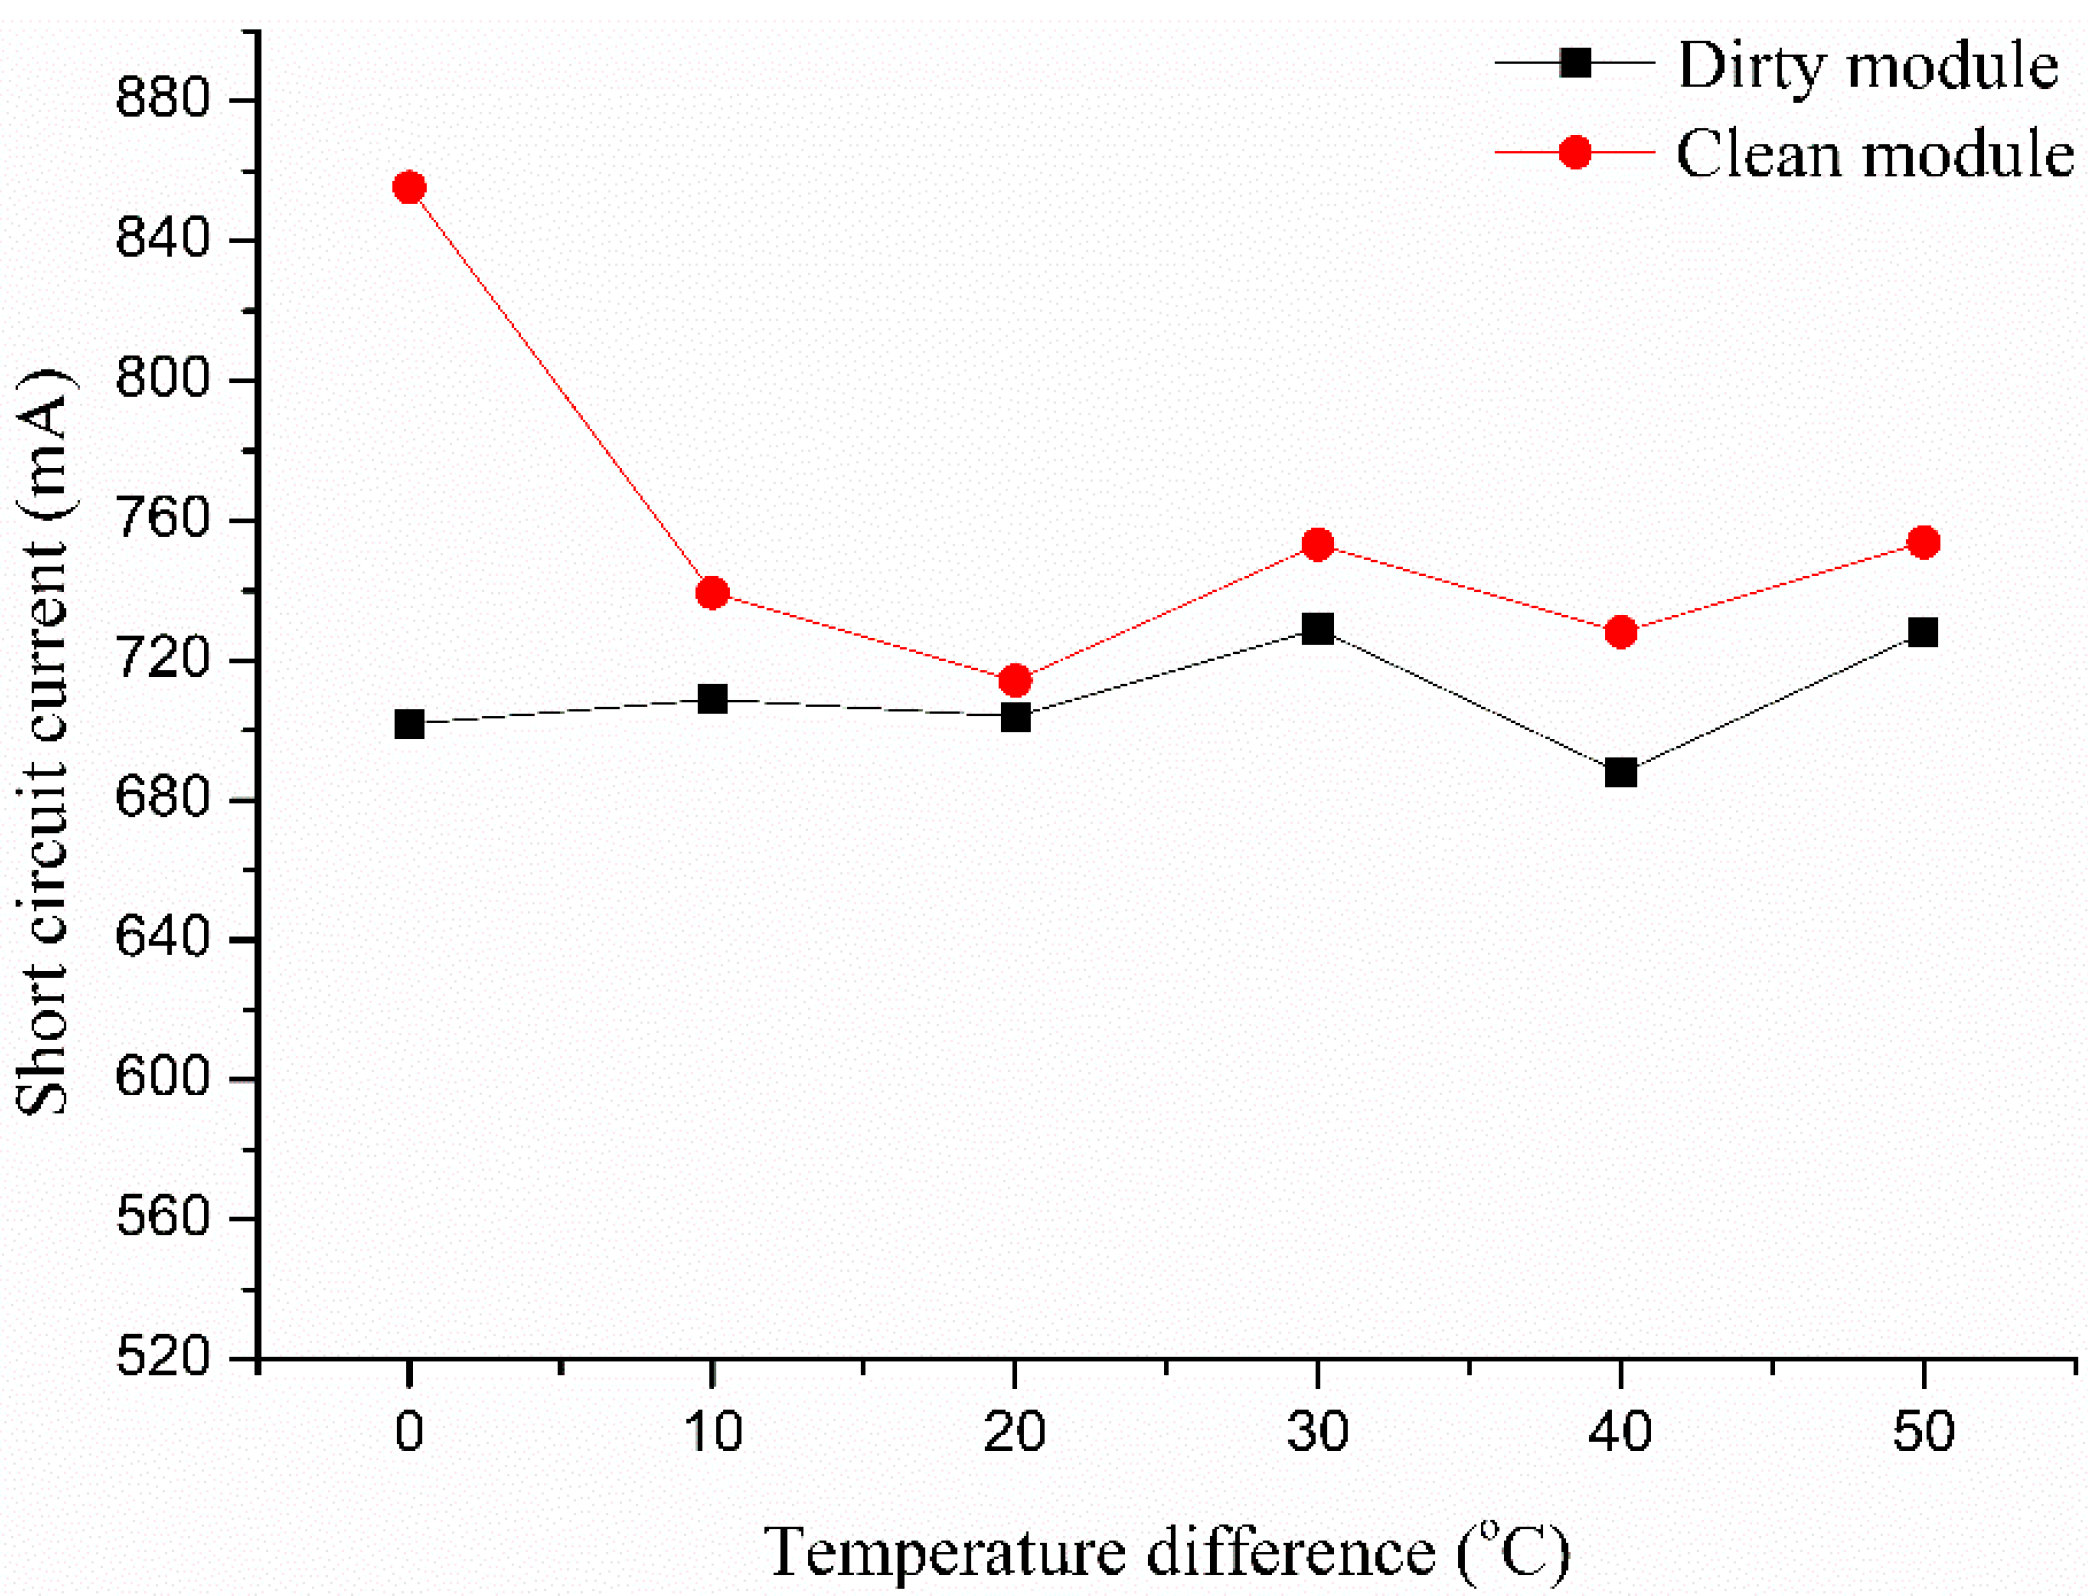
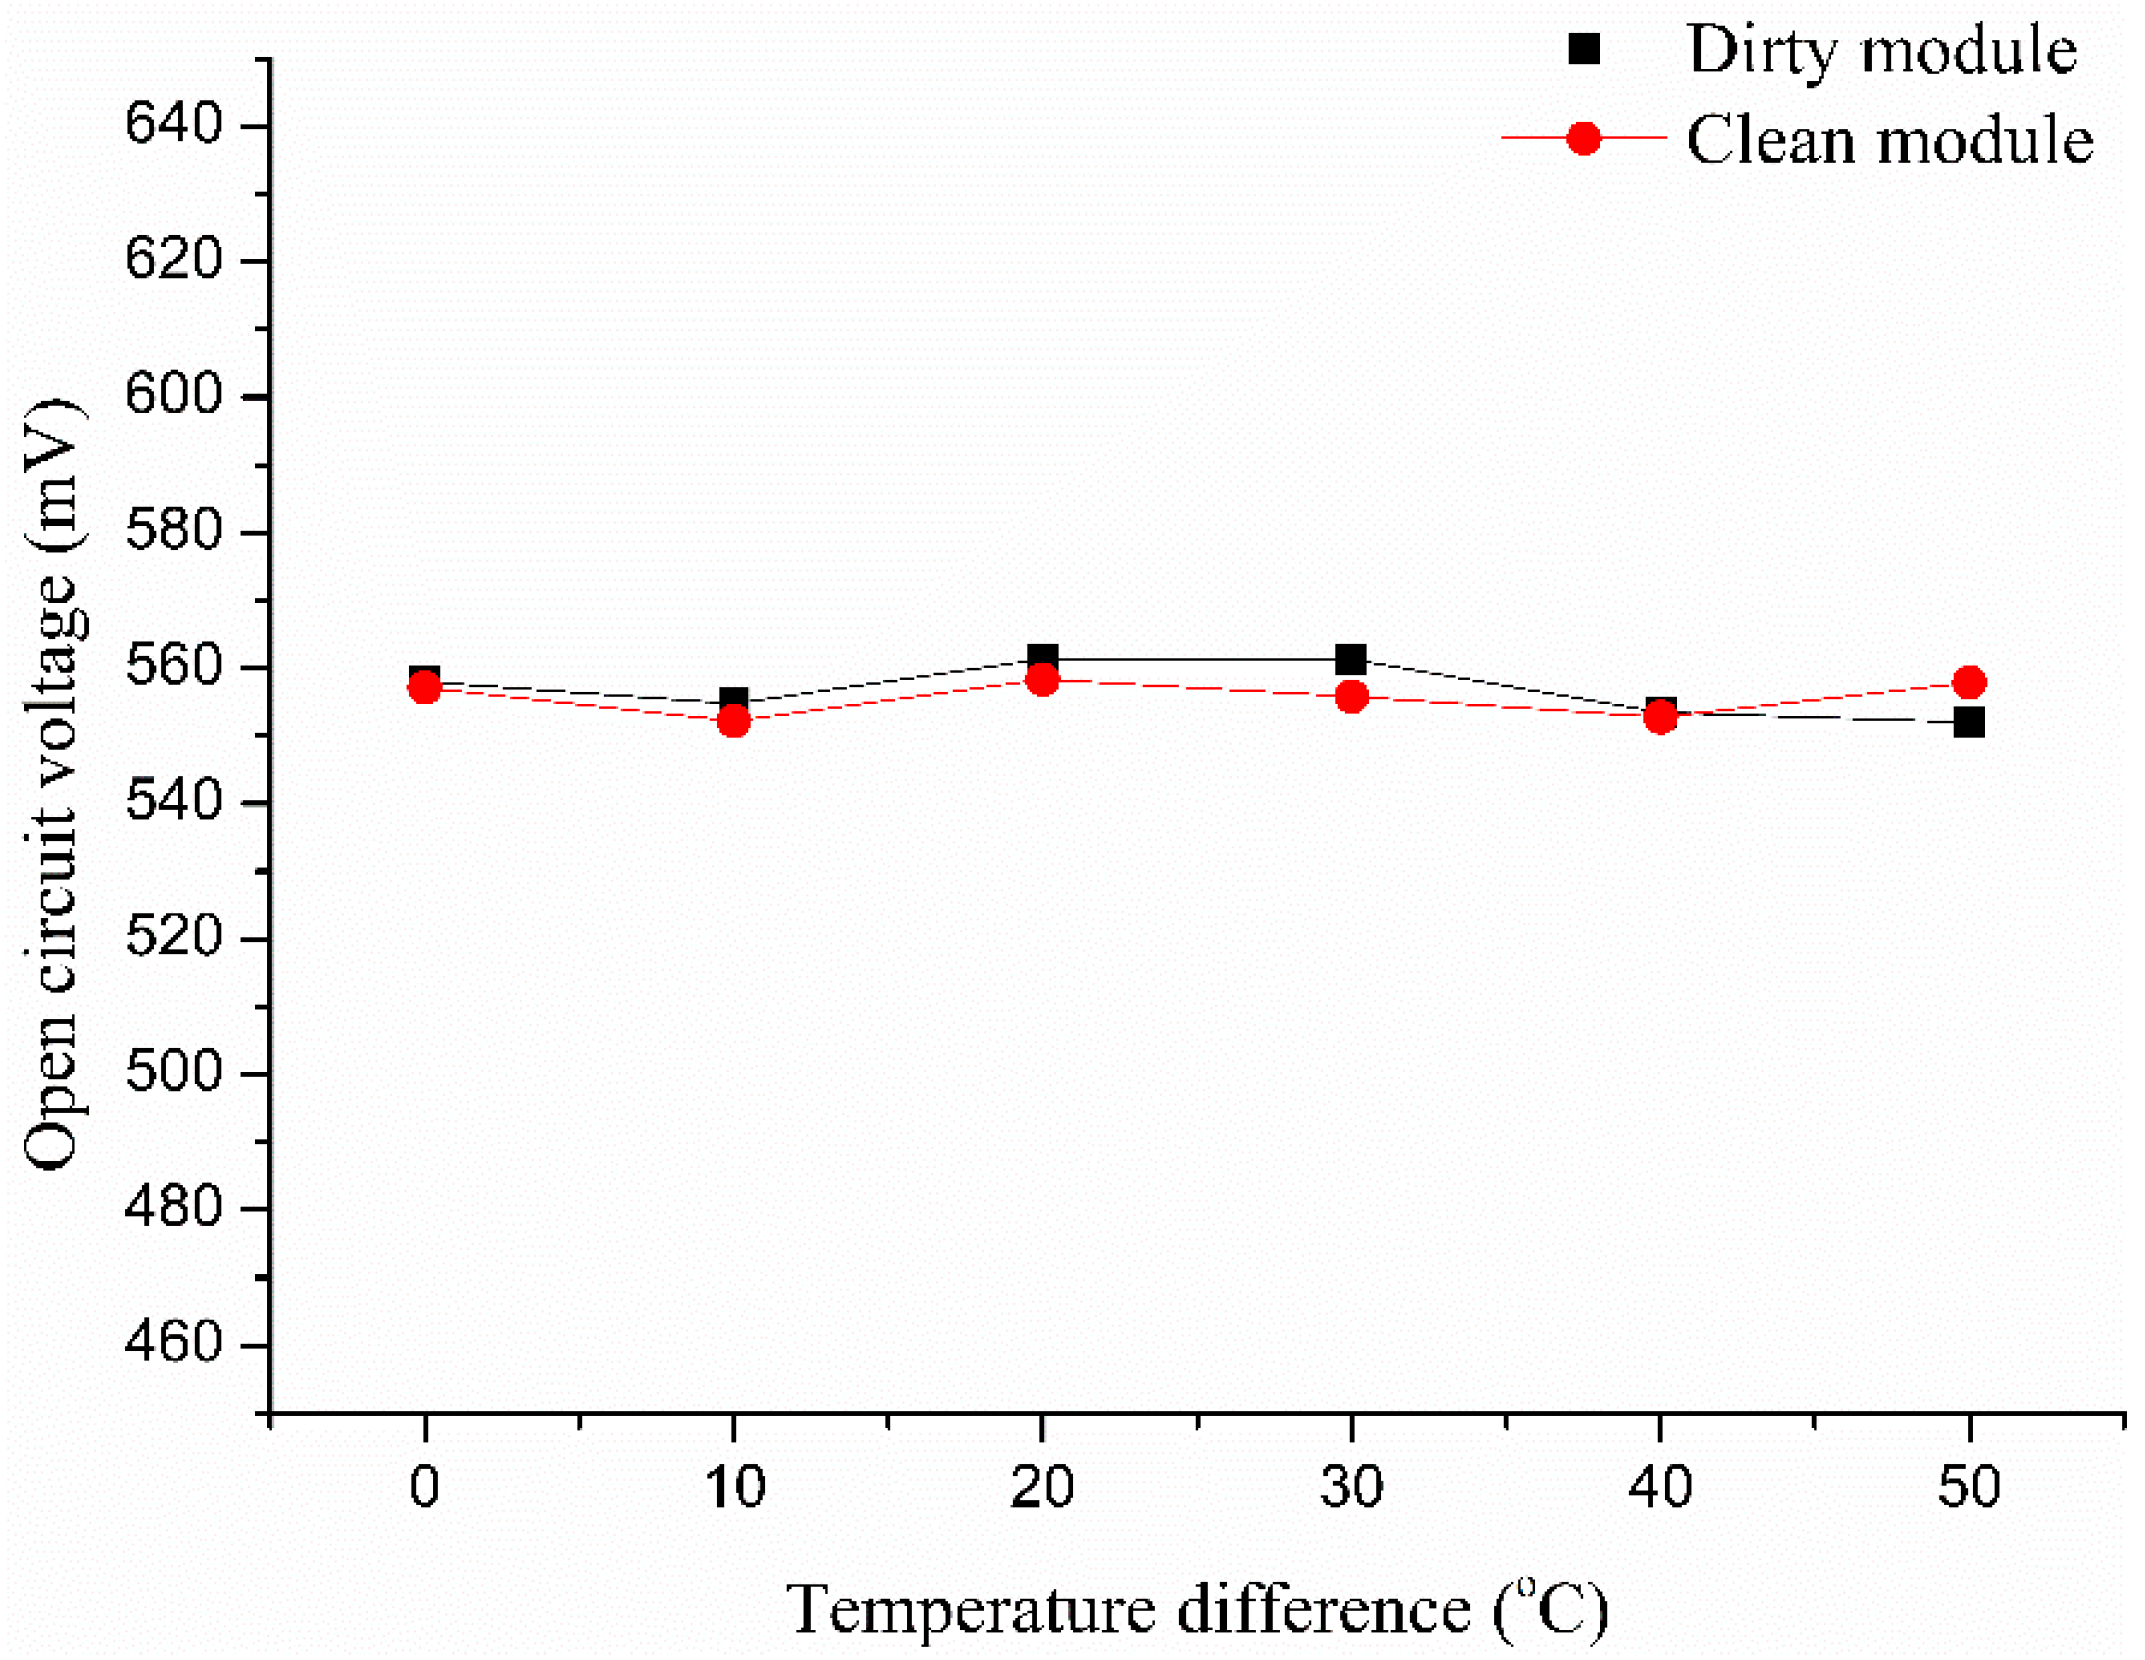
Dust particles have a significant impact on the short circuit current and the output power. However, the influence of particle on the open circuit voltage can be negligible.
In summary, for the operating solar PV modules, the temperature of solar cells or modules will increase dramatically, which will reduce the module power conversion efficiency and its power output. However, at the same time, this higher temperature can cause some offsetting output improvement by decreasing the power reduction effect caused by deposited dust particles on PV modules through the reduction of the surface accumulation of dust particles due to thermophoresis.

Acknowledgments

The authors appreciate the financial support provided by The Hong Kong Polytechnic University through the Grant 1-ZV6Z.

Author Contributions

All authors were responsible for different parts of this paper. Jiang Yu conducted all the experiments and wrote the whole paper; Lu Lin revised the paper.

Conflicts of Interest

The authors declare no conflict of interest.

Nomenclature

ηoutput power ratio
PAoutput power of a PV module with deposited dust particles
PCthe output power of a clean PV module

References

  1. Kaplani, E.; Kaplanis, S. Thermal modelling and experimental assessment of the dependence of PV module temperature on wind velocity and direction, module orientation and inclination. Sol. Energy 2014, 107, 443–460. [Google Scholar] [CrossRef] [Green Version]
  2. Sayigh, A.; Al-Jandal, S.; Ahmed, H. Dust Effect on Solar Flat Surfaces Devices in Kuwait. In Proceedings of the Workshop on the Physics of Non-Conventional Energy Sources and Materials Science for Energy, Miramare-Trieste, Italy, 2–20 September 1985; Furlan, C., Mancini, N.A., Sayigh, A.M.M., Seraphin, B.O., Eds.; ICTP: Trieste, Italy, 1985; pp. 2–20. [Google Scholar]
  3. Sayigh, A.; Charchafchi, S.; Al-Habali, A. Experimental Evaluation of Solar Cells in Arid Zones. In Proceedings of the Izmir International Symposium on Solar Energy Fundamentals and Applications, Izmir, Turkey, 1–5 August 1979; pp. 909–932.
  4. Nimmo, B.; Said, S.A. Effects of dust on the performance of thermal and photovoltaic flat plate collectors in Saudi Arabia—Preliminary results. In Alternative Energy Sources II, Proceedings of the Second Miami International Conference, Miami Beach, FL, USA, 10–13 December 1979; Hemisphere Publishing Corp.: Washington, DC, USA, 1981; Volume 1, pp. 145–152. [Google Scholar]
  5. Salim, A.; Huraib, F.; Eugenio, N. PV power-study of system options and optimization. In Proceedings of the 8th European PV Solar Energy Conference, Firenze, Italy, 9–13 May 1988; Kluwer Academic Publishers: Dordrecht, The Netherlands; Boston, MA, USA; London, UK, 1988; pp. 688–692. [Google Scholar]
  6. El-Nashar, A.M. The effect of dust accumulation on the performance of evacuated tube collectors. Sol. Energy 1994, 53, 105–115. [Google Scholar] [CrossRef]
  7. Hassan, A.; Rahoma, U.; Elminir, H.; Fathy, A. Effect of airborne dust concentration on the performance of PV modules. J. Astron. Soc. Egypt 2005, 13, 24–38. [Google Scholar]
  8. Jiang, H.; Lu, L.; Sun, K. Experimental investigation of the impact of airborne dust deposition on the performance of solar photovoltaic (PV) modules. Atmos. Environ. 2011, 45, 4299–4304. [Google Scholar] [CrossRef]
  9. Rehman, S.; El-Amin, I. Performance evaluation of an off-grid photovoltaic system in Saudi Arabia. Energy 2012, 46, 451–458. [Google Scholar] [CrossRef]
  10. Zorrilla-Casanova, J.; Piliougine, M.; Carretero, J.; Bernaola-Galván, P.; Carpena, P.; Mora-López, L.; Sidrach-de-Cardona, M. Losses produced by soiling in the incoming radiation to photovoltaic modules. Progr. Photovolt. Res. Appl. 2013, 21, 790–796. [Google Scholar] [CrossRef]
  11. Liqun, L.; Zhiqi, L.; Chunxia, S.Z.L. Degraded output characteristic at atmospheric air pollution and economy analysis of pv power system: A case study. Przegl. Elektrotech. 2012, 88, 281–284. [Google Scholar]
  12. Kalogirou, S.A.; Agathokleous, R.; Panayiotou, G. On-site pv characterization and the effect of soiling on their performance. Energy 2013, 51, 439–446. [Google Scholar] [CrossRef]
  13. Caron, J.R.; Littmann, B. Direct monitoring of energy lost due to soiling on first solar modules in California. IEEE J. Photovolt. 2013, 3, 336–340. [Google Scholar] [CrossRef]
  14. Adinoyi, M.J.; Said, S.A. Effect of dust accumulation on the power outputs of solar photovoltaic modules. Renew. Energy 2013, 60, 633–636. [Google Scholar] [CrossRef]
  15. Piliougine, M.; Cañete, C.; Moreno, R.; Carretero, J.; Hirose, J.; Ogawa, S.; Sidrach-de-Cardona, M. Comparative analysis of energy produced by photovoltaic modules with anti-soiling coated surface in arid climates. Appl. Energy 2013, 112, 626–634. [Google Scholar] [CrossRef]
  16. Bouaouadja, N.; Bouzid, S.; Hamidouche, M.; Bousbaa, C.; Madjoubi, M. Effects of sandblasting on the efficiencies of solar panels. Appl. Energy 2000, 65, 99–105. [Google Scholar] [CrossRef]
  17. Caron, S. Accelerated Aging of Thick Glass Second Surface Silvered Reflectors under Sandstorm Conditions. Master’s Thesis, Dalarna University, Falun, Sweden, 2011. [Google Scholar]
  18. Wang, Z.; Liu, L.; Li, X.; Zhao, L. An experimental method for analyzing environmental effects of blowing sands on glass abrasion. Procedia Environ. Sci. 2010, 2, 207–217. [Google Scholar] [CrossRef]
  19. Karim, M.; Naamane, S.; Hassani, I.E.A.E.; Delord, C.; Belcadi, S.; Tochon, P.; Bennouna, A. Towards the prediction of CSP mirrors wear: Methodology of analysis of influencing parameters on the mirrors surface degradation: Application in two different sites in Morocco. Sol. Energy 2014, 108, 41–50. [Google Scholar] [CrossRef]
  20. Karim, M.; Naamane, S.; Delord, C.; Bennouna, A. Study of the surface damage of glass reflectors used in concentrated solar power plants. Energy Procedia 2015, 69, 106–115. [Google Scholar] [CrossRef]
  21. Cristaldi, L.; Faifer, M.; Rossi, M.; Toscani, S.; Catelani, M.; Ciani, L.; Lazzaroni, M. Simplified method for evaluating the effects of dust and aging on photovoltaic panels. Measurement 2014, 54, 207–214. [Google Scholar] [CrossRef]
  22. Lu, H.; Lu, L.; Wang, Y. Numerical investigation of dust pollution on a solar photovoltaic (PV) system mounted on an isolated building. Appl. Energy 2016, 180, 27–36. [Google Scholar] [CrossRef]
Figure 1. Illustration of lab experimental apparatus.
Sustainability 08 01091 g001
Figure 2. Dust size distribution by volume percentage.
Sustainability 08 01091 g002
Figure 3. Light spectrum of the solar lamp.
Sustainability 08 01091 g003
Figure 4. Output power results for different temperature differences (particle deposition densities with temperature difference are 0.85, 0.80, 0.73, 0.65, 0.58, and 0.54 g/m2 respectively).
Sustainability 08 01091 g004
Figure 5. Output power ratio and deposition density results for different temperature differences (Vertical axis is not started at zero).
Sustainability 08 01091 g005
Figure 6. Short circuit current results under different temperature differences.
Sustainability 08 01091 g006
Figure 7. Open circuit voltage results with temperature difference.
Sustainability 08 01091 g007
Table 1. Deposited dust particle densities for different temperature differences.
Temperature Difference (°C)Average Particle Deposition Density (g/m2)Relative Uncertainty
00.85±4%
100.80±8%
200.73±6%
300.65±4%
400.58±6%
500.54±3%
Table 2. Output power results for different temperature differences.
Temperature Difference (°C)Output Power for Dirty PV Module (mW)Output Power for Clean PV Module (mW)Output Power RatioShort Circuit Current for Dirty PV Module (mA)Short Circuit Current for Clean PV Module (mA)Open Circuit Voltage for Dirty PV Module (mV)Open Circuit Voltage for Clean PV Module (mV)
0182.8212.20.861701.8855.3558.0557.1
10128.6145.10.886708.9739.3554.8552.2
20195.1214.00.912704.0714.2561.4558.4
30158.7169.80.934729.0753.2561.3555.8
40172.0180.70.951687.7728.1553.5552.8
50181.0187.50.965727.9753.8552.0557.9
Table 3. Relative uncertainty of output parameters.
ParameterRelative Uncertainty
Output power±7%
Short circuit current±9%
Open circuit voltage±3%

