1. Introduction and Theoretical Background
According to a report in 2013 from the Intergovernmental Panel on Climate Change (IPCC) [
1], climate change due to human-induced greenhouse gas emissions will cause temperature increases in many regions, the impact of which has been projected to generate various detrimental effects such as rising sea levels, ecosystem changes, droughts, and floods. Despite the implementation of mitigation policies and actions, human-induced greenhouse gas emissions significantly increased between 2000 and 2010 [
2]. Greenhouse gas emissions caused by industrialization are being monitored to prevent irreversible impacts, and accordingly, climate change adaptation is becoming increasingly important [
3]. Although reducing greenhouse gas emissions is fundamental for mitigating climate change, climate change adaptation is important to address the already changed climate system [
4] and to benefit from the interdependent synergies of mitigation [
5]. The actions businesses take related to climate change adaptation are thus important in that they form the basis of the overall societal response to climate change [
6,
7]. For successful climate change adaptation, the participation of the business sector is therefore necessary [
8,
9].
The terminology used revolving climate change adaptation is somewhat ambiguous in the business sector. According to Averchenkova et al. [
10], the ambiguity of the terminology stems from the fact that the terms already used for climate change risks such as resilience, business continuity, and enterprise risk management derive their meanings from the 5th IPCC report, which defined climate change adaptation as “the process of adjustment to actual or expected climate and its effects”. Hence, business continuity plans and processes include the normal amounts in the generic risk management stage already performed by companies as well as an extreme weather risk due to climate change [
11]. However, climate change includes complex, nonlinear, and potentially irreversible environmental changes with uncertain impacts that are not included in traditional risk management of the business sector [
12,
13,
14]. Moreover, climate change may work as a risk multiplier, rendering the countermeasures to existing risks ineffective [
15]. Based on the foregoing, the meanings of climate change risk and adaptation used in this research differ from those included in the existing risk management systems of businesses. Here, climate change adaptation means “the process of adjustment by companies to actual or expected climate and its effects through changes in business strategies, operations, practices, and/or investment decisions” [
10].
The potential risks of climate change to the business sector have been discussed widely. Sussman and Freed [
16] defined risks according to their physical impacts on each sector. The UN Global Compact, UNEP, Oxfam, and World Resource Institute [
17] used surveys to suggest that the influence of climate change can be categorized into physical risk, credit risk, and corporate operational risk. Withey et al. [
18] classified climate change risk into operational, regulatory and legal, reputational, market and product, and financing aspects. Nitkin et al.’s [
19] literature review found that the risk, vulnerabilities, strategies, and barriers relating to climate change adaptation can be classified into sectors such as insurance, agriculture, tourism and recreation, energy, water, building and construction, and finance and banking.
The problem is how to quantify the potential for changes in natural conditions owing to climate change as well as how to understand the extent to which such changes affect individual businesses and how much will be actualized as a result. First, climate change risk has been discussed in the form of the causal relationship between the likelihood and consequences of a possible incident that may bring about an ecological or socioeconomic impact due to climate change [
20]. Here, likelihood refers to the possibility for a potential event caused by climate change to occur, while consequence refers to the level of impact. Second, risk quantification in climate change risk assessment refers to the method used to determine the likelihood and consequence discussed above. Quantification methods can be classified into stochastic models or indexes [
21,
22,
23] and surveys [
24,
25]. However, there has been insufficient discussion on these quantification methods in relation to forecasting the climate change risk that may occur at the individual business level in order to assess the risk of the entire business sector.
Efforts by companies to adapt to the impact of climate change began with the Private Sector Initiative, the adaptation program launched by the United Nations Framework Convention on Climate Change in 2011. Climate change adaptation in the business sector consists of efforts to reduce operational risk and discussions on investments related to adaptation, which are based on the notion that environmental effects and climate change caused by a continued rise in temperature will fundamentally change the conditions of a company’s business operations such as its supply chain, raw materials, distribution network, and consumer behavior [
26,
27]. However, in the business sector, discussion and awareness related to climate change largely focus on the management of greenhouse gas emissions rather than climate change adaptation [
7]. For example, the global executive survey on sustainability and innovation conducted by the MIT Sloan Management Review and Boston Consulting Group in June 2013 revealed that while the majority of companies consider climate change to be an urgent issue with significant implications, only a minority are preparing for its impact [
28]. Companies do not prepare for or implement measures to adapt to climate change because of various factors such as a lack of information and uncertainties within the company. Information obtained from scientific groups is often unsuitable for use by company decision-makers [
26,
29], who require information on how climate change will influence factors such as organizational inputs, supply chains, and business infrastructures. In other words, they require an assessment of how changes to natural conditions will transform their business environment [
7,
30].
Therefore, this study proposes a method for companies to assess the risks resulting from climate change and, from this, develops a tool that generates climate change data suitable for the corporate decision-making process. In particular, it employs an assessment method from the ISO 31000 process widely used in risk management and provides results based on the financial statements used by all companies for management planning. The proposed process provides data on company preparedness for climate risks as well as the degree of damage the company may incur and useful information for the decision-making process. Furthermore, this study converts the climate change data presented by scientific groups into information that can be projected into the decision-making process and provides a method of calculating results that can support company decisions.
The remainder of this paper is organized as follows.
Section 2 constructs a framework for assessing climate risks from the perspective of a company and discusses methods for connecting business risk factors with the climatic hazards.
Section 3 presents the implementation of the tool and the results for assessing company-related climate risk.
Section 4 discusses the limitations of the study and offers suggestions for future research. Lastly,
Section 5 presents the conclusions.
2. Methodology and Framework
2.1. Risk Assessment Framework for Climate Change Impact
To assess the climate change risk, this study employs a risk management framework used for strategic decision-making in the business sector. Risk management is the process of considering various potential results based on problems or situations of uncertain risk and examining the damage that such situations could cause as well as establishing appropriate countermeasures [
31,
32,
33]. It involves managing potentially negative effects as well as determining the process and structure of implementing potential opportunities for the company in question [
34,
35]. This practice can thus capture uncertain risks in the decision-making process as well as provide feedback, all through the continual process of reducing risk [
36].
A risk management framework, which is used by companies to conduct a systematic evaluation and analysis of risk, can be applied in various fields [
37]. Numerous companies have used the ISO 31000 process as a risk management framework and, accordingly, this has been adopted as the international standard, notably in the Climate Change Risk Assessment conducted in the United Kingdom, AS/NZS4360 conducted in Australia and New Zealand, and KLIMACHECK conducted in Germany. The risk management process of ISO 31000 is suitable for assessing climate change risk and planning adaptation actions because it links the needs to manage uncertainty with climatic hazards and consequences. It also fosters communication between technical experts and stakeholders and suggests activities to reduce risks [
38].
Applications of ISO 31000 in this research do not include all the activities relating to the planning, implementing, and monitoring of adaptation as a risk treatment; they only include the processes up to the risk evaluation phase. To use these methods and tools to assess climate change risks, the method suggested by Jones and Preston is adopted [
38]. This approach focuses on the method and tool used to derive implementation results by confirming and choosing the climate change risk that a business may face and then developing the adaptation measure through a probability-based assessment.
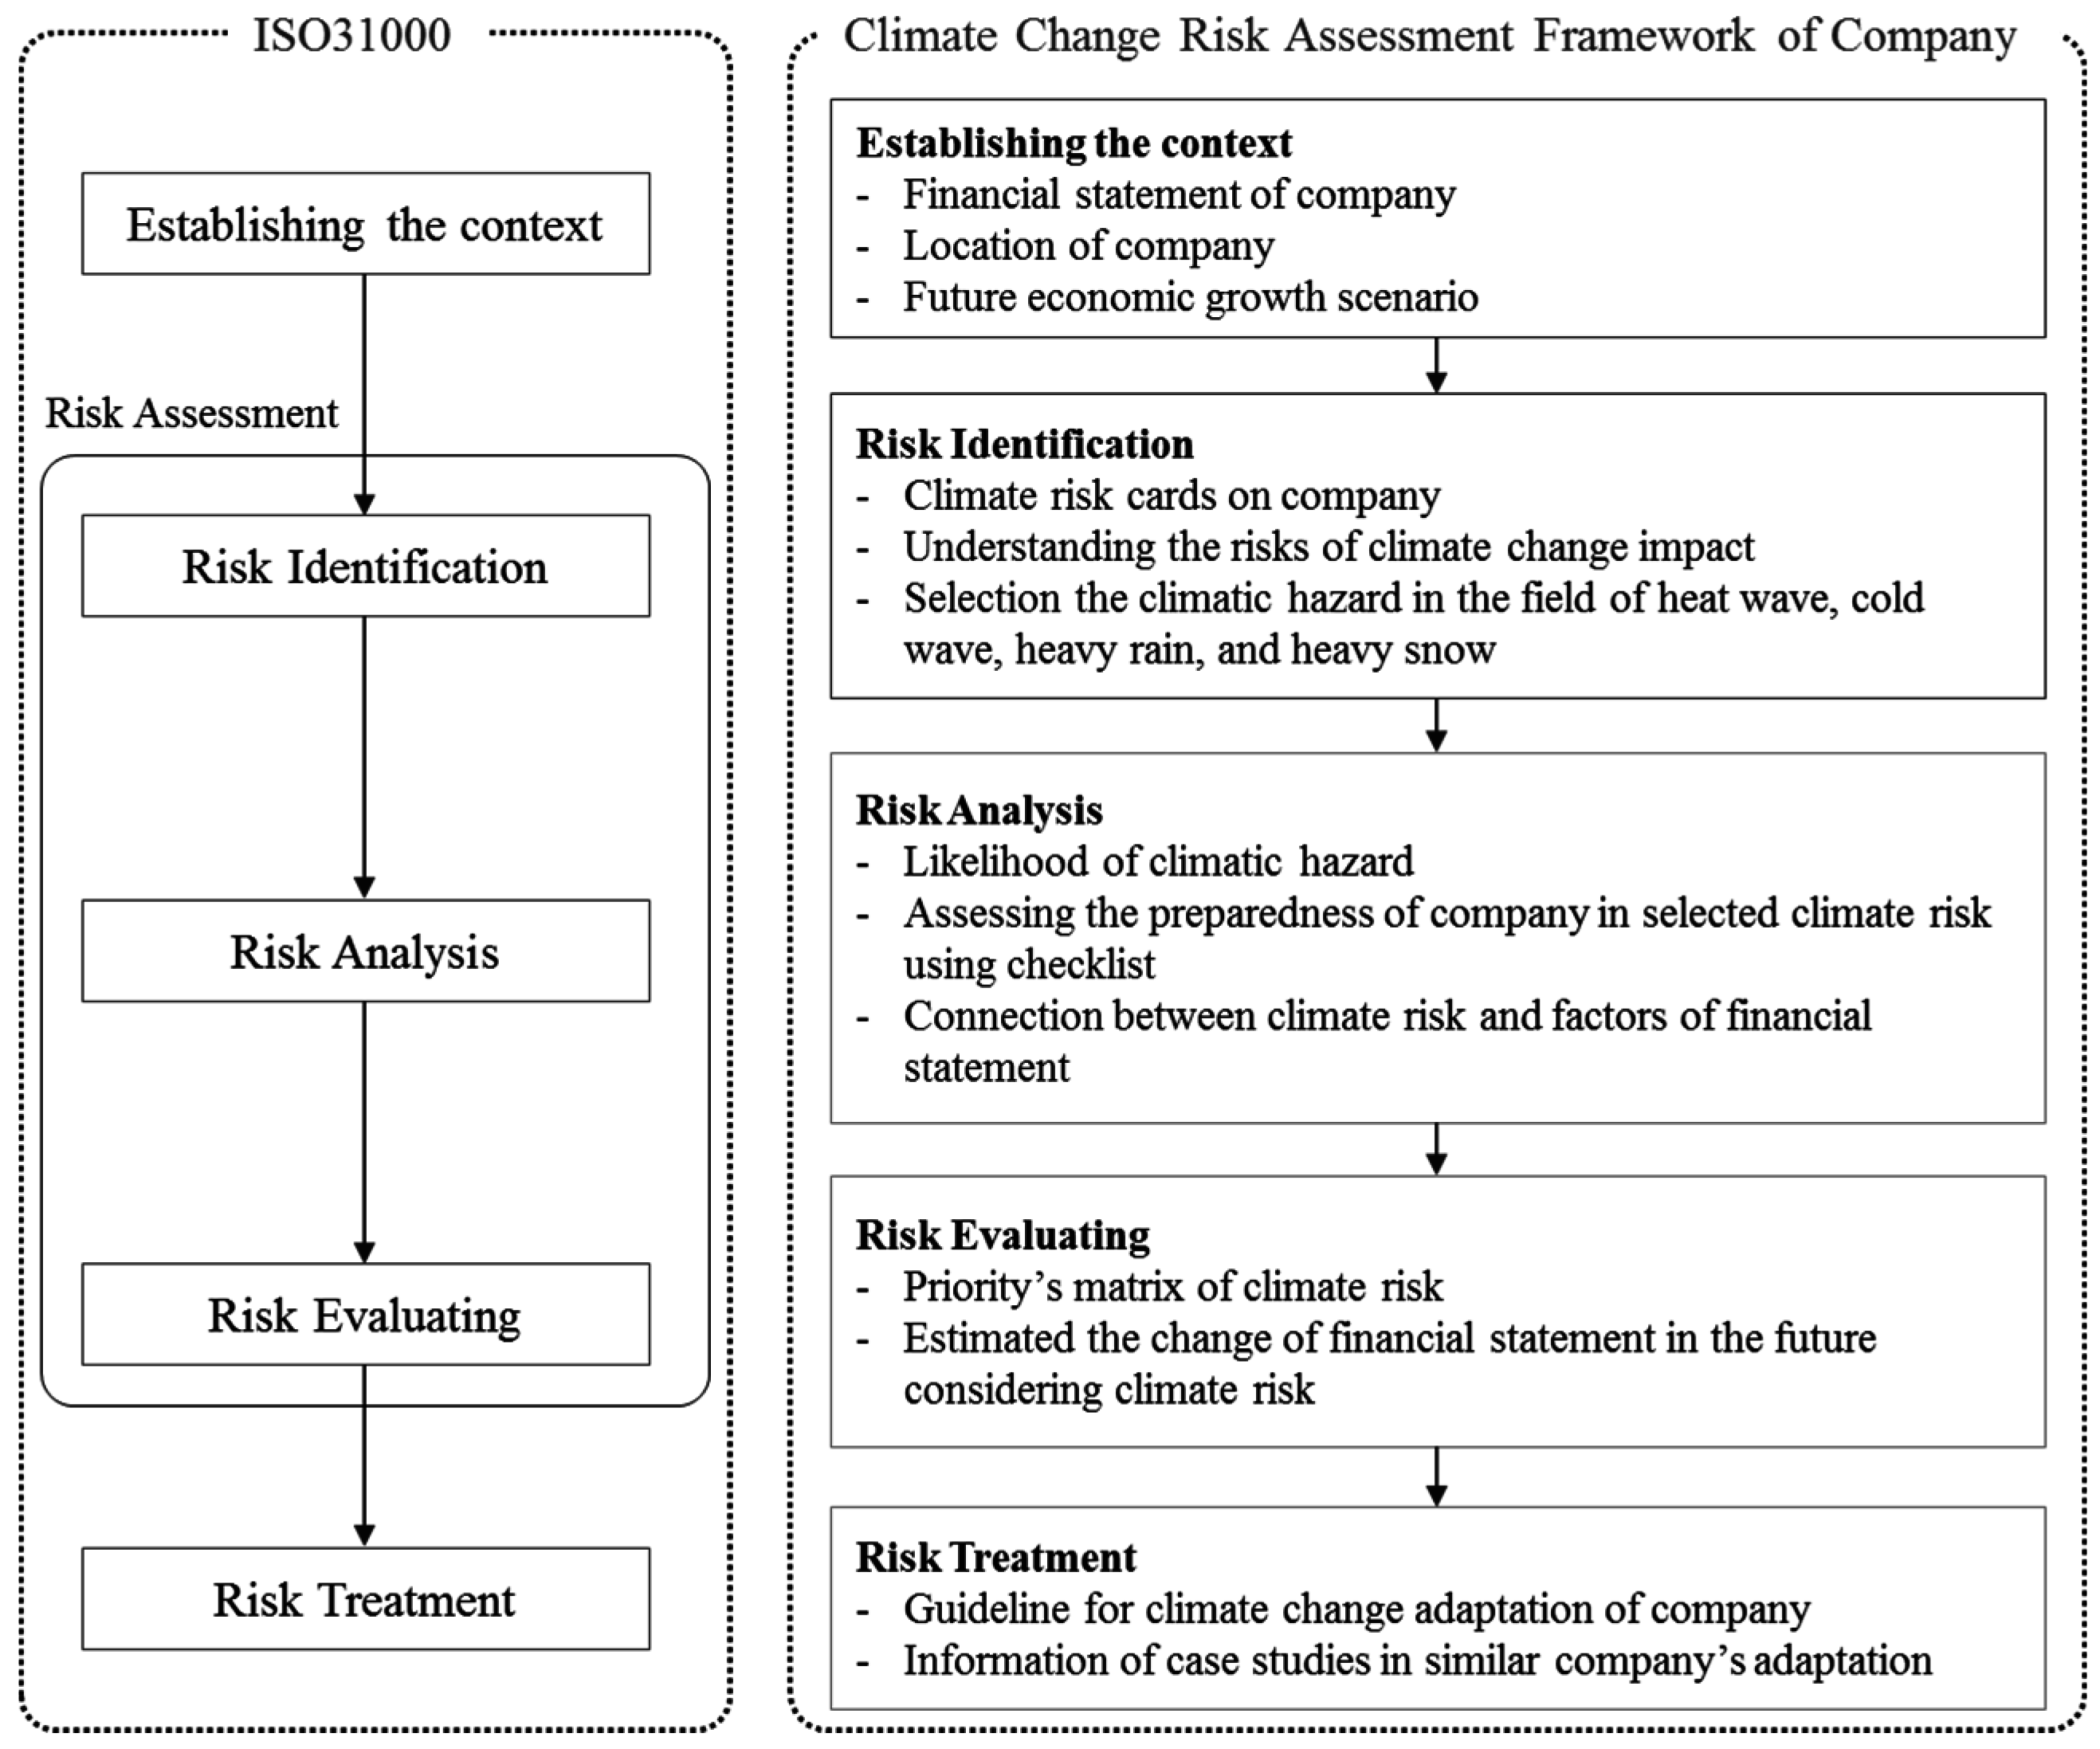
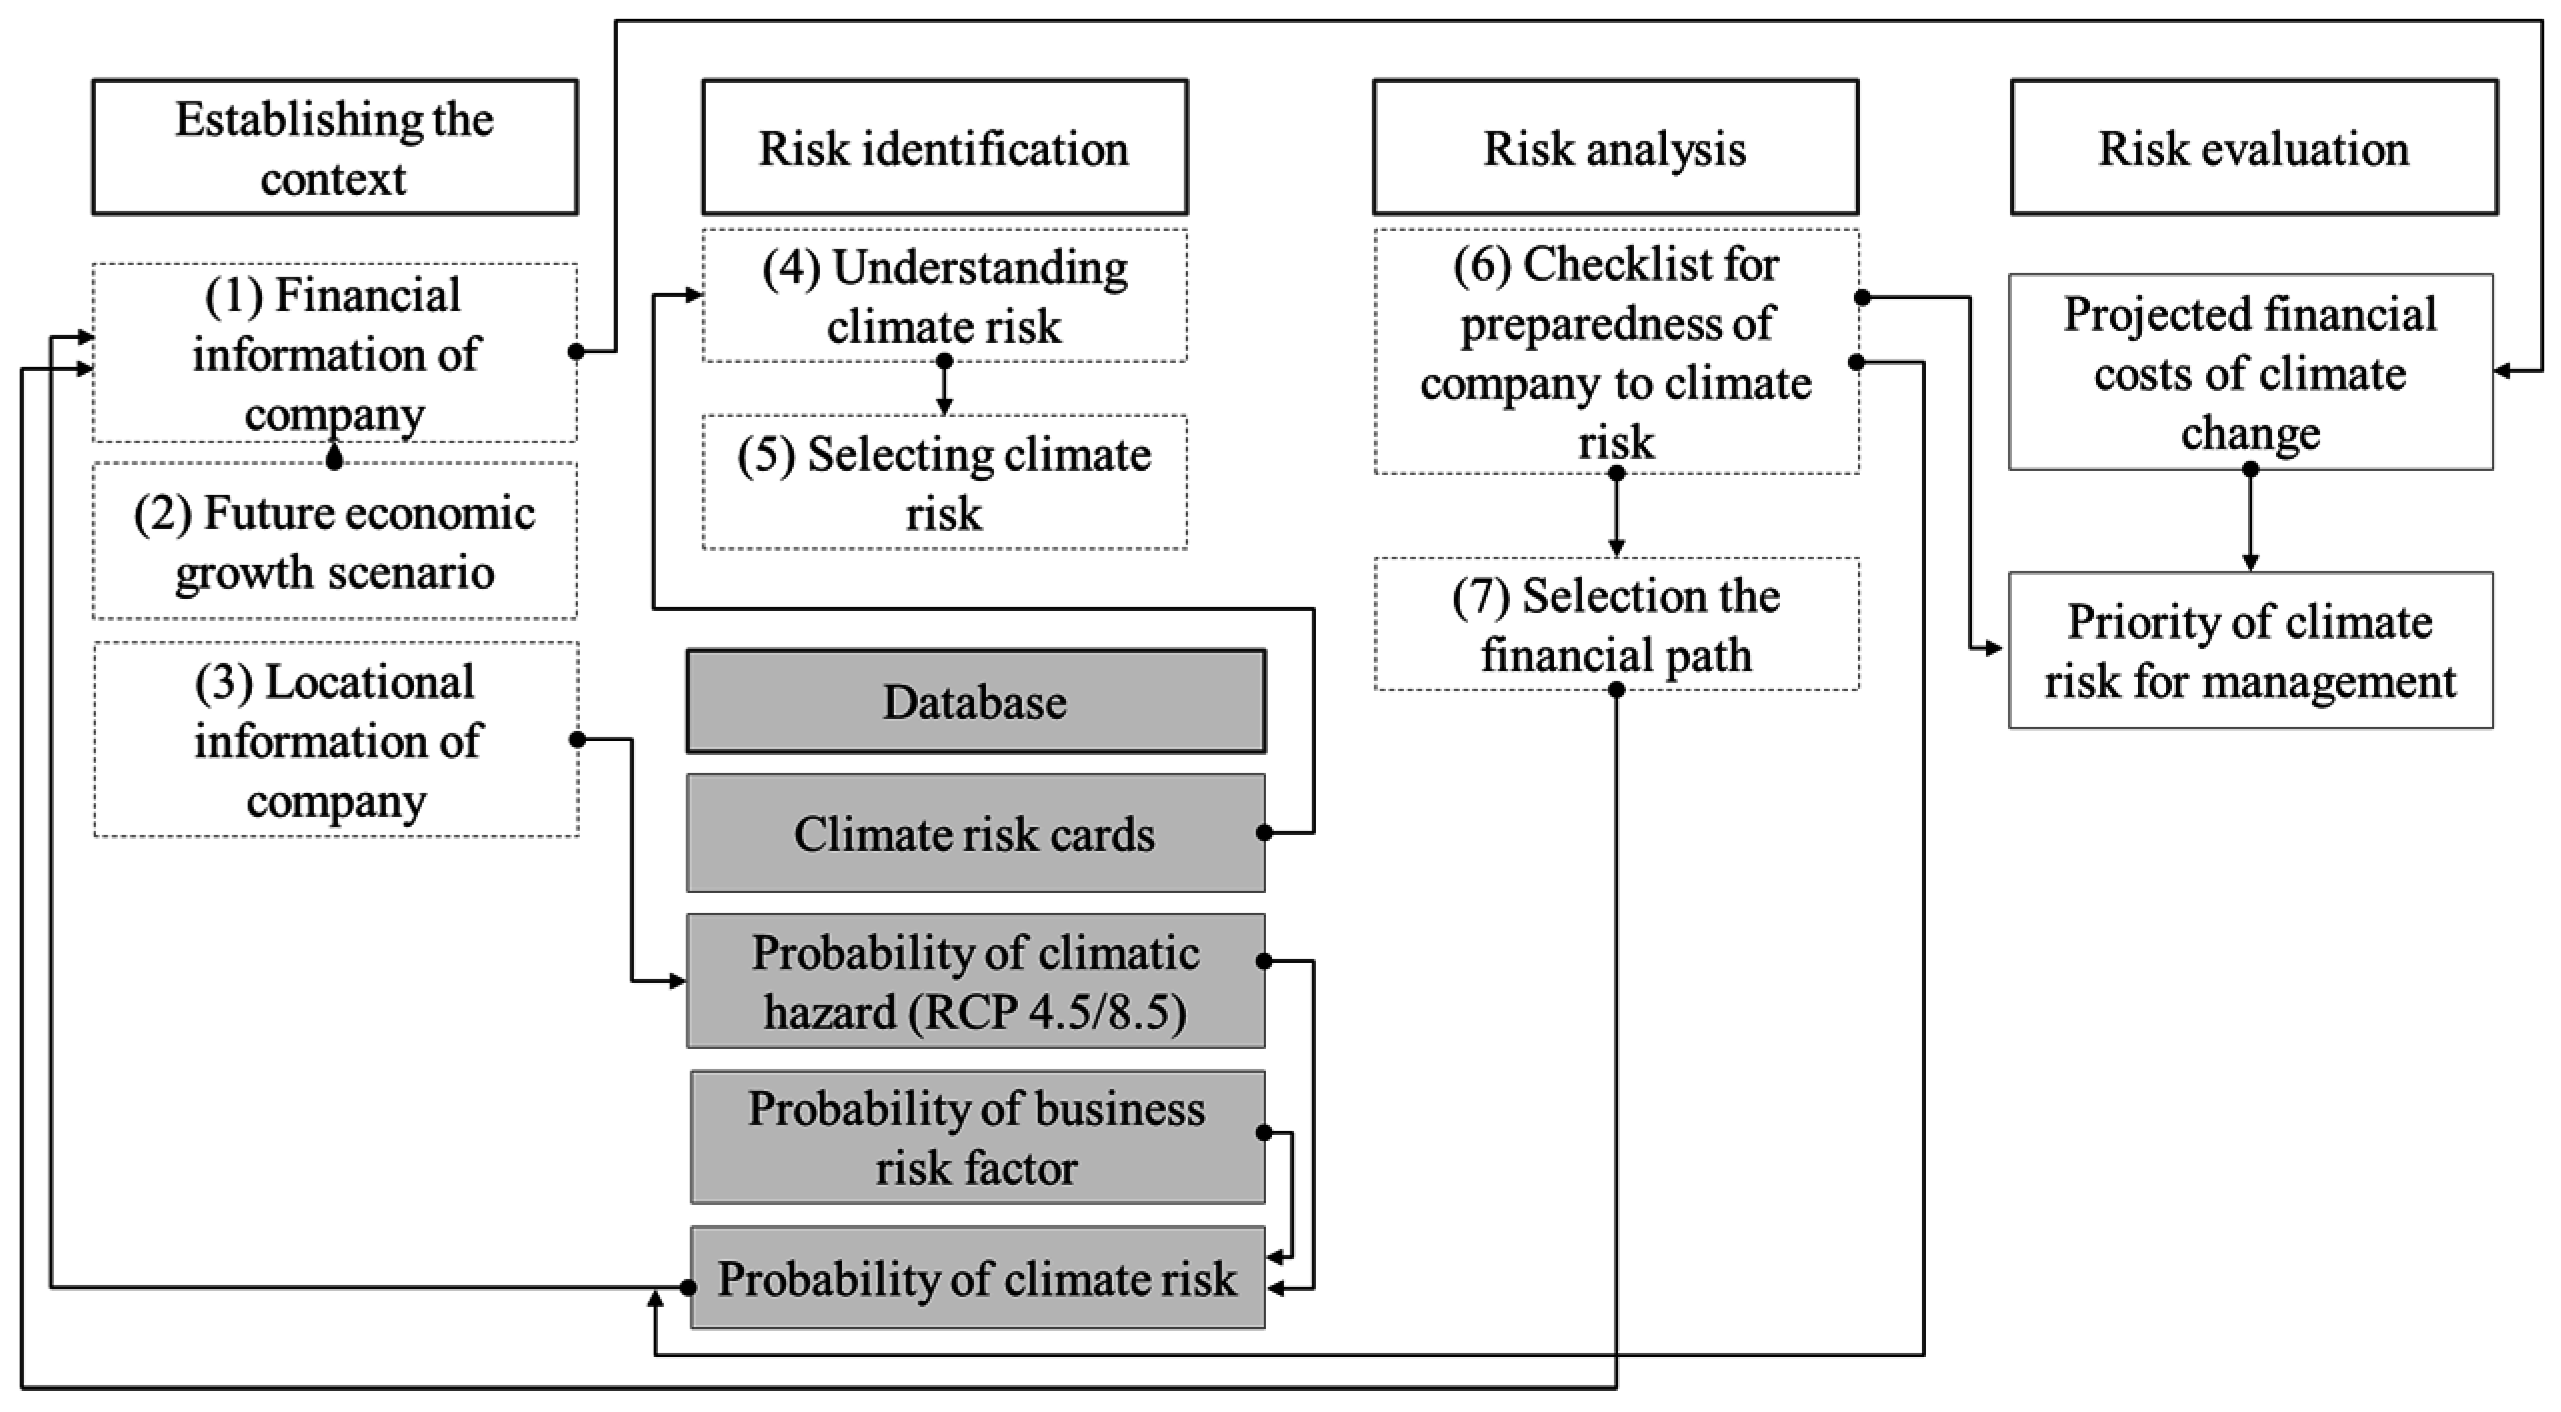
As shown in
Figure 1, the study framework, based on the ISO 31000 process, comprises the following steps: context establishment, risk identification, risk analysis, risk evaluation, and risk treatment. We first identify the context for assessing and managing uncertain future risks related to climate change impact on companies, after which we conduct the assessment process including analysis and evaluation.
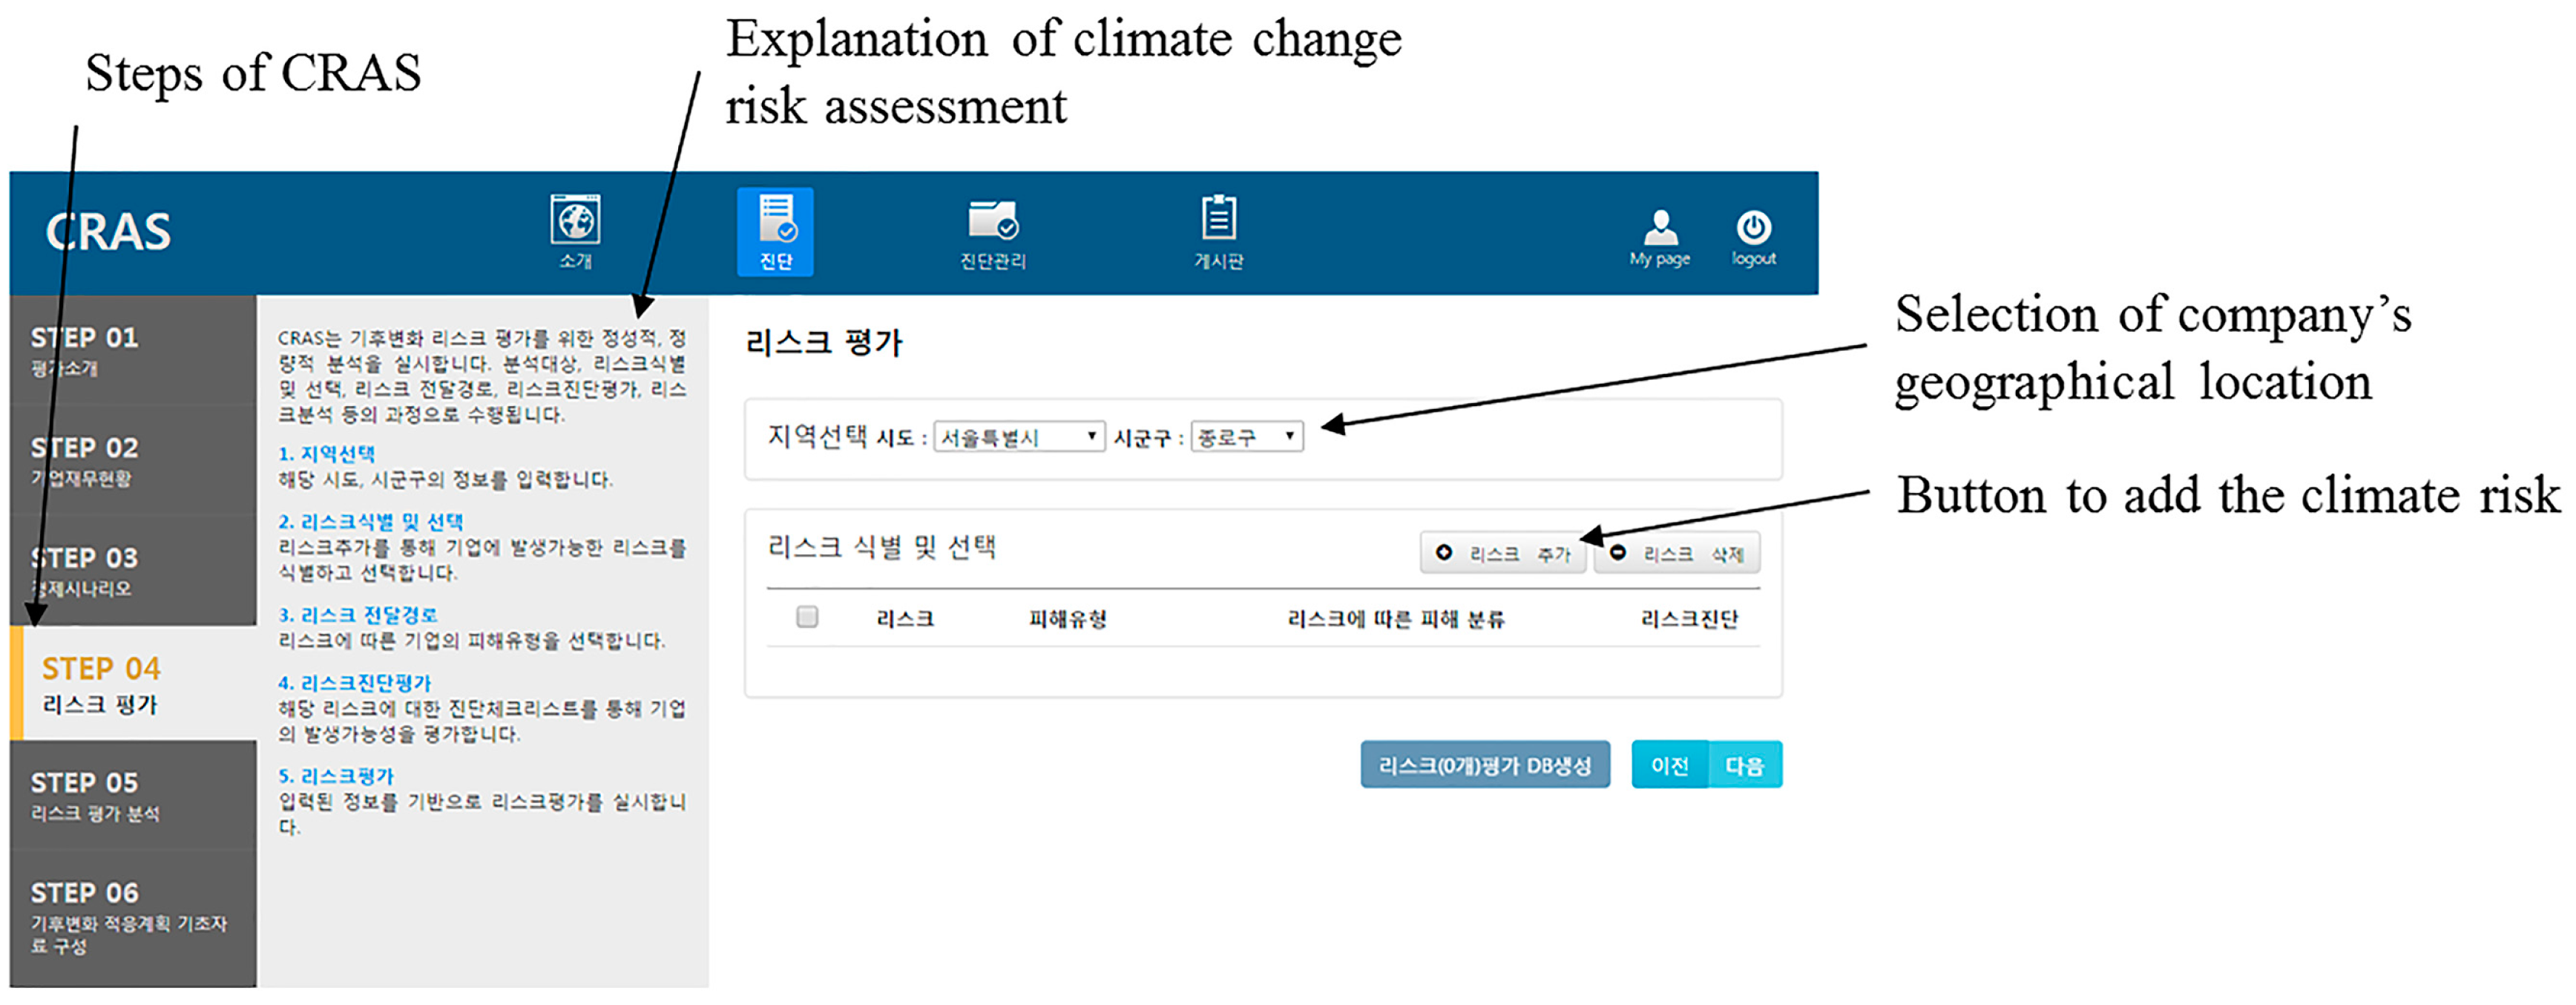
In the first stage—establishing the context—we configure data that become the foundation for estimating the changes in the companies due to climate change. Financial statements, which are used to identify the status of the company, are used as the base data. Financial statements reveal a variety of activities related to the operations of a company, and through these, we can gather information such as company assets, revenues, and liabilities. Since a financial statement reveals only the financial performance and condition of the company during a certain time period, however, it is difficult to make forecasts using such data alone. Therefore, economic scenarios are used as basic assumptions for estimating a company’s future financial statements. In addition, the location of the company is set as an input during the assessment to reflect regional differences in climate change.
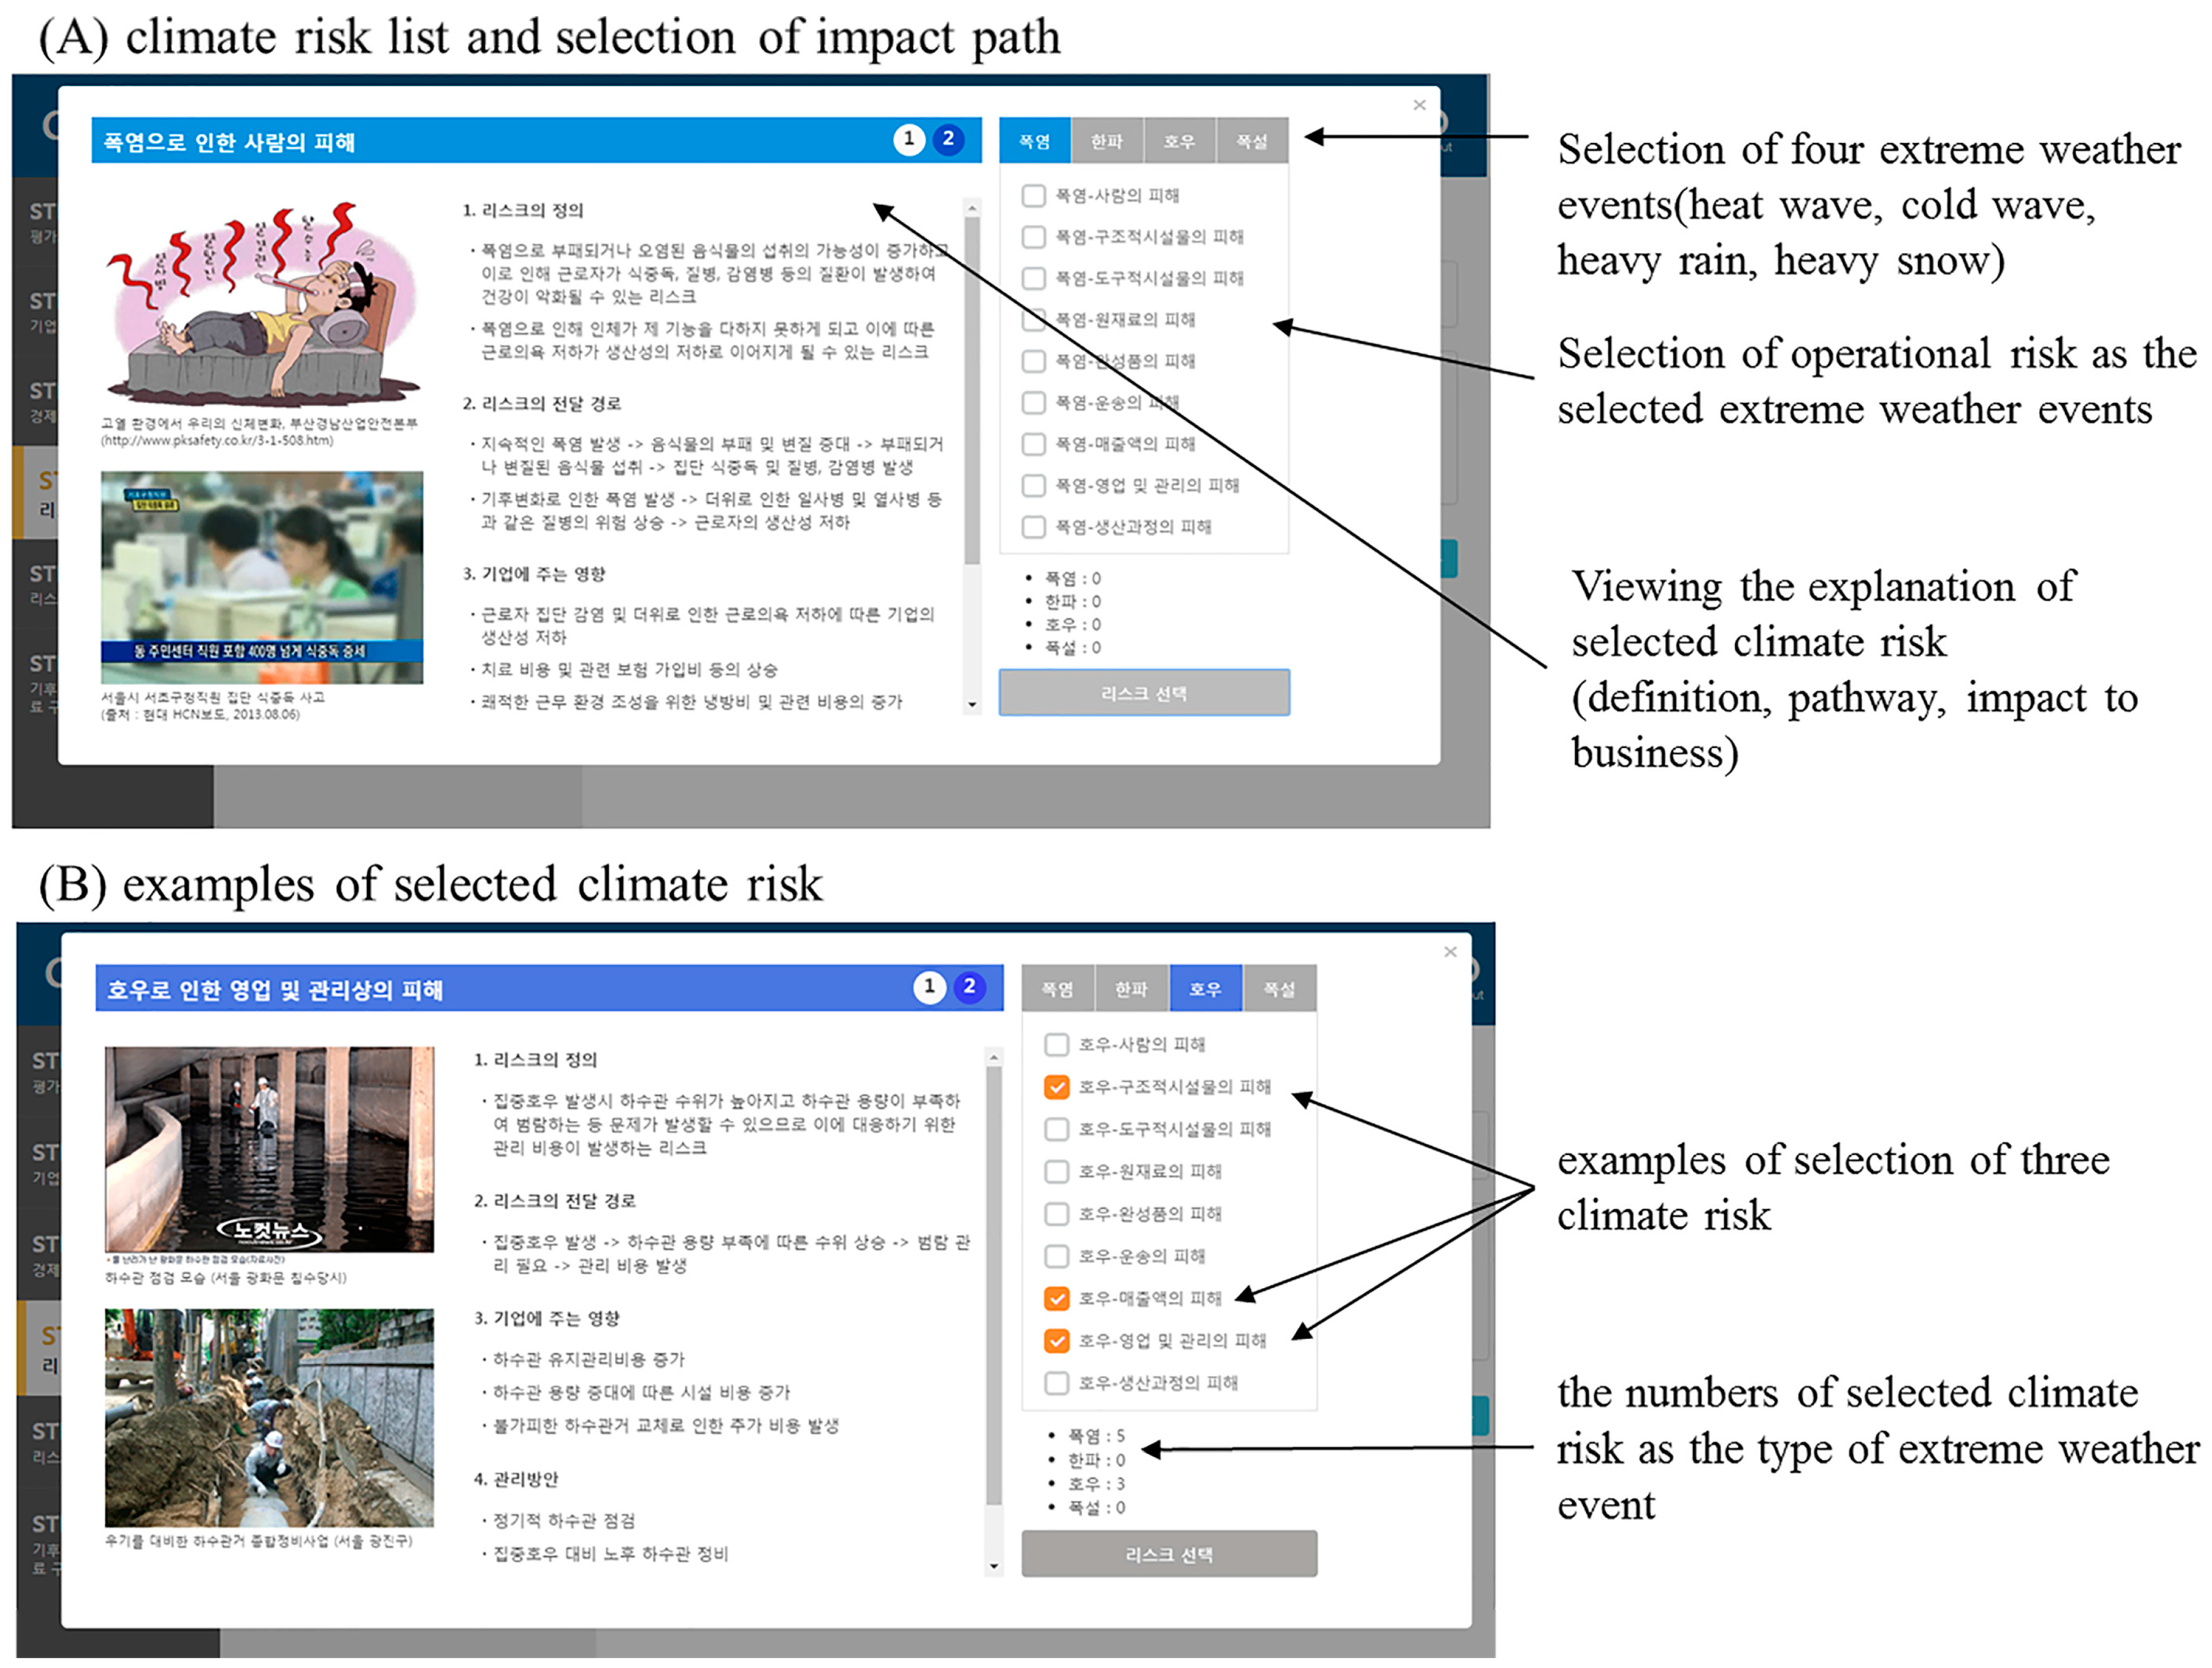
The second stage is risk identification. In this stage, the company can select and categorize its climate risks. A list of 36 climate risks is derived by connecting four types of climatic hazards with nine types of business risk factors; climate risk cards are then created to simplify the presentation.
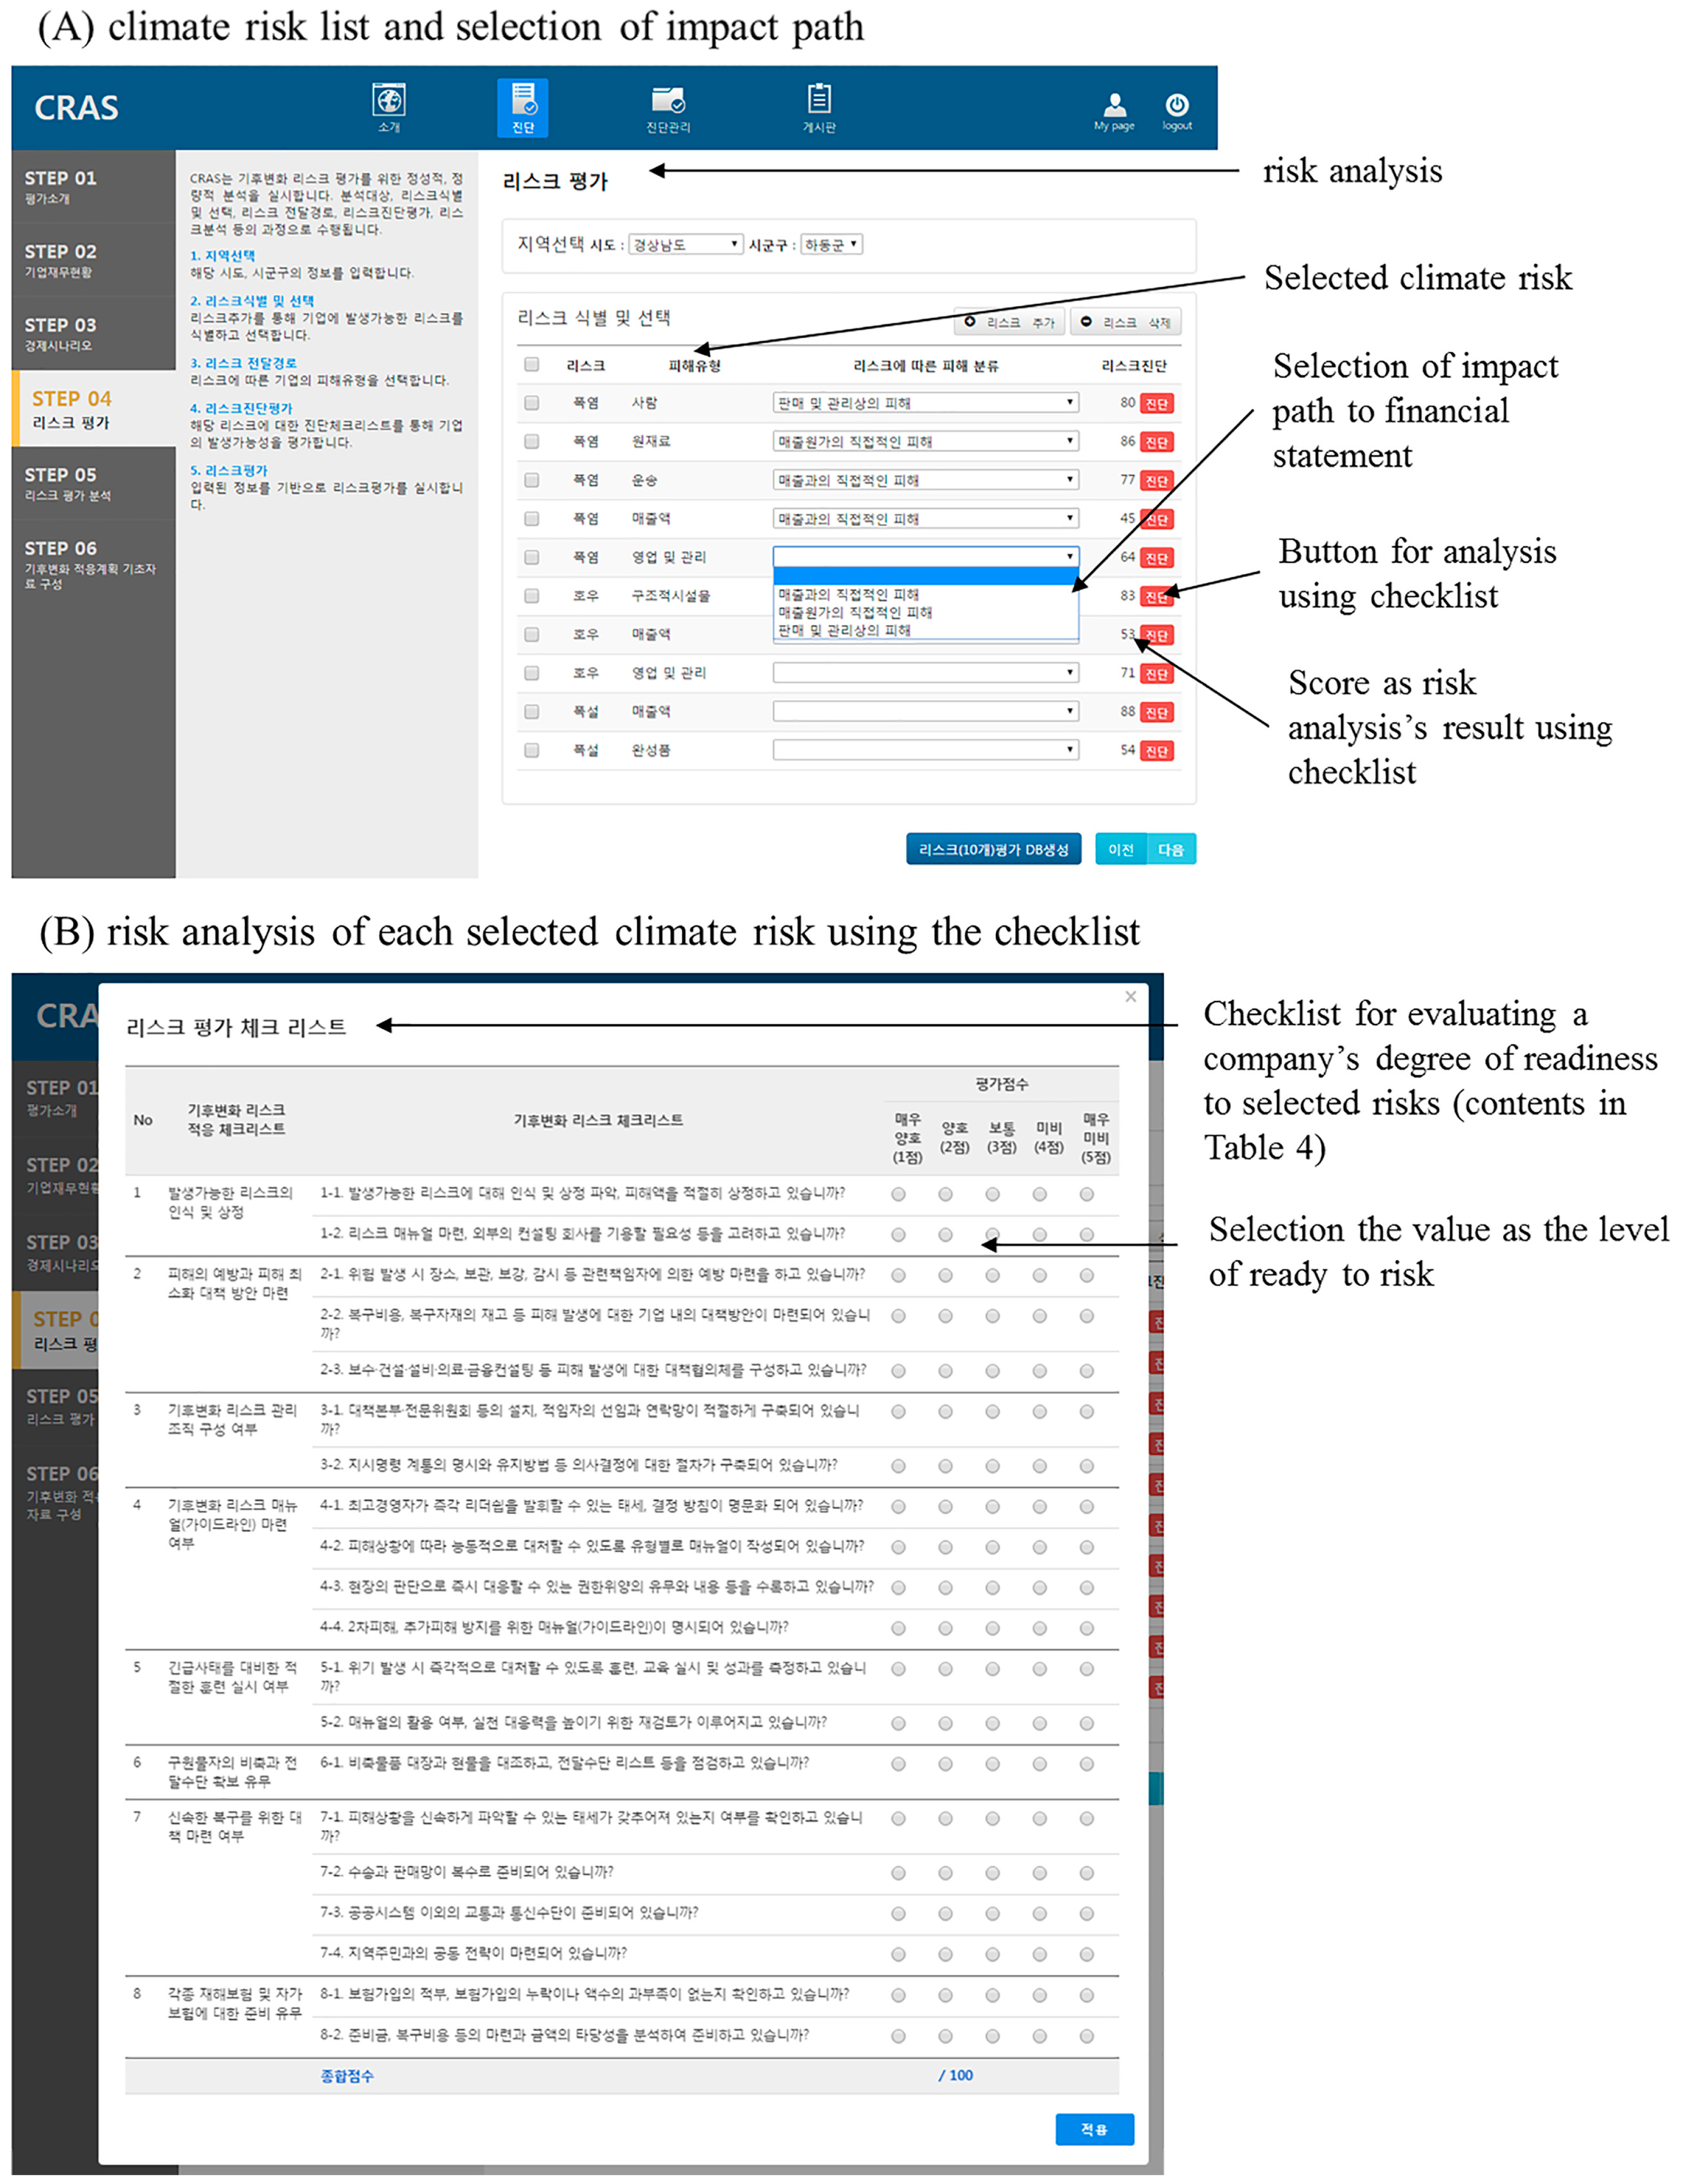
The third stage is risk analysis. In this stage, the probability of climate change impacting the company is configured based on the climate risks selected in the second stage. The probability in this stage is calculated by combining the probability of a climatic hazard occurring in the first place with the probability of a business risk factor negatively affecting the company. Then, this is transformed into a final probability of climate risk on the company, considering the region selected above. Next, by analyzing the degree to which the selected climate risk might occur, the likelihood of climate risk on the company is estimated by using a checklist and calculated based on business risk factors. Lastly, a six-type classification, comprising tangible assets type I (buildings, structures), tangible assets type II (machinery, ships, equipment, etc.), inventories, sales, cost of sales, and selling and administrative expenses, is conducted to identify the connection between the selected climate risk and the financial statement factors collected as basic information.
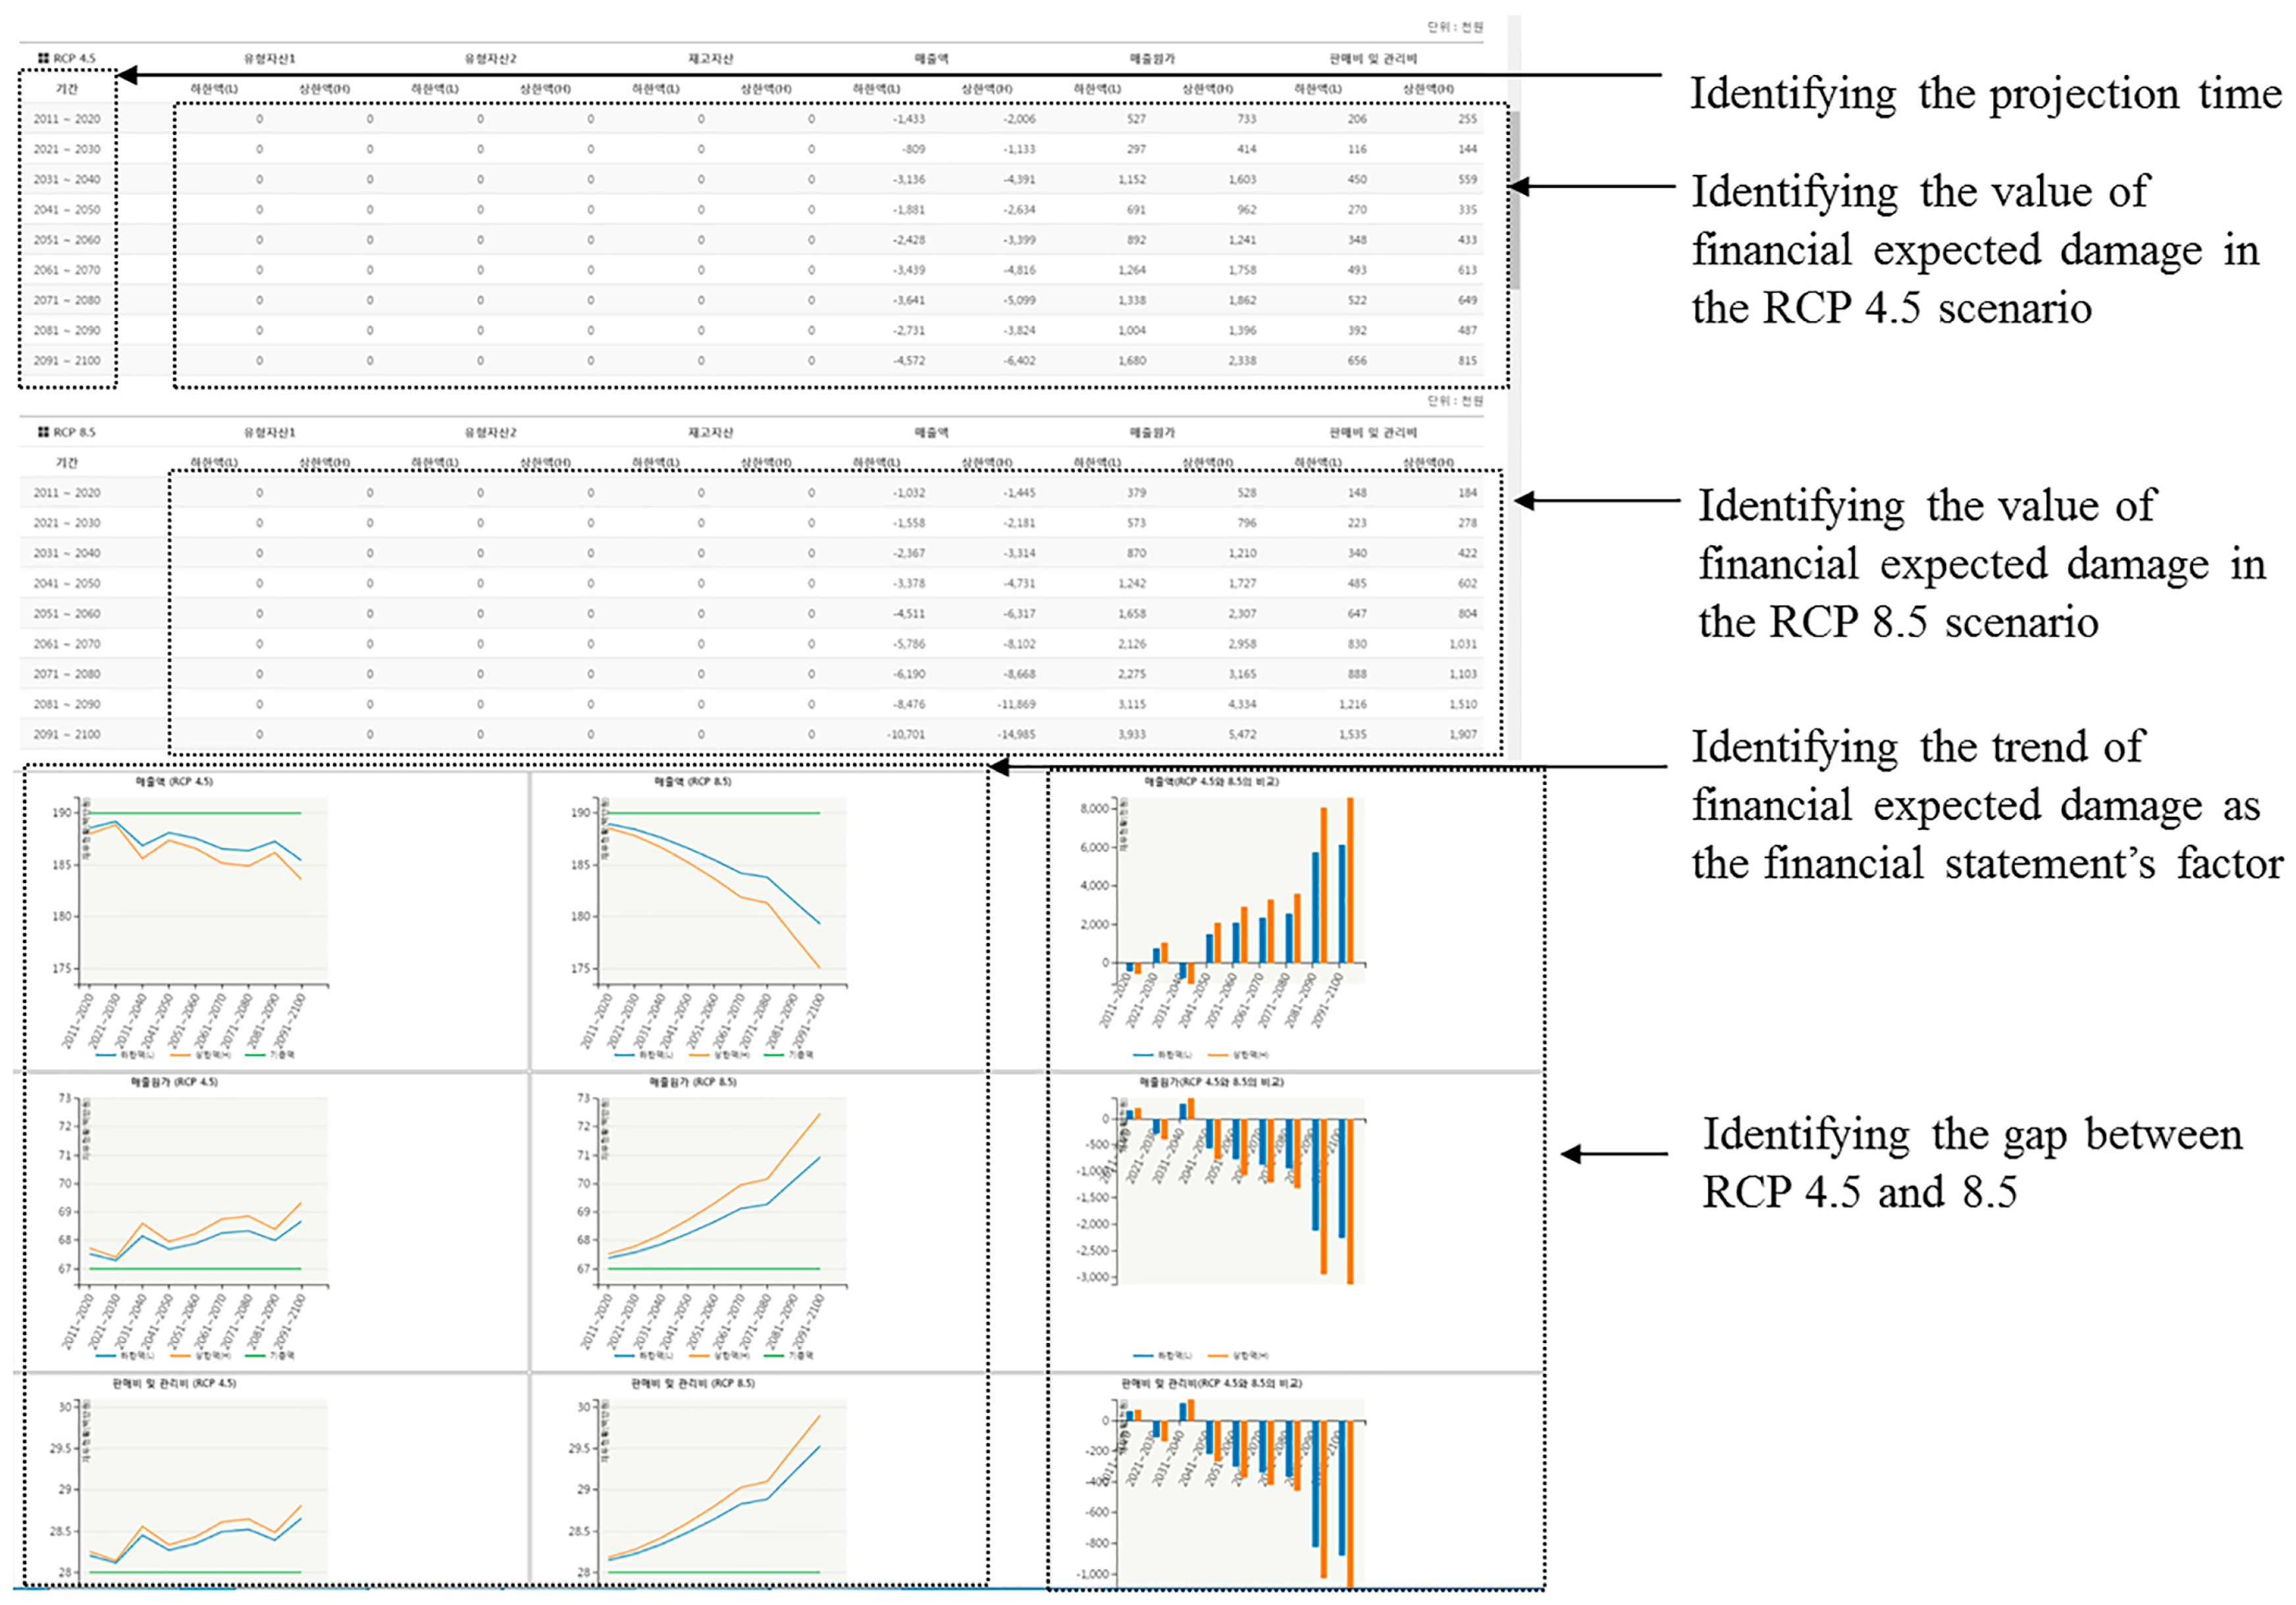
The fourth stage is risk evaluation. In this stage, the priority of climate risk is evaluated and presented based on the results of the ratio of expected consequences from climate risk to the total expected consequences from all related climate risks as well as the likelihood of the impact of climatic hazards on the company. Moreover, the risk analysis results are expressed as an expected value of probability, thereby revealing the trends and values of the financial statement in accordance with a future impact of climatic hazards due to climate change.
The fifth stage is risk treatment. This stage assists the company in establishing strategies for adapting to climate change based on the results of the risk assessment. Here, assistance is provided that may include guidelines for establishing plans using the risk assessment results and information on adaptation case studies in similar companies. However, since the subject of this study is risk assessment, information regarding risk treatment is not covered here.
2.2. Methods for Climate Change Risk Assessment
2.2.1. Risk Identification: Impact Path from Climate Change to Business
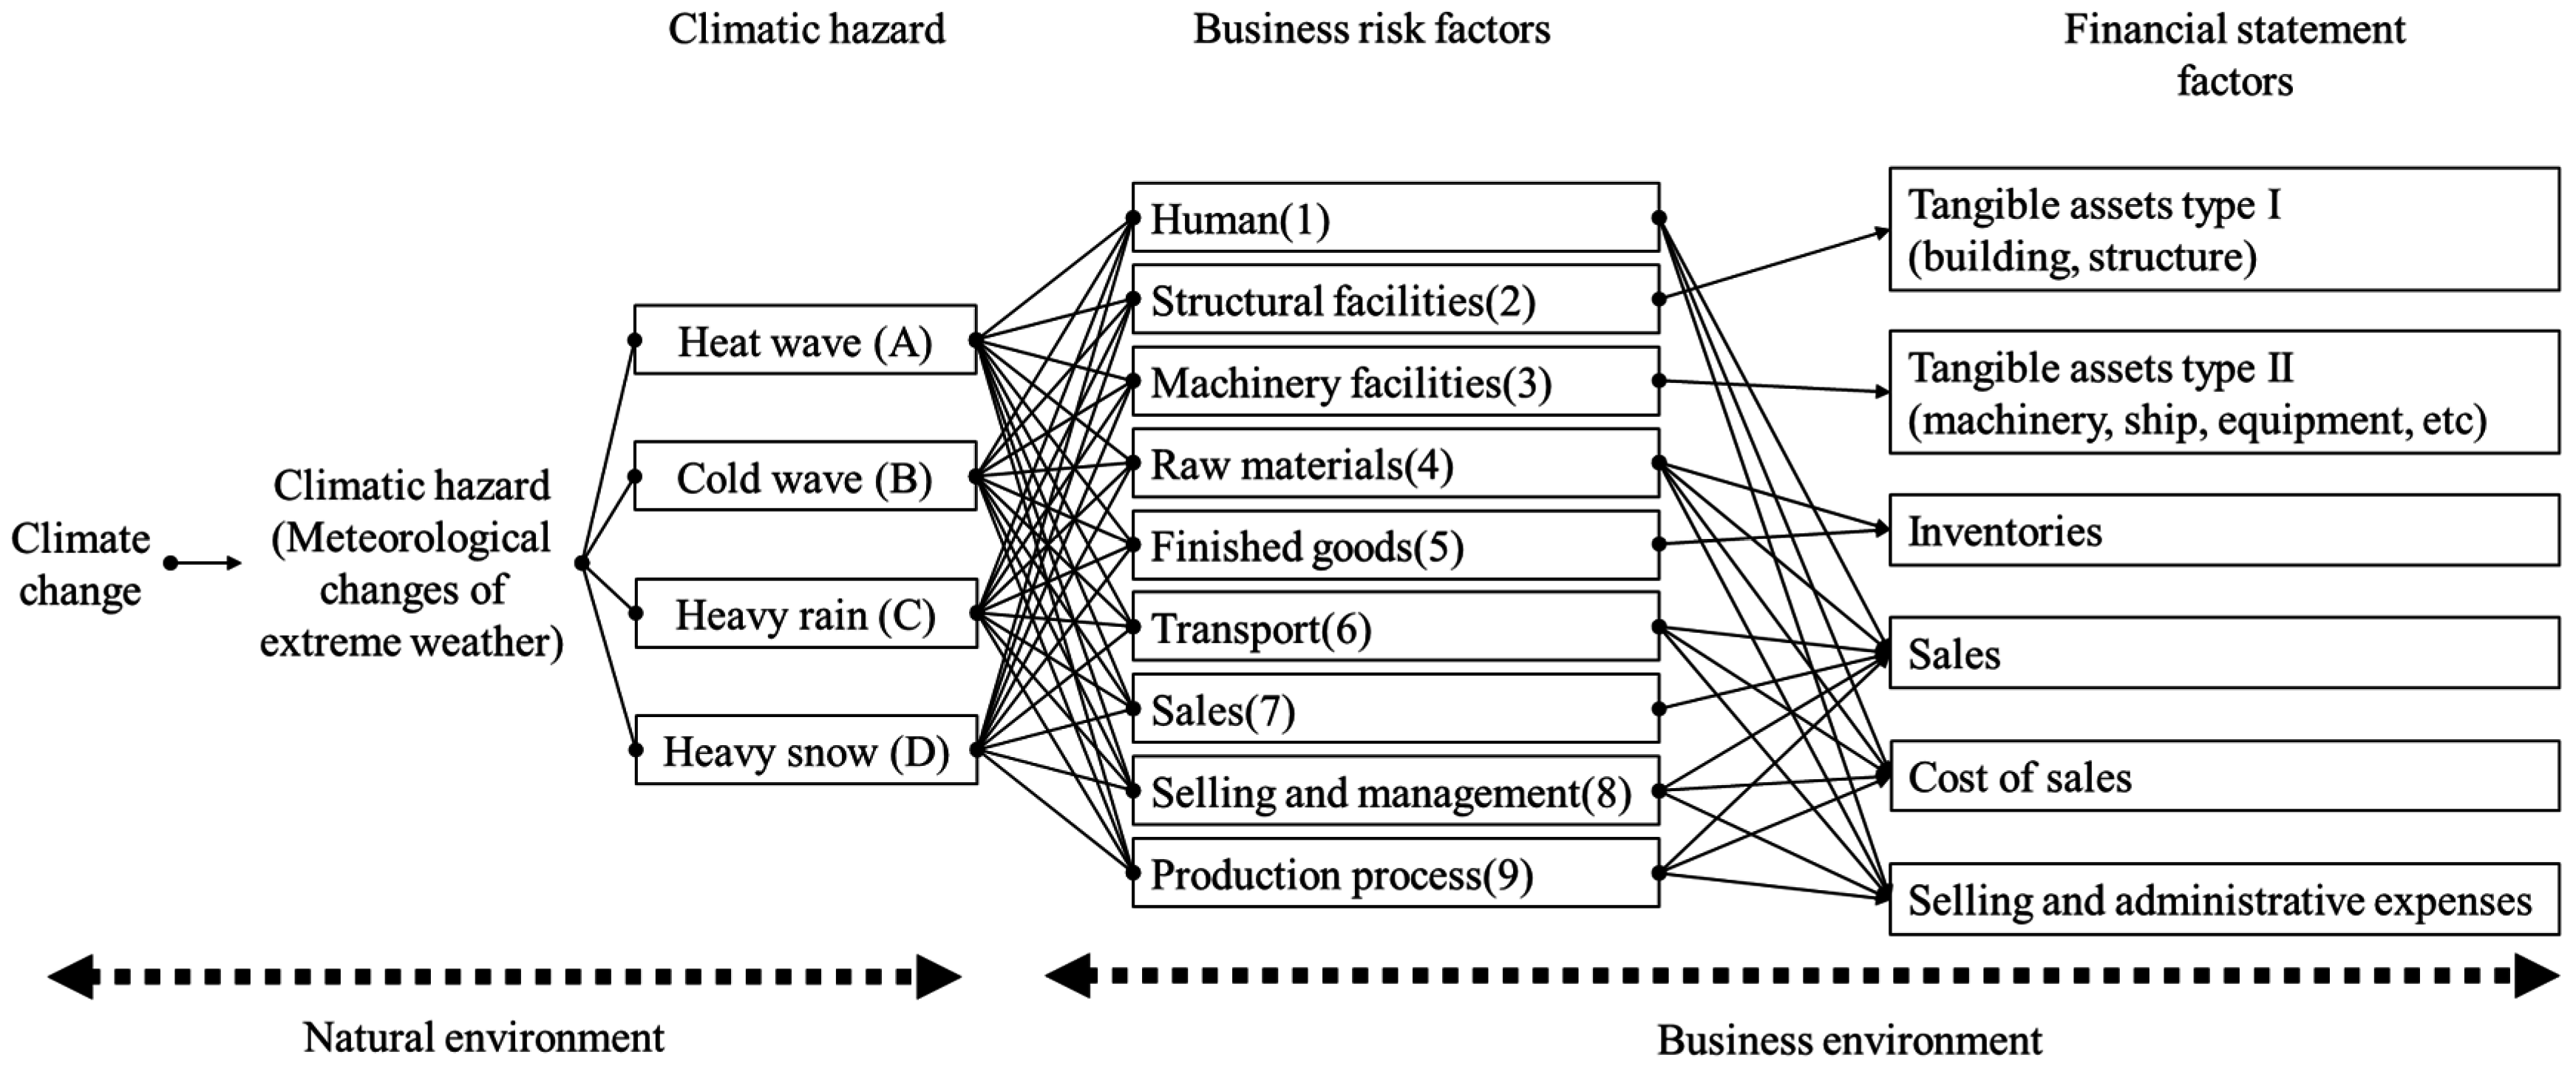
As shown in
Figure 2, the impact of climate change on a company can be divided into changes in the natural environment that occur and the paths where such changes affect business risks. First, the climate change categories liable to affect companies are identified as four climatic hazards: heat waves, cold waves, heavy rain, and heavy snow. Heat waves and heavy rainfall are major extreme weather-related indicators associated with climate change used by the IPCC [
1], while cold waves and heavy snowfall are extreme weather-related phenomena that can significantly impact companies, leading to newly coined words such as “snowmageddon”. Furthermore, in terms of business, these four climatic hazards can help companies easily identify and understand climate risk. Companies consider these four climatic hazards to have relatively important impacts on the climate variable [
39]. However, data limitations also serve as a restriction here. The Korea Meteorological Administration (KMA) provides high-resolution data based on the IPCC’s RCP (representative concentration pathways) 4.5 and 8.5 scenarios. Hence, only data on these four climatic hazards can be used officially and in this study, we do not quantify other climate impacts such as rising sea levels, drought, and extreme wind.
In the next stage, these four climatic hazards are combined with the nine business risk factors (
Figure 2). The physical risks of climatic hazards relate to various factors from a business management perspective [
40]. These include physical structures such as production facilities, buildings, and land as well as assets, which can fluctuate in value or be physically damaged by climatic hazards. Climatic hazards can also cause damage throughout the value chain, from the operation and efficiency of the production process to increased maintenance costs and the quality of raw materials and products [
16]. Accordingly, this research groups the business risk factors that could be affected by climatic hazards into nine categories based on previous research [
16,
41]: human, structural facilities, machinery facilities, raw materials, finished goods, transport, sales, selling and management, and production processes.
Baglee et al. [
41] divided the business factors connected to climate change-related impacts into assets, operations, procurement, and the environment. The assets include physical assets and the workforce; operations include the supply of services, customer demand, and the regulatory environment; procurement includes raw materials, the supply chain, and logistics; and the environment includes both the natural and the built environment including the local community. Sussman and Freed [
16] suggested that the scope of climate-related impacts can be divided into core operations, the value chain, and broader networks. Core operations include physical assets, production processes, and operation and management, while the value chain includes supplies of natural resources and raw materials, labor and changing lifestyles, customers and demand for goods and services, and other inputs into production. In broader networks, public/private electric and water utilities and other infrastructures, customers’ access to products, government-supplied services, and disruptions to supply chains are included. In this study, these factors are selected in relation to the direct physical risk connected to the four climate hazards. Further, the business risk factors connected to the four climate hazards can occur in any business sector.
Thirty-six climate risks to companies were determined in accordance with the four climatic hazards (assigned A–D) and business risk factors (assigned 1–9), resulting in the construction of a risk list (A1–D9). In addition, six financial statement factors were linked to the nine business risk factors to calculate the expected financial statement value, which becomes the basis for decision-making in the risk evaluation. This represents the possible paths through which the 36 climate risks can impact the company’s financial statements.
The relationship between the climate risks and financial statement factors was established through three steps. First, we suggested all the possible connections between the 36 climate risks and six financial statement factors. In the pre-test process used to match the climate risks and financial factors, users found the matching method unable to divide direct and indirect relationships. In some cases, users selected the relationship between the climate risk and financial statement factors that was based on the direct relationship in their company. In other cases, they considered all the relationships between the climate risk and financial statement factors including indirect relations.
Secondly, 81 experts were surveyed. This sample was composed of company managers, and professors and researchers in the business and climate change area. In the survey, these experts selected possible relationships between the climate risk and financial statement factors.
Thirdly, we conducted a brainstorming session with both a financial consultant and a financial risk consultant from KPMG Korea. In this brainstorming process, the consultants suggested the relationships between the climate risk and financial statement factors that should be excluded because they would not hold logically. For example, they said that human-related climate risks were not connected logically to tangible assets. Then, the consultants explained the direction of the financial statement factors that affect the financial statements. In this way, we decided the relationship between the climate risk and financial statement factors.
2.2.2. Risk Analysis: Estimating the Probability of Climatic Hazard
The probability of a climatic hazard, which is an event occurring due to extreme weather caused by climate change, is still difficult to accurately estimate owing to various uncertainties [
42,
43]. Here, the climatic hazards were estimated by first calculating the probabilities of a heat wave, cold wave, heavy rain, and heavy snow occurring in the future due to climate change, and then estimating the probability of a relationship between such events and business risks; after which, the two values were converted into climate risk by combining the two probabilities.
The timeframe for estimating the probability was divided into the climatic hazard and business risk factors. In the former, the probability of the four extreme weather events occurring was based on the IPCC’s climate change scenarios. In the latter, the probability was based on past frequency. Using the probability of climate risk aims to project the future business risk factors relating to the climatic hazards, which assumed that the condition of the business risk factors was unchanged. Hence, the climate change risk assessment tool of this study shows a future projection (a snapshot) based on the assumptions of the present conditions of the company including the timespan of the business risk factors.
First, the probability of a climatic hazard occurring in the future was calculated by using the number of days in a year for which the four extreme weather events occur, in accordance with the IPCC’s climate change scenarios. For example, if heat waves occur for 10 days of the year, then the probability of experiencing heat waves in a given year is 10/365. To be useful for companies establishing an annual business plan, the number of extreme weather days throughout the year that exceed a critical level was set as the possible occurrence of a climatic hazard, as shown in
Table 1. With regard to climatic hazards due to climate change, we used data from the KMA, published in 2012 [
44], which estimated the number of extreme weather days in accordance with the two RCP scenarios, namely RCP 4.5 and RCP 8.5. The weather warnings issued by the KMA during a forecast were used as the criteria for determining an extreme weather event. The frequency of events from 2011 to 2100, in the form of a 10-year arithmetic mean, was then divided into 230 regional units, from which the final probability was derived.
Next, to estimate the probability of a negative impact owing to the four climatic hazards on any of the nine business risk factors, text mining was conducted on past newspaper articles to identify the past frequency of such impacts. The probability was then derived through Bayesian inference, which is a method of statistical inference in which the probability for each unknown parameter is deduced based on past observations and experiments [
45]. For the Bayesian inference in this study, the empirical data required to derive the posterior probability came from newspaper articles because there were no available datasets identifying the relationship between climatic hazard and the business risk factors. The data were collected from 2000 to 2012 through an integrated article search in the Korean Integrated News Database System, officially provided by the Korea Press Foundation. The number of selected newspaper articles per business operation was as follows: 344 heat waves, 284 cold waves, 1002 heavy rainfall, and 714 heavy snowfall.
Only the newspaper articles that contained incidents related to the business risk factors were used. When several newspaper articles covered an identical event, only the article with the most detail was selected; moreover, only articles that clearly described the causal relationship between the four climatic hazards and any business risk factors were used. Any material related to the losses of the general community was excluded.
Further, news articles related to the general community as well as repeated news on the same incident were excluded. If a news article contained both the community and facts related to the business risk factors, only the latter were included. If multiple risk factors were reported by different articles on a climatic hazard that occurred on the same day, they were included independently. In addition, if an article contained more than one business risk factor, each factor was singled out as an independent incident and processed. When including many business risk factors, any overlapping parts in different articles, each having partial accounts of the same event, were excluded. Therefore, each incident was composed as an exclusive independent event to form the basic database.
Each climatic hazard shown in
Table 2 has a single business risk factor, and the total number of events for each business risk factor is the same as the number of total climatic hazard events. Since it is assumed that each risk occurs independently to evaluate the risk, the cases where the corresponding risk factor occurs and where it does not occur are separated. Then, the no occurrence case represented the total added value of the number of all cases except the corresponding risk factor.
Korea has four distinct seasons with events related to the four climatic risks occurring in each season. Hence, it was possible to obtain a relatively large number of cases. Theoretically, all possible events related to each risk must be reported to separate occurrence and no occurrence cases. However, since not every case was reported by the media, separating them was impossible in reality. Therefore, this research deduced the possibility that the relevant business risk factors occurred independently of one another. In other words, the occurrence possibility of the relevant business risk factor in a situation where any damage related to the climate risk chosen is possible was configured as the probability.
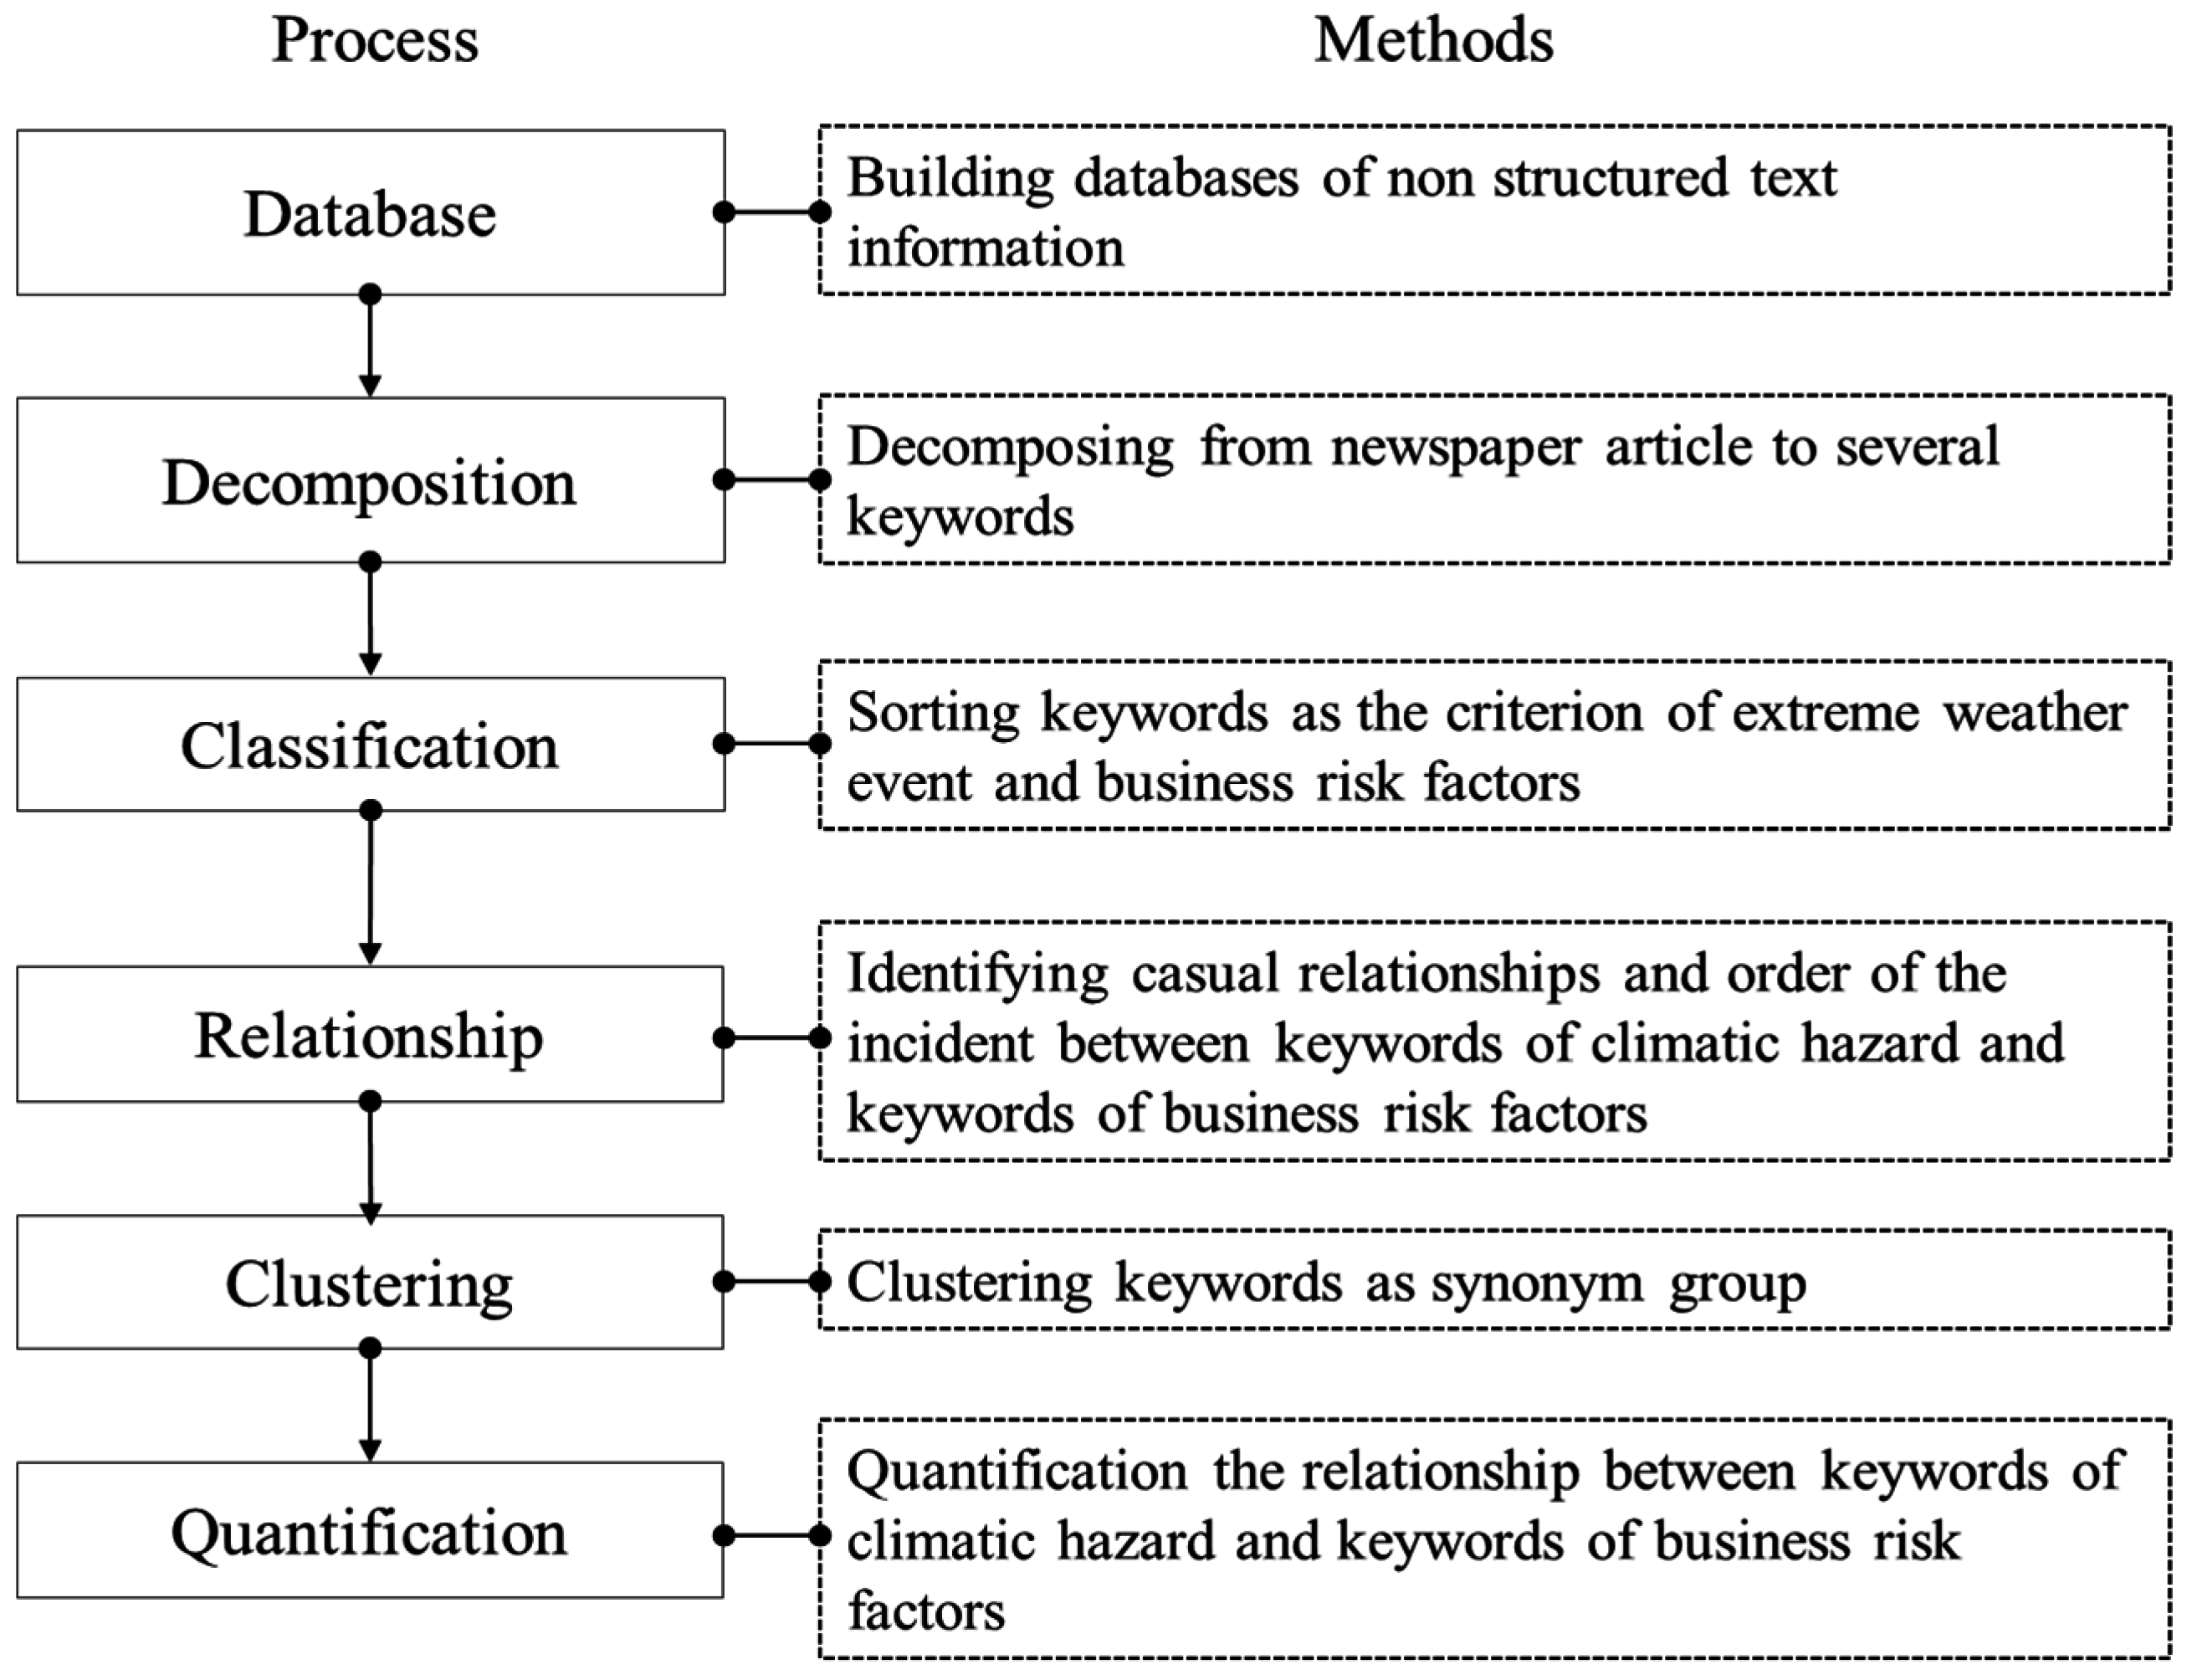
The data were collected in the form of text, and thus, text structuring and keyword clustering were performed to identify the relationships between the four climatic hazards and nine business risk factors, as shown in
Figure 3. To analyze the descriptive statements in the newspaper articles, the words within the sentences were categorized into events, time, effects, and causes related to climatic hazards. Text structuring was conducted by setting rules for the relationships between the words in a sentence as precedence and causal relationships, and the terms related to the four climatic hazards and nine business risk factors were categorized for the analysis. A single database was derived by clustering words similar to the keywords, and this was quantified accordingly. The damage frequency relationship between the climatic hazard and a business risk factor was then derived, as shown in
Table 2.
The probability distribution of the effects on the business risk factors due to climatic hazards collected via text mining was then calculated through Bayesian inference. A uniform beta distribution was assumed for the prior distribution, and the posterior distribution was derived according to the likelihood of the occurrence frequency. For the prior probability distribution, to utilize the conjugate distributions of the binomial distribution, a non-informative method was applied.
2.2.3. Drawing the Climate Risk and Integrating with Financial Statement Factors
The climate risks derived above were divided into two categories: the possibility of the four climatic hazards occurring within the year due to the future intensification of climate change and the possibility of negative effects on business risk factors due to the climatic hazard. Climate risks were represented as the probability values of annual occurrence, while the business risk factors took the form of a probability distribution. We obtained the final probability of the corresponding risk by combining the two values in a three-step process.
The first step was to evaluate the extent to which the selected risk could occur in the company. The probability distribution of the business risk factor derived by using the results of text mining represented general probabilities—that is, they did not reflect the potential impact of the evaluated company. The impact of a particular risk may change according to the degree to which the company is prepared for the selected risk. This risk extent was evaluated by adopting 20 checklists, each of which used a five-point scale (1 = highly adequate, 5 = highly inadequate). In other words, the most prepared company would score 20 points and the least prepared would score 100 points. Hence, by evaluating how much a company is affected by taking the probability distribution of the business risk factor derived from the test mining result as a prior distribution, as the occurrence likelihood, the boundary values of a 95% confidence interval were derived with Bayesian estimation. For all the possible values between 20 and 100 for every business risk factor, a 95% confidence interval was then computed to form the database. In this research, equal-tail posterior density was used as the confidence interval for simplicity.
The second stage was to classify the occurrence values of the climate risks. The future forecast values provided by the KMA offer different values for the RCP 4.5 and RCP 8.5 scenarios for 230 regional units. The risk-assessed company is affected based on different climate risks depending on where it is geographically located. Hence, the values of the four climatic hazards in each scenario were categorized into 230 regional units to form the database.
The third stage was to derive a single final probability value from the database created from the first and second stages. For example, we determined the value of the impact of workers when a heat wave occurs in the future depending on the preparation level of the company. This means obtaining a probability of the first and second stages occurring at the same time, which can be calculated by multiplying the two probabilities. This multiplied number represents the lower bound and upper bound of a 95% confidence level. Finally, this is multiplied by the financial statement factor to produce the expected value of the loss. The database created in the third stage was thus composed of the probabilities that can be multiplied by the expected value in consideration of all the possible numbers that a company can choose during an evaluation.
As shown in
Figure 2, this database connected with the financial statement factors estimates the amount of financial damage that companies will incur due to future climatic hazards. Financial statements have been used as the basic data in other risk assessment studies related to company damage [
46] because they present objective data produced by companies, and information relevant to business operations and activities can be examined in these statements [
47]. The relationship between the financial statement factor and business risk factors is shown in
Table 3.
We used two types of financial statements: the balance sheet and the income statement. The former has two categories, tangible assets and inventories, and the latter includes sales, cost of sales, and selling and administrative expenses. Here, the relationship is set as either negative or positive based on whether it has an adverse financial impact. Positive (negative) here refers to a case when an increase (decrease) in the values of the corresponding financial statement is a loss from the company’s perspective. For example, a positive increase in cost and negative reduction in assets can bring about adverse financial impacts on a company. Land assets and construction in process, which correspond to the detailed indicators of tangible financial assets, are recorded by converting these values into currency. However, in reality, as the values of such assets do not vary, nor do their inherent characteristics deteriorate due to risk, these assets were excluded.
2.2.4. Checklist for Assessing Each Climate Risk
As noted earlier, 36 possible climate risks were considered in this study, derived by combining the four climatic hazards and nine business risk factors. For the change in the natural environment to affect the company’s strategic decision-making, information on its readiness could considered in the climate change risk assessment, along with scientific data on the selected risk. This can be evaluated by determining the preparedness of the company for the selected risks.
In this study, a checklist was provided to verify the degree of preparedness for a climate risk, as shown in
Table 4, and this was integrated into the climate change risk assessment process. The result was a set of preparedness scores that determine the level of impact the company would experience from the corresponding risk, and this result reflects the likelihood of climate risk.
2.2.5. Risk Evaluation
Finally, climate risk was evaluated by estimating the amount of financial damage that the company’s business risks would incur due to climatic hazards. The priority level of the climate risk in the future was also evaluated.
The data established through the probabilistic approach in relation to climatic hazards and business risk factors were connected with the configured financial factors, and the damage was estimated through the concept of expected value, as shown in Equation (1). Since no studies have adopted methods for forecasting damage to companies from climate change, the concept of expected value was used, as this is the basic method of estimating possible damage:
where
i refers to the type of climate risk (36 risks in total),
n refers to the financial statement factor chosen by the company towards
i risk, and
x refers to the category value of the financial statement connected to the financial statement factor (this value can vary with the economic scenario). Assuming year
y for the estimation has the same condition as the present, the same present values are used; on the contrary, assuming changes take place according to the economic scenario, the values multiplied by the elasticity category in
Table 5 are used.
j refers to the location the company has chosen,
k is the type of RCP scenario, and
y is the year to be estimated. This equation is for one climate risk
i and the final forecast of a company is the sum of each
i value for each financial statement item.
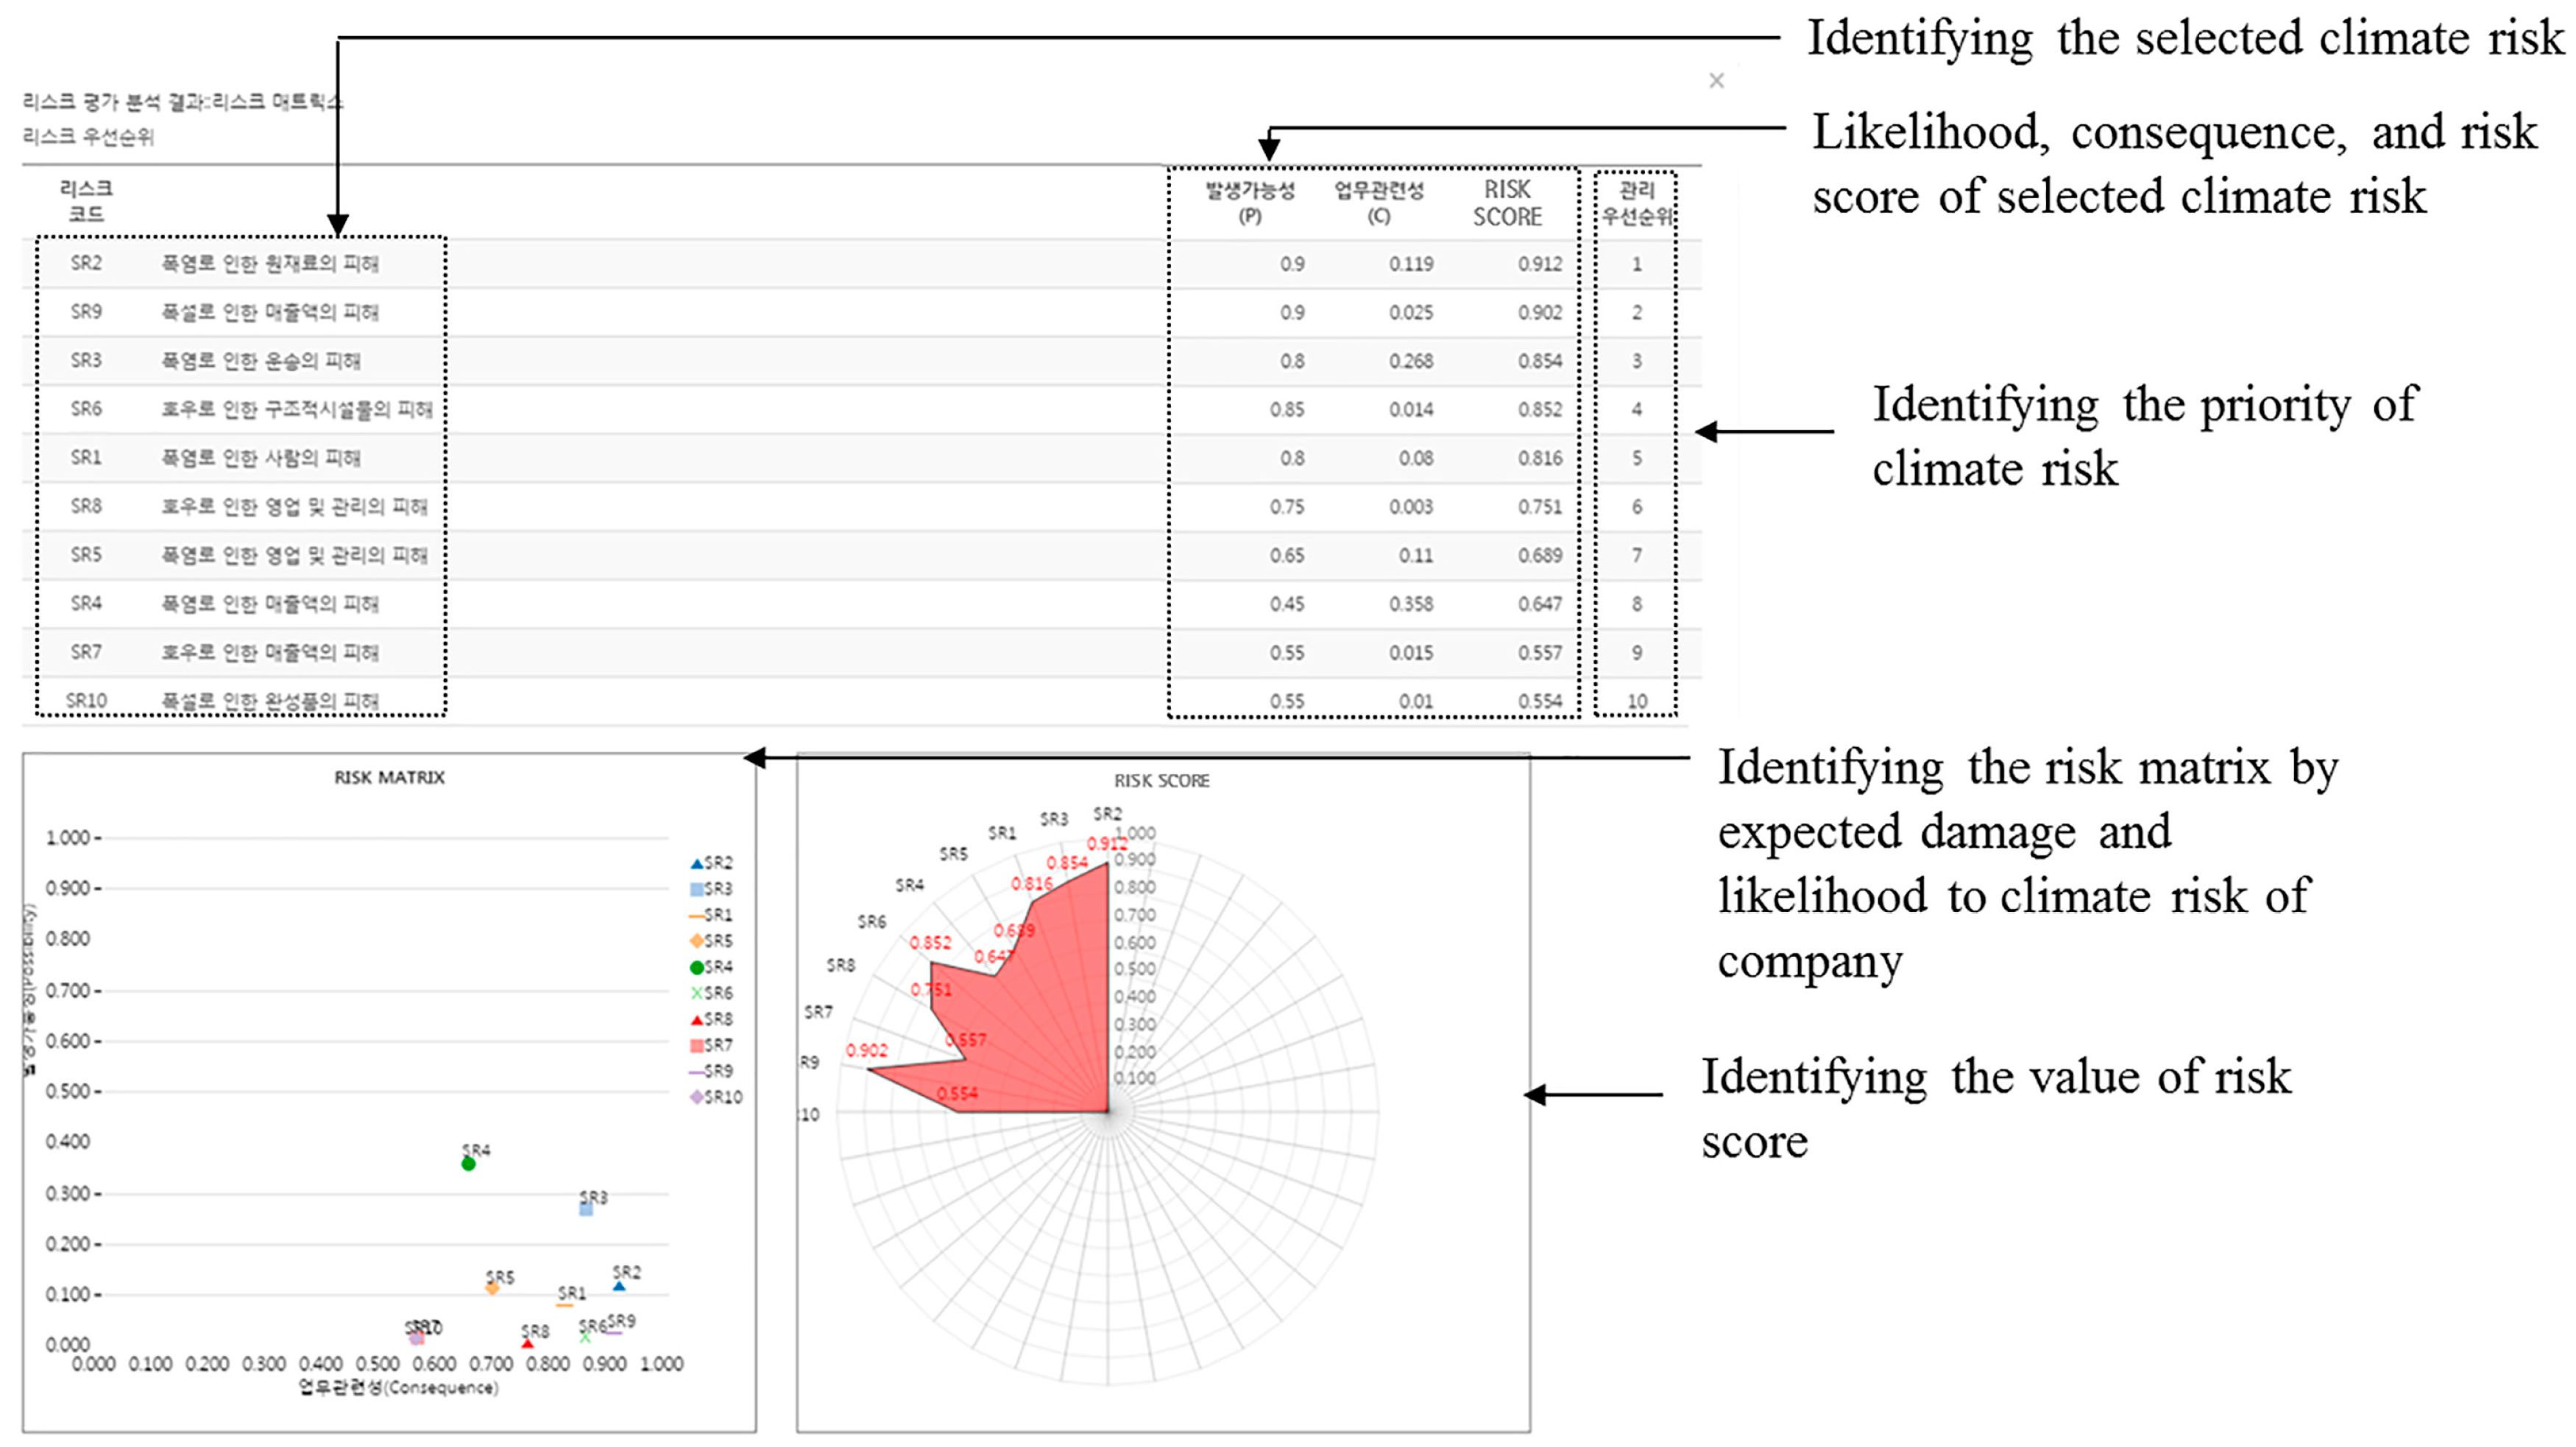
Next, the priority level of the climate risks used in the risk evaluation was calculated by using the risk matrix, which considers consequence (C) and likelihood (P). The C and P factors were converted into the risk scores in Equation (2) and then expressed on the risk matrix. The benefit of these factors is that if both have high values, this implies that the company needs to manage these more closely [
48]. Here, C represents the percentage rate of the total damage to the company that belongs to the expected damage of climate risk
i. This expected damage occurs according to climate risk
i derived by using Equation (1). P refers to the probability that a climate hazard can occur. This also refers to the
from Equation (1). In Equation (2),
i represents climate risk
i. Here, time is the average time from the moment of the evaluation to 2100:
The estimation method utilizing the probability and expected value is based on the following assumptions: (1) the operations and activities of the company only consider factors related to climate risk, (2) damage occurs proportionally to the probability, and (3) the relationships between the financial components are independent of the risk effects. However, risk perception and sense-making, which encompass managerial actions in the uncertain strategic decision-making process, are important concepts to consider [
49].
The risk evaluation results derived in this study are useful for strategic decision-making related to climate change adaptation. Risk calculations that use the cost of future climate change damage and prioritize the selected risks reveal the vulnerable parts of a company and factors that require better management in order to adapt to climate change. The proposed method does not provide general information relating to the impact of climatic hazards due to climate change, but rather a forecast of climatic effects on companies based on scientific climate change knowledge as well as indicating appropriate management strategies. Therefore, such results are considered to be a form of mediation in decision-making related to climate change adaptation.
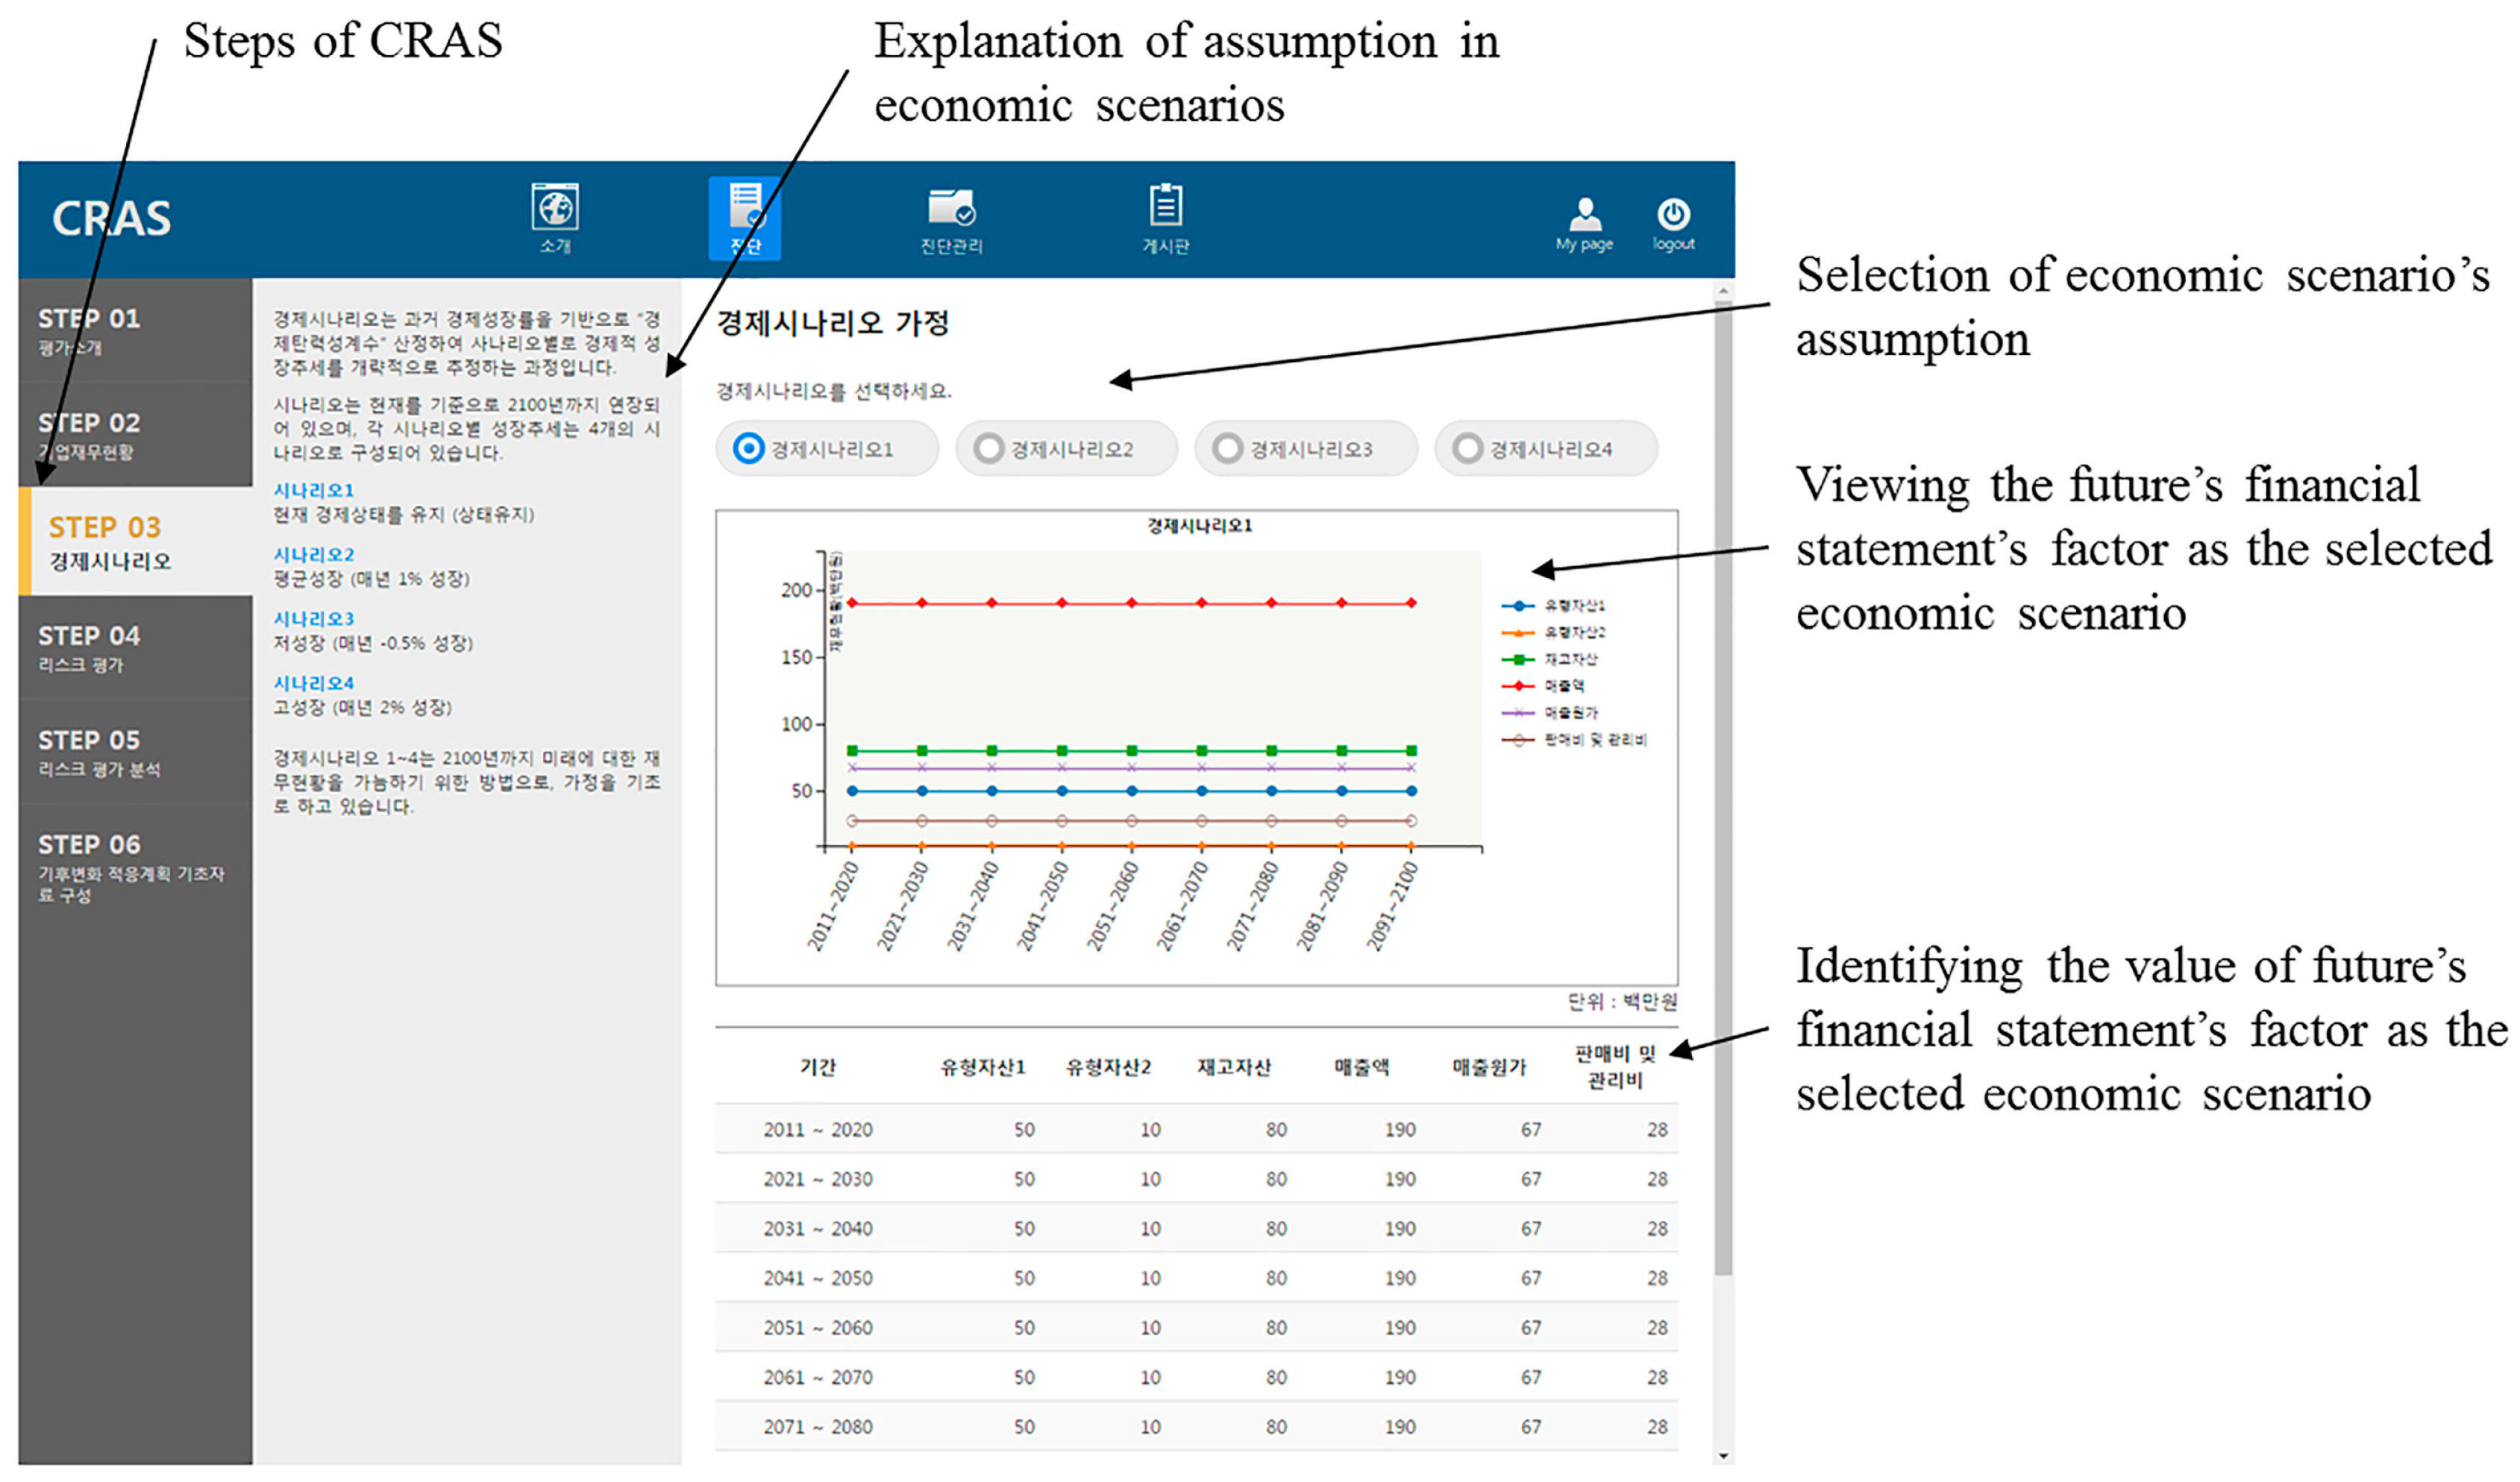
2.3. Development of the Climate Change Risk Assessment Tool for Company
4. Limitations and Suggestions for Future Research
Although this research suggests a method and tool to evaluate a company’s climate risks, it has its limitations. The first is the timeframe of the climate change risk assessment process. The climate change risk assessment results of this research are based on the climate risks that may occur in the future derived from criteria in the present. In other words, this tool evaluates how the current conditions of a company having the same structure as the present may create financial damage if the corresponding climate risk occurred in the future. However, a company’s attributes vary according to its size, sector, operations, and lifespan. Hence, future research should aim to devise a quantitative method able to evaluate the changes that dynamically influence the various attributes of a company due to climate change. If such a method were reflected in the climate change risk assessment, it would help the company invest in and plan for climate change adaptation.
The second concerns the four climatic hazards considered among this research’s climate risks. Owing to the limited data available from the KMA, this research only considered four types of climatic risks. However, changes such as rising sea levels and drought are important problems related to the facilities and raw materials of companies. If more reliable and comprehensive data could be provided in the future, studies could consider comprehensive changes in the relevant climatic hazards.
The third concerns the influence of spatial range and the company’s global network on the climate risk assessment. The application of this tool is spatially limited by the range of corporate activities occurring in a country. However, climate risks in one country influence the network of globalized firms. To resolve this problem, spatial data on climate change impacts at the global level are necessary to research the dependence of corporate activities on other firms and countries.
The fourth is the limitation of the text mining method. Text mining may produce different results according to the types and sources of materials and collection periods used. To analyze the relationship between the business risk factors and four extreme weather events, articles pertaining to the last 13 years from newspapers with relatively high credibility were used in this research. However, not every event that occurred during the evaluated period was necessarily reported. Although alternative methods such as social network service could be used to collect information, they might also have the same three methodological limitations. To address the limitation of the text mining materials, information on past disaster events could be analyzed. Future research could thus improve the estimated probability values by matching them with official statistical data on past disaster events.
The fifth is the issue of utilizing the proposed climate change risk assessment for decision making. The results of this research suggest the types of climate risks that can damage a company in the future and under the influence of which financial elements. Such results offer basic information for strategic decision making on adapting to climate change. The methodological approach of this study in identifying possible future financial damage is based on a combination of indicators, namely climate risks including business risk factors and climatic risk, prepared level of company by checklist, and financial statement factors. This indicator-based approach towards the assessment of climate change risk is used for its ease of understanding for the decision maker. However, the indicator-based approach has various limitations in measuring vulnerability, that is, inappropriate scientific grounds for measurement, substantial arguments for developing indicators [
50], temporal and spatial scale, and uncertainty [
51]. This study also has limitations in combining methodology with the theory of risk indicators. To assist actual decision-making on corporate-level climate change adaptation, further scientific analysis of why such problems appear in the first place must consider corporate activities, past experiences, and current issues. Additionally, the theoretical background must be developed to support the climate risk indicators in the business sector. Future research must also analyze the need to connect climate change risk assessment results to actual adaptation activities as to guide climate change risk management and better plan activities.
The sixth is related to the web-based tool introduced in this research. While this method is applicable for use globally, it was only tested in Korea. To apply this methodology in other countries, it would need to be refined according to the country in question. For example, spatial data on climatic hazards related to the climate risks in the country or region would need to be available, while the text mining results would need to be relevant to the country of application. It should also be noted that the probability of the business risk factors used in this research was based on the case of Korea. Further, the impact possibilities that climate risks can affect the financial statement factors must be categorized in a manner suitable to the country of application, while the elasticity parameters would be necessary to estimate financial status. Given that the results of this research were derived based on the input of financial consultants and experts in Korea as well as the Bank of Korea, the abovementioned three aspects must be considered to make the use of the tool generalizable globally.
The seventh relates to uncertainty. Although uncertainty was addressed by using a credible interval when estimating the parameters for the business risk factors and the future financial status by applying economic scenarios and coefficients of elasticity, uncertainty regarding the climate change scenario itself was not included in this study. The IPCC’s RCP scenarios make many assumptions and therefore have many limitations when making future projections. This study uses the projection data from the IPCC’s scenarios, and thus is subject to the same assumptions and limitations such as technical innovations, changed lifestyles, and external shocks (e.g., war, economic crisis). However, uncertainty will always exist when making decisions about the future, and it is difficult to completely resolve this issue. The focus of this study was to produce the best possible information at this point in time, and the problem of addressing uncertainty is an issue to resolve in future research.
The eighth limitation of this study is the problem of subjectivity that can occur during the checklist process of risk assessment. While efforts were made to produce objective questions to assess the degree of preparedness, risk analysis using a checklist can vary according to different perceptions. However, this issue can be addressed by the company through the participation of various members and by creating the checklists at workshops. While this research uses a checklist consisting of general questions, the development of detailed questions for different industries, achieved through future research, could lead to more objective checklist questions.
5. Conclusions
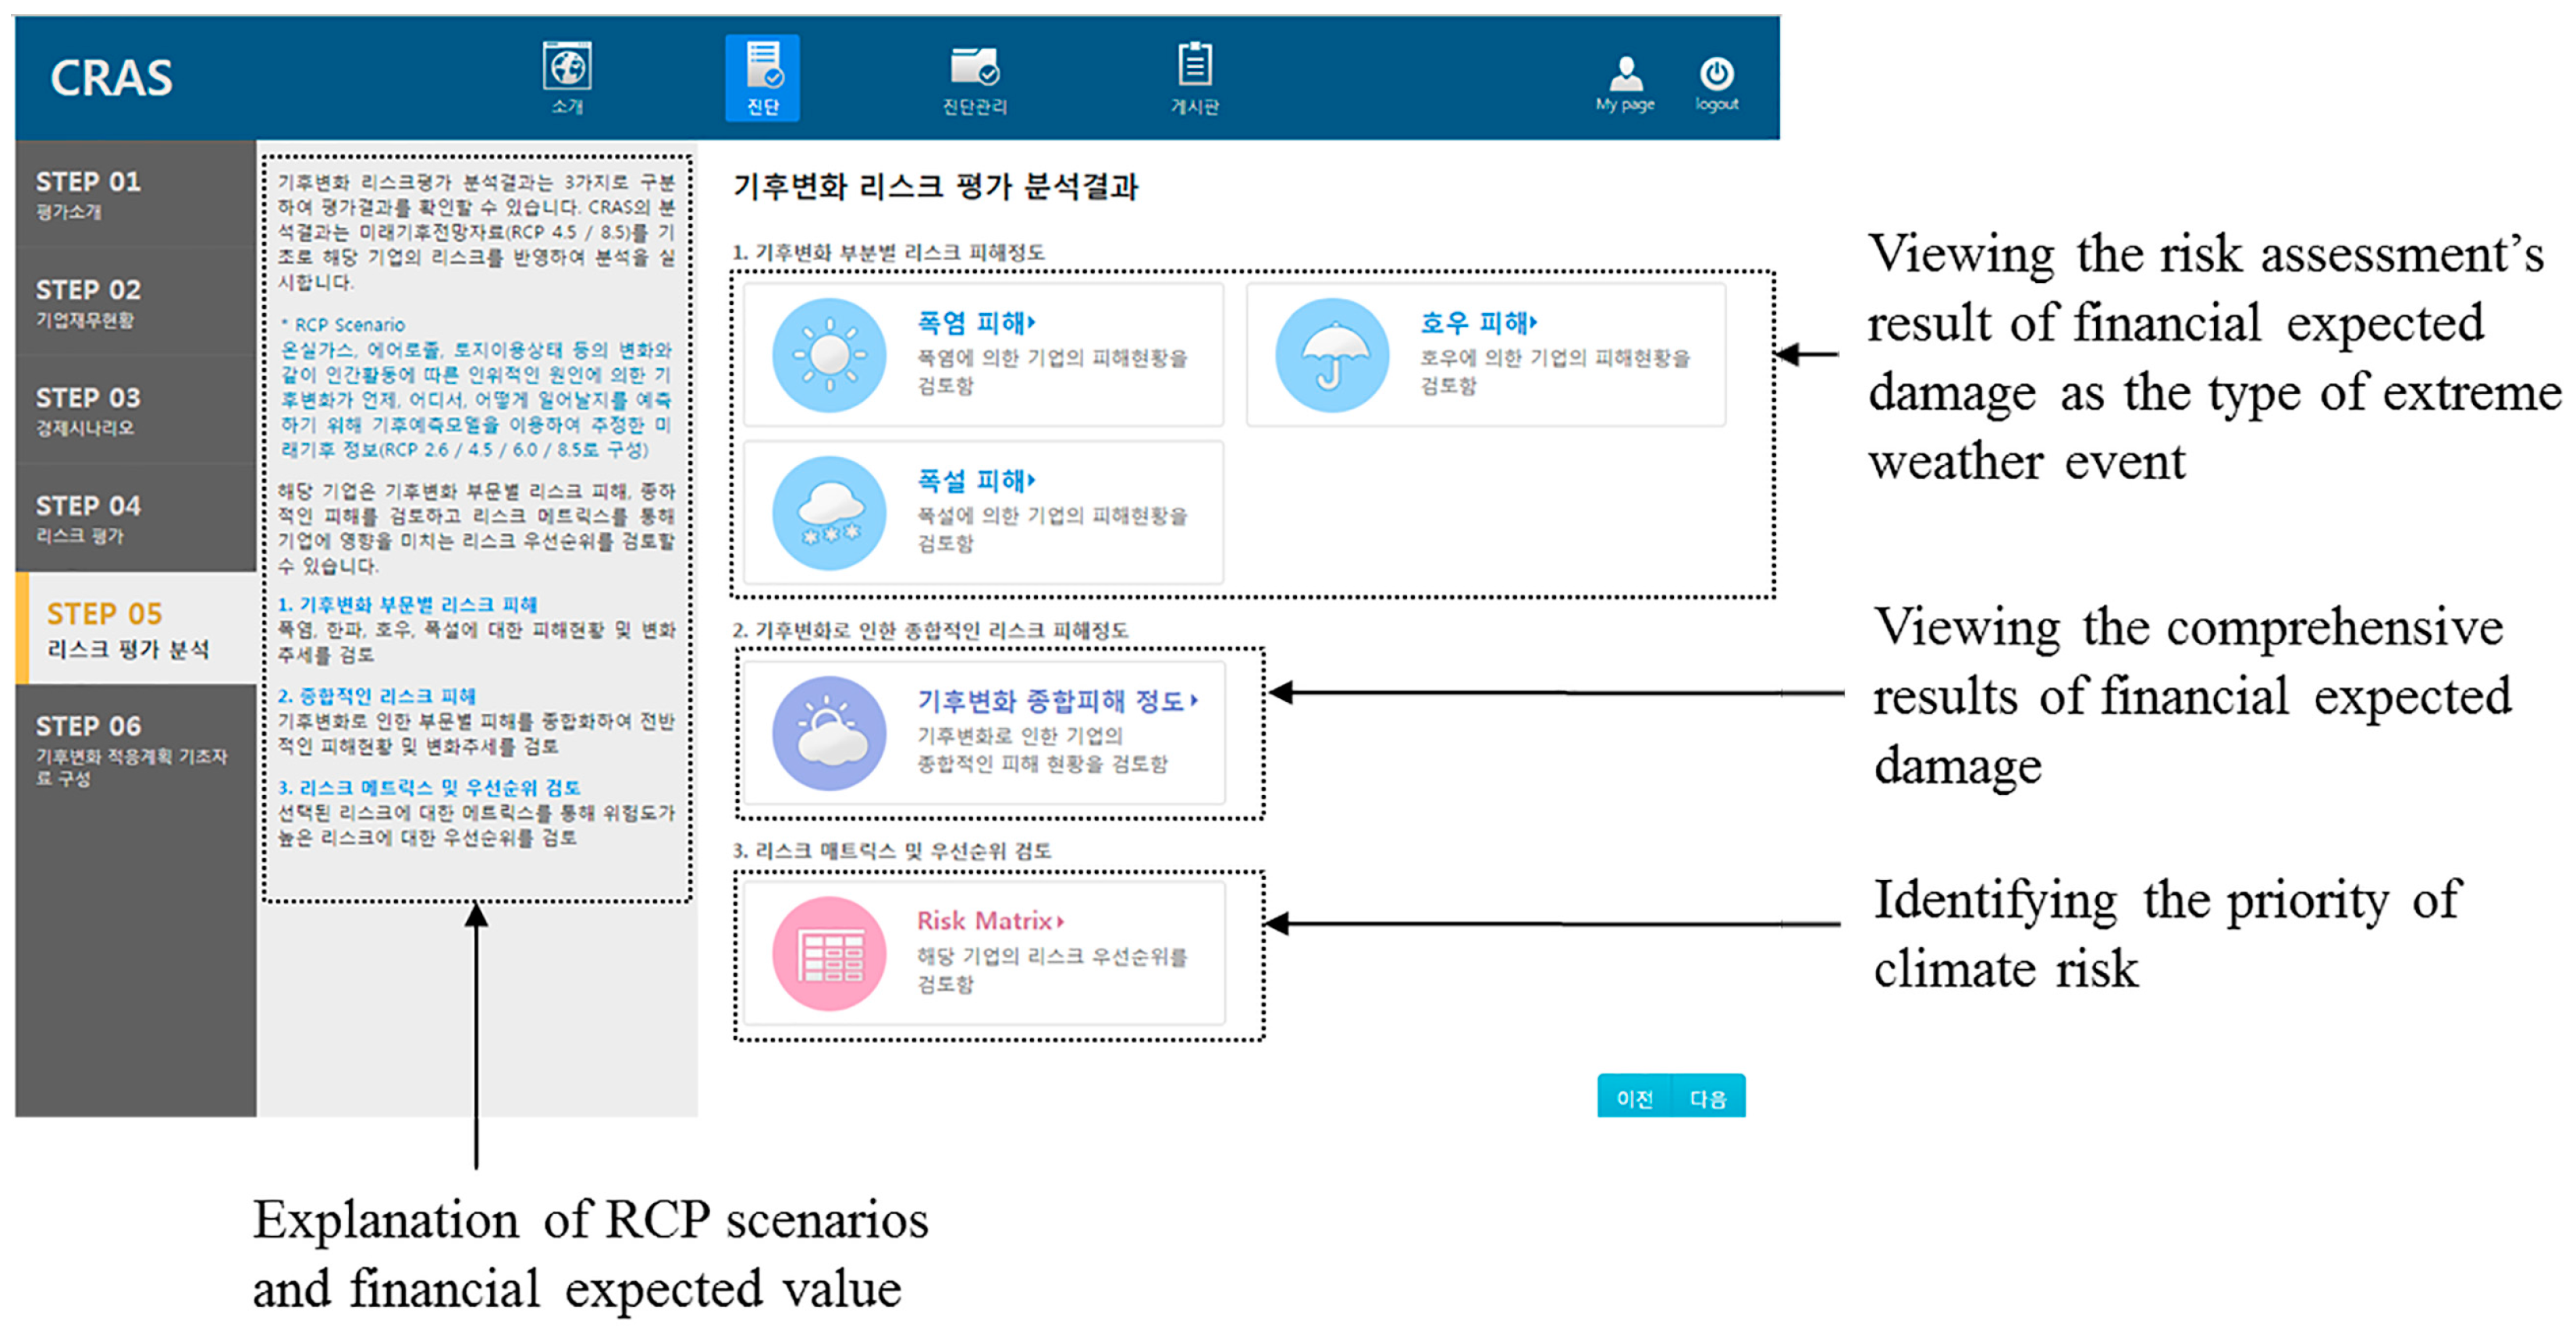
In this study, we proposed a method and tool for assessing climate risk for companies. Risks caused by the impact of climate change were connected to business operations and a process for assessing and presenting these risks was constructed based on firms’ financial statements. In the process, the RCP scenario for climate change approved by the IPCC was used for four types of extreme weather events, and past trends were identified through text mining to assess the potential effects on nine types of business operations. The results from the proposed tool provide information on the (1) types of climate risks that can affect a business in the future, (2) estimated probability-based magnitude of financial damage in relation to the occurrence of climate risks, and (3) management priority of the corresponding climate risks. These methods were then converted into a web-based tool to help companies perform quantitative risk assessments on the impact of climate change. In this tool, the user inputs company information and then selects and analyzes risks using a checklist; thereafter, the tool presents potential future damage costs due to climate change as well as prioritizes areas that require greater risk management.
This study is significant in that the tool and method for assessing company risk are provided as generalized climate change information that can be used directly by the company when discussing climate change adaptation. Until now, information for companies on climate change has been limited, and the general applicability of data from firm-specific case studies that include response measures has been ambiguous. Hence, the method and tool proposed in this study can be used to provide companies with climate change-related risk assessments as well as help establish appropriate plans and strategies. According to the G4 sustainability report guidelines and implementation manual published by the Global Reporting Initiative [
52], the financial implications of climate change risks should be obtained through the G4-EC2, which is a standard in economic performance. In particular, this includes the suggestion that the financial implications of the risks and opportunities should be reviewed before implementing any action. Such GRI4 regulations imply that the method and tool proposed in this study could effectively assist companies in writing sustainability reports.


