Abstract
A growing world population, changing consumption patterns and climate change are affecting water demands, water scarcity and water quality worldwide, while at present, few companies are incorporating good water stewardship. In order to create awareness on this issue and provide an incentive for companies to improve the water performance in their operations and supply chain, a method for ranking companies based on their water transparency has been developed. The method consists of a checklist that can be completed on the basis of information from annual reports, sustainability reports and websites of companies. This is the first time a ranking of companies regarding water transparency has been carried out. Results show that there are large differences in transparency between and within sectors and that companies are reporting more about their operations than their supply chain.
1. Introduction
Water scarcity and pollution are major challenges faced by the global society. According to the United Nations Open Working Group on Sustainable Development Goals, the main challenge regarding water is to “ensure availability and sustainable management of water and sanitation for all” [1]. This includes, amongst others, the improvement of water quality by reducing pollution, eliminating dumping and minimizing release of hazardous chemicals and materials, halving the proportion of untreated wastewater and increasing recycling and safe reuse. It also requires a substantial increase of water-use efficiency across all sectors, sustainable withdrawals and supply of freshwater to address water scarcity and a substantial reduction of the number of people suffering from water scarcity. In its Global Risks 2015 report, the World Economic Forum identifies water crises as the primary global risk in terms of impact [2]. It is increasingly recognized that the responsibility for wise water governance is not merely a task for governments, but partially relies on the private sector as well [3,4]. Transparency in how companies relate to issues of water scarcity and pollution and what they do to reduce their impact is thus becoming increasingly important [5].
Water policies in the 20th century mainly relied on the construction of massive infrastructure like dams, aqueducts and complex centralized treatment plants to meet human demands [6]. Even though these facilities resulted in tremendous benefits for billions of people, they also caused serious and often unanticipated social, economic and ecological costs. Many unsolved water problems remain, and past approaches no longer seem sufficient. There is an increasing need to reduce water demand rather than increase water supply, and to address the issue of continued economic growth that leads to the increasing pressure on water resources [7]. Besides, water availability is being affected worldwide by climate change. Impacts of climate change are experienced by the melting of glaciers and changing patterns of temperature and precipitation, which increase the likelihood of droughts and floods [8]. Climate change thus causes changing patterns of water demand and availability. Unfortunately, the impacts of changing patterns of water availability are neither recognized nor well understood by most businesses [9]. At the same time, the demand for water increases as the world population is growing and patterns of consumption are changing [10,11]. Besides, water is generally grossly underpriced. Since water is naturally for free and because water itself is not traded, but embedded in the production of goods, there is no market mechanism that puts a price on water [12]. If water users do pay for the water supply, they often pay only for the service of the water supplier or for the costs they make themselves for pumping up the water. The scarcity value and negative impacts that are caused by water use are usually not taken into account. This means that, beyond the relatively small direct payment for water abstraction, water users lack an incentive to consume less water, irrespective of how scarce water can be locally, thus enhancing the problem of water scarcity. Even though freshwater is a renewable resource, since water goes through the hydrological cycle and is naturally replenished in the course of time, it is also finite [13]. When one looks at the available water volume in a certain period, one cannot consume more water than what is available.
In tackling water scarcity and pollution, one of the main goals is that water should be used more efficiently and sustainably. This means that better techniques and practices should be employed so that less water is spilled, water productivities should be increased and water from water-scarce regions should not be depleted. The latter could be achieved by increasing water productivities in water-rich regions, so that pressure is removed from water-scarce ones [14]. What makes the water scarcity problem complicated is that it is often unclear who is responsible and to what extent. The responsibilities of both consumers and companies go beyond their own direct water consumption and pollution.
At present, there are only a few companies in the world incorporating good water stewardship into their policies, while there is an increasing number of companies and organizations that want to make their operations more sustainable and contribute to sustainable development. The Alliance for Water Stewardship has defined water stewardship as “the use of fresh water that is socially equitable, environmentally sustainable and economically beneficial, achieved through a stakeholder-inclusive process that involves site- and catchment-based actions. Good water stewards understand their own water use, catchment context and shared risk in terms of water governance, water balance, water quality and important water-related areas, then engage in meaningful individual and collective actions that benefit people and nature.” [15]. Water footprint studies have shown that often by far the largest part of the water use of companies is in their supply chain rather than in their operations [12]. This shows the importance of looking beyond water use in company operations and considering water use in the supply chain as well. Unfortunately, most companies still restrict themselves to their operational water withdrawals, leaving the supply chain out of scope. Besides, by considering water withdrawals they focus on gross water abstraction rather than net water abstraction, which is more relevant from a catchment perspective, because only water flows that are abstracted and not returned are no longer available within the environment for either reuse or maintaining environmental services.
Product and business transparency and water disclosure can help in tackling problems of water scarcity and water quality deterioration. Transparency and disclosure of water-related risks of companies will raise businesses awareness and require enhanced understanding of their issues, risks and opportunities. It could also lead to companies supporting efforts to develop standard measures and performance benchmarks. Furthermore, transparency and disclosure will provide investors, regulators and other stakeholders with better information, raise general awareness of water-related issues and encourage action and dialogue [9]. Transparency on water consumption and pollution along the value chain and good water stewardship fit within the broader challenge of corporate social responsibility or corporate sustainability [16]. Corporate sustainability is generally measured and reported in the form of a wide range of social, environmental and economic indicators [17]. Reporting on freshwater is one of the issues in environmental reporting [18], but has not been a major focus thus far.
The goal of our research was to develop a method for ranking companies regarding their water transparency and to test this method by applying it to the 75 largest Dutch stock-listed companies in the year 2013. Such a ranking has never been carried out before. The underlying idea is that ranking companies will help to create awareness and provide an incentive for companies to improve their water performance, not only in their operations but also in their supply chain.
2. Method and Data
The water transparency of a company is defined here as the extent to which a company publicly discloses information about its direct and indirect claim on freshwater resources and about what it does to reduce its claim. We developed a checklist of questions to be completed for each stock-listed company based on publicly available data and a simple scheme to rank companies based on the completed checklists. First, a logical framework for setting up the checklist was developed, by arranging the various sorts of relevant questions into six categories (Table 1). The framework shows that the operations and the supply chain of a company are considered separately. The reason for including the supply chain as a separate area of concern is that often by far the largest part of the water use of companies is in their supply chain rather than in their operations. The supply chain can thus significantly contribute to corporate water risk [19] and, accordingly, needs to be a key area of attention in water stewardship practice [20]. For both operations and the supply chain, three categories of questions were defined: reporting on water use and pollution, reporting on performance and reporting on targets. We thus ended up with six categories of questions. The full checklist of questions was structured along this framework of six categories.

Table 1.
The six categories of questions used for the development of the full checklist of questions.
| Operations | Supply chain | |
|---|---|---|
| Reporting on water use and pollution | Does the company report indicators related to water use and pollution in its operations? | Does the company report indicators related to water use and pollution in its supply chain? |
| Reporting on performance | Does the company report about its operational water performance by comparing its performance to previous years or to other companies from the same sector? | Does the company report about its supply-chain water performance by comparing its performance to previous years or to other companies from the same sector? |
| Reporting on targets | Does the company report about its targets for improving its operational performance? How detailed are these targets? Have deadlines been set? Has some progress already been made? Have programs to reach the targets been set up? | Does the company report about its targets for improving its supply-chain performance? How detailed are these targets? Have deadlines been set? Has some progress already been made? Have programs to reach the targets been set up? |
The first two categories of questions aim to check how transparent a company is with respect to basic data on water use and pollution in its operations and supply chain. Regarding the reporting on water use and pollution in relation to the company’s operations there are nine questions; for the supply chain there are five questions (see Appendix 1). For each question, a number of points (between zero and four) is given based on the score of the company on a ladder of five possible answers, whereby the lowest rung of the ladder (no reporting at all) yields zero points and the highest rung the full four points. The last point is given when reported information has been verified by an external auditor. Without auditing, the maximum number of points per question is three.
The next two categories of questions aim to evaluate the extent to which a company reports about and is aware of its performance, which can be judged by looking at whether comparisons are made with previous years and whether comparisons are made with other companies from the same sector. Accordingly, there are two questions for both operations and supply chain. Again, there are five possible answers that range from worst (no reporting) to best (full reporting plus verification by an auditor). For each question, a maximum of four points can be obtained.
The final two categories of questions aim to evaluate whether a company has targets to improve its water performance. We used the SMART-method to evaluate the clearness of target setting by companies. SMART is a mnemonic acronym, with the letters standing for: specific, measurable, assignable, realistic and time-related. Regarding the time aspect, a distinction was made between the presence of short-term (≤1 year) and long-term targets (>1 year). For each company it is checked whether it has targets regarding four main subjects: total water use, water use per unit of product, total water pollution and water pollution per unit of product. In addition to the questions about the presence of (smartly formulated) targets, questions are included regarding the presence of a program or plan for reaching the targets and the presence of a specific investment scheme to carry out such program or plan. In total, this resulted in 32 questions that needed to be answered with “yes” or “no”, both for the operations and supply chain. A “yes” yields 1 point, whereas a “no” gives no points. The full checklist of questions can be found in Appendix 1.
The scores for the six different categories were normalized to a range [0, 1] by equaling zero points to 0 and the maximum possible points to 1. Per company, an overall water transparency score was obtained by aggregating the normalized scores with an equal weight for each category. The maximum score is scaled to 100%, which means a maximum score of 16.7% for each category.
Data used to answer the questions of the checklist consist of annual reports and sustainability reports of 2013 and the websites of the 75 largest Dutch stock-listed companies (see Appendix 2). In the Netherlands, these 75 companies are subdivided based on their size. The 25 largest companies are represented in the Amsterdam Exchange Index (AEX), the companies that rank 26–50 in size are represented in the Amsterdam Midkap Index (AMX) and the ones ranking 51–75 are represented in the Amsterdam Small Cap Index (AScX). There has been no contact with the companies themselves. The companies have been categorized into nine sectors in order to make comparisons between sectors possible as well.
3. Results
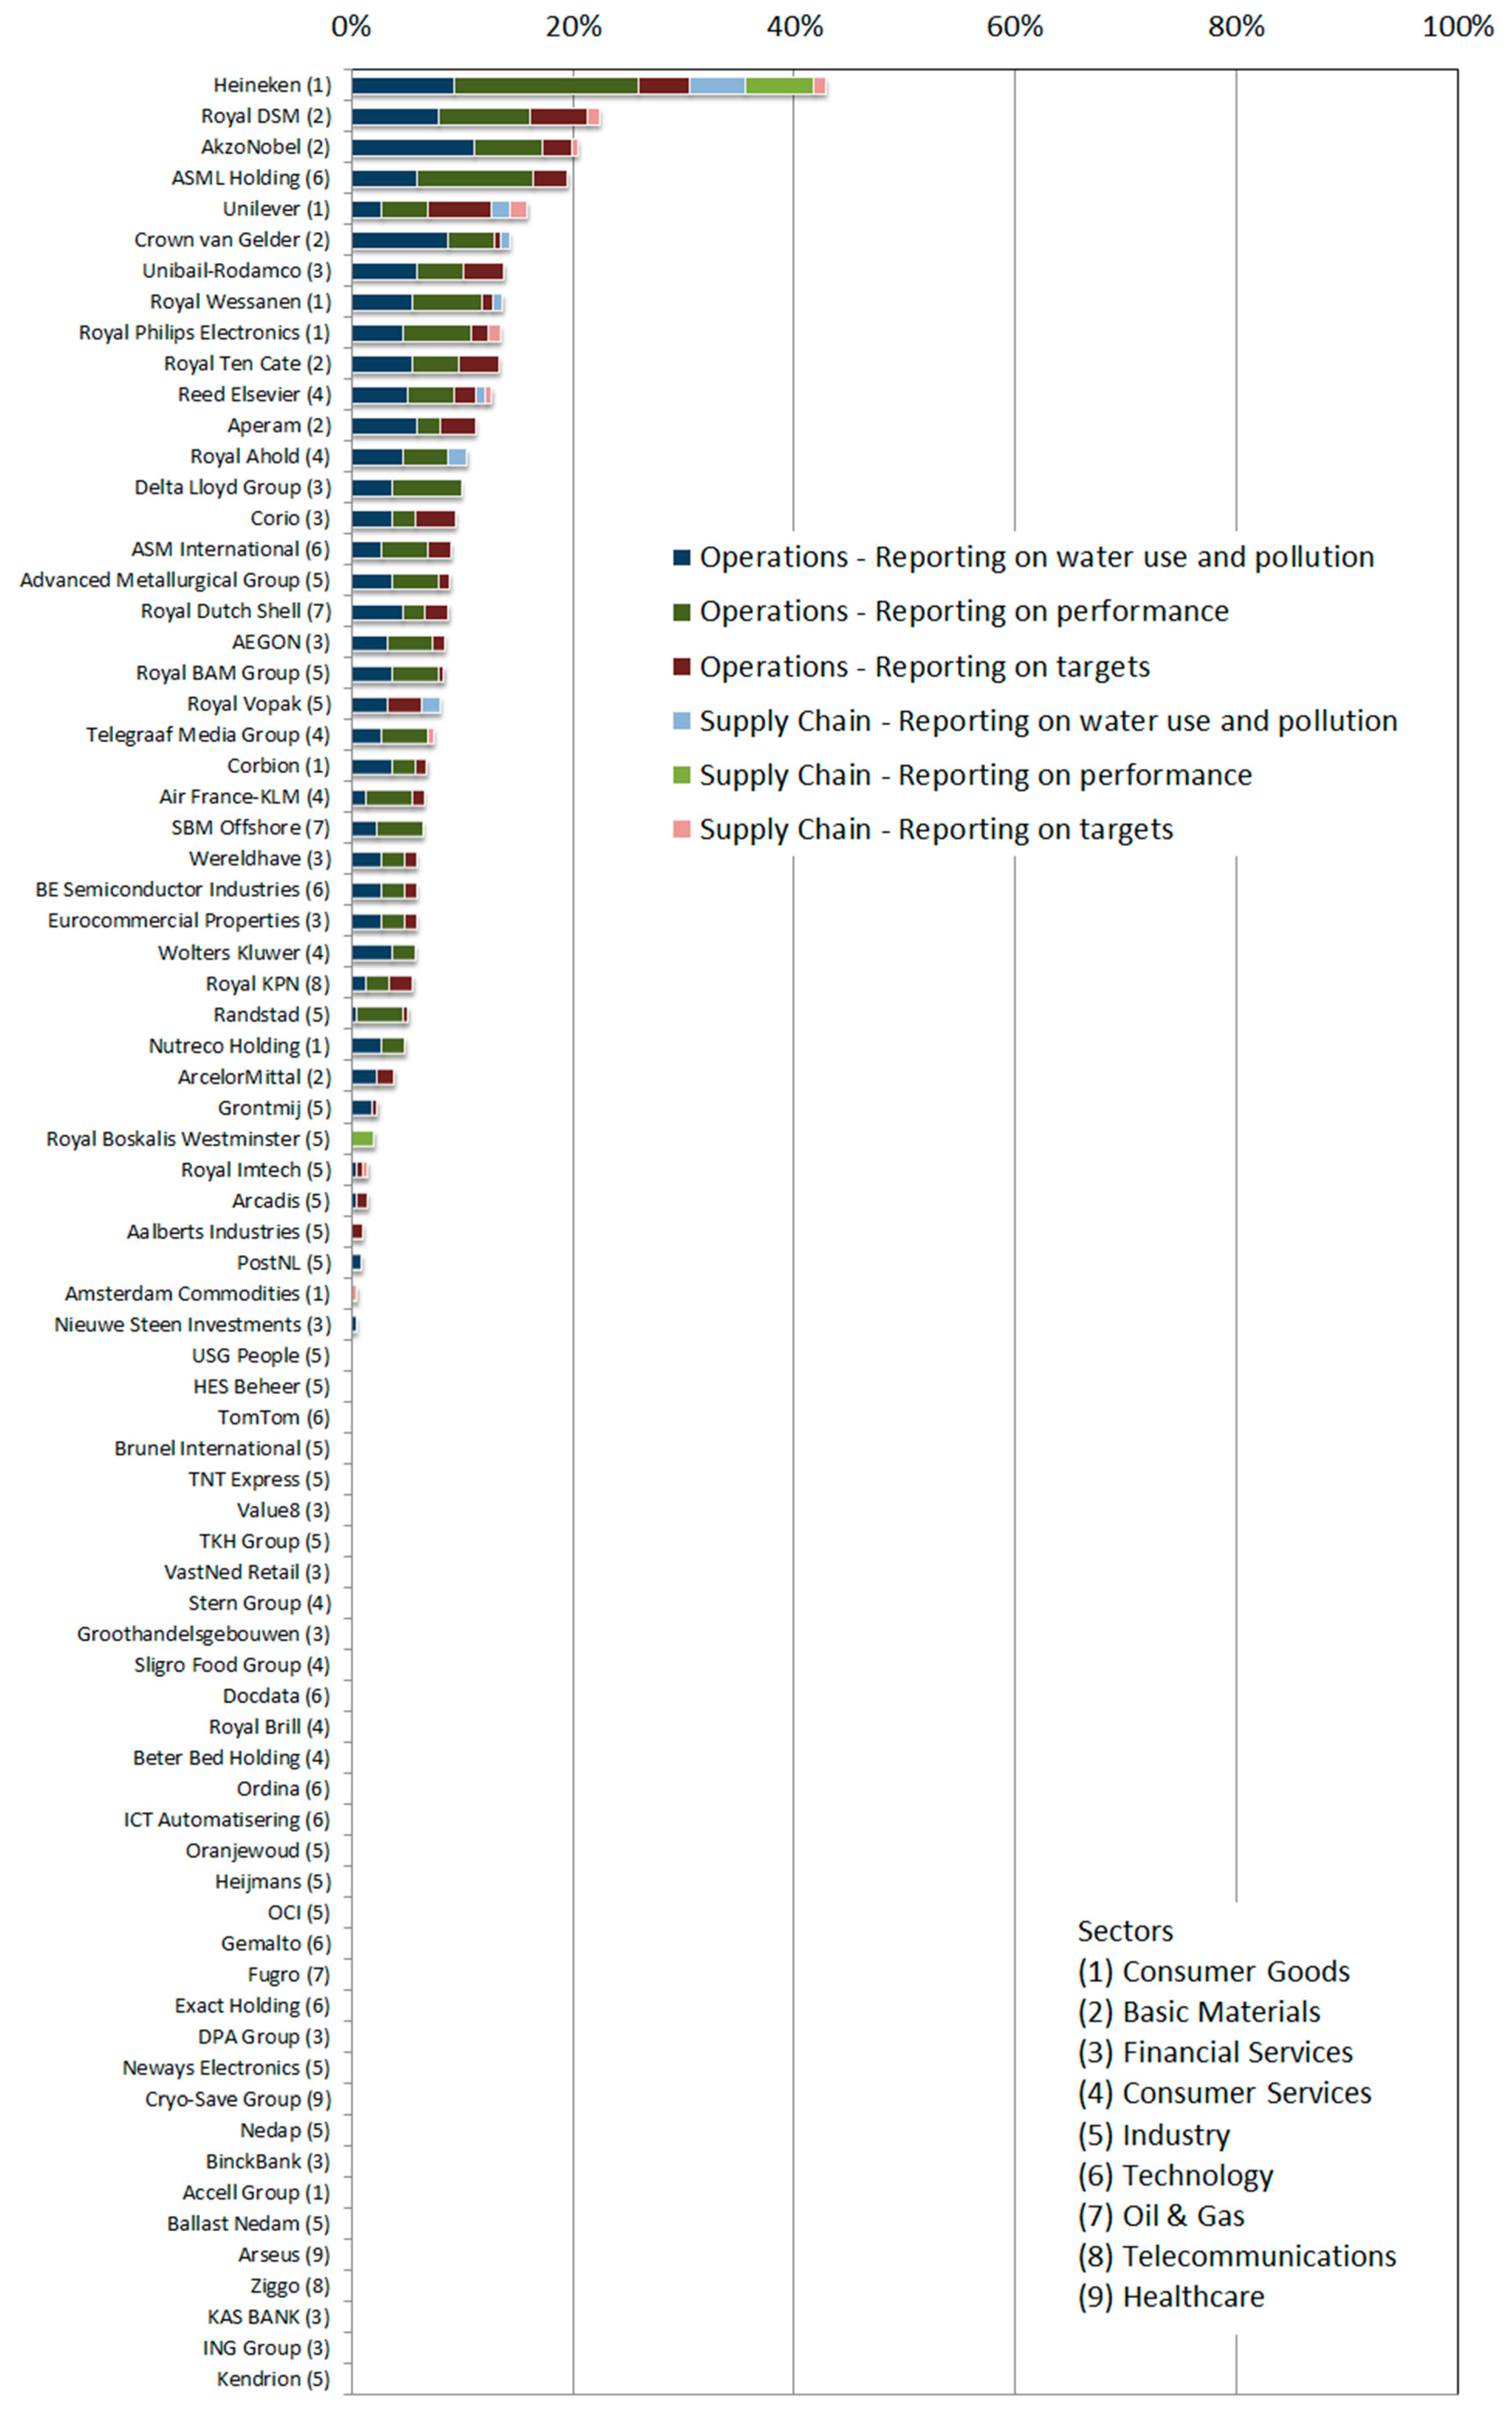
The transparency ranking of the 75 Dutch stock-listed companies is presented in Figure 1 and in Appendix 3. The maximum possible score is 100%. The maximum score for each of the six checklist categories is 16.7%. The scores for the different categories are shown by different colors.
What immediately stands out is that a large number of companies (34 out of 75) had an overall score of 0%. These companies are mainly AMX- and AScX-companies. When looking at the different categories, it can be concluded that companies report much more about their operations than about their supply chain. Especially the reporting on water use and pollution and reporting on performance regarding the operations scored well.
Heineken has the number one position in this ranking, with a transparency score of 43%, followed by Royal DSM (23%), AkzoNobel (21%), ASML Holding (20%) and Unilever (16%). It is remarkable that these top-5 companies belong to three different sectors: Consumer Goods, Basic Materials and Technology. Furthermore, all these companies are AEX-companies.
There are large differences between and within sectors. The different sectors are indicated with the numbers 1–9. Almost all companies from the Consumer Goods and Basic Materials sectors report something about water, but the differences between companies from these sectors are relatively large. Heineken scored 43% while Amsterdam Commodities from the same sector scored 1% and Accell Group 0%. The two companies from the Healthcare sector scored 0%. For all the other sectors, about half of the companies scored higher than 0%. Companies from the same sector could possibly learn from each other in terms of reporting about water and developing a water stewardship strategy. Also, by looking at the full list of questions (see Appendix 1), a company can see the different areas which it can address to improve its score.
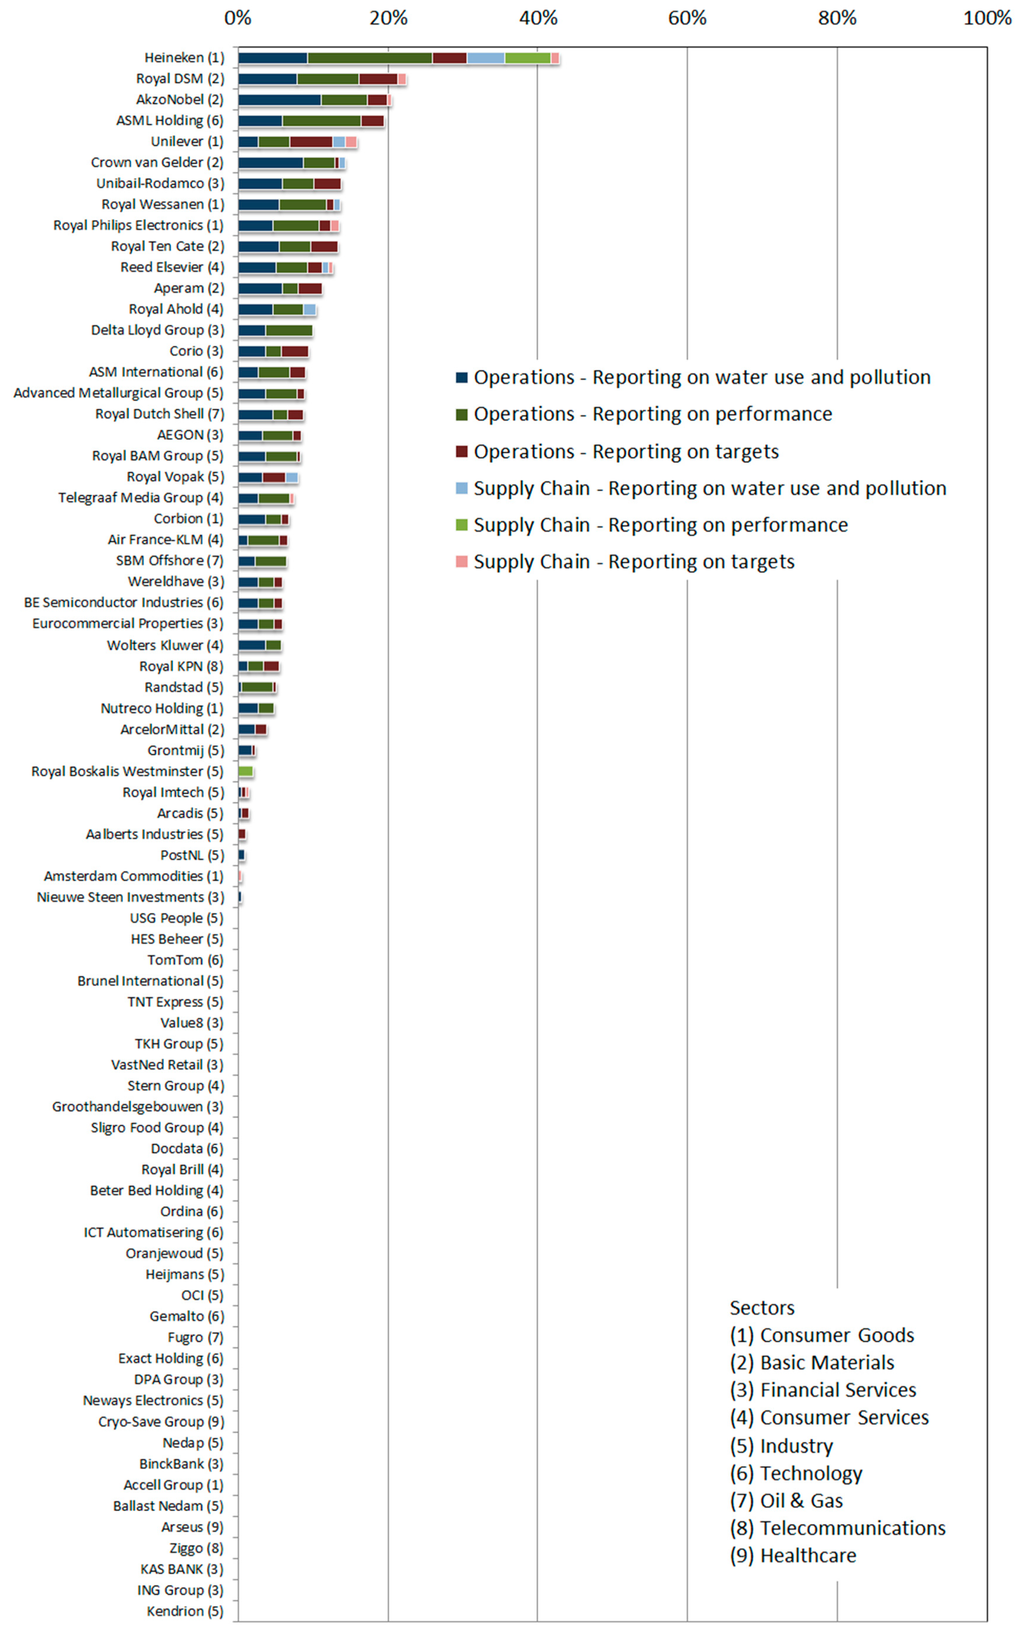
Figure 1.
Ranking of the water transparency of the largest 75 Dutch stock-listed companies.
Figure 1.
Ranking of the water transparency of the largest 75 Dutch stock-listed companies.
4. Discussion
In order to get an idea of why the highest score was only 43% out of 100%, which may seem low, each category is examined in more detail. Table 2 shows the maximum scores per category and the number of companies that scored above 0%.
Table 2.
Scores per category.
| Maximum score (out of 16.7%) | Number of reporting companies (out of 75) | |
|---|---|---|
| Operations | ||
| reporting on water use and pollution | 11.1% | 38 |
| reporting on performance | 16.7% | 31 |
| reporting on targets | 5.7% | 31 |
| Supply chain | ||
| reporting on water use and pollution | 5.0% | 7 |
| reporting on performance | 6.3% | 2 |
| reporting on targets | 1.6% | 9 |
The fact that companies scored low with respect to reporting on targets (regarding both operations and supply chain) shows that it is still quite unusual in the private sector to set quantitative time-specific targets to reduce water use and pollution. The absence of benchmarks regarding water use per sector is regretful in this respect, because this would help companies to position themselves and formulate targets to improve. The branch where benchmarks for operational water use have been best developed is the beverage sector [21]. Regarding the supply chain, there is no sector yet that has developed benchmarks. For raw crop ingredients, a first global benchmarking study for water use was carried out recently [22].
The method of measuring the water transparency of companies as developed and applied here is generic and can be applied for companies of different sizes and from different sectors. It is likely that the method is equally applicable in other countries than the Netherlands. It is fair, however, to note that some type of companies may have a much greater impact on water scarcity and pollution than others. Due to the relatively high water intensity of agriculture-based products, the consumptive water use in the full supply chain of companies like Heineken. Unilever and Royal Ahold (per unit of turnover) is far greater than for companies like Randstad or Grontmij. Water pollution in the supply chain of companies in the oil and gas sector goes far beyond that in the supply chain of companies in the financial services sector. One may thus argue that water transparency for some type of companies is more important than for others.
The financial services sector is a special case if it comes to water transparency. The water transparency ranking developed here focuses on the transparency of a company with respect to its own water use and pollution and that in its supply chain. For investment companies, it is probably more important to consider their transparency regarding how their investments indirectly impact on increasing or reducing water scarcity and pollution. The relevant question is here whether and how they include water sustainability criteria in their investment decisions.
The reason why companies scored low with respect to reporting about their supply chain is that all companies focus on their own operations, which is understandable, since it is harder for a company to get data on and influence its supply chain. 41 of the 75 companies reported something about water and the majority of these companies scored points in all operational categories. The relevance and need to address the supply chain is, however, broadly acknowledged [23].
For each of the questions regarding the reporting on water use and pollution and reporting on performance, companies can obtain a maximum of four points. The fourth point is given if the reported information has been verified by an external auditor. For instance, the reporting on water use and pollution in the operations contains nine questions, thus 36 points is the maximum score. Nine of these points can be gained if the information that is reported by the company has been verified by an auditor, which is 25% of the total amount of points. Therefore, having (or not having) verification has a considerable influence on the final score. If a company has not got verified anything it automatically misses 25% of the points in four of the six question categories.
The scoring method developed and applied here has some degree of subjectivity; outcomes may be changed with different weighting of the six categories of questions and if different questions were posed. However, it is unlikely that the ranking will be strongly influenced by this, because companies with better scores generally score better over more categories. It is not the case that some companies are strong in reporting on their operations and others on reporting their supply chain. Generally, companies start reporting their operations and the higher-ranking companies start reporting their supply chain as well. A similar thing is true for reporting on water use (first), reporting on performance (second) and reporting on targets (finally). Weighting the categories differently will thus affect the scores in absolute terms, but not the ranking. Yet, whatever measuring and ranking method will be applied, it may be expected that the method will receive criticism from companies listed. Transparency of the scoring method applied is therefore of utmost importance. Full details on how we obtained the scores per company can be obtained through the corresponding author. In the end, the purpose of ranking is to provide insight in how companies perform in terms of water transparency and to provide an incentive to improve.
The method of water transparency ranking developed here could be further developed and applied in the emerging field of corporate water disclosure [5,9], but it may also be integrated into frameworks for environmental, social and governance (ESG) risk rating of companies as applied in the investment community [24].
5. Conclusions
The goal of this research was to develop a method for ranking companies regarding their water transparency and to test this method by applying it to the 75 largest Dutch stock-listed companies. This was the first time a method for ranking companies regarding their transparency about water use and pollution has been set up and tested. The method consists of a checklist that can be completed on the basis of publicly available information.
In the ranking. Heineken takes the lead with a score of 43% out of 100%, followed by Royal DSM (23%), AkzoNobel (21%), ASML Holding (20%) and Unilever (16%). These top-5 companies are all AEX-companies, but belong to three different sectors. 34 of the 75 companies scored 0%. These companies were mainly AMX and AScX companies.
Companies report much more about their operational use than about their supply chain. The best scores were found for “reporting on water use and pollution” and “reporting on performance” in own operations. The low overall scores may seem disappointing, with 43% being the highest score, but these low scores should not be associated with bad companies or bad reporting skills. The ranking was carried out to see where the Dutch stock-listed companies stand in terms of reporting about water. Corporate awareness regarding water issues is still at its infancy and considering water use and pollution in supply chains is a completely new field for most companies [25]. There is a great room for improvement in the private sector if it comes to understanding and addressing its contribution to water scarcity and pollution. It would be helpful to develop sector benchmarks with respect to water use and pollution in operations and supply chain in order to enable companies to measure themselves against others within the same sector.
Acknowledgments
The present work was partially developed within the framework of the Panta Rhei Research Initiative of the International Association of Hydrological Sciences (IAHS). We thank Rob van Tilburg (Royal HaskoningDHV), Xander de Bruine (Water Footprint Network) and Jochem Verberne (WWF) for their comments during the different stages of performing the research. The full responsibility for this paper lies with the authors of this paper.
Author Contributions
Arjen Y. Hoekstra, Wouter Berkhout and Marissa H. Linneman designed the research; Marissa H. Linneman performed the research; Marissa H. Linneman, Arjen Y. Hoekstra and Wouter Berkhout analyzed the data and wrote the paper. All authors approved the final manuscript.
Appendix 1
The Full Checklist of Questions
Operations—Reporting on water use (quantity) and pollution (quality)
- 1.1:
- Does the company report about the total volume of water withdrawn?
- 1.2:
- Does the company report about its operational blue water footprint (net volume of water withdrawal)?
- 1.3:
- Does the company report about its water sources?
- 1.4:
- Does the company report about the total volume of water recycled and reused?
- 1.5:
- Does the company report about its water efficiency or blue water footprint per unit of product?
- 1.6:
- Does the company report about the total volume of water discharged and the discharge destinations?
- 1.7:
- Does the company report about the quality of the water discharged and its grey water footprint?
- 1.8:
- Does the company report about water pollution per unit of product?
- 1.9:
- Does the company report about water risks?
Operations—Reporting on performance
- 2.1:
- Does the company compare its performance to a previous (reference) year?
- 2.2:
- Does the company compare its own performance to the performance of other companies?
Operations—Reporting on targets
Four subjects for targets regarding the company’s operations have been identified and for each company it is checked whether it has targets regarding these four subjects. The four subjects are: total water use, water use per unit of product, total water pollution and water pollution per unit of product. For each subject, the following questions are posed:
- a:
- Specific: does the company mention targets for its operational use?
- a:
- Measurable: are the targets quantified?
- c:
- Assignable: is it clear who is assigned to realize the targets?
- d:
- Realistic: has some progress already been made?
- e:
- Time-related: does the report mention targets for the short term (≤ 1 year)?
- f:
- Time-related: does the report mention targets for the long term (> 1 year)?
- g:
- Does the company mention programs or plans that have been set up for reaching the targets?
- h:
- Does the company mention investments that have been made for reaching the targets?
Supply chain—Reporting on water use (quantity) and pollution (quality)
- 4.1:
- Does the company report about its water use along its supply chain?
- 4.2:
- Does the company report about its green and blue supply-chain water footprint?
- 4.3:
- Does the company report about the water sources of the supply chain?
- 4.4:
- Does the company report about water quality and its grey water footprint along the supply chain?
- 4.5:
- Does the company report about water risks related to the areas its suppliers operate in?
Supply chain—Reporting on performance
- 5.1:
- Does the company compare its supply chain performance to a previous (reference) year?
- 5.2:
- Does the company compare its own supply chain performance to the supply chain performance of other companies?
Supply chain—Reporting on targets
Four subjects for targets regarding the supply chain have been identified and for each company it is checked whether it has targets regarding these four subjects. The subjects are: total water use, water use per unit of product, total water pollution and water pollution per unit of product. For each subject, the following questions are posed:
- a:
- Specific: does the company mention targets for its supply chain?
- b:
- Measurable: are the targets quantified?
- c:
- Assignable: is it clear who is assigned to realize the targets?
- d:
- Realistic: has some progress already been made?
- e:
- Time-related: does the report mention targets for the short term (≤1 year)?
- f:
- Time-related: does the report mention targets for the long term (>1 year)?
- g:
- Does the company mention programs or plans that have been set up for reaching the targets?
- h:
- Does the company mention investments that have been made for reaching the targets?
Appendix 2
Table A1.
Source documents per company.
| AEX Companies | Source documents |
|---|---|
| Aegon | Annual Report Supplemental Annual Report 2013 Aegon’s 2013 Integrated Revie www.aegon.com |
| Royal Ahold | Annual Report 2013 Responsible Retailing Report 2013 www.ahold.com |
| Akzo Nobel | Annual Report 2013 www.akzonobel.com |
| ArcelorMittal | Annual Report 2013 corporate.arcelormittal.com |
| ASML | Annual Report 2013 Corporate Responsibility Report 2013 www.asml.com |
| Boskalis | Annual Report 2013 CSR Report 2013 www.boskalis.com |
| Corio | Annual Report 2013 CSR Report 2013 www.corio-eu.com |
| Delta Lloyd Group | Annual Report 2013 www.deltalloydgroep.com |
| Royal DSM | Annual Report 2013 www.dsm.com |
| Fugro | Annual Report 2013 www.fugro.com |
| Gemalto | Annual Report 2013 www.gemalto.com |
| Heineken | Annual Report 2013 Sustainability Report 2013 www.heineken.com |
| ING Group | Annual Report 2013 Sustainability Report 2013 ING Environmental and Social Risk Framework www.ing.com |
| Royal KPN | Annual Report 2013 Annual Report 2013 Social & Environmental Figures corporate.kpn.com |
| OCI | Annual Report 2013 www.ocinv.nl |
| Philips | Annual Report 2013 www.philips.com |
| Randstad Holding | Annual Report 2013 www.randstad.com |
| Reed Elsevier | Annual Report 2013 Corporate Responsibility Report 2013 www.reedelsevier.com |
| SBM Offshore | Annual Report 2013 Report on selected Key Sustainability Indicators 2013 www.sbmoffshore.com |
| Royal Dutch Shell | Annual Report 2013 Sustainability Report 2013 www.shell.com |
| TNT Express | Annual Report 2013 www.tnt.com |
| Unibail-Rodamco | Annual and Sustainability Report 2013 www.unibail-rodamco.com |
| Unilever | Annual Report 2013 Unilever Sustainable Living Plan 2013 www.unilever.com |
| Wolters Kluwer | Annual Report 2013 Sustainability Report 2013 www.wolterskluwer.com |
| Ziggo | Annual Report 2013 www.ziggo.com |
| AMX Companies | Source documents |
| Aalberts Industries | Annual Report 2013 www.aalberts.nl |
| Accell Group | Annual Report 2013 www.accell-group.com |
| Air France-KLM | Registration Document 2013 Including the annual financial report www.airfranceklm.com |
| Aperam | Annual Report 2013 Sustainability Report “Made for Life” 2013 Made for Life Report Supplement C www.aperam.com |
| Arcadis | Annual Report 2013 www.arcadis.com |
| Arseus | Annual Report 2013 www.arseus.com |
| ASM International | Annual Report 2013 www.asm.com |
| BAM Group | Annual Report 2013 Sustainability Report 2013 www.bam.eu |
| Binckbank | Annual Report 2013 www.binck.com |
| Brunel International | Annual Report 2013 www.brunel.et |
| Corbion | Annual Report 2013 www.corbion.com |
| Eurocommercial Properties | Annual Report 2012/2013 www.eurocommercialproperties.com |
| Exact Holding | Annual Report 2013 www.exact.com |
| Royal Imtech | Annual Report 2013 Sustainability Report 2013 Code of Sustainable Supply imtech.com |
| Nieuwe Steen Investments | Annual Report 2013 www.nsi.nl |
| Nutreco | Annual Report 2013 Sustainability Vision 2020 www.nutreco.com |
| PostNL | Annual Report 2013 www.postnl.com |
| Sligro Food Group | Annual Report 2013 CSR Report 2013 GRI Table 2013 www.sligrofoodgroup.nl |
| Royal Ten Cate | Annual Report 2013 www.tencate.com |
| TKH Group | Annual Report 2013 CSR Report 2013 www.tkhgroup.com |
| TomTom | Annual Report 2013 www.tomtom.com |
| USG People | Annual Report 2013 www.usgpeople.com |
| VastNed Retail | Annual Report 2013 www.vastned.com |
| Royal Vopak | Annual Report 2013 Sustainability Report 2013 www.vopak.com |
| Wereldhave | Annual Report 2013 Sustainability Report 2013 www.wereldhave.com |
| AscX Companies | Source documents |
| Amsterdam Commodities | Annual Report 2013 www.acomo.nl |
| Advanced Metallurgical Group | Annual Report 2013 www.amg-nv.com |
| Ballast Nedam | Annual Report 2013 www.ballast-nedam.com |
| BE Semiconductor | Annual Report 2013 www.besi.com |
| Beter Bed | Annual Report 2013 2013 GRI Index www.beterbedholding.com |
| Royal Brill | Annual Report 2013 www.brill.com |
| Cryo-Save Group | Annual Report 2013 www.cryo-save.com |
| Crown van Gelder | Annual Report 2013 www.cvg.nl |
| Docdata | Annual Report 2013 www.docdatanv.com |
| DPA Group | Annual Report 2013 www.dpa.nl |
| Grontmij | Annual Report 2013 www.grontmij.com |
| Groothandelsgebouwen | Annual Report 2013 www.ghg.nl |
| Heijmans | Annual Report 2013 Sustainability Report 2013 www.heijmans.nl |
| HES Beheer | Annual Report 2013 www.hesbeheer.nl |
| ICT Automatisering | Annual Report 2013 www.ict.eu |
| KAS BANK | Annual Report 2013 www.kasbank.com |
| Kendrion | Annual Report 2013 CSR Report 2013 www.kendrion.com |
| Nedap | Annual Report 2013 www.nedap.com |
| Neways Electronics | Annual Report 2013 www.neways.nl |
| Oranjewoud | Annual Report 2013 www.oranjewoudnv.nl |
| Ordina | Annual Report 2013 www.ordina.com |
| Stern Group | Annual Report 2013 www.sterngroep.nl |
| Telegraaf Media Groep | Annual Report 2013 corporate.tmg.nl |
| Value8 | Annual Report 2013 www.value8.com |
| Royal Wessanen | Annual Report 2013 Sustainability Factsheet 2013 Wessanen GRI Table 2013 wessanen.com |
Appendix 3
Table A2.
Ranking of the water transparency of the largest 75 Dutch stock-listed companies.
| Company | Operations | Supply chain | Tot al score overall | |||||||
|---|---|---|---|---|---|---|---|---|---|---|
| Reporting on: | Total score for operations | Reporting on: | Total score for supply chain | |||||||
| Water use and pollution | Performance | Targets | Water use and pollution | Performance | Targets | |||||
| Heineken | 9.3% | 16.7% | 4.7% | 30.6% | 5.0% | 6.3% | 1.0% | 12.3% | 42.9% | |
| Royal DSM | 7.9% | 8.3% | 5.2% | 21.4% | 0.0% | 0.0% | 1.0% | 1.0% | 22.5% | |
| AkzoNobel | 11.1% | 6.3% | 2.6% | 20.0% | 0.0% | 0.0% | 0.5% | 0.5% | 20.5% | |
| ASML Holding | 6.0% | 10.4% | 3.1% | 19.6% | 0.0% | 0.0% | 0.0% | 0.0% | 19.6% | |
| Unilever | 2.8% | 4.2% | 5.7% | 12.7% | 1.7% | 0.0% | 1.6% | 3.2% | 15.9% | |
| Crown van Gelder | 8.8% | 4.2% | 0.5% | 13.5% | 0.8% | 0.0% | 0.0% | 0.8% | 14.3% | |
| Unibail-Rodamco | 6.0% | 4.2% | 3.6% | 13.8% | 0.0% | 0.0% | 0.0% | 0.0% | 13.8% | |
| Royal Wessanen | 5.6% | 6.3% | 1.0% | 12.8% | 0.8% | 0.0% | 0.0% | 0.8% | 13.7% | |
| Royal Philips Electronics | 4.6% | 6.3% | 1.6% | 12.4% | 0.0% | 0.0% | 1.0% | 1.0% | 13.5% | |
| Royal Ten Cate | 5.6% | 4.2% | 3.6% | 13.4% | 0.0% | 0.0% | 0.0% | 0.0% | 13.4% | |
| Reed Elsevier | 5.1% | 4.2% | 2.1% | 11.3% | 0.8% | 0.0% | 0.5% | 1.4% | 12.7% | |
| Aperam | 6.0% | 2.1% | 3.1% | 11.2% | 0.0% | 0.0% | 0.0% | 0.0% | 11.2% | |
| Royal Ahold | 4.6% | 4.2% | 0.0% | 8.8% | 1.7% | 0.0% | 0.0% | 1.7% | 10.5% | |
| Delta Lloyd Group | 3.7% | 6.3% | 0.0% | 10.0% | 0.0% | 0.0% | 0.0% | 0.0% | 10.0% | |
| Corio | 3.7% | 2.1% | 3.6% | 9.4% | 0.0% | 0.0% | 0.0% | 0.0% | 9.4% | |
| ASM International | 2.8% | 4.2% | 2.1% | 9.0% | 0.0% | 0.0% | 0.0% | 0.0% | 9.0% | |
| Advanced Metallurgical Group | 3.7% | 4.2% | 1.0% | 8.9% | 0.0% | 0.0% | 0.0% | 0.0% | 8.9% | |
| Royal Dutch Shell | 4.6% | 2.1% | 2.1% | 8.8% | 0.0% | 0.0% | 0.0% | 0.0% | 8.8% | |
| AEGON | 3.2% | 4.2% | 1.0% | 8.4% | 0.0% | 0.0% | 0.0% | 0.0% | 8.4% | |
| Royal BAM Group | 3.7% | 4.2% | 0.5% | 8.4% | 0.0% | 0.0% | 0.0% | 0.0% | 8.4% | |
| Royal Vopak | 3.2% | 0.0% | 3.1% | 6.4% | 1.7% | 0.0% | 0.0% | 1.7% | 8.0% | |
| Telegraaf Media Group | 2.8% | 4.2% | 0.0% | 6.9% | 0.0% | 0.0% | 0.5% | 0.5% | 7.5% | |
| Corbion | 3.7% | 2.1% | 1.0% | 6.8% | 0.0% | 0.0% | 0.0% | 0.0% | 6.8% | |
| Air France-KLM | 1.4% | 4.2% | 1.0% | 6.6% | 0.0% | 0.0% | 0.0% | 0.0% | 6.6% | |
| SBM Offshore | 2.3% | 4.2% | 0.0% | 6.5% | 0.0% | 0.0% | 0.0% | 0.0% | 6.5% | |
| Wereldhave | 2.8% | 2.1% | 1.0% | 5.9% | 0.0% | 0.0% | 0.0% | 0.0% | 5.9% | |
| BE Semiconductor Industries | 2.8% | 2.1% | 1.0% | 5.9% | 0.0% | 0.0% | 0.0% | 0.0% | 5.9% | |
| Eurocommercial Properties | 2.8% | 2.1% | 1.0% | 5.9% | 0.0% | 0.0% | 0.0% | 0.0% | 5.9% | |
| Wolters Kluwer | 3.7% | 2.1% | 0.0% | 5.8% | 0.0% | 0.0% | 0.0% | 0.0% | 5.8% | |
| Royal KPN | 1.4% | 2.1% | 2.1% | 5.6% | 0.0% | 0.0% | 0.0% | 0.0% | 5.6% | |
| Randstad | 0.5% | 4.2% | 0.5% | 5.2% | 0.0% | 0.0% | 0.0% | 0.0% | 5.2% | |
| Nutreco Holding | 2.8% | 2.1% | 0.0% | 4.9% | 0.0% | 0.0% | 0.0% | 0.0% | 4.9% | |
| ArcelorMittal | 2.3% | 0.0% | 1.6% | 3.9% | 0.0% | 0.0% | 0.0% | 0.0% | 3.9% | |
| Grontmij | 1.9% | 0.0% | 0.5% | 2.4% | 0.0% | 0.0% | 0.0% | 0.0% | 2.4% | |
| Royal Boskalis Westminster | 0.0% | 0.0% | 0.0% | 0.0% | 0.0% | 2.1% | 0.0% | 2.1% | 2.1% | |
| Royal Imtech | 0.5% | 0.0% | 0.5% | 1.0% | 0.0% | 0.0% | 0.5% | 0.5% | 1.5% | |
| Arcadis | 0.5% | 0.0% | 1.0% | 1.5% | 0.0% | 0.0% | 0.0% | 0.0% | 1.5% | |
| Aalberts Industries | 0.0% | 0.0% | 1.0% | 1.0% | 0.0% | 0.0% | 0.0% | 0.0% | 1.0% | |
| PostNL | 0.9% | 0.0% | 0.0% | 0.9% | 0.0% | 0.0% | 0.0% | 0.0% | 0.9% | |
| Amsterdam Commodities | 0.0% | 0.0% | 0.0% | 0.0% | 0.0% | 0.0% | 0.5% | 0.5% | 0.5% | |
| Nieuwe Steen Investments | 0.5% | 0.0% | 0.0% | 0.5% | 0.0% | 0.0% | 0.0% | 0.0% | 0.5% | |
| USG People | 0.0% | 0.0% | 0.0% | 0.0% | 0.0% | 0.0% | 0.0% | 0.0% | 0.0% | |
| HES Beheer | 0.0% | 0.0% | 0.0% | 0.0% | 0.0% | 0.0% | 0.0% | 0.0% | 0.0% | |
| TomTom | 0.0% | 0.0% | 0.0% | 0.0% | 0.0% | 0.0% | 0.0% | 0.0% | 0.0% | |
| Brunel International | 0.0% | 0.0% | 0.0% | 0.0% | 0.0% | 0.0% | 0.0% | 0.0% | 0.0% | |
| TNT Express | 0.0% | 0.0% | 0.0% | 0.0% | 0.0% | 0.0% | 0.0% | 0.0% | 0.0% | |
| Value8 | 0.0% | 0.0% | 0.0% | 0.0% | 0.0% | 0.0% | 0.0% | 0.0% | 0.0% | |
| TKH Group | 0.0% | 0.0% | 0.0% | 0.0% | 0.0% | 0.0% | 0.0% | 0.0% | 0.0% | |
| VastNed Retail | 0.0% | 0.0% | 0.0% | 0.0% | 0.0% | 0.0% | 0.0% | 0.0% | 0.0% | |
| Stern Group | 0.0% | 0.0% | 0.0% | 0.0% | 0.0% | 0.0% | 0.0% | 0.0% | 0.0% | |
| Groothandelsgebouwen | 0.0% | 0.0% | 0.0% | 0.0% | 0.0% | 0.0% | 0.0% | 0.0% | 0.0% | |
| Sligro Food Group | 0.0% | 0.0% | 0.0% | 0.0% | 0.0% | 0.0% | 0.0% | 0.0% | 0.0% | |
| Docdata | 0.0% | 0.0% | 0.0% | 0.0% | 0.0% | 0.0% | 0.0% | 0.0% | 0.0% | |
| Royal Brill | 0.0% | 0.0% | 0.0% | 0.0% | 0.0% | 0.0% | 0.0% | 0.0% | 0.0% | |
| Beter Bed Holding | 0.0% | 0.0% | 0.0% | 0.0% | 0.0% | 0.0% | 0.0% | 0.0% | 0.0% | |
| Ordina | 0.0% | 0.0% | 0.0% | 0.0% | 0.0% | 0.0% | 0.0% | 0.0% | 0.0% | |
| ICT Automatisering | 0.0% | 0.0% | 0.0% | 0.0% | 0.0% | 0.0% | 0.0% | 0.0% | 0.0% | |
| Oranjewoud | 0.0% | 0.0% | 0.0% | 0.0% | 0.0% | 0.0% | 0.0% | 0.0% | 0.0% | |
| Heijmans | 0.0% | 0.0% | 0.0% | 0.0% | 0.0% | 0.0% | 0.0% | 0.0% | 0.0% | |
| OCI | 0.0% | 0.0% | 0.0% | 0.0% | 0.0% | 0.0% | 0.0% | 0.0% | 0.0% | |
| Gemalto | 0.0% | 0.0% | 0.0% | 0.0% | 0.0% | 0.0% | 0.0% | 0.0% | 0.0% | |
| Fugro | 0.0% | 0.0% | 0.0% | 0.0% | 0.0% | 0.0% | 0.0% | 0.0% | 0.0% | |
| Exact Holding | 0.0% | 0.0% | 0.0% | 0.0% | 0.0% | 0.0% | 0.0% | 0.0% | 0.0% | |
| DPA Group | 0.0% | 0.0% | 0.0% | 0.0% | 0.0% | 0.0% | 0.0% | 0.0% | 0.0% | |
| Neways Electronics | 0.0% | 0.0% | 0.0% | 0.0% | 0.0% | 0.0% | 0.0% | 0.0% | 0.0% | |
| Cryo-Save Group | 0.0% | 0.0% | 0.0% | 0.0% | 0.0% | 0.0% | 0.0% | 0.0% | 0.0% | |
| Nedap | 0.0% | 0.0% | 0.0% | 0.0% | 0.0% | 0.0% | 0.0% | 0.0% | 0.0% | |
| BinckBank | 0.0% | 0.0% | 0.0% | 0.0% | 0.0% | 0.0% | 0.0% | 0.0% | 0.0% | |
| Accell Group | 0.0% | 0.0% | 0.0% | 0.0% | 0.0% | 0.0% | 0.0% | 0.0% | 0.0% | |
| Ballast Nedam | 0.0% | 0.0% | 0.0% | 0.0% | 0.0% | 0.0% | 0.0% | 0.0% | 0.0% | |
| Arseus | 0.0% | 0.0% | 0.0% | 0.0% | 0.0% | 0.0% | 0.0% | 0.0% | 0.0% | |
| Ziggo | 0.0% | 0.0% | 0.0% | 0.0% | 0.0% | 0.0% | 0.0% | 0.0% | 0.0% | |
| KAS BANK | 0.0% | 0.0% | 0.0% | 0.0% | 0.0% | 0.0% | 0.0% | 0.0% | 0.0% | |
| ING Group | 0.0% | 0.0% | 0.0% | 0.0% | 0.0% | 0.0% | 0.0% | 0.0% | 0.0% | |
| Kendrion | 0.0% | 0.0% | 0.0% | 0.0% | 0.0% | 0.0% | 0.0% | 0.0% | 0.0% | |
Conflicts of Interest
The authors declare no conflict of interest.
References
- UN. Report of the Open Working Group of the General Assembly on Sustainable Development Goals. A/68/970; United Nations: New York, NY, USA, 2014. [Google Scholar]
- WEF. Global Risks 2015, 10th ed.; World Economic Forum: Geneva, Switzerland, 2015. [Google Scholar]
- Hoekstra, A.Y.; Chapagain, A.K. Globalization of Water: Sharing the Planet’s Freshwater Resources; Blackwell Publishing: Oxford, UK, 2008. [Google Scholar]
- Sojamo, S.; Keulertz, M.; Warner, J.; Allan, J.A. Virtual water hegemony: The role of agribusiness in global water governance. Water Int. 2012, 37, 169–182. [Google Scholar] [CrossRef]
- CEO Water Mandate. Corporate Water Disclosure Guidelines: Toward a Common Approach to Reporting Water Issues; Pacific Institute: Oakland, CA, USA, 2014. [Google Scholar]
- Gleick, P. Global freshwater resources: Soft-path solutions for the 21st century. Science 2003, 302, 1524–1528. [Google Scholar] [CrossRef] [PubMed]
- Savenije, H.H.G.; Hoekstra, A.Y.; van der Zaag, P. Evolving water science in the Anthropocene. Hydrol. Earth Syst. Sci. 2014, 18, 319–332. [Google Scholar] [CrossRef]
- IPCC. Climate Change 2013: The Physical Science Basis. Working Group I Contribution to the Fifth Assessment Report of the Intergovernmental Panel on Climate Change; Cambridge University Press: New York, NY, USA, 2013. [Google Scholar]
- Irbaris. CDP Water Disclosure: The Case for Water Disclosure; Carbon Disclosure Project: London, UK, 2009. [Google Scholar]
- Vörösmarty, C.; Green, P.; Salisbury, J.; Lammers, R. Global water resources: Vulnerability from climate change and population growth. Science 2000, 289, 284–288. [Google Scholar] [CrossRef] [PubMed]
- Ercin, A.E.; Hoekstra, A.Y. Water footprint scenarios for 2050: A global analysis. Environ. Int. 2014, 64, 71–82. [Google Scholar] [CrossRef] [PubMed]
- Hoekstra, A.Y. The Water Footprint of Modern Consumer Society; Routledge: London, UK, 2013. [Google Scholar]
- Oki, T.; Kanae, S. Global hydrological cycles and world water resources. Science 2006, 313, 1068–1072. [Google Scholar] [CrossRef] [PubMed]
- Hoekstra, A.Y. Sustainable efficient and equitable water use: The three pillars under wise freshwater allocation. WIREs Water 2014, 1, 31–40. [Google Scholar] [CrossRef]
- Alliance for Water Stewardship (AWS). The AWS International Water Stewardship Standard. Version 1.0. 8 April 2014. Available online: http://allianceforwaterstewardship.org/assets/documents/AWS-Standard-v-1-Abbreviated-print.pdf (accessed on 19 January 2015).
- Van Marrewijk, M. Concepts and definitions of CSR and corporate sustainability: Between agency and communion. J. Bus. Ethics 2003, 44, 95–105. [Google Scholar] [CrossRef]
- Daub, C.-H. Assessing the quality of sustainability reporting: an alternative methodological approach. J. Clean. Product. 2007, 15, 75–85. [Google Scholar] [CrossRef]
- Herva, M.; Franco, A.; Carrasco, E.F.; Roca, E. Review of corporate environmental indicators. J. Clean. Product. 2011, 19, 1687–1699. [Google Scholar] [CrossRef]
- Larson, W.M.; Freedman, P.L.; Passinsky, V.; Grubb, E.; Adriaens, P. Mitigating corporate water risk: Financial market tools and supply management strategies. Water Altern. 2012, 5, 582–602. [Google Scholar]
- Hepworth, N. Open for business or opening pandora’s box? A constructive critique of corporate engagement in water policy: An introduction. Water Altern. 2012, 5, 543–562. [Google Scholar]
- BIER. Water Use Benchmarking in the Beverage Industry: Trends and Observations 2012; Beverage Industry Environmental Roundtable. Anteagroup: Saint Paul, MN, USA, 2012. [Google Scholar]
- Mekonnen, M.M.; Hoekstra, A.Y. Water footprint benchmarks for crop production: A first global assessment. Ecol. Indic. 2014, 46, 214–223. [Google Scholar] [CrossRef]
- CDP. CDP Global Water Report 2014: From Water Risk to Value Creation; CDP: London, UK, 2014. [Google Scholar]
- Peiró-Signes, A.; Segarra-Oña, M.; Mondéjar-Jiménez, J.; Vargas-Vargas, M. Influence of the environmental social and corporate governance ratings on the economic performance of companies: An overview. Int. J. Environ. Res. 2013, 7, 105–112. [Google Scholar]
- Hoekstra, A.Y. Water scarcity challenges to business. Nat. Clim. Chang. 2014, 4, 318–320. [Google Scholar]
© 2015 by the authors; licensee MDPI, Basel, Switzerland. This article is an open access article distributed under the terms and conditions of the Creative Commons Attribution license (http://creativecommons.org/licenses/by/4.0/).