Article

How Sustainable is the Increase in the Water Footprint of the Spanish Agricultural Sector? A Provincial Analysis between 1955 and 2005–2010

by
Ignacio Cazcarro
1,*,†,
Rosa Duarte
2,†,
Miguel Martín-Retortillo
3,†,
Vicente Pinilla
3,† and
Ana Serrano
4,†
1
Basque Centre for Climate Change (BC3), 48008 Bilbao, Spain
2
Department of Economic Analysis, Faculty of Economics and Business Studies, Universidad de Zaragoza, 50005 Zaragoza, Spain
3
Department of Applied Economics and Economic History, Faculty of Economics and Business Studies, Universidad de Zaragoza, 50005 Zaragoza, Spain
4
Department of Economics, Faculty of Business and Economic Sciences, Universitat de Girona, 17071 Girona, Spain
*
Author to whom correspondence should be addressed.
These authors contributed equally to this work.
Sustainability 2015, 7(5), 5094-5119; https://doi.org/10.3390/su7055094
Submission received: 28 February 2015 / Revised: 16 April 2015 / Accepted: 20 April 2015 / Published: 27 April 2015
(This article belongs to the Special Issue Water Footprints and Sustainable Water Allocation)

Abstract

:
In the context of a relatively scarce water country, the article analyzes the changes in 50 years in the water footprint (WF) in Spain evaluating its sustainability. For that purpose, firstly we make use of the regional information of the water footprints and crop production to estimate the WF of production over the 50 provinces in Spain, looking at the variation between the years 1955 and 2005–2010. The detail in the information of crops (more than 150 of them) statistics allows us to examine the types and origin of changes (in volume produced, shifts towards more or less water intensive crops). Secondly, we estimate sustainability indicators also at the provincial level, which let us evaluate whether this change has created or incremented the risk of physical and economic water stress. Thirdly, we introduce the economic perspective, providing evidence on the infrastructures built and public sector expenditure, as an approximation to the costs of the increases in WF, particularly meaningful for those water stressed areas.

1. Introduction

Water management in Spain has been a fundamental part of economic development policy of the twentieth century. The expansion of irrigation and the switch towards more profitable crops, which often had higher needs of water, has driven processes of transformation of the agricultural sector in Spain. Nowadays, more than a half of the final crop agricultural production in Spain is obtained in irrigation [1] and traditional irrigation schemes have undergone significant transformations. All these changes have had key effects in the water sustainability indicators, in general in the match between supply and demand of water and in the water footprints (WFs) of production.
The analysis of water footprints at a point in time or between short periods of time makes very difficult to compare the medium and long term costs of changes in WFs. In particular, the increases in agricultural production, or the switch towards more water intensive crops usually gets reflected in increases in exports, income, etc. However, the downside is often omitted or only hinted, which gets reflected shortages of water elsewhere (downstream, for alternative uses, etc.) and ultimately on the sustainability of certain regions, especially arid and semi-arid. At the most, this is usually examined by looking at water scarcity indicators, at the generation of temporal conflicts or choices between uses, but long term costs of water provision are rarely studied together with them. The investments necessary to supply water and improve its delivery and sanitation, are long term investments, which also often, as clearly happened in the case of Spain, where undertaken by the public sector. The historical perspective allows us putting in context the implications of increases in water footprints of production, in water scarcity, but also to analyse the costs involved to put water in place at the different Spanish regions, an important aspect which usually water prices and tariffs do not reflect at all.
In this context, in summary, this paper aims to analyse the blue and green water footprint of crop production in Spain at the provincial level and from a long-term perspective. In our view, both dimensions, the historical and the spatial ones, are highly significant for understanding a crucial stage of economic growth in Spain and, more importantly, to evaluate the environmental and economic impacts associated to this growth. In our view, the analysis may contribute to a more integrated assessment of sustainability patterns of economic growth. The remainder of the paper is organized as follows. Section 2 provides the background for the three perspectives which our analysis is based on: historical analysis, water footprint studies and water stress indicators. Section 3 presents the methodology and data used. Section 4 covers the main findings, showing results on the historical water footprints of production by province, on some water stress indicators and on the associated economic costs of those changes in water footprint of production. Conclusions and future endeavors are presented in Section 5.

2. Background and Literature Review

Since the publication of [2] the concept of water footprint has been widely studied in scientific literature. As [3] indicate, the water footprint is an indicator of freshwater use that looks at both direct and indirect water use of a consumer or producer. It can be distinguished between green, blue and grey water footprint. The green water footprint accounts for the rainwater stored in soil as moisture consumed when producing a commodity while the blue water footprint reflects the surface and groundwater evaporated in a production process. The grey water footprint can be also obtained, computing the water that would be necessary to assimilate a certain amount of pollutants. Initially, many of these studies tried to quantify the water footprint and virtual water trade flows of crop and livestock products at the global level [2,4,5,6,7], whereas others studied the water footprint of a specific product in a detailed way [8,9,10,11]. According to [3], the water footprint allows to quantify the volume of consumptive water uses, also showing explicitly the location where they take place.
As it has been previously stated, both the regional and the temporal dimensions are crucial in the analysis. Regarding the territorial dimension, our study examines the water footprint of crop production in Spain at the provincial level. In this respect, while most research on the water footprint has focused on the national or supranational level, some works are increasingly analyzing the water footprint at the regional or basin level [12,13,14,15,16]. For the particular case of Spain, quantifications of the water footprints can be found in [17,18,19,20].
In our view, studying the Spanish case at the provincial level is very interesting, since it allows distinguishing the water footprint of different areas, many of them, as we will see in the results, characterized by important divergences in terms of precipitations and aridity. In addition, the provinces in Spain also display notable differences on the physical determinants that make agriculture a profitable and efficient sector, such as hours of sunshine, soil characteristics, aridity, etc. Examining the water footprint of the Spanish provinces will enable linking the consumptive uses and the availability of water resources, as well as assessing the sustainability and economic costs of the Spanish agriculture, which tends to produce water intensive agricultural crops in the most arid areas in the country.
Regarding the historical approach, some papers have examined the main trends of the water footprint of the agricultural sector from a long term perspective [21,22,23]. For the particular case of Spain, evidence on the close link between the expansion of agricultural production, the growing pressures on water resources, the need for the construction of water infrastructure and the significant increase in the water footprint has been found in [21]. In this line, [24,25] highlight the effect of the growing Spanish international agricultural and food trade on the water footprint, particularly during the second half of the twentieth century. Between 1966 and 2008, about 60% of the increase in the blue water footprint was directly associated with the Spanish net trade balance according to [25]. This significant contribution was due to the export success of the Spanish food industry in these decades [26]. Accordingly, today Spain stands out as the seventh exporter of agri-food products in the world, reaching a share of 3.3% on global agri-food exports [27]. The substantial growth of the Spanish blue water footprint made necessary the construction of large waterworks. As a result, irrigated area increased almost threefold between 1955 and 2005–2010. Similarly, the share of crop production under irrigation went from being 43% on total production in 1955 to more than 65% in 2005–2010. Over 45% of the increase in agricultural production can be explained by the expansion of irrigated area during this period [1].
The third dimension of our analysis is the sustainability of the WF estimated. In this regard, water scarcity and sustainability indicators have been for a long time present in the literature, although perhaps improvements have appeared in terms of conceptualizing and identifying their dimensions, as well as in computation methods and tools. A common measure to characterize water scarcity has been the ratio of water use to water availability. [28] and [29] consider a country to be severely water stressed if the ratio of blue water withdrawal to renewable blue water resources is higher than 40%. There are also other measures of water scarcity one could refer to by dividing total water withdrawals by total runoff, with different names: Water Resources Vulnerability Index [30], the Criticality Ratio [31,32] and the Water Exploitation Index (e.g., [33]), where 40% is “the level at which blue water becomes critically scarce”. Introduced in [3] we can see some improvements to link scarcity indexes with WFs compared to much of the literature on water footprint. For scarcity measures the authors deal with the ratio of total blue WF to total renewable blue water resources, but also groundwater scarcity as the ratio of the blue WF from groundwater sources to renewable groundwater resources. In [34] the novelty is the introduction of benchmarks for crop production.
Most of these articles dealing with water scarcity indexes and indicators are reviewed for example in [35]. The water footprint manual [3] identifies three main dimensions of sustainability criteria for water, environmental, social and economic. The most commonly estimated dimension is the environmental one, and indeed most of the indexes identified in the paragraph above fall in this category. As explained in the Methods and Data section, we firstly analyze this dimension, focusing our contribution into its evaluation at the provincial level, and the comparison across the average of a dry year (2005) and a humid year (2010) with the year 1955, looking further into the challenges associated to a dry one as clearly the first one.
The social dimension, in which somehow the threshold suggested by [36] of minimum volumes considered reasonable of water use per capita, is however following [16] more related to allocation of water for “basic human needs”. Apart from the minimum allocation of water to food production—but which needs to be secured at global level—it relates most notably a minimum domestic water supply for drinking, washing and cooking. This dimension (probably also having less literature on standards and computation methods) is probably of less importance in the present time in Spain, since these activities are commonly considered to be ensured.
In the final part of the analysis, we will discuss about the third dimension, “economic sustainability”, addressing the fact that water needs to be allocated and used in an economically efficient way. In [36] the definition states that the benefits of a (green, blue or grey) water footprint that results from using water for a certain purpose should outweigh the full cost associated with this water footprint, including externalities, opportunity costs and a scarcity rent. If this is not the case, the water footprint is unsustainable.
In this matter, water management in Spain has been a fundamental part of economic development policy of the twentieth century, during which the number of dams increased from about 60 to over 1000. In particular, until 1955, about 4 dams were constructed per year, going from about 60 dams at the beginning of the century to about 270 in the mid-century. Since then (1955) the rate greatly accelerated, reaching an average of 20 dams per year to the existing current infrastructure [37]. In summary, a significant economic effort (mainly financed by the public sector) was undertaken to support the development of irrigation across Spain and to encourage its expansion along time [38].

3. Methodology and Data

In [6,39] the blue and green (and grey) water footprints of crop production (in volume per year, e.g., km3/year) are computed with advanced methods, accounting for several important issues (actual crop evapotranspiration, yields, rainfed and irrigated production). Then the green and blue water footprints of primary crops (m3/ton) for Spain (except the Canary islands, for which such data is not available in the above cited sources) are calculated by dividing the total volume of green and blue water use (m3/year), respectively, by the quantity of the production (ton/year). We use here those water intensities (m3/ton) for Spain as explained below.
The water footprint of primary crops by provincial level, for both the year 1955 and 2005 are calculated using data on crop production in physical units (tons) for each of the 50 provinces in Spain that stem from [40,41,42]. To estimate the changes in agricultural output we utilize data on crop prices in pesetas of 1975 also taken from [40,41,42]. The original water intensities (m3/ton) are provided by regional level (data for 16 of the 17 regions or Autonomous Communities of Spain excluding the Canary Islands) and are given by [6,39]. As important average improvements in the factors lying behind the virtual water content of crops (variations in irrigation techniques, in the share of crops, in the use of fertilizers…) happened between 1955 and 2005, we calculate variable water footprints considering changes in long-term crop yields. We perform an adjustment of the coefficients in line with [43,44], i.e., water coefficients have been adapted depending on the long term yield change from 1955 to 2005, as expressed in Equation (1):
w c p t = w c p × Y c p Y c p t
with w cpt , the water coefficient for each product in 1955 (t = 1955), w cp represents the crop water intensity for the average period 1996–2005 given by [6,39]. Y cp represents the average crop yield of the reference period (1996–2005) considered by the above authors and Y cpt is the yield in year t for each product. The adaptation of the water footprints according to Equation (1) has been carried out for the years 1955 and 2010, i.e., t = 1955 and t = 2010.
Equation (1) builds variable crop water footprint series on the basis of changing yields in the long term. However, it is important to note that crop water use (evapotranspiration in m3/ha) is assumed to be constant from 1965 to 2010. As [45] show evapotranspiration under non-optimal conditions depends on climatic parameters, crop characteristics, and management and environmental conditions. Whereas they assume crop characteristics to be static climatic, environmental and management conditions changed between 1965 and 2010 in Spain, entailing an important source of uncertainty. Given the impossibility of obtaining accurate water requirements for every crop and province during the period studied, we examine long-term evapotranspiration series in Spain from 1940. The econometric analysis (graph analysis, range-mean analysis, correlogram and Kwiatkowski–Phillips–Schmidt–Shin (KPSS) test) shows evidence of the stationarity of evapotranspiration series in Spain in the long turn. Accordingly, assuming constant crop water use (blue and green) involves uncertainty, but it does not seem to introduce an important bias in the results (given the relatively stability in crops regimes in Spain). For a detailed analysis of this issue see [24].
Equation (1) involves a decreasing, convex with respect to the origin, and hyperbolic relationship. It entails the virtual water content gradually declining as crop yield increases. This is an approach in which a dynamic, inverse, and nonlinear relationship between crop yields and virtual water content is assumed (see [25] for a discussion on the topic). Note that for reasons of data availability we have assumed the yield for 1955 to be the one of 1961. This is not a strong assumption since yield changes between 1955 and 1961 were not very important for most crops produced in Spain [40,41,42]. Finally, data on crop yield at the national level have been taken from the UN Food and Agriculture Organization [46]. Regarding the choice of the year 1955 for our analysis, we are quite confident on the representativeness of the year 1955, which can be considered as a regular year in climatic and economic terms. The production of 1955 was only 1.9% higher than the average of the years 1953–1957 [47].
The second part of results deals with the water scarcity measures at the provincial level. Ideally, one may like to calculate the overall water scarcity on annual basis as the ratio of total blue WF to total renewable blue water resources. Also it is interesting to define water scarcity based on blue water consumption (blue WF) rather than blue water withdrawal, which is more meaningful, because a significant share of withdrawn water returns to rivers and aquifers and becomes available for reuse [48]. Our best estimates on water availability are derived from total run-off, and so we start by obtaining as sustainability indicator, or better said, water stress, the ratio of the total provincial green and blue water (consumption) footprints of production to the total provincial run-off. It should be noted that 2005 was a year with low precipitations, resulting in a water footprint about 63 km3/year, whereas our estimations for other humid years in the first decade of the twenty-first century range between 70–85 km3/year. However, once appreciated these differences, due to the fact that precipitations and run-off fall proportionally more than the fall in agricultural production and in water footprint, the risks to water sustainability are even clearer for this dry year which we decide to focus on. When an average year the total run-off in Spain is about 110km3/year (see [4,5,49]), the run-off of the year 2005 is of 63km3/year, if we compute it from [50,51]. This means that our analysis of sustainable indicators shows better the critical ratios that might be obtained in such a year, and the sustainability bottlenecks. The total run-off of the year 2010 was above 170 km3/year if we compute it from the same references, so as for a particularly rainy year, the sustainable indicators are not so worrisome for that year, and an average of the 2005–2010 provides the sustainability indices of a quite average year. The average Spanish agricultural production in 2005 and 2010 was only 1.4% lower than the average of the years 2005–2010.
Regarding the method for computing the provincial run-off, we depart from raster data (1 km by 1 km) on precipitation, potential and real evapotranspiration, and ultimately run-off raster data in Spain [52], which we aggregate at the provincial level with the provinces boundaries (layer) in ArcGIS. Then for the autonomous regions which match a catchment (the islands regions) we correct for the marginal difference between the total that we had on total run-off at the catchment (keeping this value) and the aggregate volume obtained by province.
The above run-off could be called “natural water resources run-off (availability)”. In a second estimation, as a second water stress indicator, we obtained the Potential Availability of Renewable Water Resources (PARWR), firstly obtained at the catchment level, where we consider the potential water availability, departing from the above run-off in tas in Equation (2):
PARWR = Natural run-off – Environmental and international agreements reserves + reuse and desalination ± Water transfers
This run-off then accounts already for the fact that some water cannot be used for economic purposes due to necessary environmental reserve, to necessary minimum flows flowing internationally (to Portugal), and to the water transfers and the reuse and desalination. In particular here, some of the info is obtained at the catchment level, as also gathered in [53] following other works of the Ministries of Agriculture, Food and Environment. The most important query/algorithm is run for the necessary environmental reserve (assumed at the 10% of the natural flow, see [53]) and the necessary minimum flows flowing internationally (to Portugal, [54]). In these cases the apportioning of the reduction of availability of water (which we know at each of the 25 catchments) is done proportionally to the natural run-off in each of the cells in the catchment (i.e., the availability is reduced in the same proportion in each cell of the catchment). We do this for all the catchments, since many provinces are affected by several catchments, and then we aggregate the cells again by province, with the volumes of the Natural run-off – Environmental and international agreements reserves.
Regarding the water transfers, we get the shapefile from [51,54] and we know the specific departure and endpoints, so we can assign them by province, with complementary information on the volumes of water transfers. The interbasin transfers aggregate figures in the country are known [51,52], and simple illustrative representations show how more than a third take place in the major transfer of the Tajo-Júcar-Segura and also almost another third depart from the Ebro Basin, while the rest of the relatively minor transfers occur in the Guadiana, Guadalquivir. In general the algorithm runs to assign the losses and gains of that water is essentially an interpolation from the point of transfer (departure or endpoint), distributing part of the decrease or increase respectively to the downstream flow of the hydro network. A higher weight is provided to the point of transfer, under the assumption that the most affected provinces are those directly transferring or receiving water.
Finally, for the reuse and desalination, we have spatially located both types of plans, respectively the wastewater treatment plants (EDAR) associated with urban agglomerations and the desalination plants [53,54,55,56,57]. We make an apportioning (based on the capacity of the plants falling within the catchment boundary/shapefile) of the volumes by province from the data we departed from of reuse and desalination by catchment.
For the sustainability indicators, as summarized in the literature review on water scarcity and sustainability indicators, a usual classification based on the water uses (usually not accounting for green WFs in the numerator), has been the water uses to availability ratio, looking at the row “Thresholds for natural run-off” shown below in Table 1. We compare our results of the blue WF to water availability (natural run-off) ratio with those ranges. When recognizing also the environmental water requirements (EWR), which are subtracted from the natural run-off, according to [57], the WSI thresholds characterize the degrees of environmental water stress of water areas as shown at the row “Thresholds accounting for EWR”. We compare our results of the blue WF to potential water availability (PARWR) ratio with those ranges.
Table 1. Water scarcity levels and thresholds.
Water scarcity levels (natural)LowModerateSignificantSevere
Thresholds for natural run-off<20%20%–30%30%–40%>40%
WSI levels (exploited degrees)SlightlyModeratelyHeavilyOver (exploited)
Thresholds accounting for EWR<30%30%–60%60%–100%>100%
Source: The WSI thresholds “accounting for EWR” are obtained from [57]. For the usual thresholds for natural run-off one can see the same article, or those on the Water Resources Vulnerability Index [30] Criticality Ratio [31,32], Water Exploitation Index (e.g., [33], or a summary of them, in [18]).
We do not estimate an indicator of the environmental sustainability of the green WF, defined as the ratio of the green WF to green water availability (see [3]), mainly due to the lack of information on the environmental green water requirement (also partially of the evapotranspiration from land that cannot be made productive) to estimate this denominator. Finally, we approximate to economic costs considering the evolution in the stock of capital devoted to hydraulic infrastructures in this period and its spatial distribution [58].
We use the register of dams, distinguishing by their main and secondary uses (irrigation, hydroelectricity, flood control, water supply, recreation and others). These data have been obtained from [59,60]. In order to allocate the corresponding costs of dams to the agricultural water footprints, we selected the dams used only for irrigation and those with a capacity over 10 hm3 that can be used for irrigation, among other uses.

4. Results

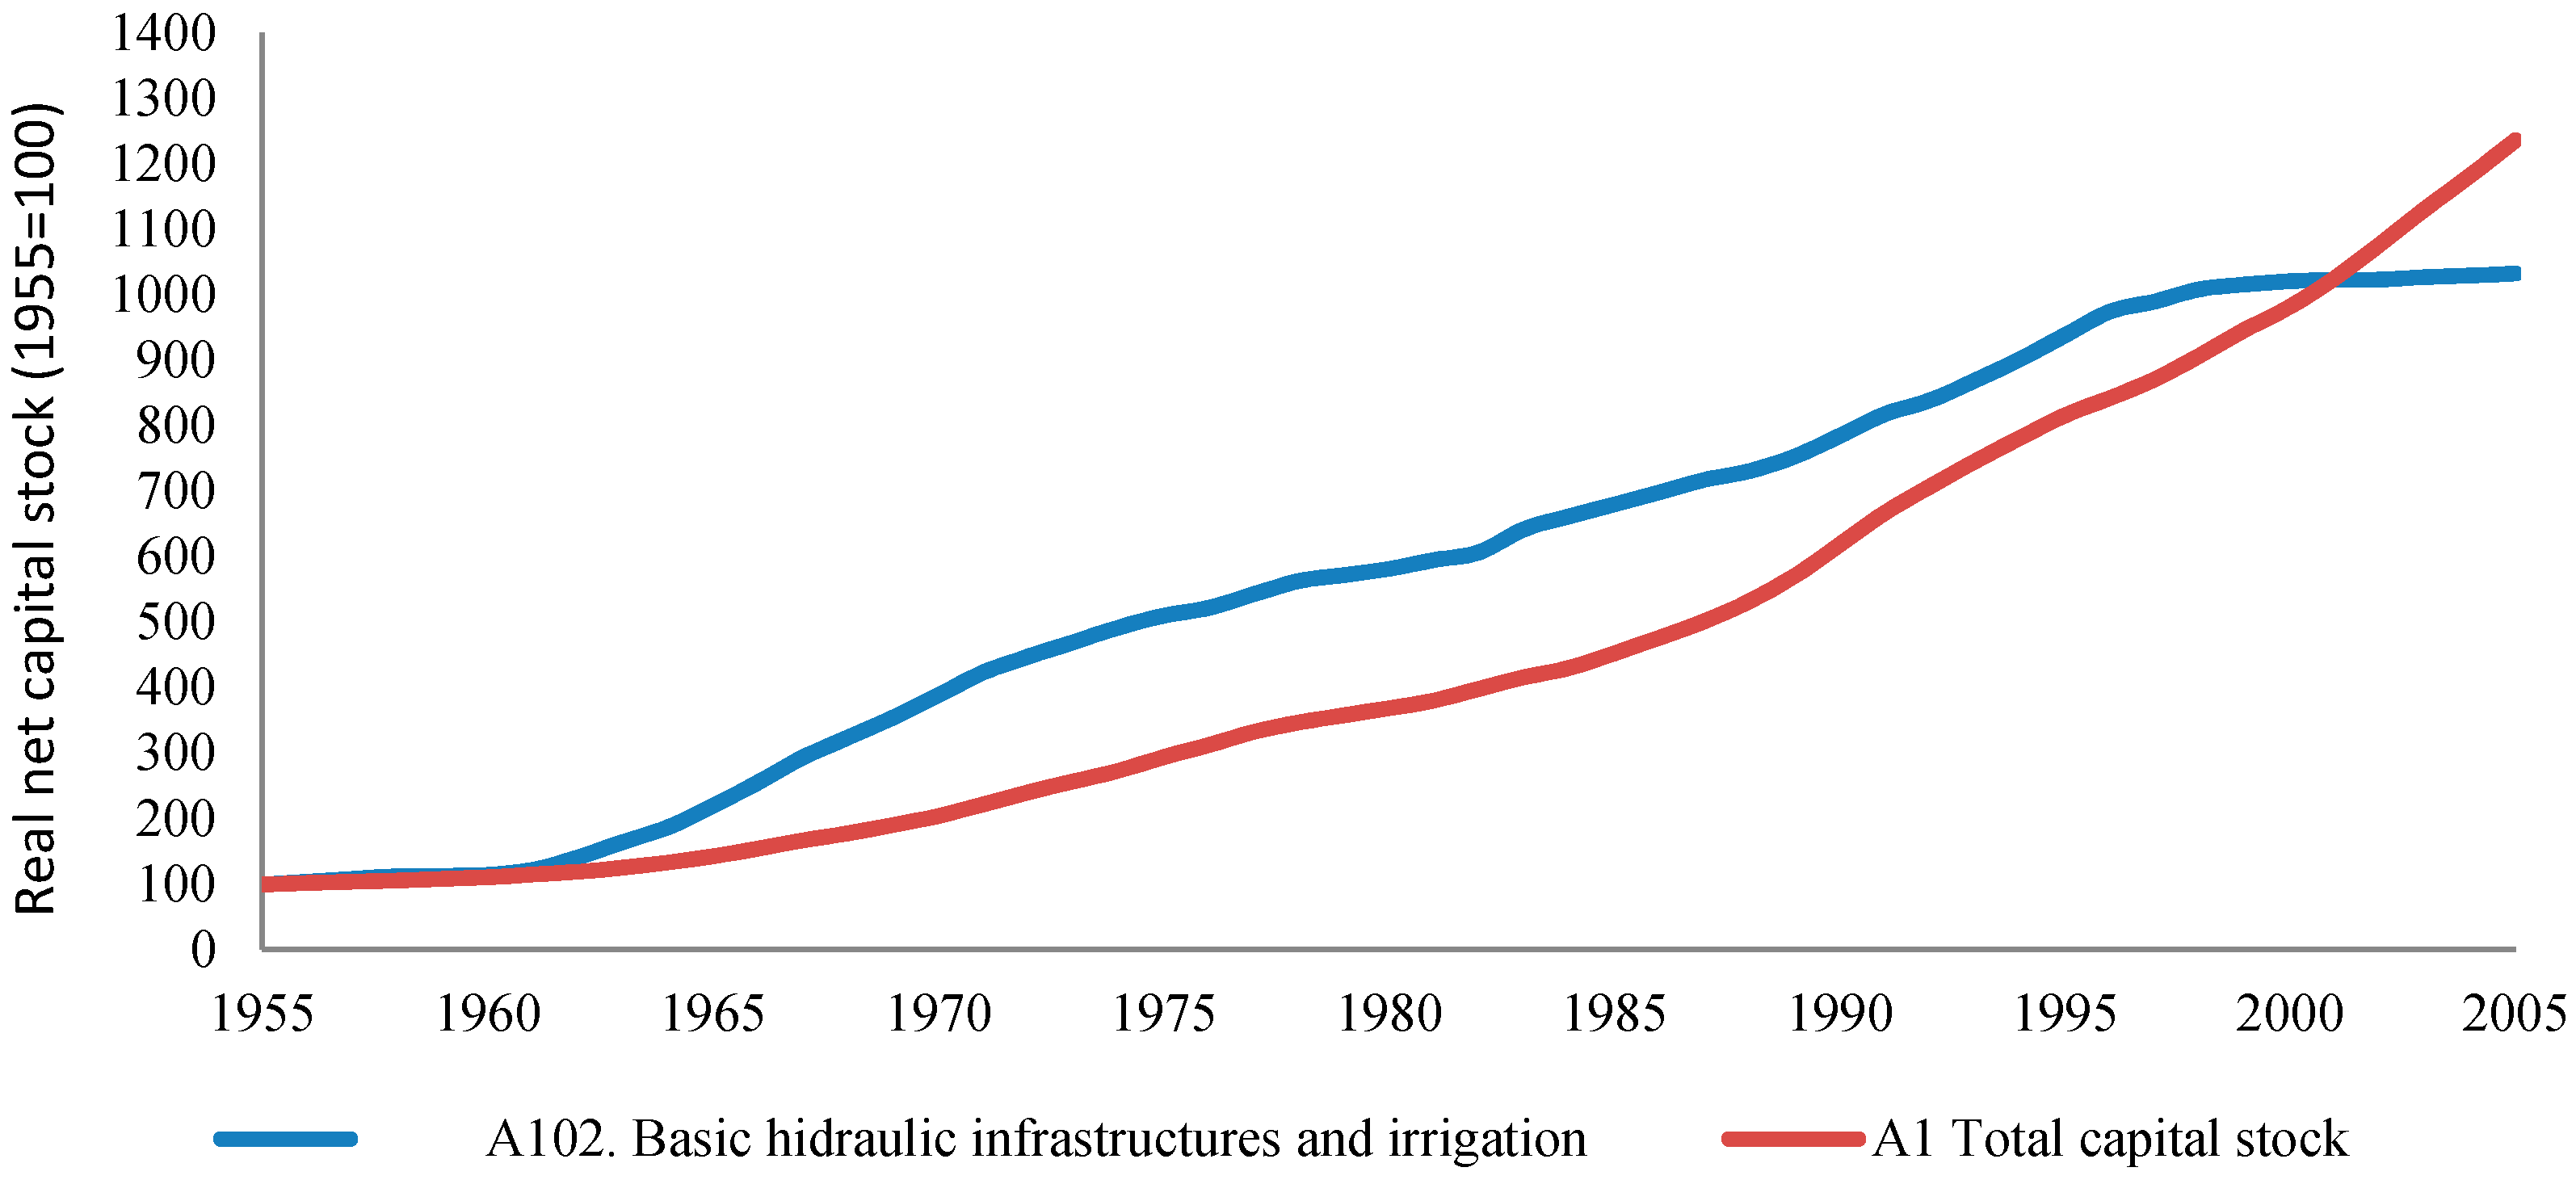
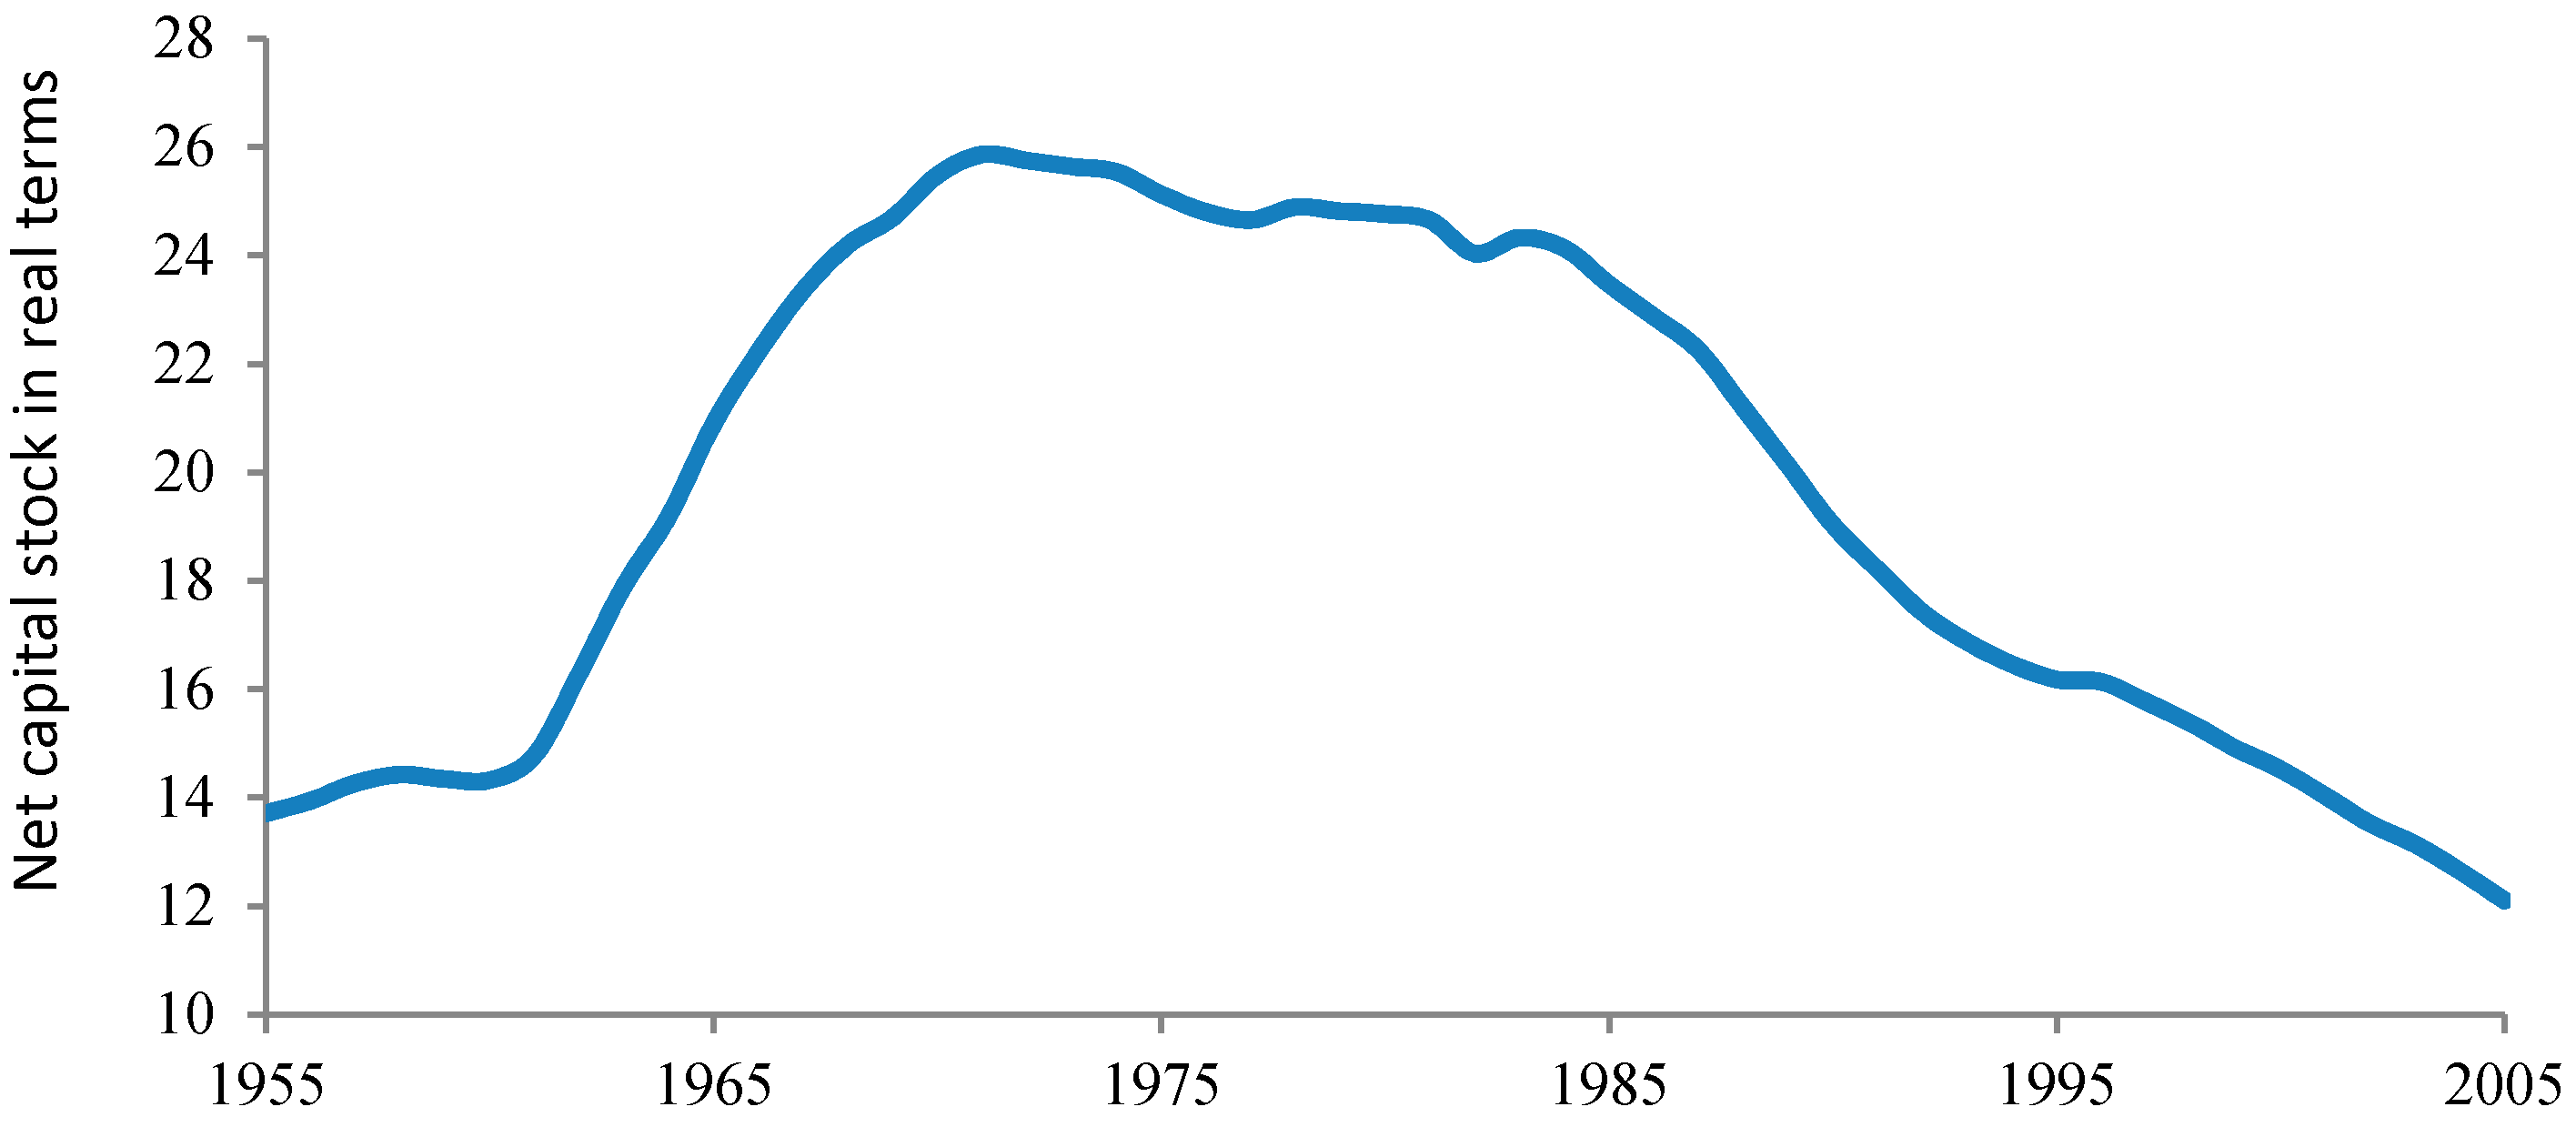
4.1. The Evolution of Provincial Water Footprints between 1955 and 2005

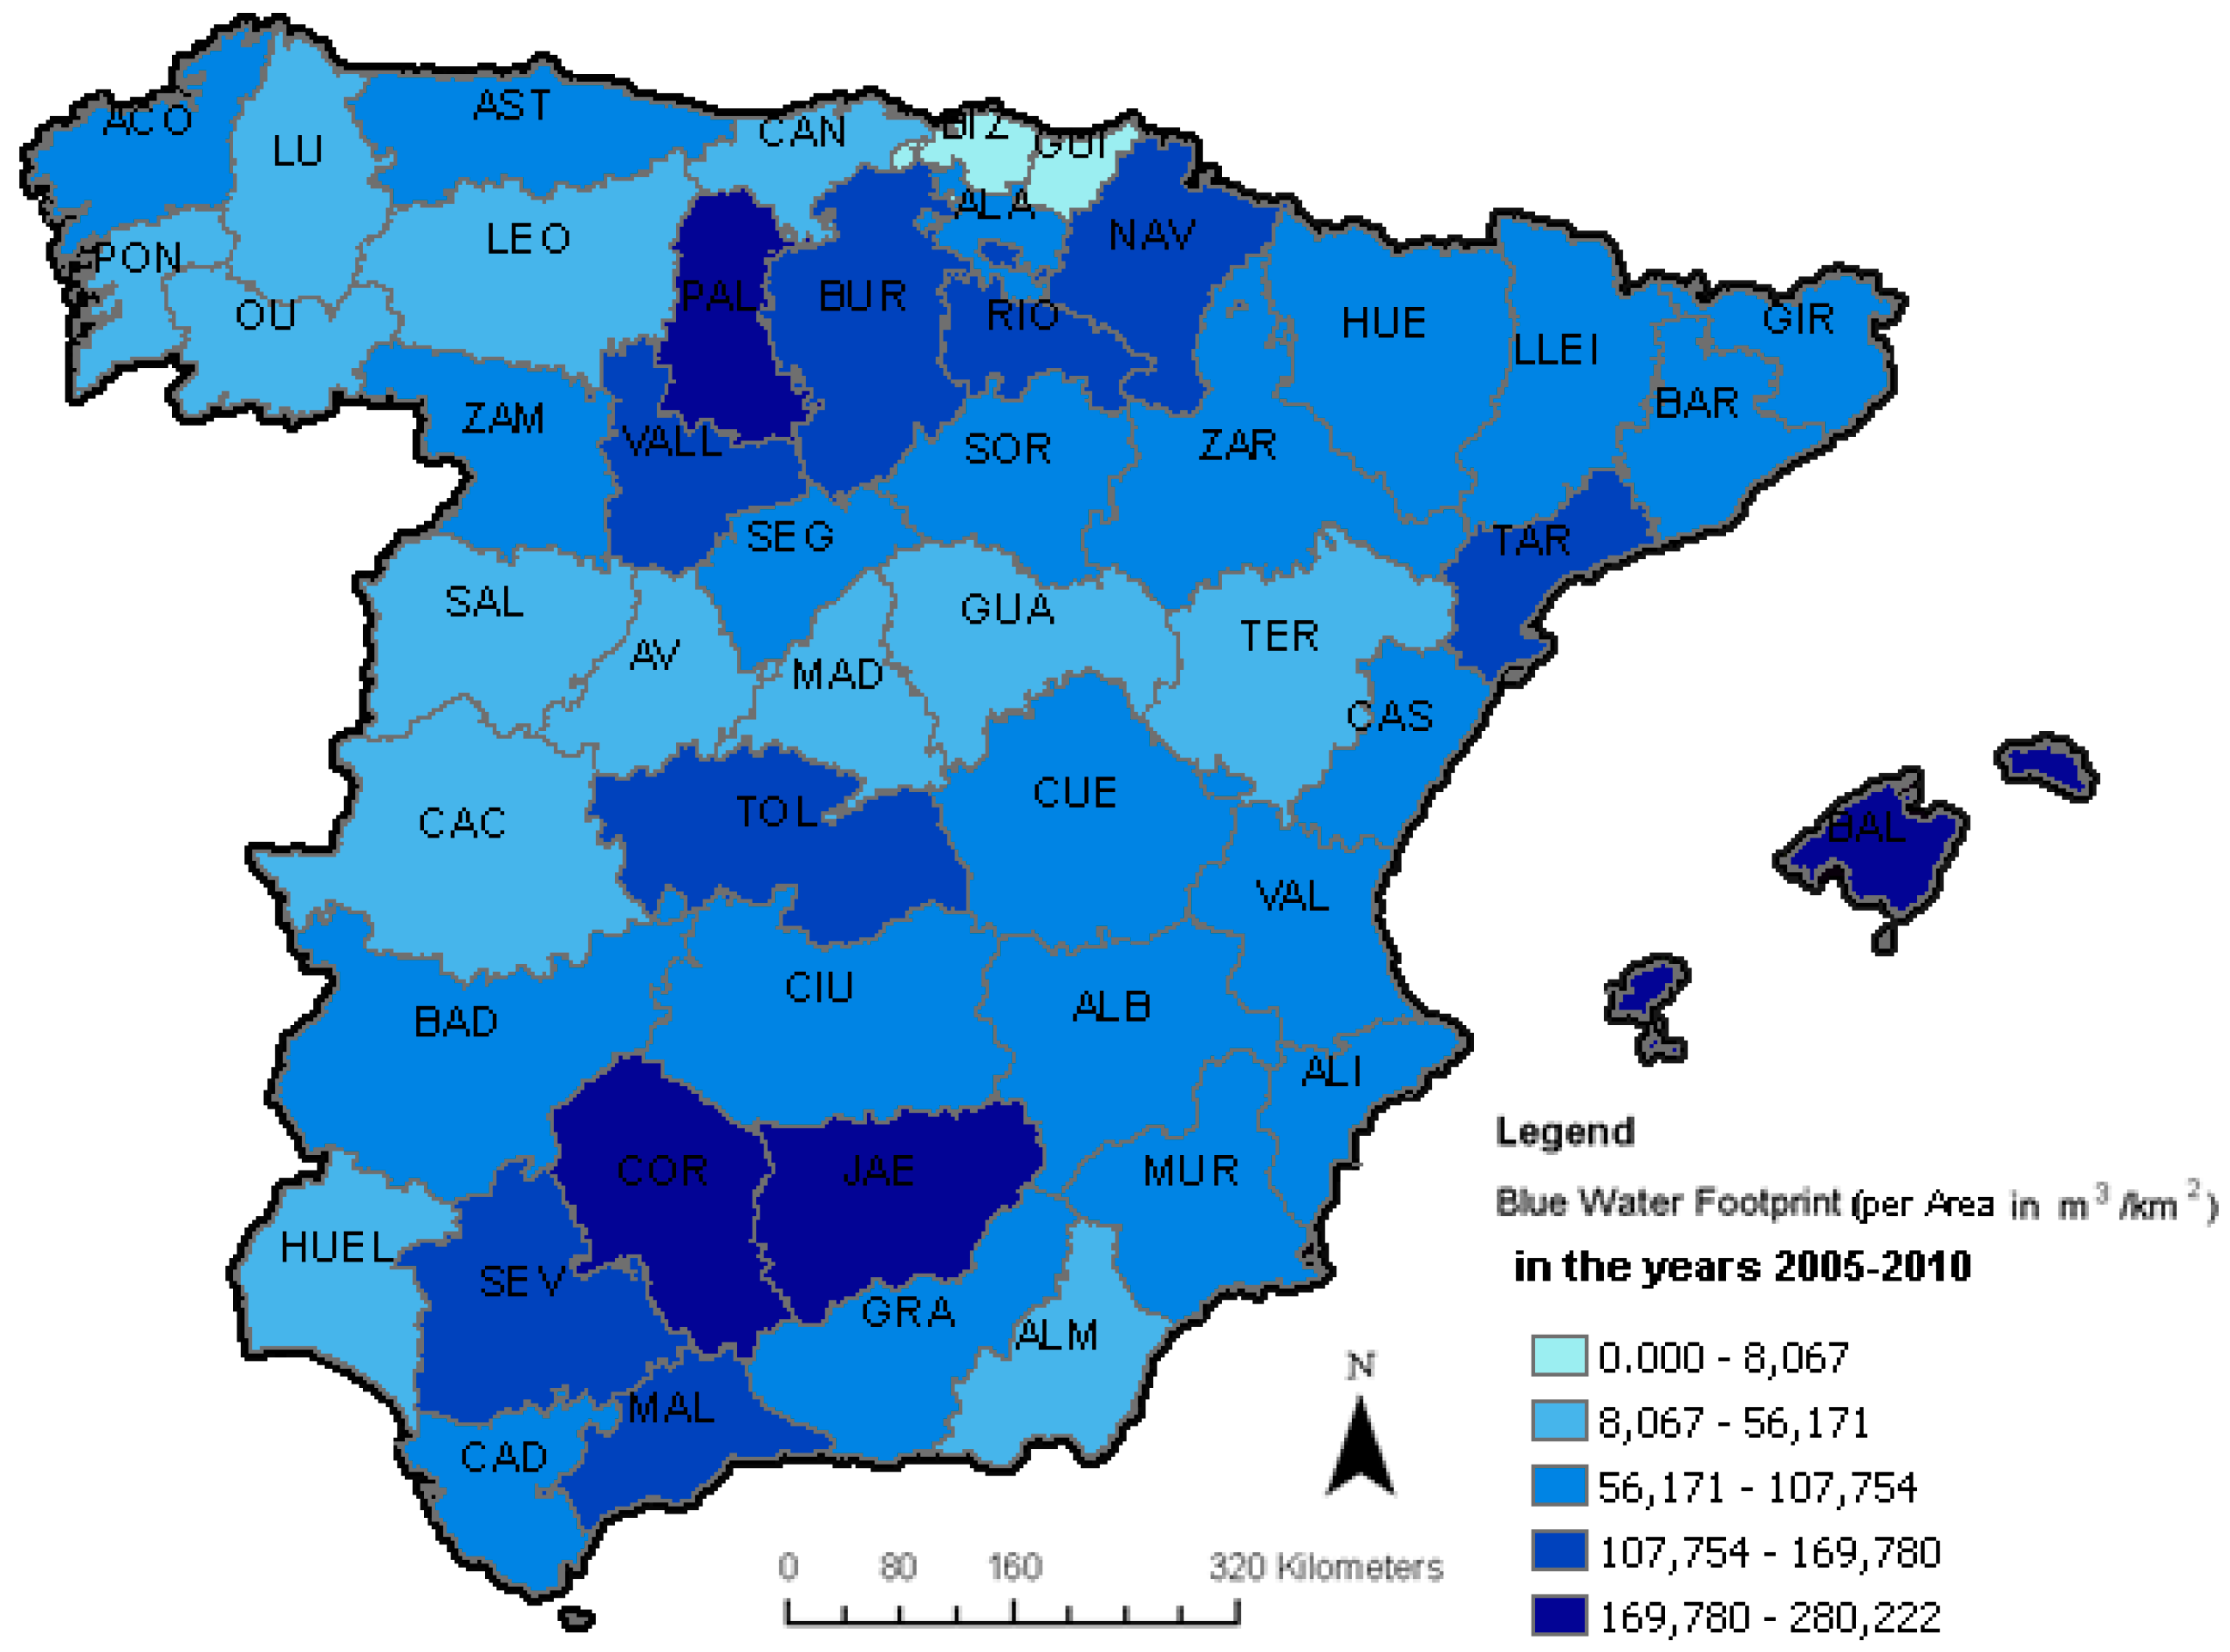
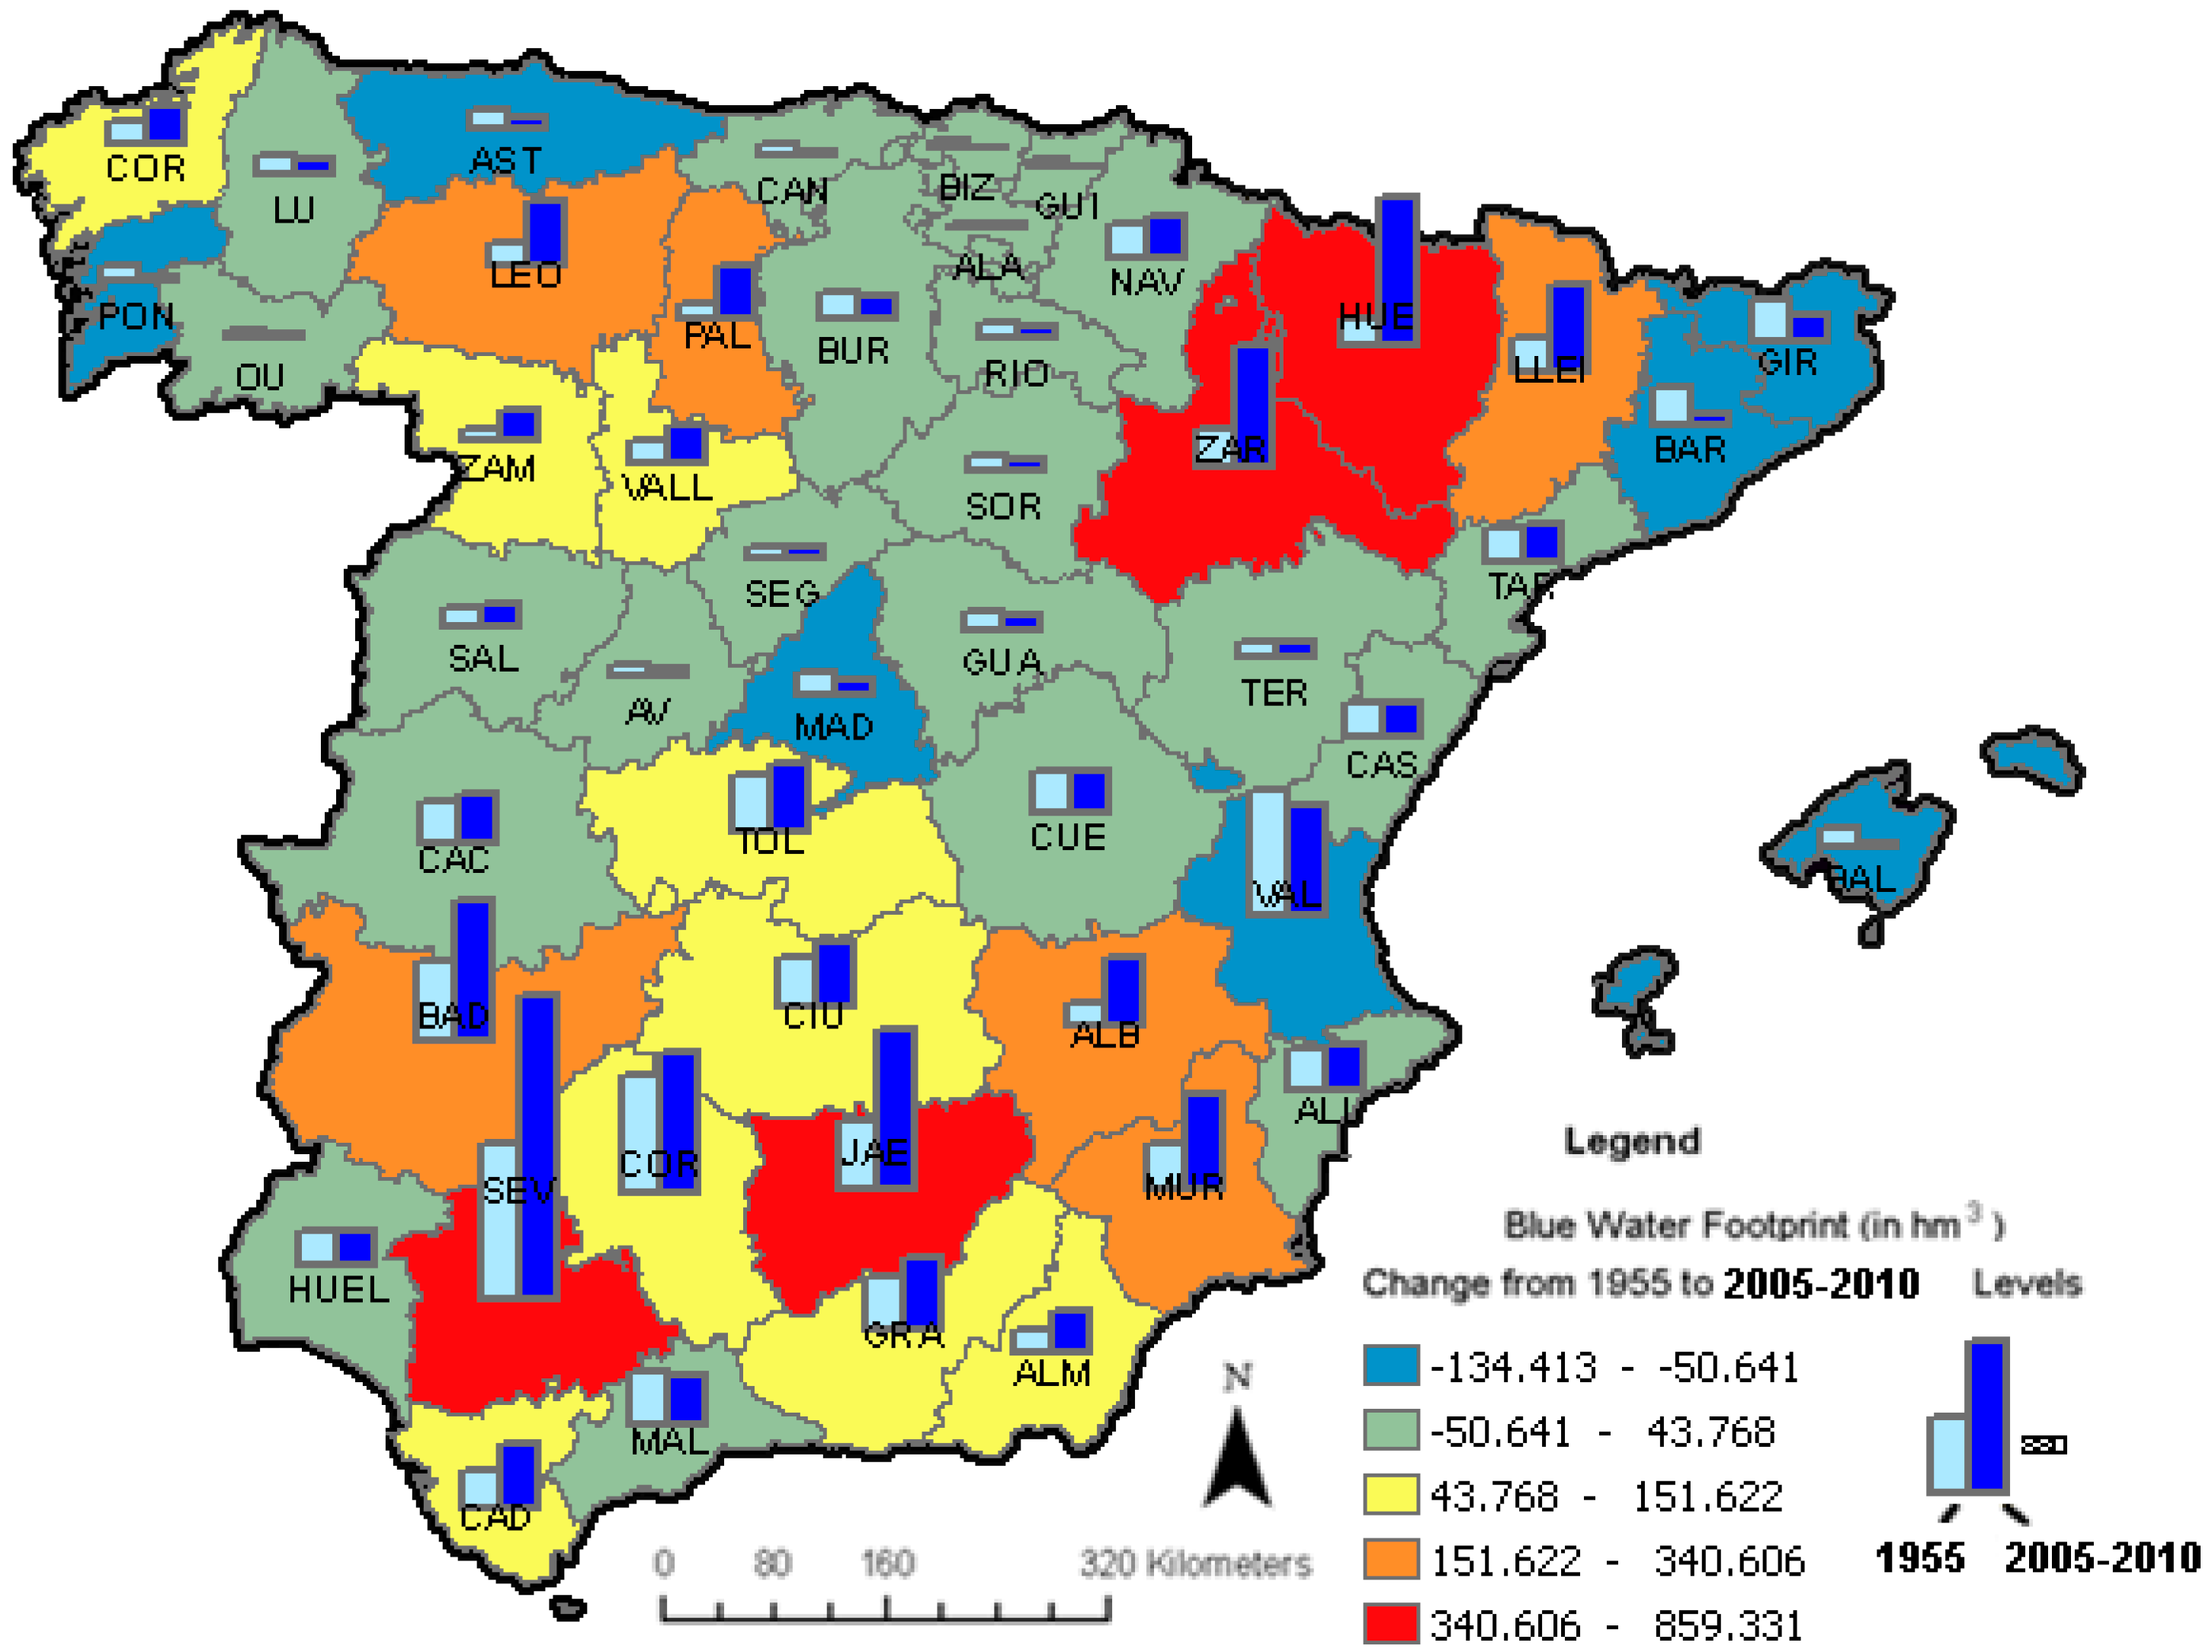
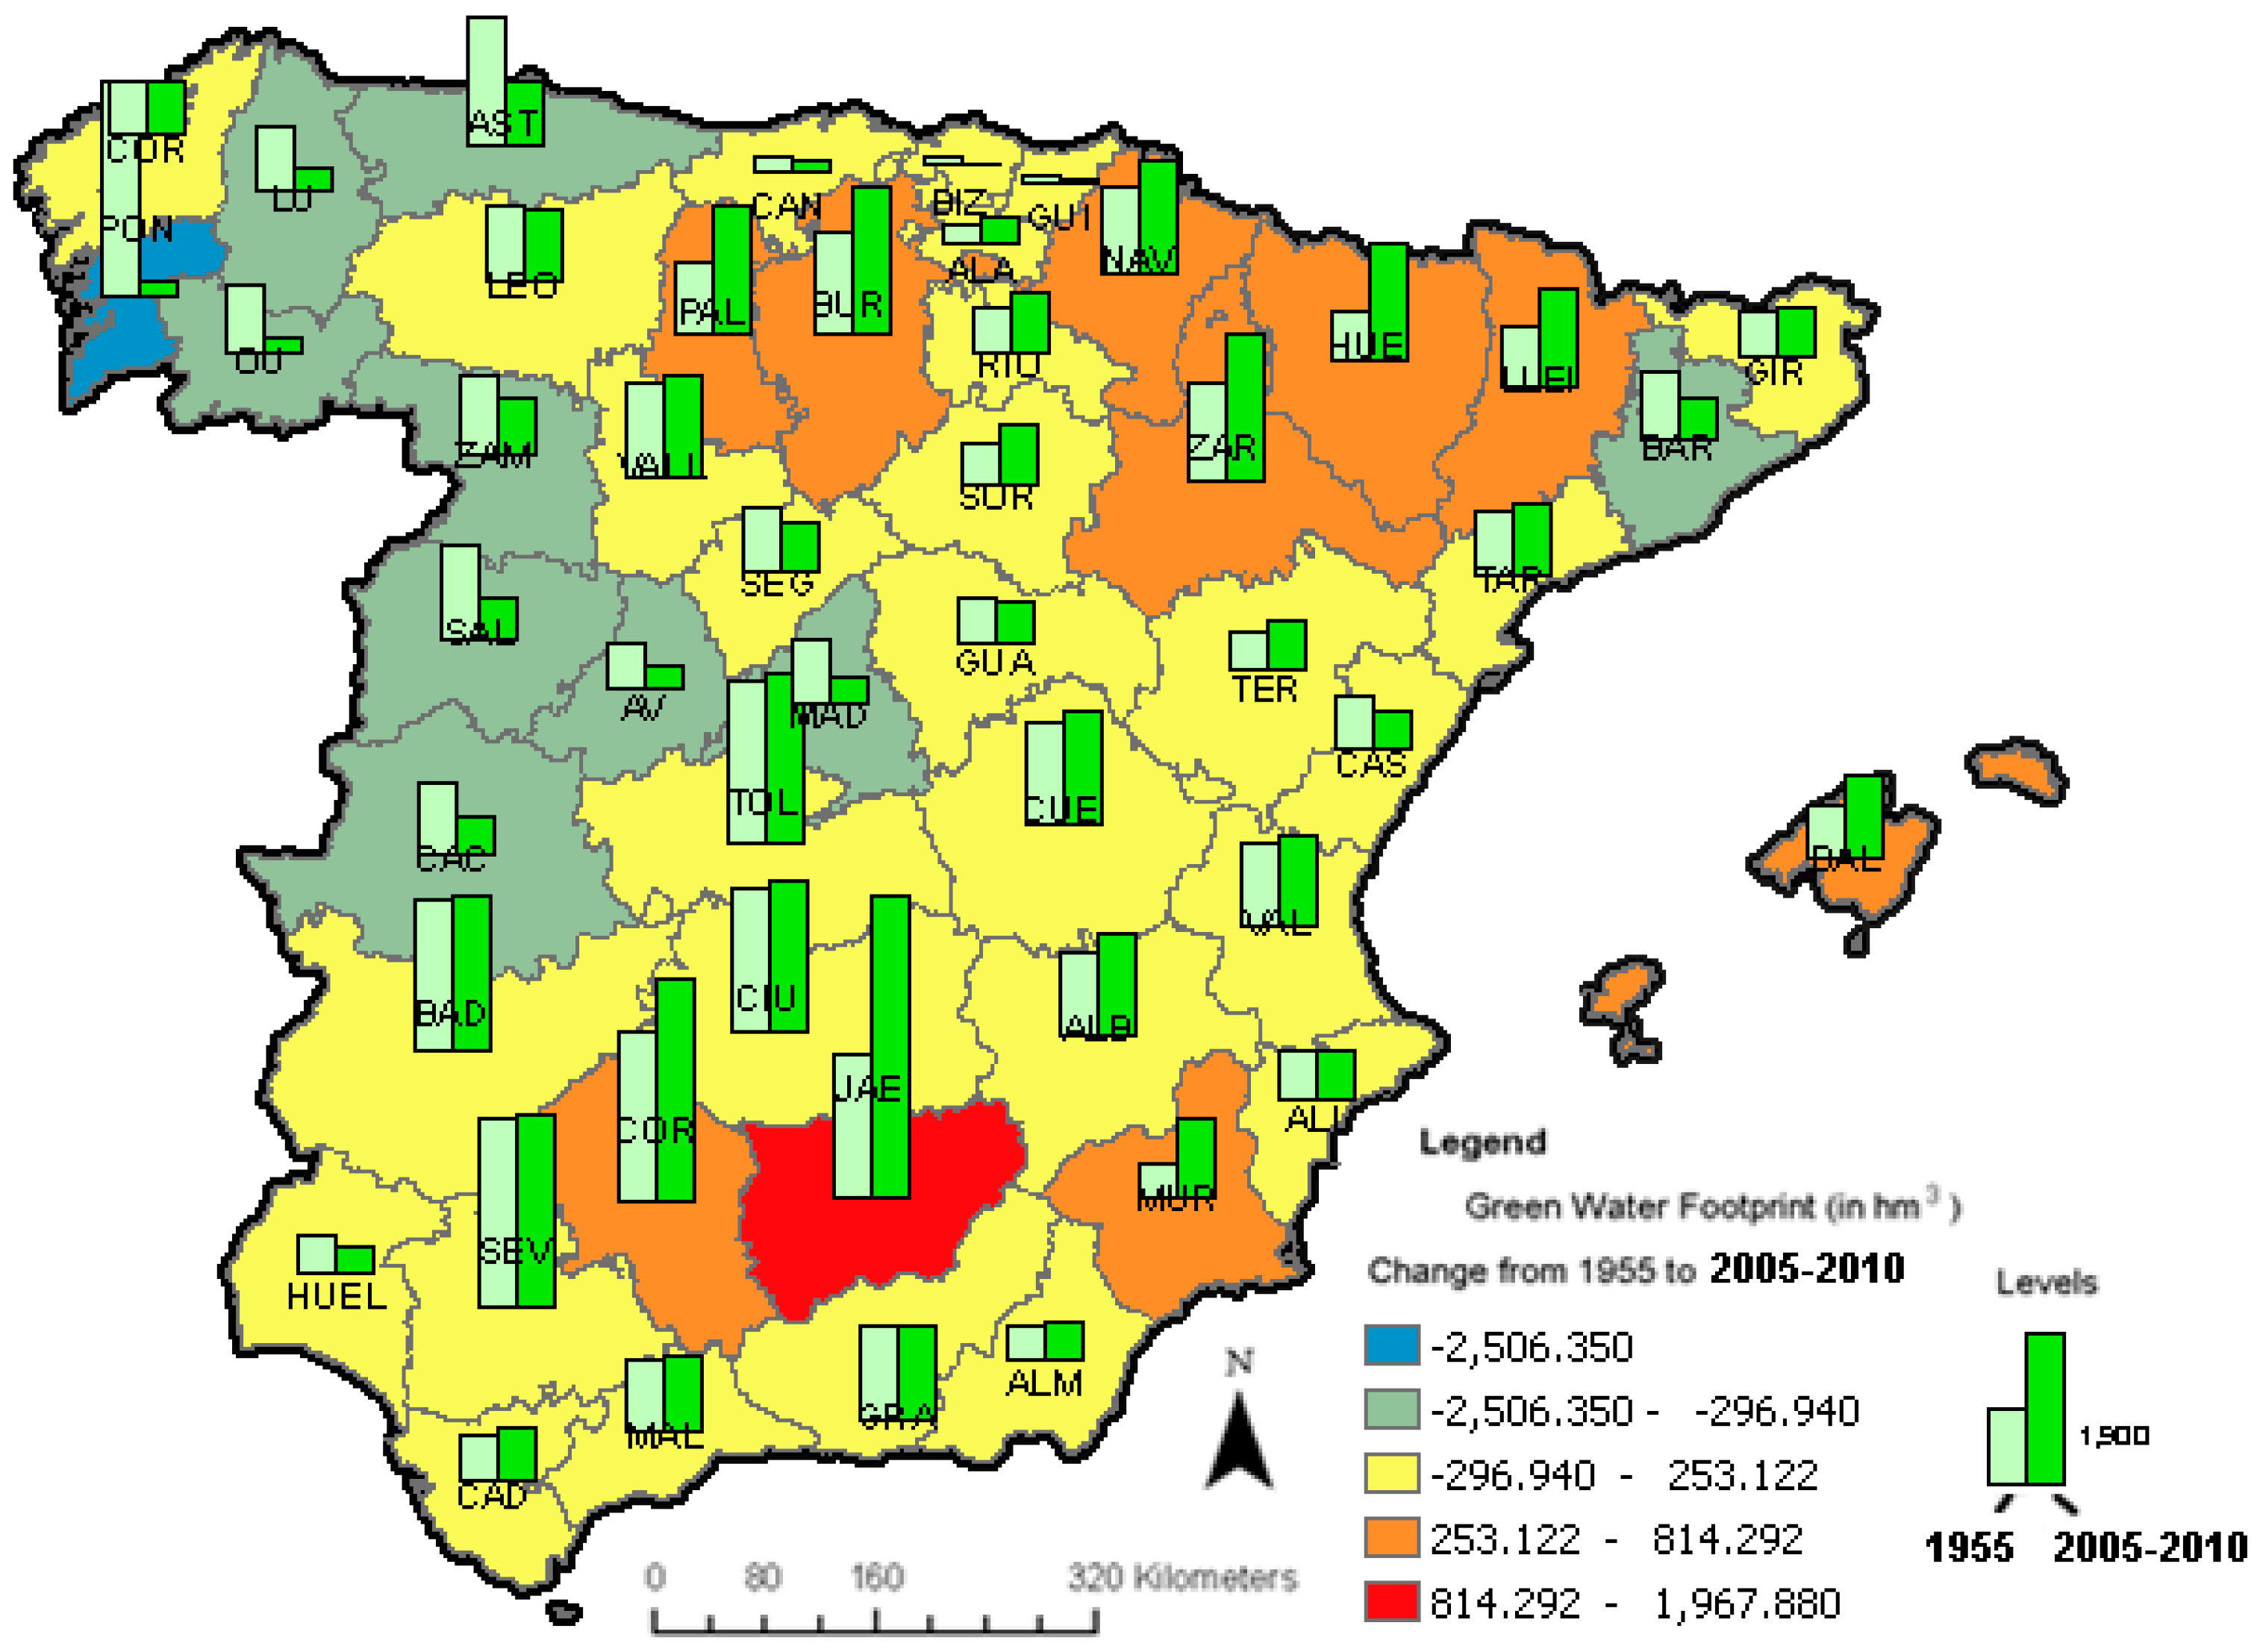
4.1.1. Blue and Green WFs Variations (Water Volumes)

The blue water footprint of agriculture notably increased in the second half of the twentieth century, rising over 5000 hm3 (Table 2), from 9.7 km3 in 1955 to 14.25 km3 in 2005–2010 (14.1 km3 for the dry year 2005 and 14.3 km3 for the humid year 2010, estimated with updated water coefficients for both years as described in section 3 of Methodology and Data). The construction of irrigation infrastructures, especially intense in the 1960s during the Franco’s dictatorship, was determinant to encourage this increase. The growth of the blue water footprint happened for most groups of products, with the exception of legumes and tubers. However, most of the increase in the blue water footprint was concentrated in fodder crops, fruit trees, horticultural and olive products.
As illustrated also in Map 1, and Map S1 in the Supplementary information, geographically the distribution of the blue water footprint in Spain was very unequal, since more than 75% of the blue water footprint took place in the provinces with a low and very low rainfall level per year (less than 600 mm/year). That is, the most arid areas in Spain consumed a large share of blue water, both in 1955 and 2005–2010. This concentration was more intense observing the group of provinces with very low rainfall (just five in a set of fifty). These areas -Almeria, Murcia, Alicante, Albacete and Valencia, all located in the southeast of the Iberian peninsula- accounted for 15% of the blue water footprint of agricultural production throughout the period (see Tables S1 and S2 in the Supplementary information). It is striking how the share of the driest areas remained constant in the blue water footprint. Finally, whereas the intermediate rainfall group (rainfall ranging from 600 to 900 mm/year) increased its weight, we observe a decrease in the blue water footprint of the high rainfall provinces (rainfall higher than 900 mm/year).
Table 2. Blue water footprint (BWF) 1955 and 2005–2010 (absolute numbers and percentages).
BWF 1955 (hm3)BWF 2005–2010 average (hm3)Change in BWF 1955 to 2005–2010 (hm3)Share 1955 (%)Share 2005–2010 average (%)
Very Low Rainfall Provinces (x < 400 mm)1513208857515.614.6
Low Rainfall Provinces (400 < x < 600 mm)59518687273661.261.0
Intermediate Rainfall Provinces (600 < x < 900 mm)16733027135417.221.2
High Rainfall Provinces (x > 900mm)586450−1366.03.2
Spain972314,2524529100100
Source: The data on agricultural production come from [40,41,42]. The coefficients to calculate the WFs come from [6,39]. The level of rainfall is an average of annual rainfall in the period 1982–2002 [60].
Map 1. Provincial blue WFs of production in 2005–2010, divided by the surface area of the province (m3/km2). Method of ranges division: Natural breaks. List and code of provinces: ALB: Albacete, ALI: Alicante, ALM: Almería, AV: Ávila, BAD: Badajoz, BAL: Baleares, BAR: Barcelona, BUR: Burgos, CAC: Cáceres, CAD: Cádiz, CAN: Cantabria, CAS: Castellón, CIU: Ciudad Real, COR: Córdoba, ACO: A Coruña, CUE: Cuenca, GIR: Girona, GRA: Granada, GUA: Guadalajara, GUI: Guipúzcoa, HUEL: Huelva, HUE: Huesca, JAE: Jaén, ALA: Álava, LEO: León, LLEI: Lleida, LU: Lugo, MAD: Madrid, MAL: Málaga, MUR: Murcia, NAV: Navarra, OU: Ourense, PAL: Palencia, PON: Pontevedra, AST: Asturias/Oviedo, RIO: La Rioja, SAL: Salamanca, SEG: Segovia, SEV: Sevilla, SOR: Soria, TAR: Tarragona, TER: Teruel, TOL: Toledo, VAL: Valencia, VALL: Valladolid, BIZ: Vizcaya, ZAM: Zamora, ZAR: Zaragoza. Source: Own elaboration.
Sustainability 07 05094 g003
The provinces with the lowest precipitation levels (less than 600 mm/year) produced in 1955 more than 90% of the total blue water footprint of the fruit trees, 80% of the horticultural products, and almost the totality of the olive products. These provinces even produced 53% of fodder crops, products that were not grown under rain-fed conditions in a great part of Spain. In 2005–2010, the picture was quite similar. 90% of the blue water consumption to grow fruits and the totality of olive products took place in areas with less than 600 mm. of precipitation per year. The blue water footprint of horticultural products was more concentrated in the lowest rainfall provinces, reaching 93% in 2005–2010. At least, the percentage of the blue water footprint of fodder crops in water scarce provinces diminished until 36%. In return, the highest rainfall provinces lost importance in all the groups of products. Only, the blue virtual water of fodder crops remained in these areas, showing 13% of this footprint. Map 2 summarizes the change between 1955 to 2005–2010 average in the absolute blue WF of production.
Map 2. Change between 1955 and 2005–2010 average in absolute Blue WF of production (hm3). Note: The colour of the provinces shows the (positive or negative) change in Blue WF, while the blue bars represent the levels of 1955 and 2005 Blue WFs. Method of ranges division: Natural breaks. Source: Own elaboration.
Sustainability 07 05094 g004
According to our figures, the green water footprint of agricultural production in Spain slightly increased from 46 km3 to about 47.5 km3 between 1955 and 2005–2010 (Table 3), but the yearly variability is higher than for blue water footprints (nearly 41 km3 for 2005 and 54 km3 for 2010, estimated with updated water coefficients for both years as described in section 3 of Methodology and Data). The fall was concentrated in the less arid areas of the country, that is, in those with a level of rainfall higher than 900 mm/year. Whereas in 1955 the green water footprint of production of the provinces with low or very low precipitation levels in Spain represented about 63% on total green water consumption, it entailed 70% in 2005–2010. This increase was made up for the loss of weight of high rainfall provinces (from 15% to 5% of green water consumption).
Within humid areas in Spain (rainfall levels higher than 900 mm/year), the most significant drop in agricultural green water consumption happened in the North-West regions as Pontevedra, Oviedo (Asturias), Orense and Lugo (see Tables S3 and S4 with provincial detail). It was associated with the decline of the production of fodder crops as well as of green water intensive cereals as rye. In the case of average rainfall provinces, green water consumption remained quite stable from 1955 to 2005–2010. Nevertheless, this group is quite heterogeneous and it is possible to find provinces where green water consumption notably declined as Salamanca and Zamora as a result of the fall in the production of cereals, as well as others where green water consumption rose like as Lerida, Huesca and Palencia.
Table 3. Green virtual water (GWF) 1955 and 2005 (absolute numbers and percentages).
GWF 1955 (hm3)GWF 2005–2010 average (hm3)Change in GWF 1955 to 2005–2010 average (hm3)Share 1955 (%)Share 2005–2010 average (%)
Very Low Rainfall Provinces (x < 400 mm)357845589807.79.6
Low Rainfall Provinces (400 < x < 600 mm)25,71828,728301055.460.5
Intermediate Rainfall Provinces (600 < x < 900 mm)10,07911,907182821.725.1
High Rainfall Provinces (x > 900mm)70222323−469915.14.9
Spain46,39747,5151118100100
Source: The agricultural production data come from [39,40,41]. The coefficients to calculate the WFs come from [6,39]. The level of rainfall is an average of annual rainfall in the period 1982–2002 [60].
As for low rainfall areas, on the one hand a decline in the green water footprint of production took place mostly in regions in the center of Spain as Madrid, Valladolid and Avila and was closely link to the fall of the production of cereals as wheat and rye. On the other hand, the green water footprint of production experienced a sharp increase in other semi-arid provinces as Zaragoza (in the center of the Ebro valley). In this case, the virtual water of wheat and rye also experienced an intense deceleration. However, it is possible to observe a substitution of the production of cereals mainly for fodder crops, but also for no citrus fruits and nuts, entailing a growing consumptive use of green water. Although provinces as Jaen and Cordoba (in the south of Spain) decreased the production of cereals as wheat and barley, green water footprints kept growing as a result of the large increase in the production of olives for mill. In particular, Jaen appears as a clear outlier that drives the increase in green water footprint. Quite the opposite, the fall of cereals production was so intense in Granada that totally offset the boost of olives production making green water footprint to fall.
Paradoxically, the largest increase in the green water footprint took place in the most arid regions located in the South-East of Spain (rainfall lower than 400 mm/year). It is noteworthy the case of Murcia, that experienced an important increase in the green water footprint. In this area cereals production was replaced by the growth of green virtual water of nuts (mainly almonds), non-citrus fruits as peaches, apricots and grapes and citrus fruits. Map S3 in the Supplementary information shows the provincial green WFs of production of the region relative to the surface area in 2005–2010 (m3/km2), while Map S2 in the Supplementary information displays these absolute values per province. Map 3 shows the change between 1955 and 2005–2010 of the absolute green WFs of production.
Map 3. Change between 1955 and 2005–2010 average in absolute Green WF of production (hm3). Note: The colour of the provinces shows the (positive or negative) change in Green WF (larger ranges than for blue water), while the blue bars represent the levels of 1955 and 2005–2010 Green WFs. Method of ranges division: Natural breaks. Source: Own elaboration.
Sustainability 07 05094 g005
As estimated for the crops water footprints as well by [20] (see their Figure 5.3; not as much in the estimates for the whole agrarian, see e.g., Figure 5.4), the year 2005 is relatively low in precipitations, with a green water footprint lower than the surrounding years, but the year becomes useful and particularly interesting to analyze water stress indices. For that reason, despite having observed the change from 1955 to the 2005–2010 average providing insights of a medium or an average of extreme years, we will focus our concerns on sustainability on the indices obtained for that year 2005.

4.1.2. Changes of Agricultural Production Structure and Economic Benefits of the Increase in WFs between 1955 and 2005–2010

Changes in agricultural production were determinant to understand the evolution of the WFs. Firstly, the growth in agricultural crop production measured in monetary units (at constant prices of 1975, in pesetas, the former currency before the euro) was intense between 1955 and 2005–2010, showing an average annual growth rate of 1.6% (from 272,400 million pesetas of 1975 in the first year studied to 676,215 in the average 2005–2010). Based on [1], we consider that approximately 40% of this increase was due to the extension of irrigated agricultural area (the rest to increased yields in the rainfed and irrigated lands). Between 1955 and 2005–2010 the crop agricultural production increased by 8101 million euros of 2000 thanks to the new irrigated land (regardless of technical change). Thus, the growth of the value of agricultural crop production was a positive effect of increasing the blue water footprint. Overall the Spanish agricultural production has grown between 1950 and 2005 at an average annual rate of 2.3%, the highest in the European continent [61]. This perspective can be complemented with an approximation to the effects for the farmers of the transformation of rainfed into irrigated land. A case study for Aragon, estimated that in 1960 the total production per hectare was 7.2 times higher in irrigated than in rainfed land. In 1990 it was 6.8 times higher [62].
Besides, the distribution of agricultural production notably changed. High value added commodities such as horticultural products, fruits and olive oil increased their share in agricultural production during these years (Table 4). On the one hand, this was a direct consequence of the Spanish development process, and the growing domestic and foreign demand for these products. On the other hand, Spain has traditionally produced these products given its favorable climatic conditions as high sunshine hours per year and moderate temperatures [1,63]. These physical advantages to raise certain Mediterranean products together with the entrance in the European Economic Community encouraged the cultivation of horticultural products, olive oil and fruits. Hence, Spain has become a major world exporter of agricultural products [26]. A substantial part of these goods are processed by the food industry, which is one of the main industrial and exporting sectors in the country [64]. Besides, there is a close connection between the food industry and the products grown on irrigated land.
Table 4. Agricultural crop production (at 1975 prices and million pesetas and %) by groups of products.
1955%2005–2010%
Cereals70,296 25.8150,018 22.2
Industrial Crops18,340 6.772,813 10.8
Fodder Crops27,025 9.928,385 4.2
Fruit Trees39,752 14.6123,602 18.3
Horticultural products36,578 13.4150,282 22.2
Legumes13,573 5.06305 0.9
Olives and olive oil19,518 7.290,180 13.3
Tubers29,902 11.017,463 2.6
Wine17,416 6.437,168 5.5
Total272,400100676,215100
Source: [40,41,42].
Producing more products, often water-intensive products, in a semi-arid country as Spain made necessary the development of irrigation. The greater production of high value added crops in agricultural production put great pressures on water resources.
On the contrary, cereals, legumes and fodder crops lost importance in the productive structure. The entrance in the European Economic Community discouraged the production of this type of products and eased their import. In this regard, Spain became a great importer of these products, particularly of fodder crops.
The distribution of the agricultural crop production among provinces is also remarkable. Table 5 shows the agricultural production in constant prices of 1975 by groups of provinces, classified by the level of rainfall. As we have seen for the WFs, the provinces with the lowest rainfall levels tended to concentrate the agricultural production, despite their scarcity of water resources. Actually, the regions with less than 600 mm of precipitation per year generated 62% of the agricultural crop production in 1955 and about 77% by 2005–2010. The provinces with less than 400 mm per year, multiplied their agricultural production by more than 4 between 1955 and 2005–2010. As a result, these areas went from producing 14% of the agricultural crop output in 1955 to 23% in 2005–2010. On the other hand, the most water abundant provinces in Spain lost importance in the agricultural production (from 16% in 1955 to 3% in 2005–2010) what explains to some extent, their reduction in the blue and green water footprint of agriculture.
Table 5. Agricultural production (at 1975 prices and million pesetas and %) by groups of provinces.
1955%Average 2005–2010%
Very Low Rainfall Provinces (x < 400 mm)37,71414154,74423
Low Rainfall Provinces (400 < x < 600 mm)130,77348365,03054
Intermediate Rainfall Provinces (600 < x < 900 mm)59,91122136,50420
High Rainfall Provinces (x > 900 mm)44,0021620,7373
Spain272,400100677,015100
Source: [40,41,42]. The level of rainfall is an average of annual rainfall in the period 1982–2002 [60].
Finally, as it will also occur with the type of costs related to the changes in WFs approximated in the article, and as explained in the conclusions as limitation which could be further solved in the future, other benefits associated to those changes in WFs exist, derived e.g., with the increase of food provisioning, security, sustenance of the rural population avoiding intense depopulation processes, etc. Also we may think of clear ones from flood control and others from the dams’ construction. In any case for the particular purposes here we decided to focus on the dams constructed with the purposes or with main uses of agricultural production, excluding those with clear associated benefits that relate less clearly to changes in WFs, such as hydroelectric production [65,66].

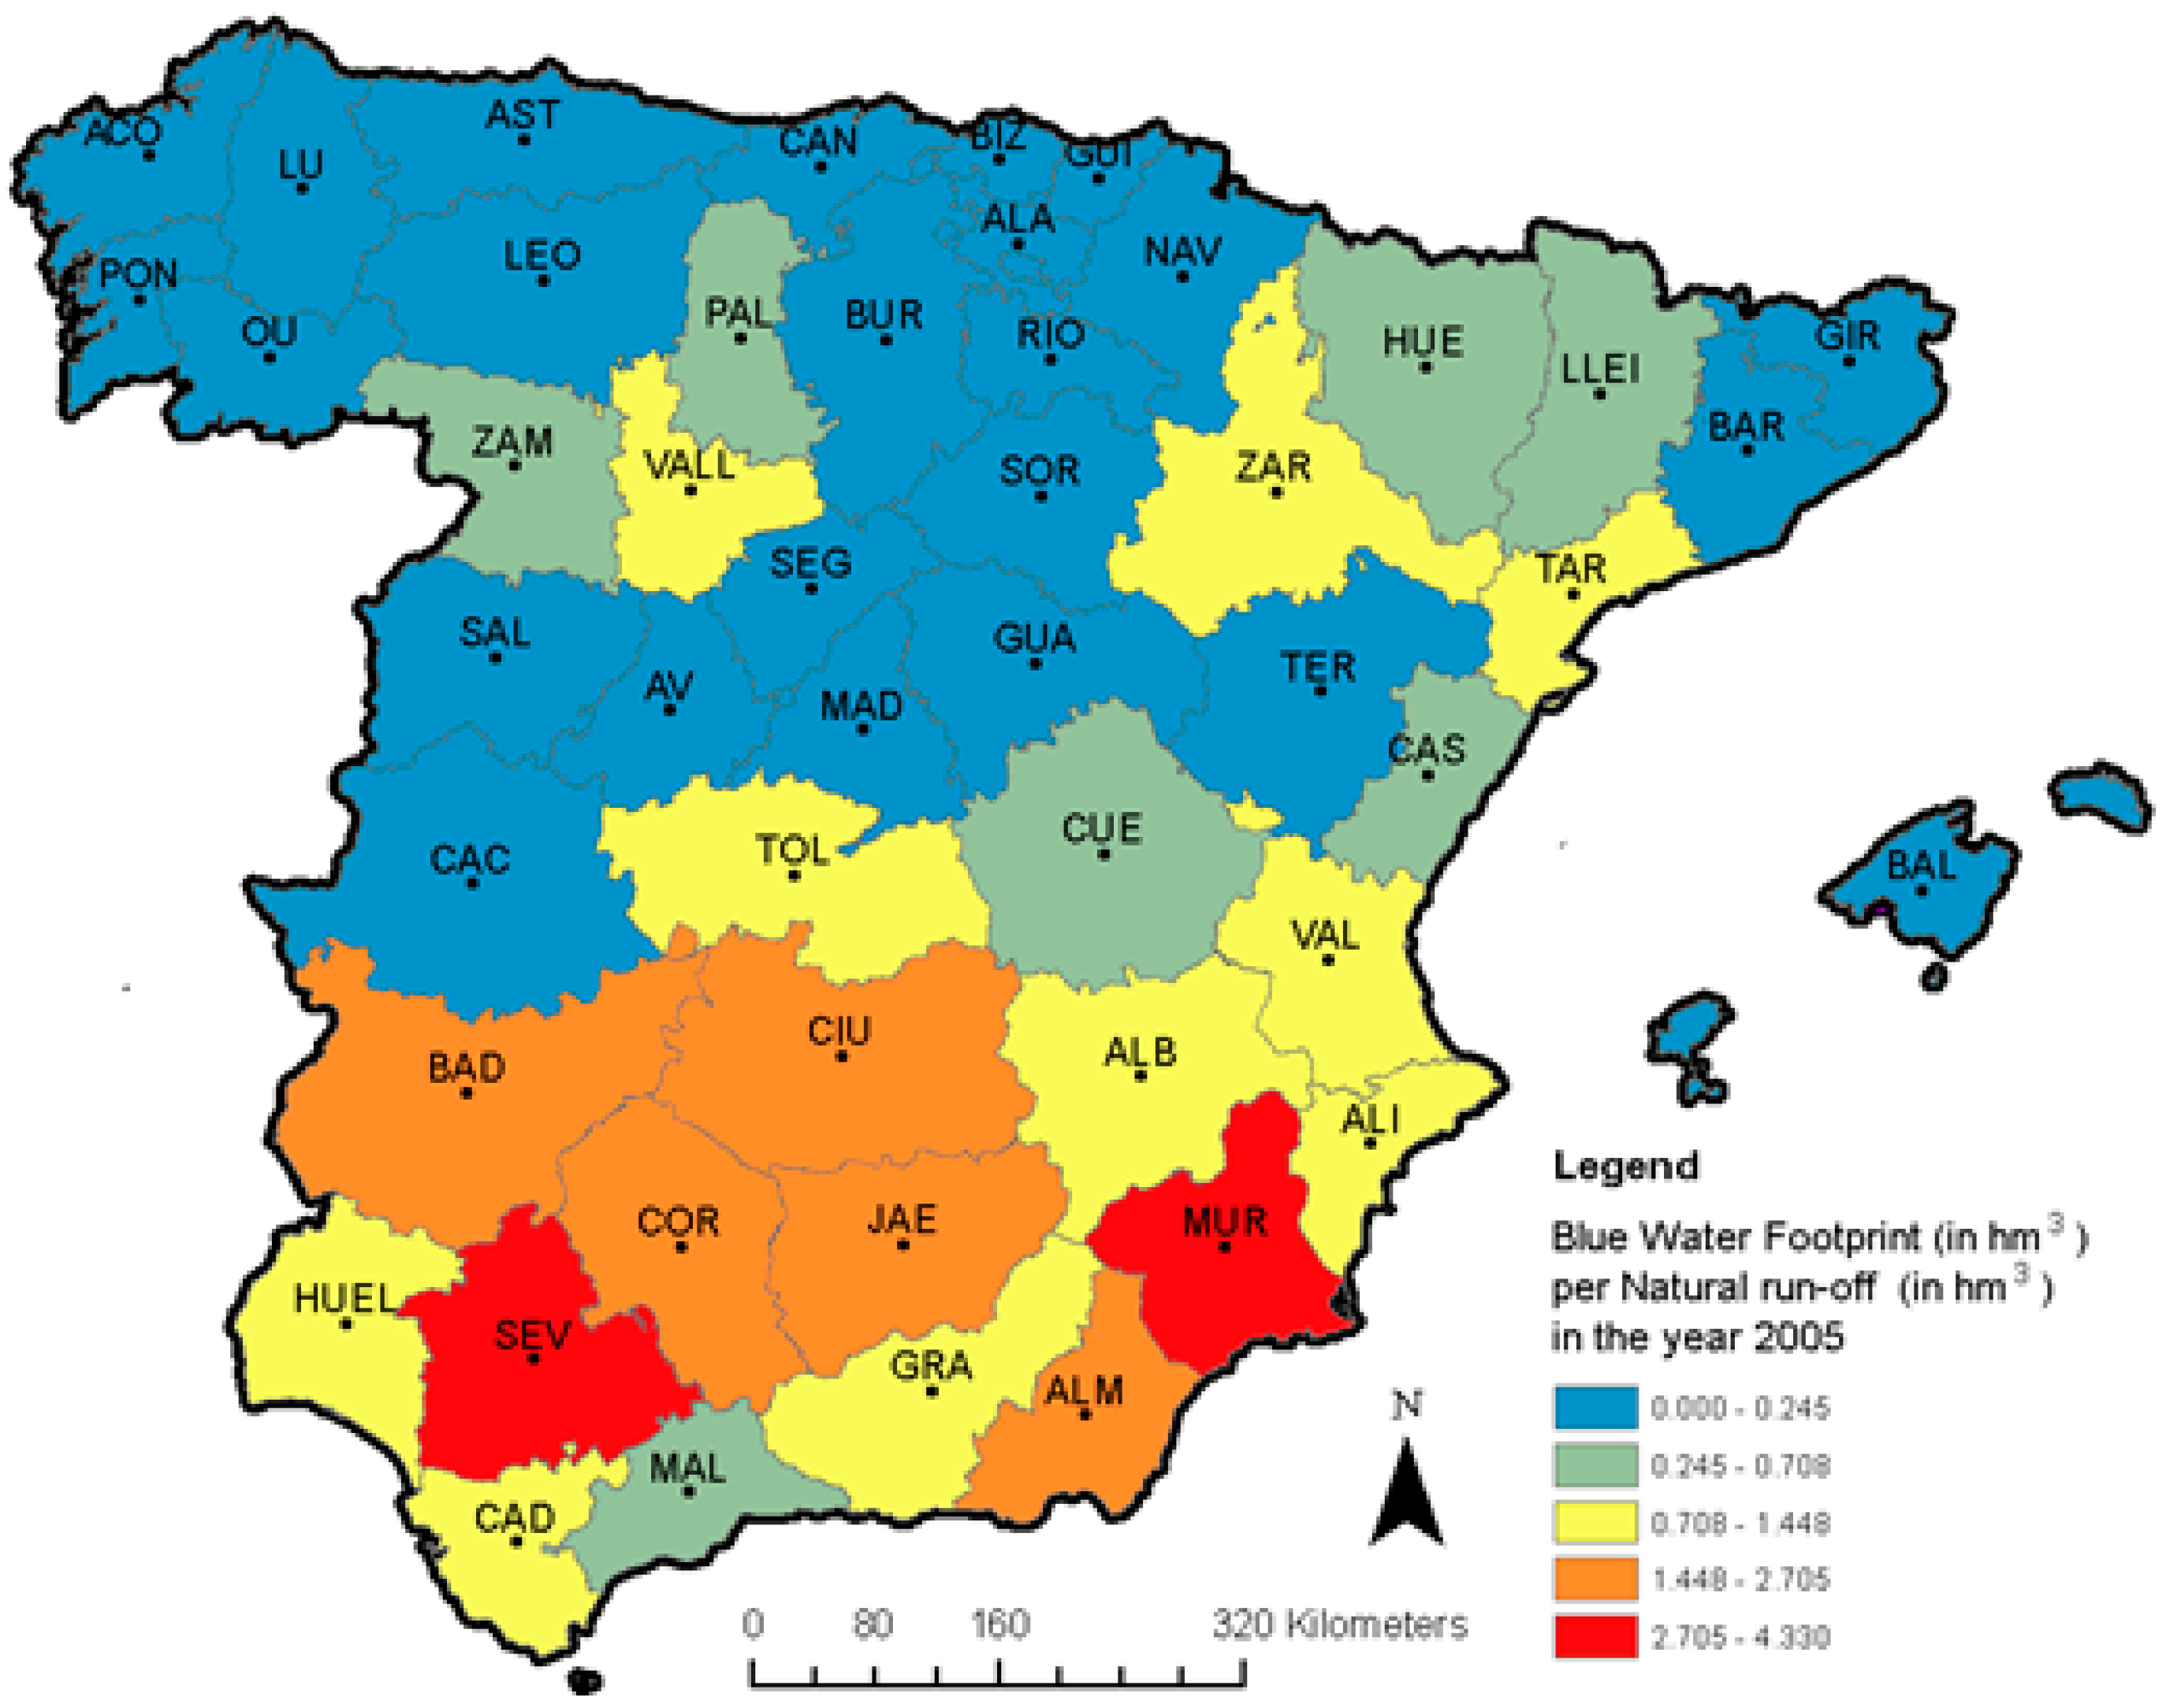
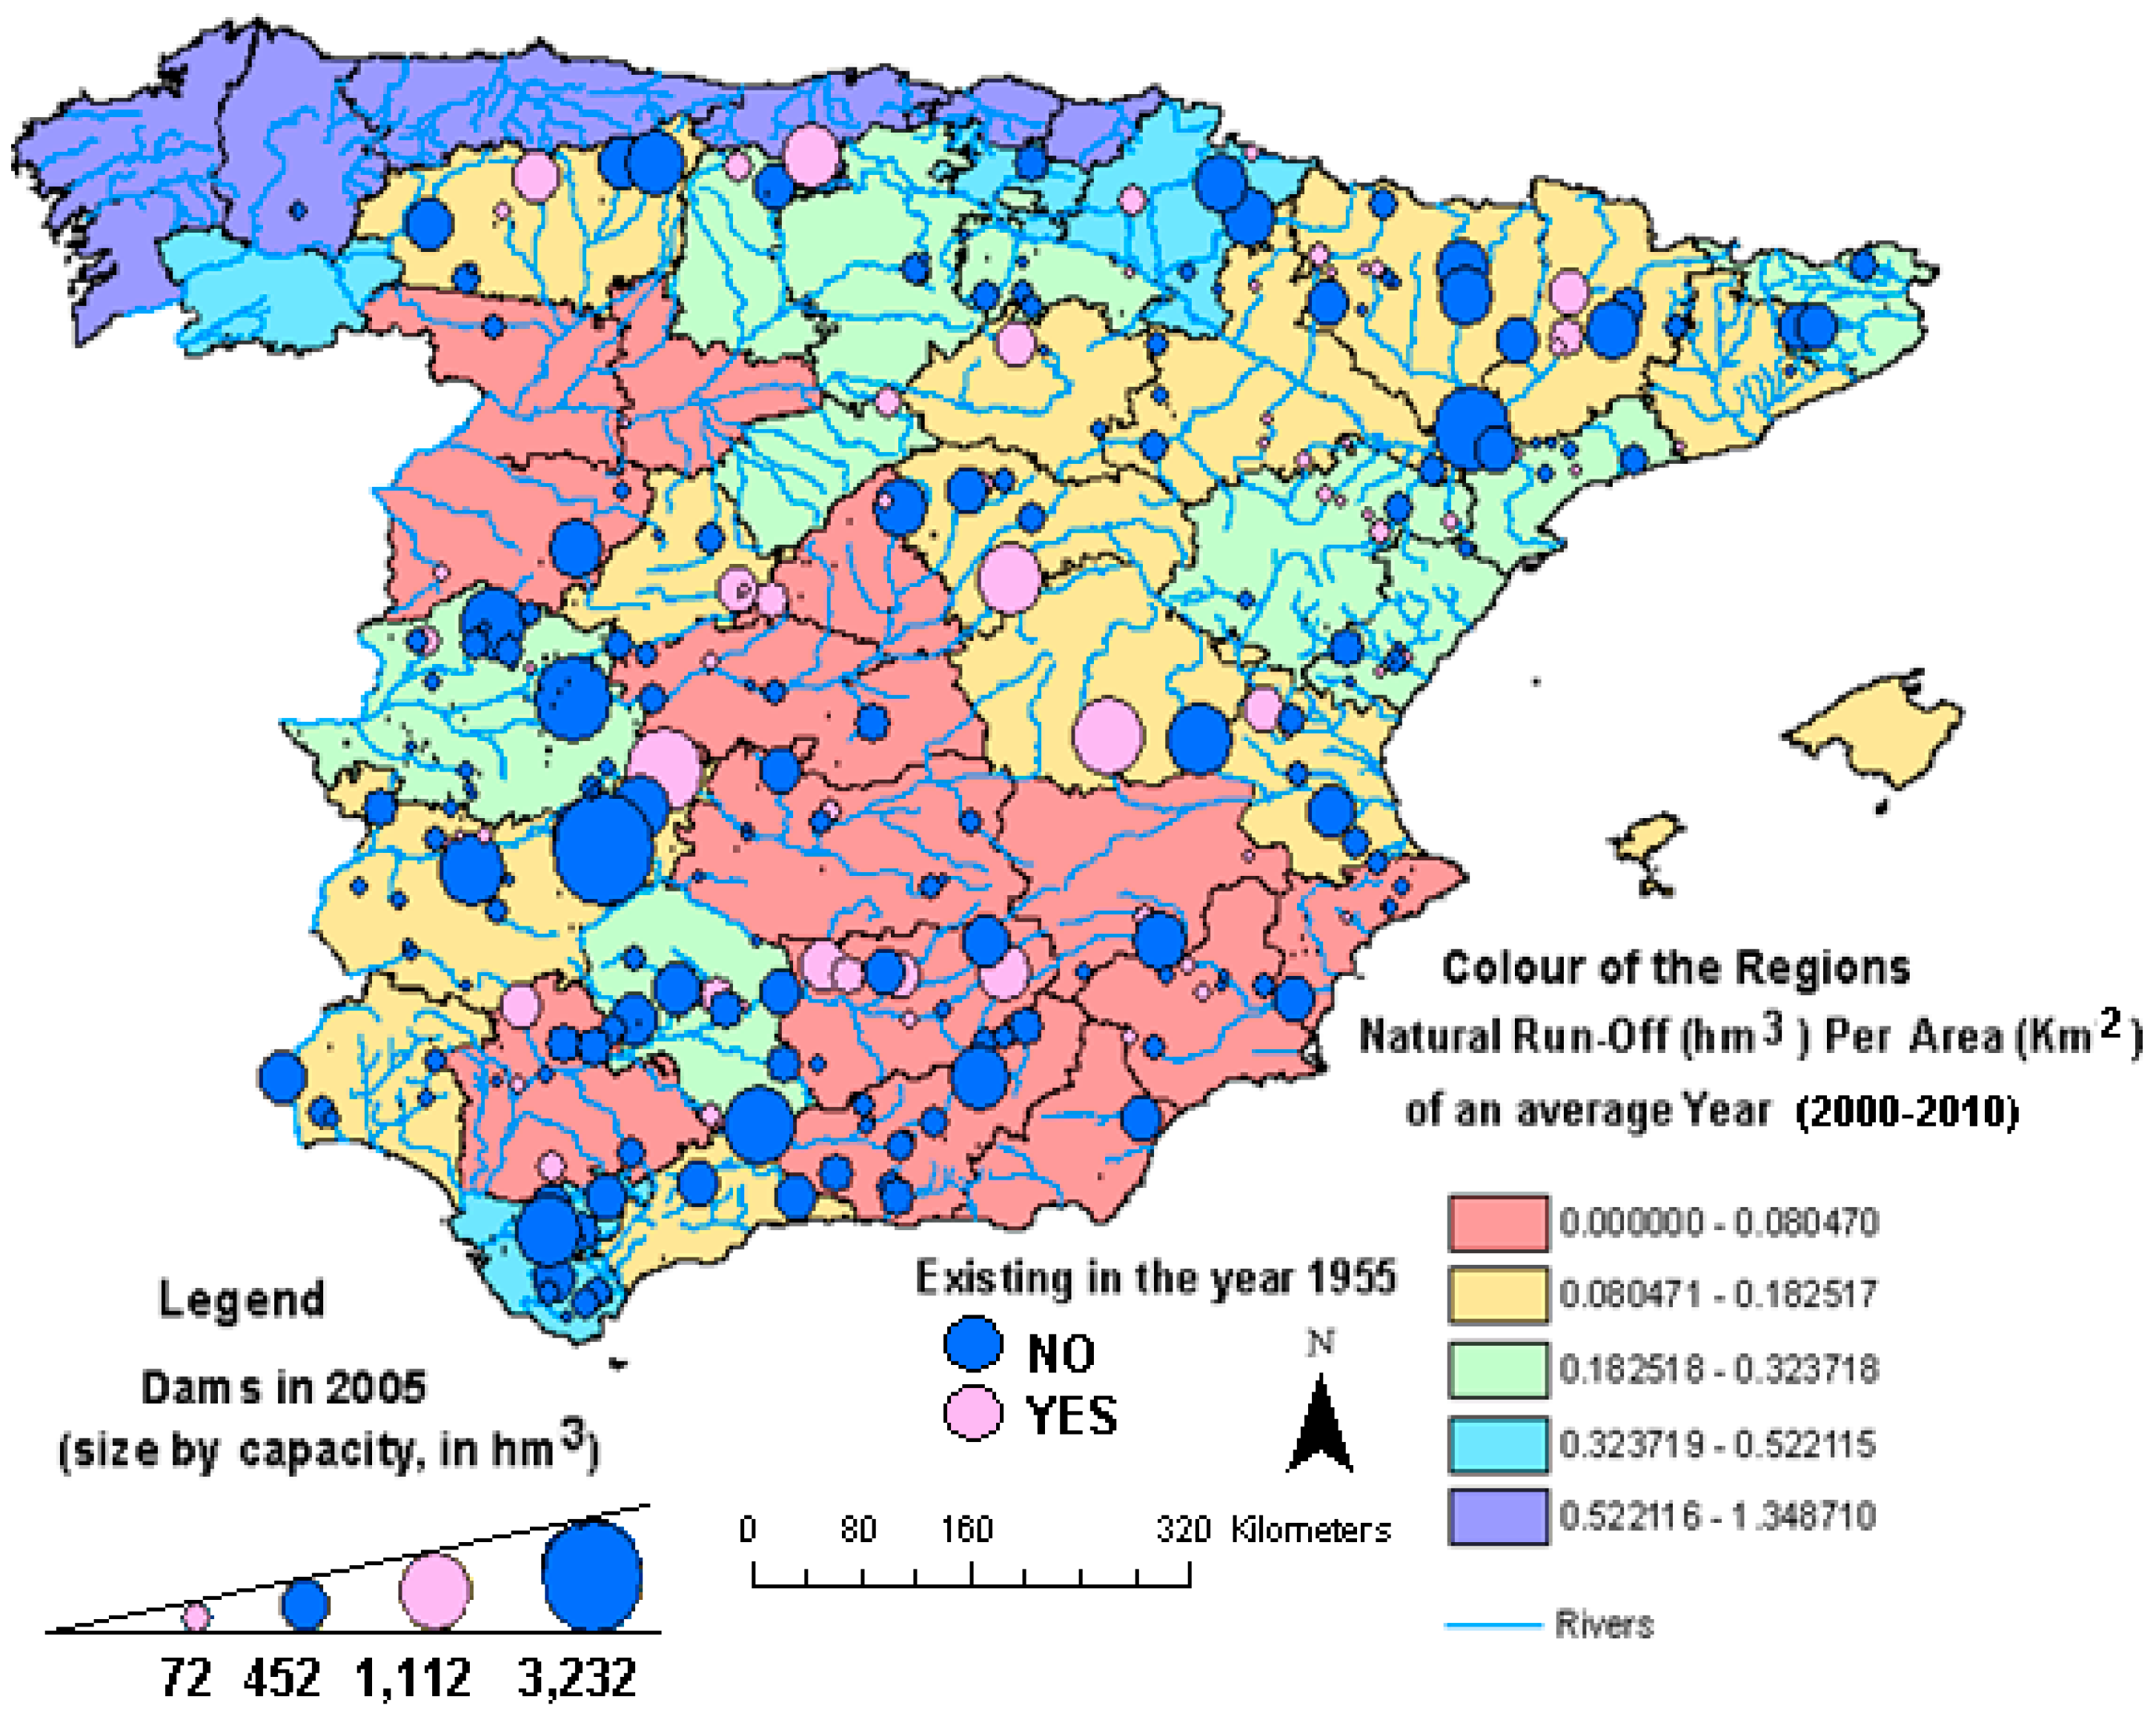
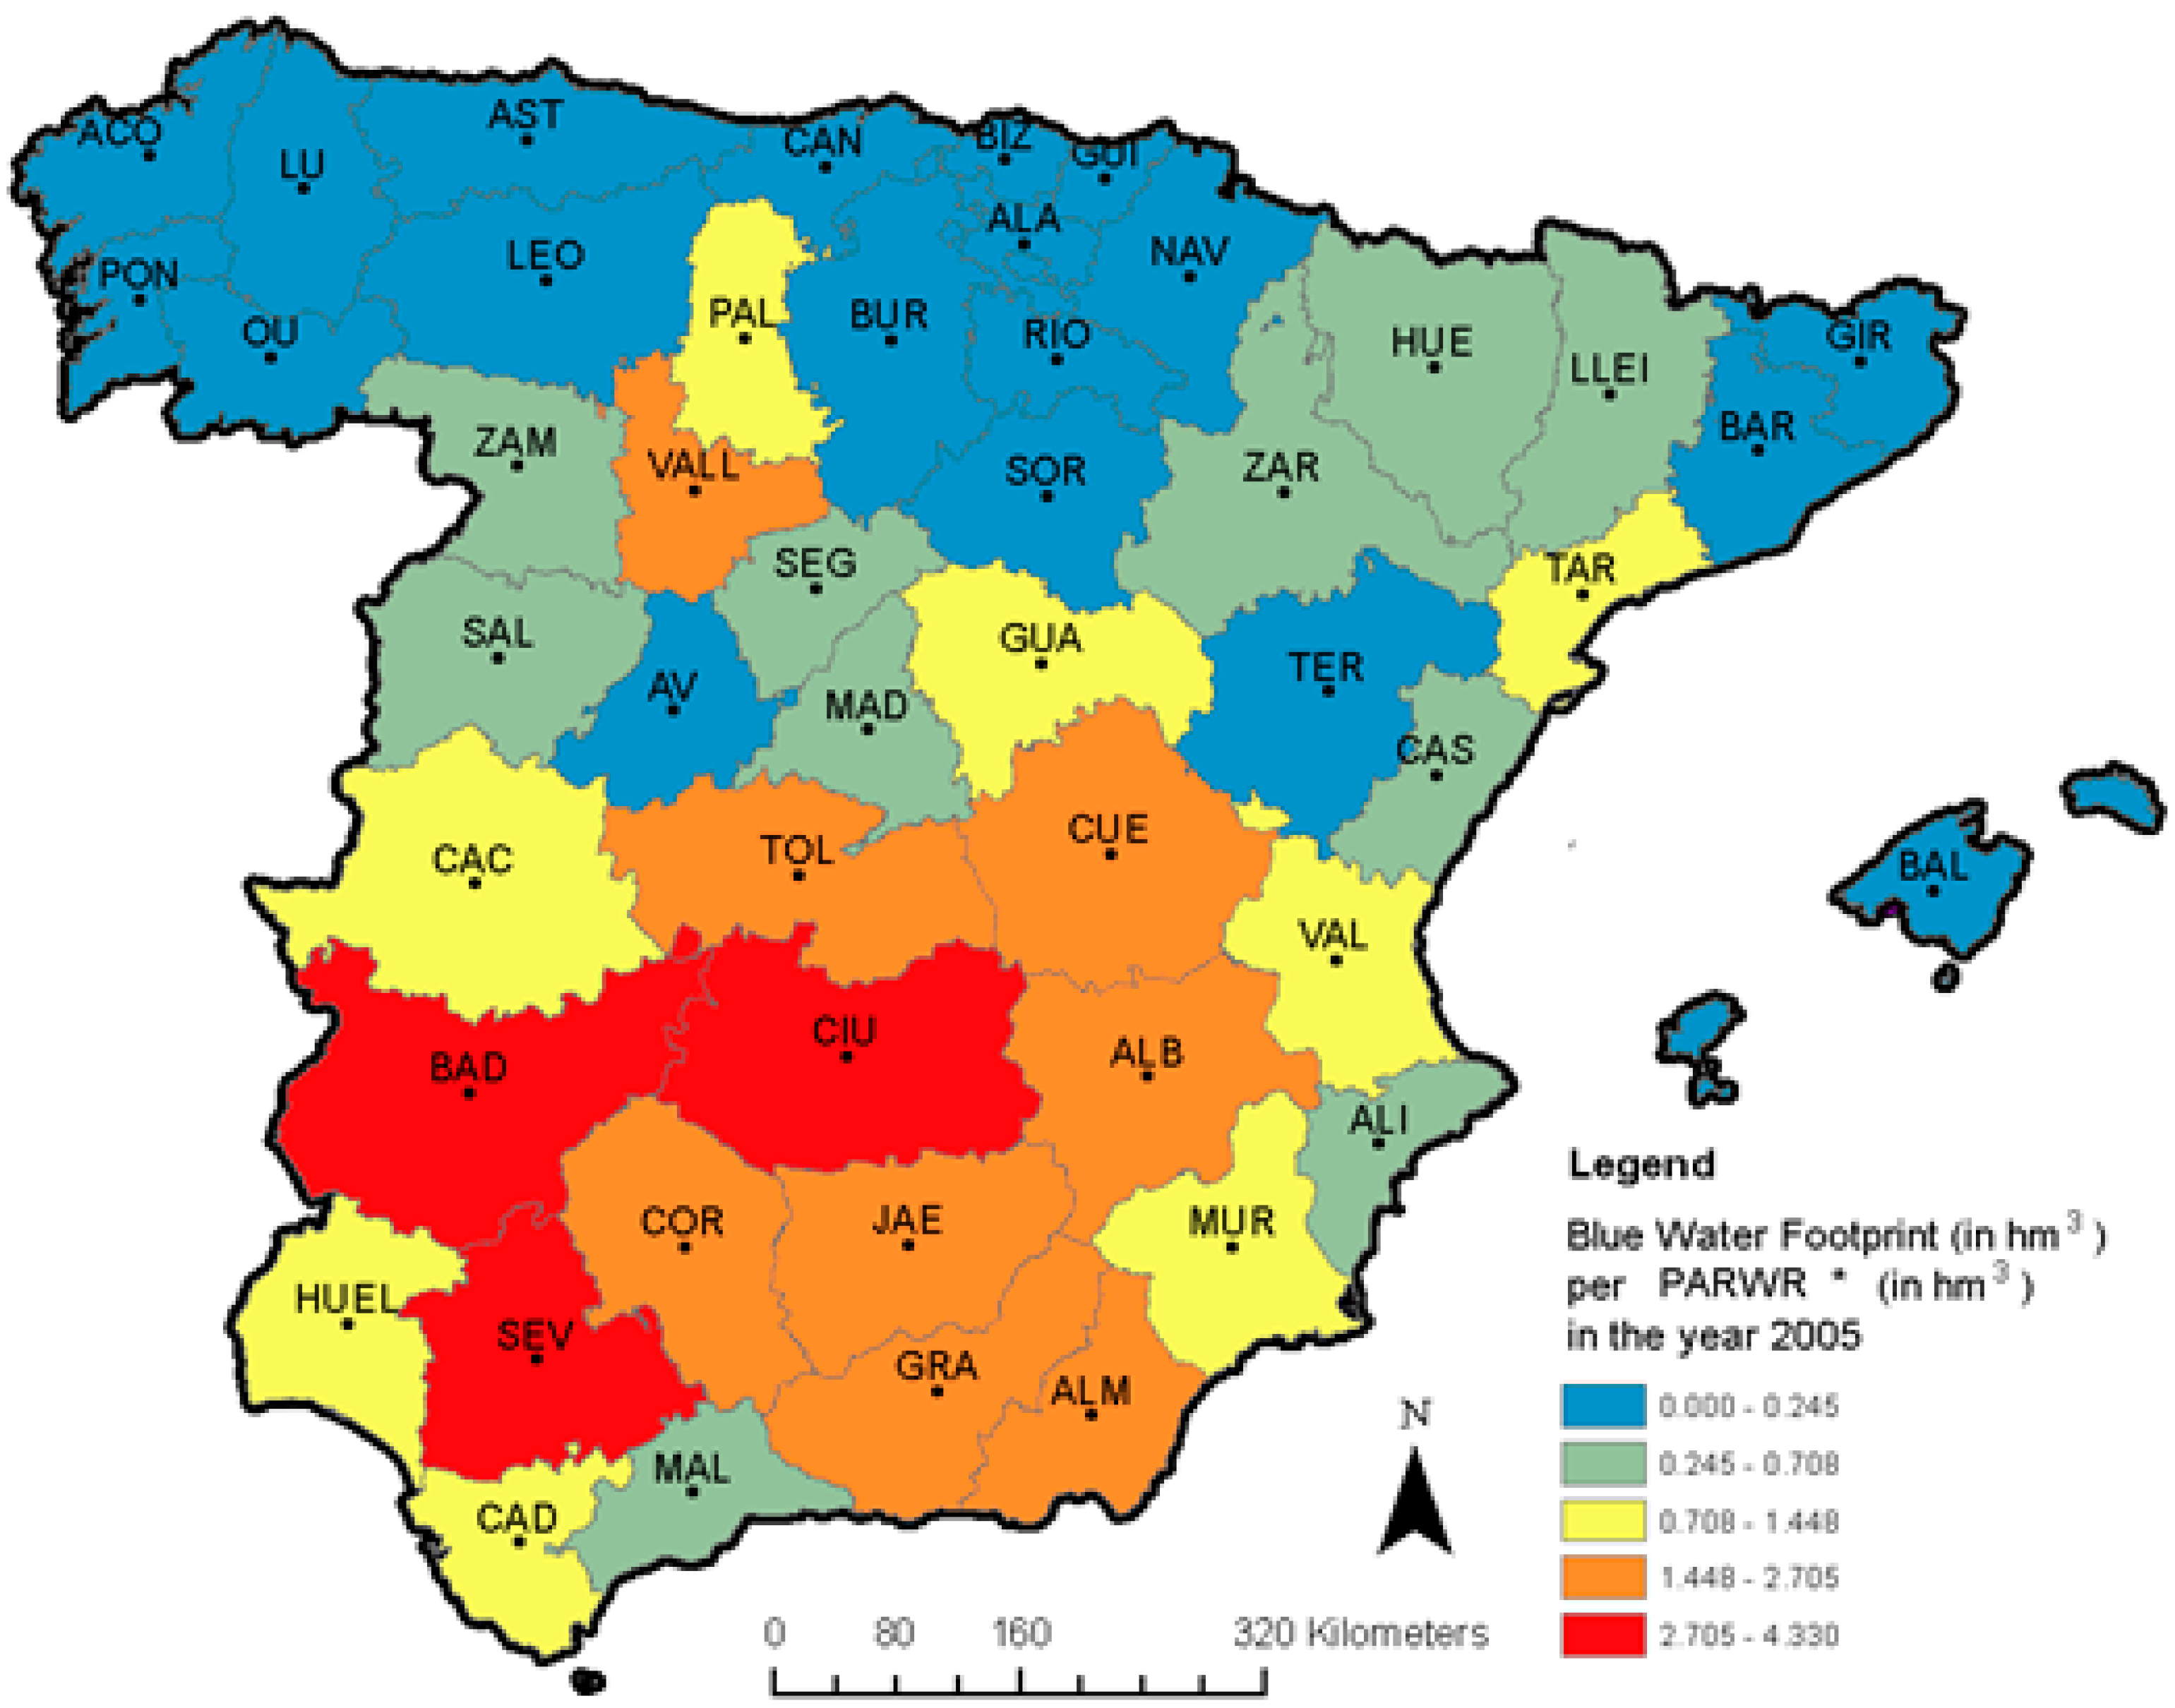
4.2. Water Stress Indicators and Relation to Economic Variables

From economic history we can learn what leads to WFs variations, and hence we look for criteria to compare and evaluate (positive and negative) those changes. On the one hand, we have shown changes in the agricultural production structure, which in most cases have been a key factor to explain the move towards more water intense crops. In other words, a common argument, and a reason for the expansion of the irrigated land, or the switch or expansion of productions such as rice, fruits, fresh vegetables, irrigated fodder, etc. has been the higher monetary value obtained by the producers from their production. These calculations were possible by using the prices of these productions in the period analyzed. On the other hand, the reduction in water availability has been the other side of the coin. As explained in the methodology, there is a wide literature on indicators, especially those addressing the ratio between water use or consumption (normally excluding green water from the computations) and water availability (usually measured as run-off), being generally agreed that having ratios between 0.2 and 0.4 a region can be called “scarce”, and above the 0.4, the region can be seen as “critically scarce”. Here we firstly comment on the provincial results of blue WFs to natural water availability (run-off) ratio shown in Map 4, and the analogous ratio for the average of 2005–2010 is shown in Map S4 in the Supplementary Information.
Map 4. Water Stress indicators from natural water availability (run-off) for 2005. Blue WF (hm3)/Natural run-off (hm3). Method of ranges division: Natural breaks. Source: Own elaboration.
Sustainability 07 05094 g006
When an average year the total run-off in Spain is about 110 km3/year, the natural run-off of the year 2005 is of 63 km3/year, and this lead us in Map 3 to 22 provinces (9 of the 17 autonomous regions which comprise them) with water scarcity indexes above 0.3 (measured from the natural resources, 27 provinces measured from PARWR), compared to the about 13 of them (7 of the 17 regions) of a medium year in rainfall. These results then present us a much more worrisome picture of the provincial environmental water scarcity than the usually considered in this generally speaking medium-dry country (and that as a whole results in moderate water scarcity, between 0.2 and 0.3). Among those provinces with high levels of water (environmental) sustainability, we find several in the south and center of Spain, notably Seville, Murcia, Almería, Badajoz, Córdoba, Valencia, Jaen, Huelva, Alicante Granada, Cadiz, Málaga, Ciudad Real and Toledo; but also in this case for the year 2005 others in the center-north as Cuenca, Valladolid, Zaragoza, Palencia, Tarragona and Lleida.
The above ratio is probably though not entirely realistic on the available water in each of the provinces, since apart from the natural run-off, a role is played by the reuse and desalination, by the environmental reserve than needs to be preserved, and by other volumes that “need to be preserved” due to (international) bilateral agreements with Portugal and established water transfers (through pipelines) across regions, something which we capture by the Potential Availability of Renewable Water Resources (PARWR). The ratio of blue WFs to PARWR is shown below in Map 5 and the analogous ratio for the average of 2005–2010 is shown in Map S5 in the Supplementary Information:
Map 5. Water Stress (opposite to Sustainability) indicators for 2005. Blue WF (hm3) to PARWR (hm3) ratio * PARWR: Potential Availability of Renewable Water Resources. Method of ranges division: Natural breaks. Source: Own elaboration.
Sustainability 07 05094 g007
By provinces, we observe that most of the provinces with scarcity values above 0.3 remain in the map, but also once accounted for the PARWR, some others, such as Cuenca and Badajoz, notably increased their scarcity indexes. This aspect occurs for several provinces due to the discounting of available water the agreed necessary minimum volumes flowing to Portugal. But also, we may see that while on the one hand e.g., the province of Murcia decreases its water scarcity when accounting for PARWR particularly thanks to a water transfer (Tajo-Segura), on the other hand the provinces of Guadalajara and Cuenca –and to a lesser extent other provinces of the Tajo river catchment- increase their water scarcity mainly for the same reason, something which raises the question and extent of sustainable water transfers.
Finally, we discuss as another indicator one for economic water scarcity, as suggested in [67]. We bring a generic calculation of potential costs from dams and other water infrastructure, as a first approximation to the costs of the changes (increases) in WFs.

4.3. Economic Costs of the Increase in WFs between 1955 and 2005

As introduced above, long term costs of water provision are rarely studied together with water footprints and indicators of water scarcity (to our knowledge, no study has attempted to link these three issues). The investments necessary to supply water and improve its delivery and sanitation, are long term investments, which also often, as clearly happened in the case of Spain, where undertaken by the public sector, and key infrastructures, such as dams, were usually projected for about 50 years.
The development of an agricultural sector with a notable representation of a water intensive farming, and a territorial distribution of irrigation quite far from the wetter areas, would not have been possible without the strong support of the state as a promoter and funder of large hydraulic infrastructures. During decades, Spain devoted a significant part of its public investment to water storage and distribution infrastructures such as reservoirs and dams, channels, and the development and implementation of irrigation schemes. In this line, the real net capital stock (in thousands of euros 2000) devoted to basic infrastructure and irrigation went from 2448 million of euros in 1955 to 25,279 million of euros in 2005, meaning a total increase of 933% in the period, which represents a yearly average growth rate of 4.8% throughout the period. As shown in Figure 1, the rate of investment in water infrastructure was particularly strong from the 60s to the first 90s.
Figure 1. Index of Evolution of real net capital stock (1955 = 100). Source: Own elaboration based on [58].
Sustainability 07 05094 g001
A similar picture of the investment effort on water infrastructure can be obtained if we evaluate the evolution of the net stock of capital for basic water infrastructure and irrigation in comparison to the total economic infrastructure (this section also includes ports, roads, rails and airports). As Figure 2 shows, from the mid-60s to the 90s, the basic irrigation water infrastructure accounted for over 20% of the Spanish public infrastructure with certain periods near or above 25% [62]. The example of Aragón (a semi-arid region with a great importance of irrigated agriculture) could be useful showing the evolution of the growing importance of public hydraulic infrastructure construction along the twentieth century. Since 1955, the State is almost the unique builder of this type of infrastructure. Before 1920s, this public construction was less than 20%. In other words, for almost 30 years, one in five euros in Spain dedicated to public infrastructure were intended for water infrastructure and irrigation works.
Figure 2. Share of basic hydraulic and irrigation infrastructures in total economic public infrastructures (share in the net capital stock in real terms, in %). Source: Own elaboration based on [58].
Sustainability 07 05094 g002
The territorial distribution of the investment effort in water infrastructure has been far from uniform, displaying a gradual concentration in the South and Southeast of Spain (Table S5).
Thus, the hydraulic infrastructure grew strongly and well above the Spanish average during the period studied in Andalusia, (especially in the provinces of Almería, Granada, Málaga and Huelva), the islands (Balearic and Canary Islands), Valencia (especially in Alicante) and Murcia. For the rest of Spain, we also observe notable increases in areas such as Pontevedra and Valladolid. Thus, the Mediterranean regions of Southern Spain won representation in the national map of hydraulic infrastructures. Notably, between 1995 and 2005 Andalusia went from 13.8% to 20.3% of the stock, Valencia nearly doubled its representation (3.9% to 6.4%) and Murcia increased its share from a negligible 0.9% to a 5% of the total water infrastructure in Spain. By contrast, the northern and central parts of Spain lost weight in the national (e.g., Aragon, Castilla-León and Galicia).
The Spanish hydraulic infrastructures had their great exponent in the construction of dams and reservoirs that turned regulation from 9% of water resources in the early 1950s to over 40% nowadays [68] Thus, the reservoir capacity increased from 8547 hm3 in 1955 to 56,411 hm3 in 2005 (Spanish Association of Dams and Reservoirs), with an average annual increase in storage capacity of 900 hm3 which peaked in the decade of the 60s–70s to 1888 hm3/year. At the end of the period studied, the reservoir capacity appears distributed throughout the country as follows: The central basins (Tagus, Guadiana and Duero) accounted respectively for 19.9%, 14.95% and 13.54% of the total reservoir capacity. The South basins (Andalusian basins, Guadalquivir (13%), Jucar and Segura) represented 28.4% of the reservoir capacity, the Ebro basin 13.5%, leaving 10% explained by other basins (the Balearics, Las Palmas, interior basins of Catalonia and the Basque Country, Galicia and Northern Spain).
While some reservoirs have an exclusive or preferential hydraulic operation, especially in the north of Spain, a significant number of them (according to our accounts about 65%) have among their uses (first use for a significant part) the water supply for irrigation. This regulated water facilitated and encouraged the development of extensive irrigation schemes which found in water flow, supply guarantee and clear opportunities for expansion.
Very roughly, and just to get an idea of the order of magnitude, if we now associate the value (net capital stock) of the basic water infrastructure and irrigation with reservoir capacity, we note that it increased from 2448 million of euros in 1955 (at constant prices 2000) to 25,279 in 2005, with this increase being markedly more intense that the one experienced in the value of the agricultural production during the period. For the same period, the reservoir capacity for irrigation uses increased from around 8000 hm3 to 36,000 hm3 [69,70].This made the unitary monetary value of infrastructure to rise from 0.285 euros/m3 to 0.702 euros/m3, i.e., it nearly tripled through the period studied (the value of the net capital stock also includes basic hydraulic infrastructure).
Map 6 shows the distribution of dams and reservoirs with irrigation uses (though not unique in most cases) and its variation between the beginning and end of the period considered. Three main ideas can be easily drafted. First, it is remarkable the strong impulse to water infrastructure, since most of the current Spanish dams and reservoirs were built during the period studied. Secondly, the increasing reservoir capacity in the most arid regions in Spain was a crucial driving factor for the expansion of agricultural production. As a consequence, a strong link between the spatial distribution of the reservoir capacity for irrigation and the increase in the blue water footprint in Spain is found. To some extent, the new supply of regulated water significantly changed the map of natural water availability in Spain; however, this had significant consequences in terms of environmental sustainability and public economic costs.
Map 6. Natural run-off (hm3) per area (km2) of an average year. Dams in 2005 in hm3. Own elaboration from [59,60].
Sustainability 07 05094 g008
This puts in context the implications of the increase in the water footprints of production, in water scarcity, and the costs involved. Water prices and tariffs do not usually reflect these costs at all. Moreover, there are other costs and environmental effects to be taken into account (for example in the deltas, in the biodiversity and other costs from water pollution, etc., which here do not account for). In this sense, we leave open the possibility for an even more comprehensive evaluation of benefits and costs for the future, for example using the historical information on fertilizer use. This would enable not only to talk about physical scarcity, but also about the scarcity originated from water pollution (grey water footprints estimates) and about economic scarcity (at least relative to other regions and in time).

5. Conclusions

In this article, we have addressed water footprint and water scarcity changes (over time) measures and reduction strategies. We have compared the levels, and more importantly the structure of agricultural water footprint in Spain in 1955 and 2005–2010. This period gathers the most important changes occurred, among others, in terms of irrigation expansion, crop composition, and water infrastructures construction. These changes, analyzed at the provincial level, were related mainly to the environmental and economic sustainability of water. Our analysis of the water footprint focused on the years 2005 and 2010, as a lower and upper bounds of rainfall, which could vary as much as 60 to 90 km3/year, and agricultural production. However, once appreciated these differences, due to the fact that run-off falls proportionally more than the fall in agricultural production and in water footprint, the risks to water sustainability are even clearer for the dry year we decide to focus on, the year 2005, with low precipitations of about 63 km3/year. When an average year the total run-off in Spain is about 110 km3/year, the natural run-off of the year 2005 is also of 63 km3/year, and this lead us to 22 provinces (9 of the 17 regions which comprise them) with water scarcity indexes above 0.3 (measured from the natural resources; 29 provinces and 10 regions if measured from PARWR), compared to the about 13 of them (7 of the 17 regions) of a medium year in rainfall.
These results then present us a much more worrisome picture of the provincial environmental water scarcity than the usually considered in this in general medium-dry country. We find important to link this to the WFs, because in our view high levels of WFs are not necessarily a concern or an environmental or sustainability problem. Especially a high level of green WF in an area with high precipitation probably cannot be seen as a WF of “scarce water”. For this reason, we have tried also to link WFs and water scarcity to the dimension of economic water scarcity. If understood as water scarcity caused by a lack of investment in water or insufficient human capacity, monetary means, etc. to satisfy the demand of water by the population, certainly it does not occur in any of the provinces analyzed. However, by measuring benefits and costs of the increases in WFs, we think that provinces with environmental water scarcity tend to incur in increasing costs of water provision, sometimes maybe even exceeding the benefits, if only attempting to solve the problems from the supply side. The experience from the past half century of water infrastructure investments has shown that while reaching close to the limits in terms of supply capacity, e.g., from dams, the risks of water stress in dry years has not disappeared for many southern and central regions in Spain.
Water footprint reduction measures and strategies can be oriented towards changes (in some cases, back) to the production of less water intense crops if the WF is “detrimental” or “disturbing”. Such “detrimental WF” might be called when the global costs of the increase in WF outweigh the possible benefits of those extra volumes of water consumed. The costs are normally evident due to the relative water scarcity in the province, because water infrastructure, such as the construction of dams, has entailed in some cases, apart from public budget that could have been used elsewhere (it can be measured simply in monetary units, but also based on the opportunity cost), displacements of people, and effects on the biodiversity, particularly of fish. Some of these issues reach environmental aspects, but also the last dimension of water scarcity, not particularly addressed here, which is the social water scarcity. Here we have also hinted the intuition of possible or perceived benefits of “extra WFs”, departing from the obvious one of generation of income for producers, but a comprehensive approach should probably recognize other, also related to social and environmental aspects, such as food security and sovereignty [71], and to the avoidance of other types of footprints such as the greenhouse gas emissions (particularly through transport of goods).
As a final word of caution, it should probably be acknowledged that the water scarcity figures presented here are calculated on an annual rather than a monthly basis. As noted by [48], this may lead to an underestimation of scarcity as experienced in the drier parts of the year, particularly because of the variability in available surface water resources within the year. For estimating groundwater scarcity, the annual approach will generally suffice because of the relatively long residence time and buffering capacity of groundwater systems. Groundwater scarcity figures are possibly underestimated, though, because return flows in groundwater-based irrigation are assumed to return to the groundwater system from which abstraction took place, while part of the return flow may not return.
We think that some of these aspects and refinements, together with the assessment of green (possibly also grey) water scarcity or stress, the assessment of these indicators in the consumption side (accounting for virtual water flows), and a complete estimation of benefits and costs from WFs changes are topics for future research. In our opinion, our study contributes to the previous literature, by putting together and analyzing WFs, water sustainability and historical and economic analysis of water. With respect to the studies with an historical perspective, this study takes the novel form of a subnational, i.e., regional (provincial) analysis. These results serve us to compare the income benefits of agricultural production, with the changes in water footprint of production, water stress and scarcity indicators, and a final attention to the economic water scarcity, with the comparison of long-term economic cost. In our view, in the future any policy strategy or policy on agricultural production and water uses and scarcity will have to weight these type of results and insights in order to make a balanced judgment and choose a sustainable option for agricultural, water and investments policies.

Supplementary Materials

Supplementary materials can be accessed at: https://www.mdpi.com/2071-1050/7/5/5094/s1.

Acknowledgments

The authors acknowledge that the research was partially financially supported by the projects of the Ministry of Science and Innovation of the Spanish Government, projects ECO2012-3328 and ECO2013-41353-P and the Department of Science, Technology and Universities of the Government of Aragon (Research Groups “Agrifood Economic History” and “Growth, Demand and Natural Resources”).

Author Contributions

All the authors contributed to the analysis and writing of the paper.

Conflicts of Interest

The authors declare no conflict of interest.

References

  1. Cazcarro, I.; Duarte, R.; Martín-Retortillo, M.; Pinilla, V.; Serrano, A. Water scarcity and agricultural growth in Spain: From curse to blessing? In Natural Resources and Economic Growth: Learning from History, 1st ed.; Badía-Miró, M., Pinilla, V., Willebald, H., Eds.; Routledge: London, UK, 2015. [Google Scholar]
  2. Hoekstra, A.Y.; Hung, P.Q. Globalisation of water resources: International virtual water flows in relation to crop trade. Global Environ. Change 2005, 15, 45–56. [Google Scholar] [CrossRef]
  3. Hoekstra, A.Y.; Chapagain, A.K.; Aldaya, M.M.; Mekonnen, M.M. The Water Footprint Assessment Manual: Setting the Global Standard; Earthscan: London, UK, 2011. [Google Scholar]
  4. Chapagain, A.K.; Hoekstra, A.Y.; Savenije, H.H.G. Water saving through international trade of agricultural products. Hydrol. Earth Syst. Sci. 2006, 10, 455–468. [Google Scholar] [CrossRef]
  5. Hoekstra, A.Y.; Mekonnen, M.M. The water footprint of humanity. Proc. Natl. Acad. Sci. USA 2012, 109, 3232–3237. [Google Scholar] [CrossRef] [PubMed]
  6. Mekonnen, M.; Hoekstra, A.Y. The green, blue and grey water footprint of crops and derived crop products. Hydrol. Earth Syst. Sci. 2011, 15, 1577–1600. [Google Scholar] [CrossRef]
  7. Mekonnen, M.M.; Hoekstra, A.Y. A global assessment of the water footprint of farm animal products. Ecosystems 2012, 15, 401–415. [Google Scholar] [CrossRef]
  8. Chapagain, A.K.; Hoekstra, A.Y. The water footprint of coffee and tea consumption in the netherlands. Ecol. Econ. 2007, 64, 109–118. [Google Scholar] [CrossRef]
  9. Chapagain, A.K.; Hoekstra, A.Y.; Savenije, H.H.G.; Gautam, R. The water footprint of cotton consumption: An assessment of the impact of worldwide consumption of cotton products on the water resources in the cotton producing countries. Ecol. Econ. 2006, 60, 186–203. [Google Scholar] [CrossRef]
  10. Chapagain, A.K.; Orr, S. An improved water footprint methodology linking global consumption to local water resources: A case of spanish tomatoes. J. Environ. Manag. 2009, 90, 1219–1228. [Google Scholar] [CrossRef]
  11. Aldaya, M.M.; Hoekstra, A.Y. The water needed for italians to eat pasta and pizza. Agric. Syst. 2010, 103, 351–360. [Google Scholar] [CrossRef]
  12. Chouchane, H.; Hoekstra, A.Y.; Krol, M.S.; Mekonnen, M.M. The water footprint of tunisia from an economic perspective. Ecol. Indic. 2015, 52, 311–319. [Google Scholar] [CrossRef]
  13. Zhuo, L.; Mekonnen, M.M.; Hoekstra, A.Y. Sensitivity and uncertainty in crop water footprint accounting: A case study for the yellow river basin. Hydrol. Earth Syst. Sci. 2014, 18, 2219–2234. [Google Scholar] [CrossRef]
  14. Vanham, D.; Bidoglio, G. The water footprint of agricultural products in European river basins. Environ. Res. Let. 2014, 9. [Google Scholar] [CrossRef]
  15. Mekonnen, M.M.; Hoekstra, A.Y. Water conservation through trade: The case of Kenya. Water Int. 2014, 39, 451–468. [Google Scholar] [CrossRef]
  16. Zeng, Z.; Liu, J.; Koeneman, P.H.; Zarate, E.; Hoekstra, A.Y. Assessing water footprint at river basin level: A case study for the heihe river basin in northwest china. Hydrol. Earth Syst. Sci. 2012, 16, 2771–2781. [Google Scholar] [CrossRef]
  17. Dumont, A.; Salmoral, G.; Llamas, M.R. The water footprint of a river basin with a special focus on groundwater: The case of Guadalquivir basin (Spain). Water Resour. Ind. 2013, 1–2, 60–76. [Google Scholar] [CrossRef]
  18. Aldaya, M.M.; Llamas, M.R. Water Footprint Analysis for the Guadiana River Basin; UNESCO-IHE: Delft, The Netherlands, 2008; Volume 35. [Google Scholar]
  19. Aldaya, M.M.; Martínez-Santos, P.; Llamas, M.R. Incorporating the water footprint and virtual water into policy: Reflections from the Mancha Occidental region, Spain. Water Resour. Manag. 2010, 24, 941–958. [Google Scholar] [CrossRef]
  20. Garrido, A.; Llamas, M.R.; Novo, P.; Rodríguez-Casado, R.; Aldaya, M.M. Water Footprint and Virtual Water Trade in Spain: Policy Implications; Springer: New York, NY, USA, 2010. [Google Scholar]
  21. Duarte, R.; Pinilla, V.; Serrano, A. The water footprint of the Spanish agricultural sector: 1860–2010. Ecol. Econ. 2014, 108, 200–207. [Google Scholar] [CrossRef]
  22. Liu, J.; Sun, S.; Wu, P.; Wang, Y.; Zhao, X. Evaluation of crop production, trade, and consumption from the perspective of water resources: A case study of the Hetao irrigation district, China, for 1960–2010. Sci. Total Environ. 2015, 505, 1174–1181. [Google Scholar] [CrossRef] [PubMed]
  23. Zhao, C.; Chen, B.; Hayat, T.; Alsaedi, A.; Ahmad, B. Driving force analysis of water footprint change based on extended stirpat model: Evidence from the Chinese agricultural sector. Ecol. Indic. 2014, 47, 43–49. [Google Scholar] [CrossRef]
  24. Duarte, R.; Pinilla, V.; Serrano, A. The effect of globalisation on water consumption: A case study of the Spanish virtual water trade, 1849–1935. Ecol. Econ. 2014, 100, 96–105. [Google Scholar] [CrossRef]
  25. Duarte, R.; Pinilla, V.; Serrano, A. Globalization and natural resources: The expansion of the spanish agrifood trade and its impact on water consumption, 1965–2010. Reg. Environ. Change 2015, in press. [Google Scholar]
  26. Clar, E.; Pinilla, V.; Serrano, R. El comercio agroalimentario español en la segunda globalización, 1951–2011. Historia Agraria 2015, 63, 183–213. [Google Scholar]
  27. Baiardi, D.; Bianchi, C.; Lorenzini, E. Food competition in world markets: Some evidence from a panel data analysis of top exporting countries. J. Agric. Econ. 2014. [Google Scholar] [CrossRef]
  28. Vorosmarty, C.J. Global water resources: Vulnerability from climate change and population growth. Science 2000, 289, 284–288. [Google Scholar] [CrossRef] [PubMed]
  29. Oki, T.; Kanae, S. Global hydrological cycles and world water resources. Science 2006, 313, 1068–1072. [Google Scholar] [CrossRef] [PubMed]
  30. Raskin, P. Water Futures: Assessment of Long-Range Patterns and Problems; Stockholm Environment Institute: Stockholm, Sweden, 1997. [Google Scholar]
  31. Alcamo, J.; Henrichs, T.; Rösch, T. World Water in 2025: Global Modelling and Scenario Analysis for the World Commission on Water for the 21st Century; University of Kassel: Kassel, Germany, 2000. [Google Scholar]
  32. Alcamo, J.; Henrichs, T. Critical regions: A model-based estimation of world water resources sensitive to global changes. Aquatic Sci. 2002, 64, 352–362. [Google Scholar] [CrossRef]
  33. Lallana, C.; Marcuello, C. Water Exploitation Index; European Environmental Agency: Copenhagen, Denmark, 2004. [Google Scholar]
  34. Mekonnen, M.M.; Hoekstra, A.Y. Water footprint benchmarks for crop production: A first global assessment. Ecol. Indic. 2014, 46, 214–223. [Google Scholar] [CrossRef]
  35. Brown, A.; Matlock, M.D. A Review of Water Scarcity Indices and Methodologies; University of Arkansas, Sustainability Consortium: Fayetteville, AR, USA, 2011. [Google Scholar]
  36. Falkenmark, M. The massive water scarcity threatening Africa—Why isn’t it being addressed. Ambio 1989, 18, 112–118. [Google Scholar]
  37. MAGRAMA (Ministerio de Agricultura, Alimentación y Medio Ambiente). Libro Blanco del Agua en España; Dirección General de Obras Hidráulicas y Calidad de las Aguas: Madrid, Spain, 2000. (In Spanish) [Google Scholar]
  38. Pinilla, V. The development of irrigated agriculture in twentieth-century Spain : A case study of the Ebro basin. Agric. Hist. Rev. 2006, 54, 122–141. [Google Scholar]
  39. Mekonnen, M.; Hoekstra, A.Y. A global and high-resolution assessment of the green, blue and grey water footprint of wheat. Hydrol. Earth Syst. Sci. 2010, 14, 1259–1276. [Google Scholar] [CrossRef] [Green Version]
  40. MAGRAMA (Ministerio de Agricultura, Alimentación y Medio Ambiente). Anuario Estadístico de la Produccion Agraria; Ministerio de Agricultura, Alimentación y Medio Ambiente: Madrid, Spain, 1955. (In Spanish) [Google Scholar]
  41. MAGRAMA (Ministerio de Agricultura, Alimentación y Medio Ambiente). Anuario Estadístico de la Produccion Agraria; Ministerio de Agricultura, Alimentación y Medio Ambiente: Madrid, Spain, 2005. (In Spanish) [Google Scholar]
  42. MAGRAMA (Ministerio de Agricultura, Alimentación y Medio Ambiente). Anuario Estadístico de la Produccion Agraria; Ministerio de Agricultura, Alimentación y Medio Ambiente: Madrid, Spain, 2010. (In Spanish) [Google Scholar]
  43. Dalin, C.; Konar, M.; Hanasaki, N.; Rinaldo, A.; Rodriguez-Iturbe, I. Evolution of the global virtual water trade network. Proc. Natl. Acad. Sci. USA 2012, 109, 5989–5994. [Google Scholar] [CrossRef] [PubMed]
  44. Konar, M.; Hussein, Z.; Hanasaki, N.; Mauzerall, D.L.; Rodriguez-Iturbe, I. Virtual water trade flows and savings under climate change. Hydrol. Earth Syst. Sci. 2013, 17, 3219–3234. [Google Scholar] [CrossRef]
  45. Allen, R.G.; Pereira, L.S.; Raes, D.; Smith, M. Crop Evapotranspiration. Guidelines for Computing Crop Water Requirements; FAO: Rome, Italy, 1998. [Google Scholar]
  46. FAO. Faostat database. Available online: http://faostat3.fao.org/home/E (accessed on 22 April 2015).
  47. Carreras, A.; Tafunell, X.L. Estadísticas Históricas de España: Siglos xix-xx, 2nd ed.; Fundación BBVA: Bilbao, Spain, 2005. [Google Scholar]
  48. Hoekstra, A.Y.; Mekonnen, M.M.; Chapagain, A.K.; Mathews, R.E.; Richter, B.D. Global monthly water scarcity: Blue water footprints versus blue water availability. PLoS ONE 2012, 7, e32688. [Google Scholar] [CrossRef] [PubMed]
  49. FAO. Water Resources. Aquastat-Water; Food and Agriculture Organization: Rome, Italy, 2011. [Google Scholar]
  50. MAGRAMA (Ministerio de Agricultura, Alimentación y Medio Ambiente). Simulación precipitación-aportación (simpa). Available online: http://hispagua.cedex.es/datos/climatologia (accessed on 22 April 2015).
  51. MAGRAMA (Ministerio de Agricultura, Alimentación y Medio Ambiente). Sistema integrado de información del agua (sia). Available online: http://servicios2.marm.es/sia/visualizacion/descargas/capas.jsp (accessed on 22 April 2015). (In Spanish)
  52. SIMPA. Simulación precipitación-aportación (simpa). In Libro digital del agua (marm) 941-2009; Centro de Estudios y Experimentación de Obras Públicas (CEDEX): Madrid, Spain, 2010. (In Spanish) [Google Scholar]
  53. MAGRAMA (Ministerio de Agricultura, Alimentación y Medio Ambiente). Huella Hídrica de España. Sostenibilidad y Territorio; MAGRAMA: Madrid, Spain, 2011; p. 177. (In Spanish) [Google Scholar]
  54. MAPA (Ministerio de Agricultura, Pesca y Alimentación). Convenio Sobre Cooperación Para la Protección y el Aprovechamiento Sostenible de las Aguas de las Cuencas Hidrográficas Hispano-Portuguesas; Ministerio de Agricultura, Pesca y Alimentación: Madrid, Spain, 2000. (In Spanish) [Google Scholar]
  55. MAGRAMA (Ministerio de Agricultura, Alimentación y Medio Ambiente). Libro blanco del agua en España. In Libro Digital del Agua; MAGRAMA: Madrid, Spain, 2011; p. 177. (In Spanish) [Google Scholar]
  56. MAGRAMA (Ministerio de Agricultura, Alimentación y Medio Ambiente). Capacidad en hm3/año. Situación de las Plantas Desalinizadoras del Programa agua; Ministerio de Agricultura, Alimentación y Medio Ambiente: Madrid, Spain, 2007. (In Spanish) [Google Scholar]
  57. Smakhtin, V.; Revenga, C.; Döll, P. Taking into Account Environmental Water Requirements in Global-Scale Water Resources Assessments; Comprehensive Assessment Secretariat: Colombo, Sri Lanka, 2004. [Google Scholar]
  58. Series históricas de capital público en españa y su distribución territorial (1900–2005). 2009. Available online: http://www.fbbva.es/TLFU/tlfu/esp/areas/econosoc/bbdd/Capital_Publico.jsp (accessed on 15 January 2015).
  59. Lehner, B.; Liermann, C.R.; Revenga, C.; Vörösmarty, C.; Fekete, B.; Crouzet, P.; Döll, P.; Endejan, M.; Frenken, K.; Magome, J.E.A. Global reservoir and dam (grand) database. Global Water System Project: Bonn, Germany, 2014. [Google Scholar]
  60. Goerlich Gisbert, F.J. Historial data on climate for spanish regions. Investigaciones de Historia Económica 2012, 8, 29–40. [Google Scholar]
  61. Martín-Retortillo, M.; Pinilla, V. Patterns and causes of growth of European agricultural production, 1950–2005. Available online: http://www.aehe.net/2013/01/dt-aehe-1302.pdf (accessed on 22 April 2015).
  62. Ibarra, P.; Pinilla, V. Regadío y transformaciones agrarias en aragón, 1880–1990. In El Agua en los Sistemas Agrarios. Una Perspectiva Histórica; Garrabou, R., Naredo, J.M., Eds.; Fundación Argentaria/Editorial Visor: Madrid, Spain, 1999; pp. 391–426. (In Spanish) [Google Scholar]
  63. Pinilla, V.; Ayuda, M.I. Taking advantage of globalization? Spain and the building of the international market in mediterranean horticultural products, 1850–1935. Eur. Rev. Econ. Hist. 2010, 14, 239–274. [Google Scholar] [CrossRef]
  64. Serrano, R.; García-Casarejos, N.; Gil-Pareja, S.; Llorca-Vivero, R.; Pinilla, V. The Internationalisation of the Spanish Food Industry, 1970–2012: The Home Market Effect and European Market Integration; Facultad de Economía y Empresa, Universidad de Zaragoza: Zaragoza, Spain, 2015. [Google Scholar]
  65. Silvestre, J.; Clar, E. The demographic impact of irrigation projects: A comparison of two case studies of the Ebro basin, Spain, 1900–2001. J. Hist. Geogr. 2010, 36, 315–326. [Google Scholar] [CrossRef]
  66. Herranz, A. Agua y desarrollo económico en la cuenca del ebro (1926–2000). In Gestión y Usos del Agua en la Cuenca del Ebro en el Siglo xx; Pinilla, V., Ed.; Prensas Universitarias de Zaragoza: Zaragoza, Spain, 2008; pp. 676–703. (In Spanish) [Google Scholar]
  67. Seckler, D.; Molden, D.; Barker, R. Water Scarcity in the Twenty-First Century; IWMI (International Water Management Institute): Colombo, Sri Lanka, 1998. [Google Scholar]
  68. Berga, L. Presas y embalses en la españa del siglo xx. Revista de Obras Públicas 2003, 150, 37–40. [Google Scholar]
  69. SEPREM. Inventario de Presas. Sociedad Española de Presas y Embalses; Spanish Association of Dams and Reservoirs: Madrid, Spain, 2014. (In Spanish) [Google Scholar]
  70. MAGRAMA. Inventario de presas y embalses. Available online: http://sig.marm.es/snczi/visor.html?herramienta=Presas (accessed on 22 April 2015). (In Spanish)
  71. González Esteban, Á. Nuevos paradigmas agrarios: Una aproximación a los fundamentos teóricos de la soberanía alimentaria. Historia Agraria 2014, 64, 131–159. (In Spanish) [Google Scholar]

