
Study on the Thermal Effects and Air Quality Improvement of Green Roof

Abstract
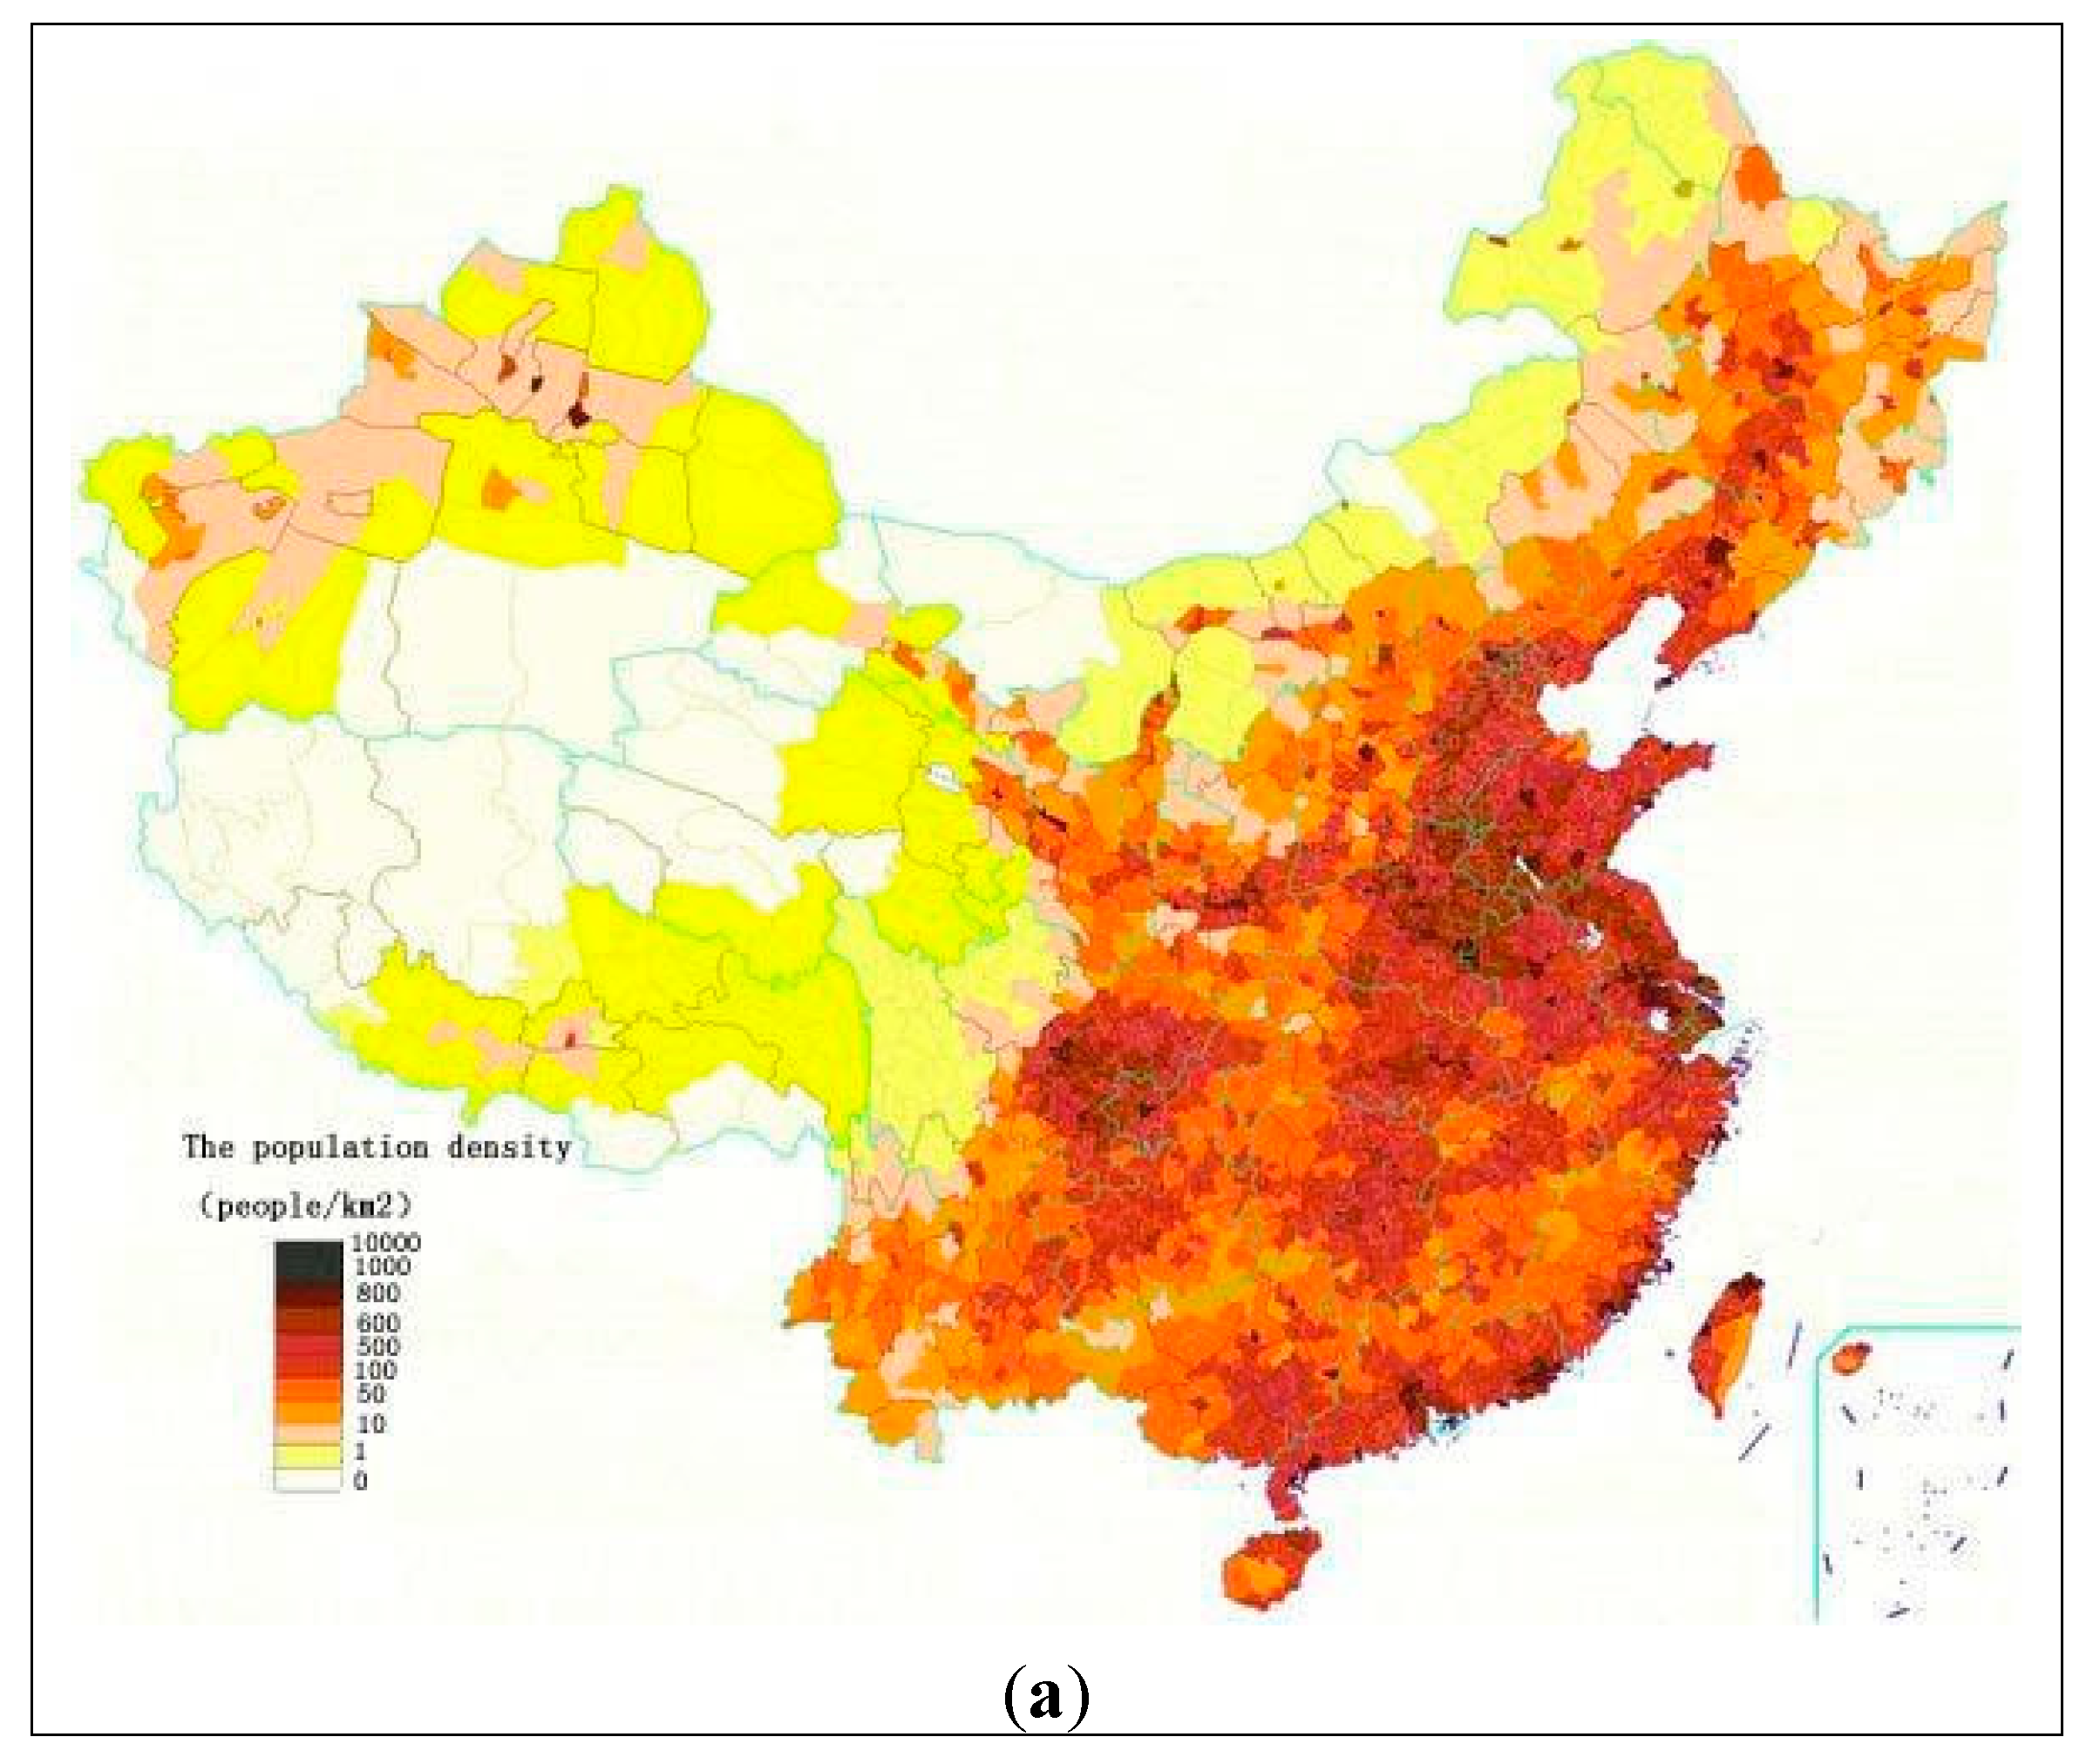
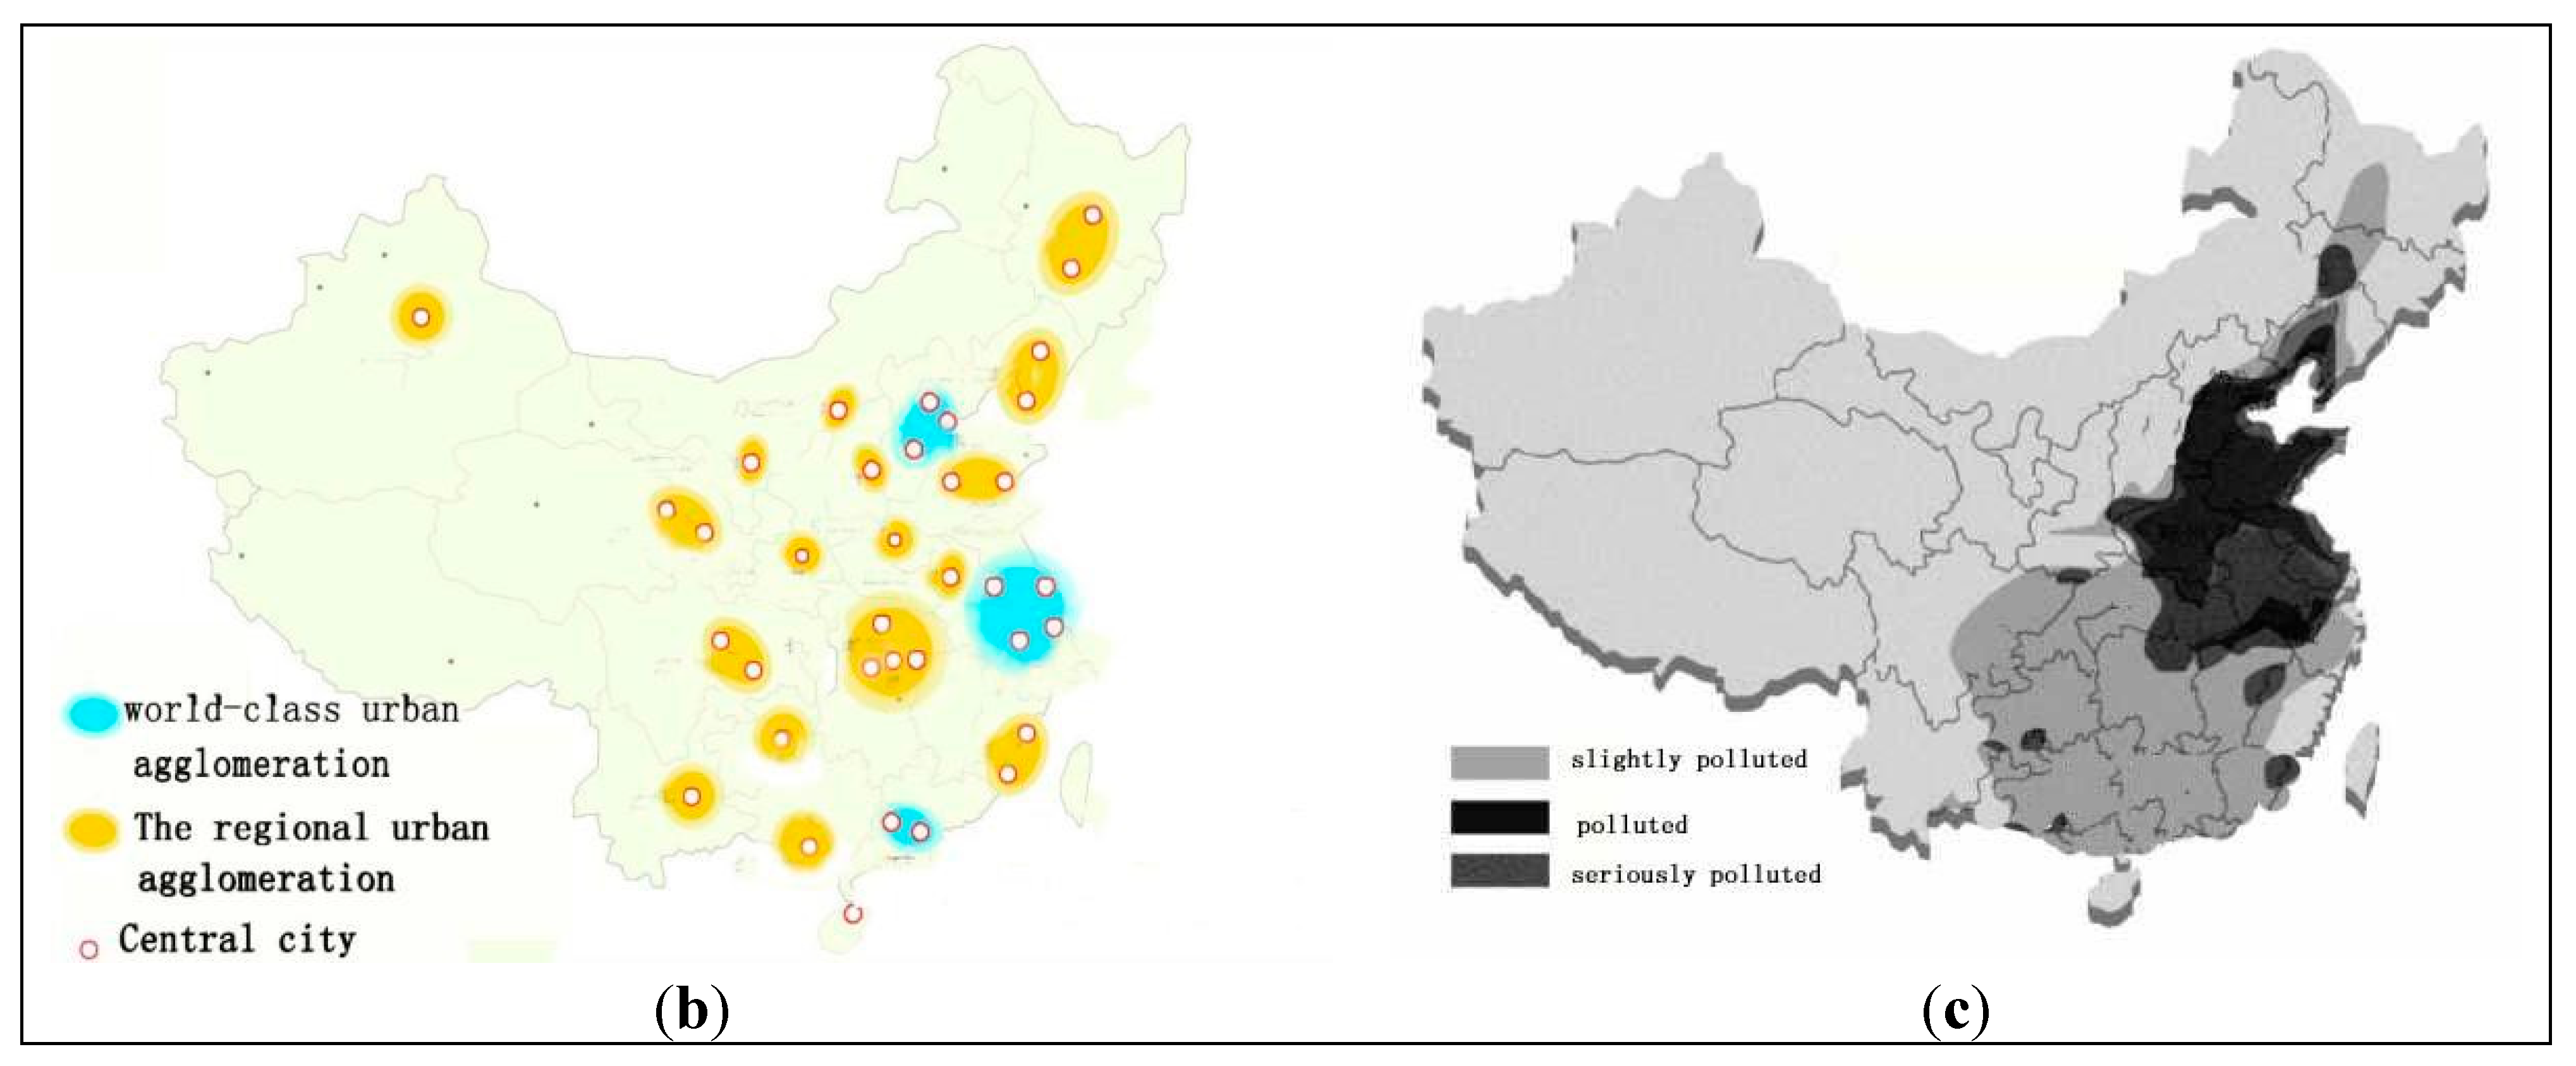
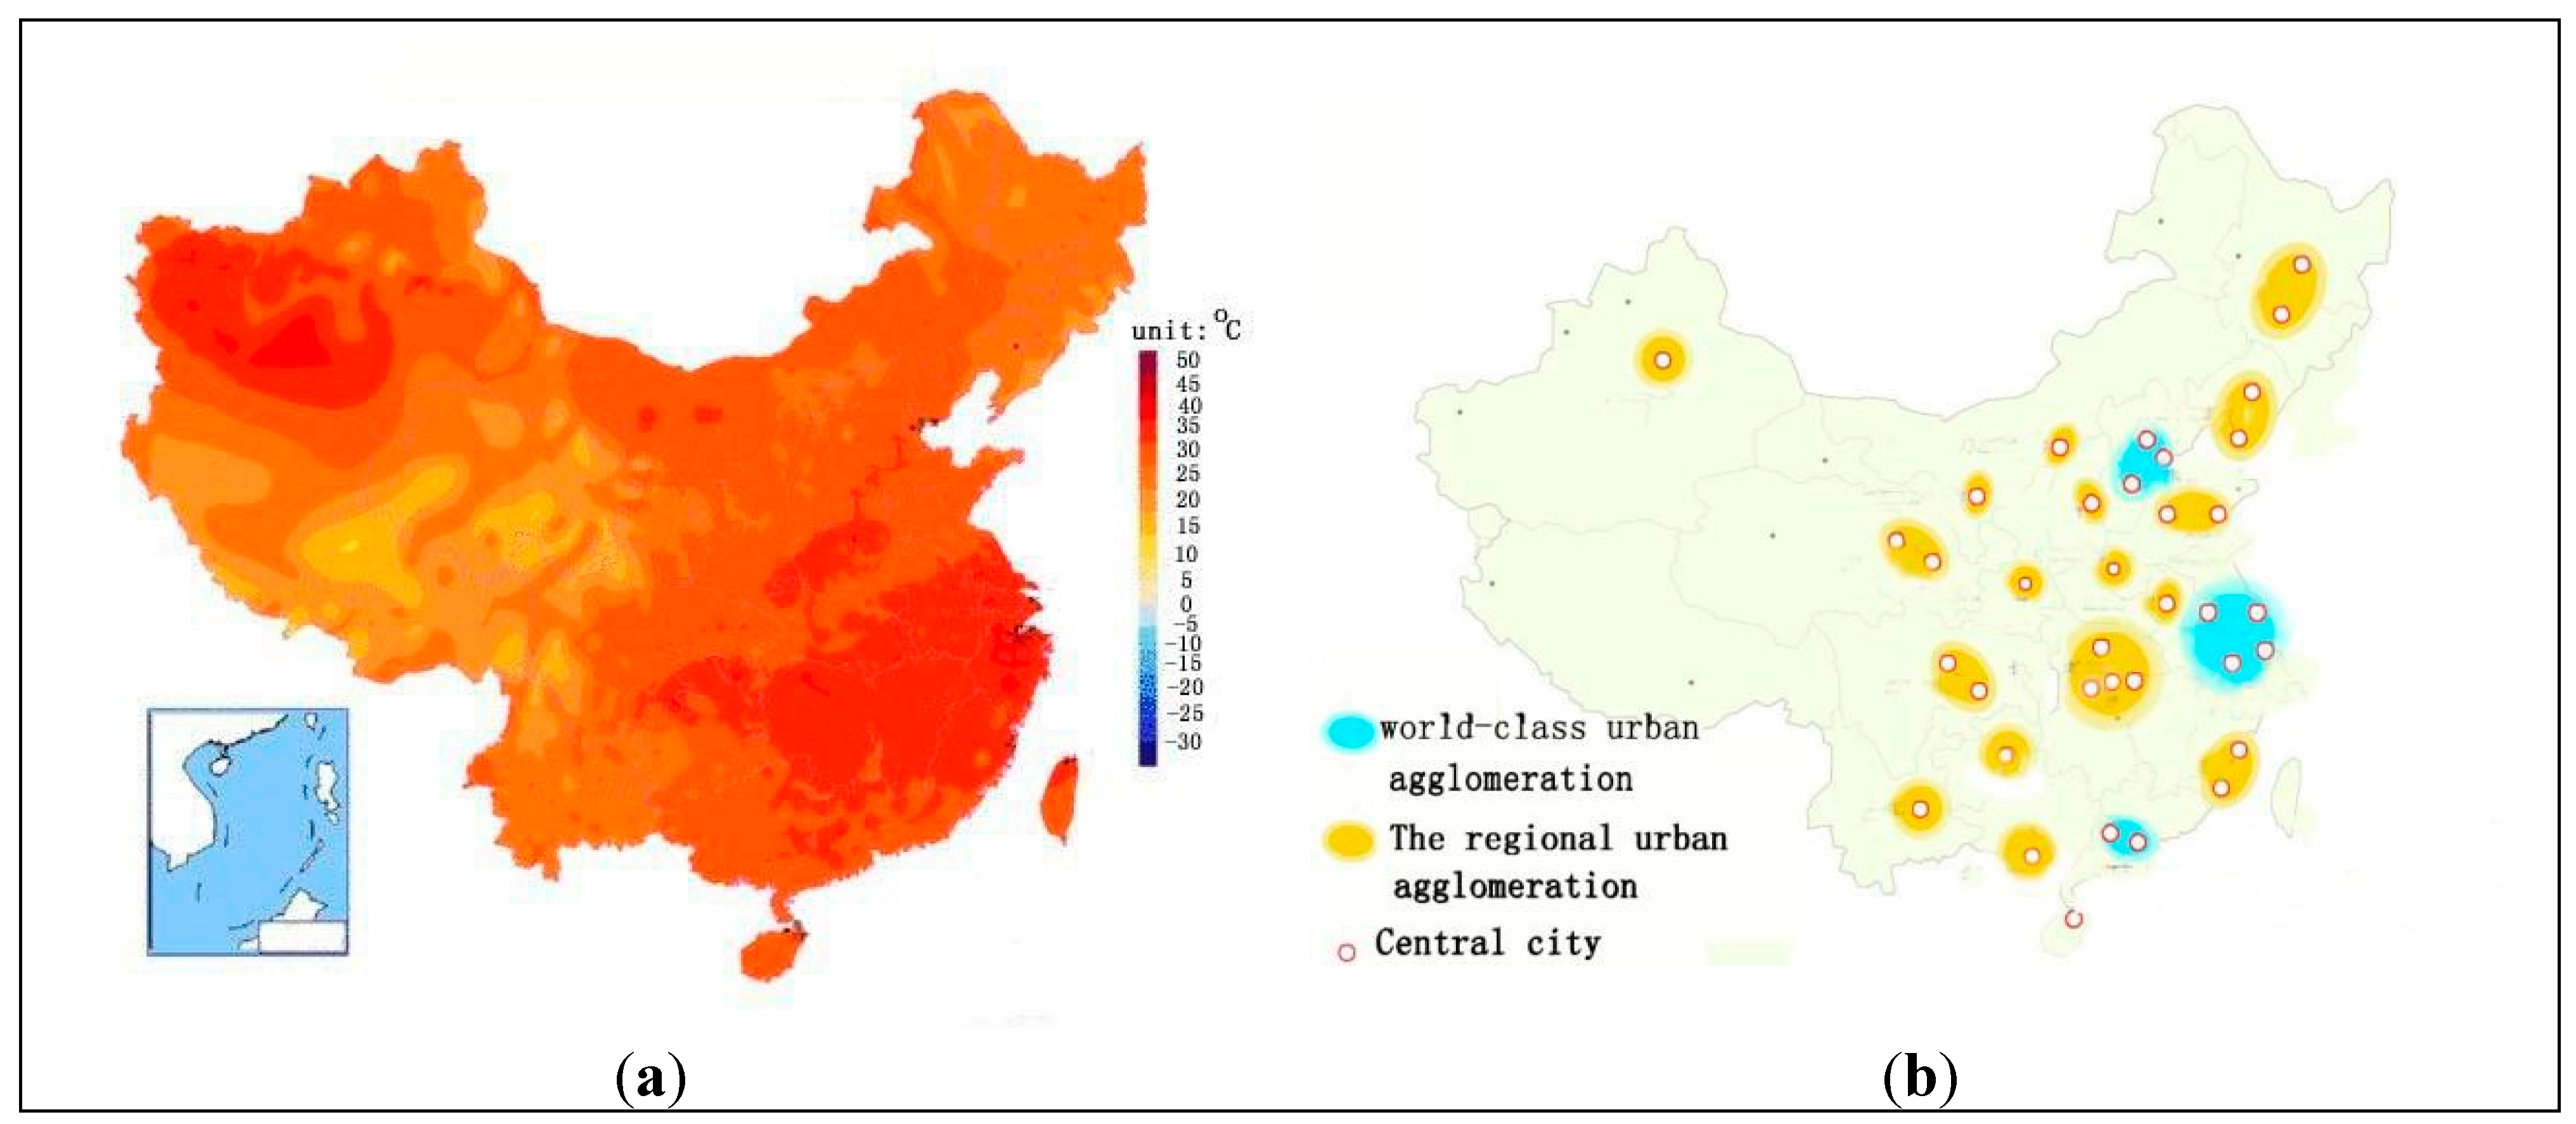
:1. Introduction

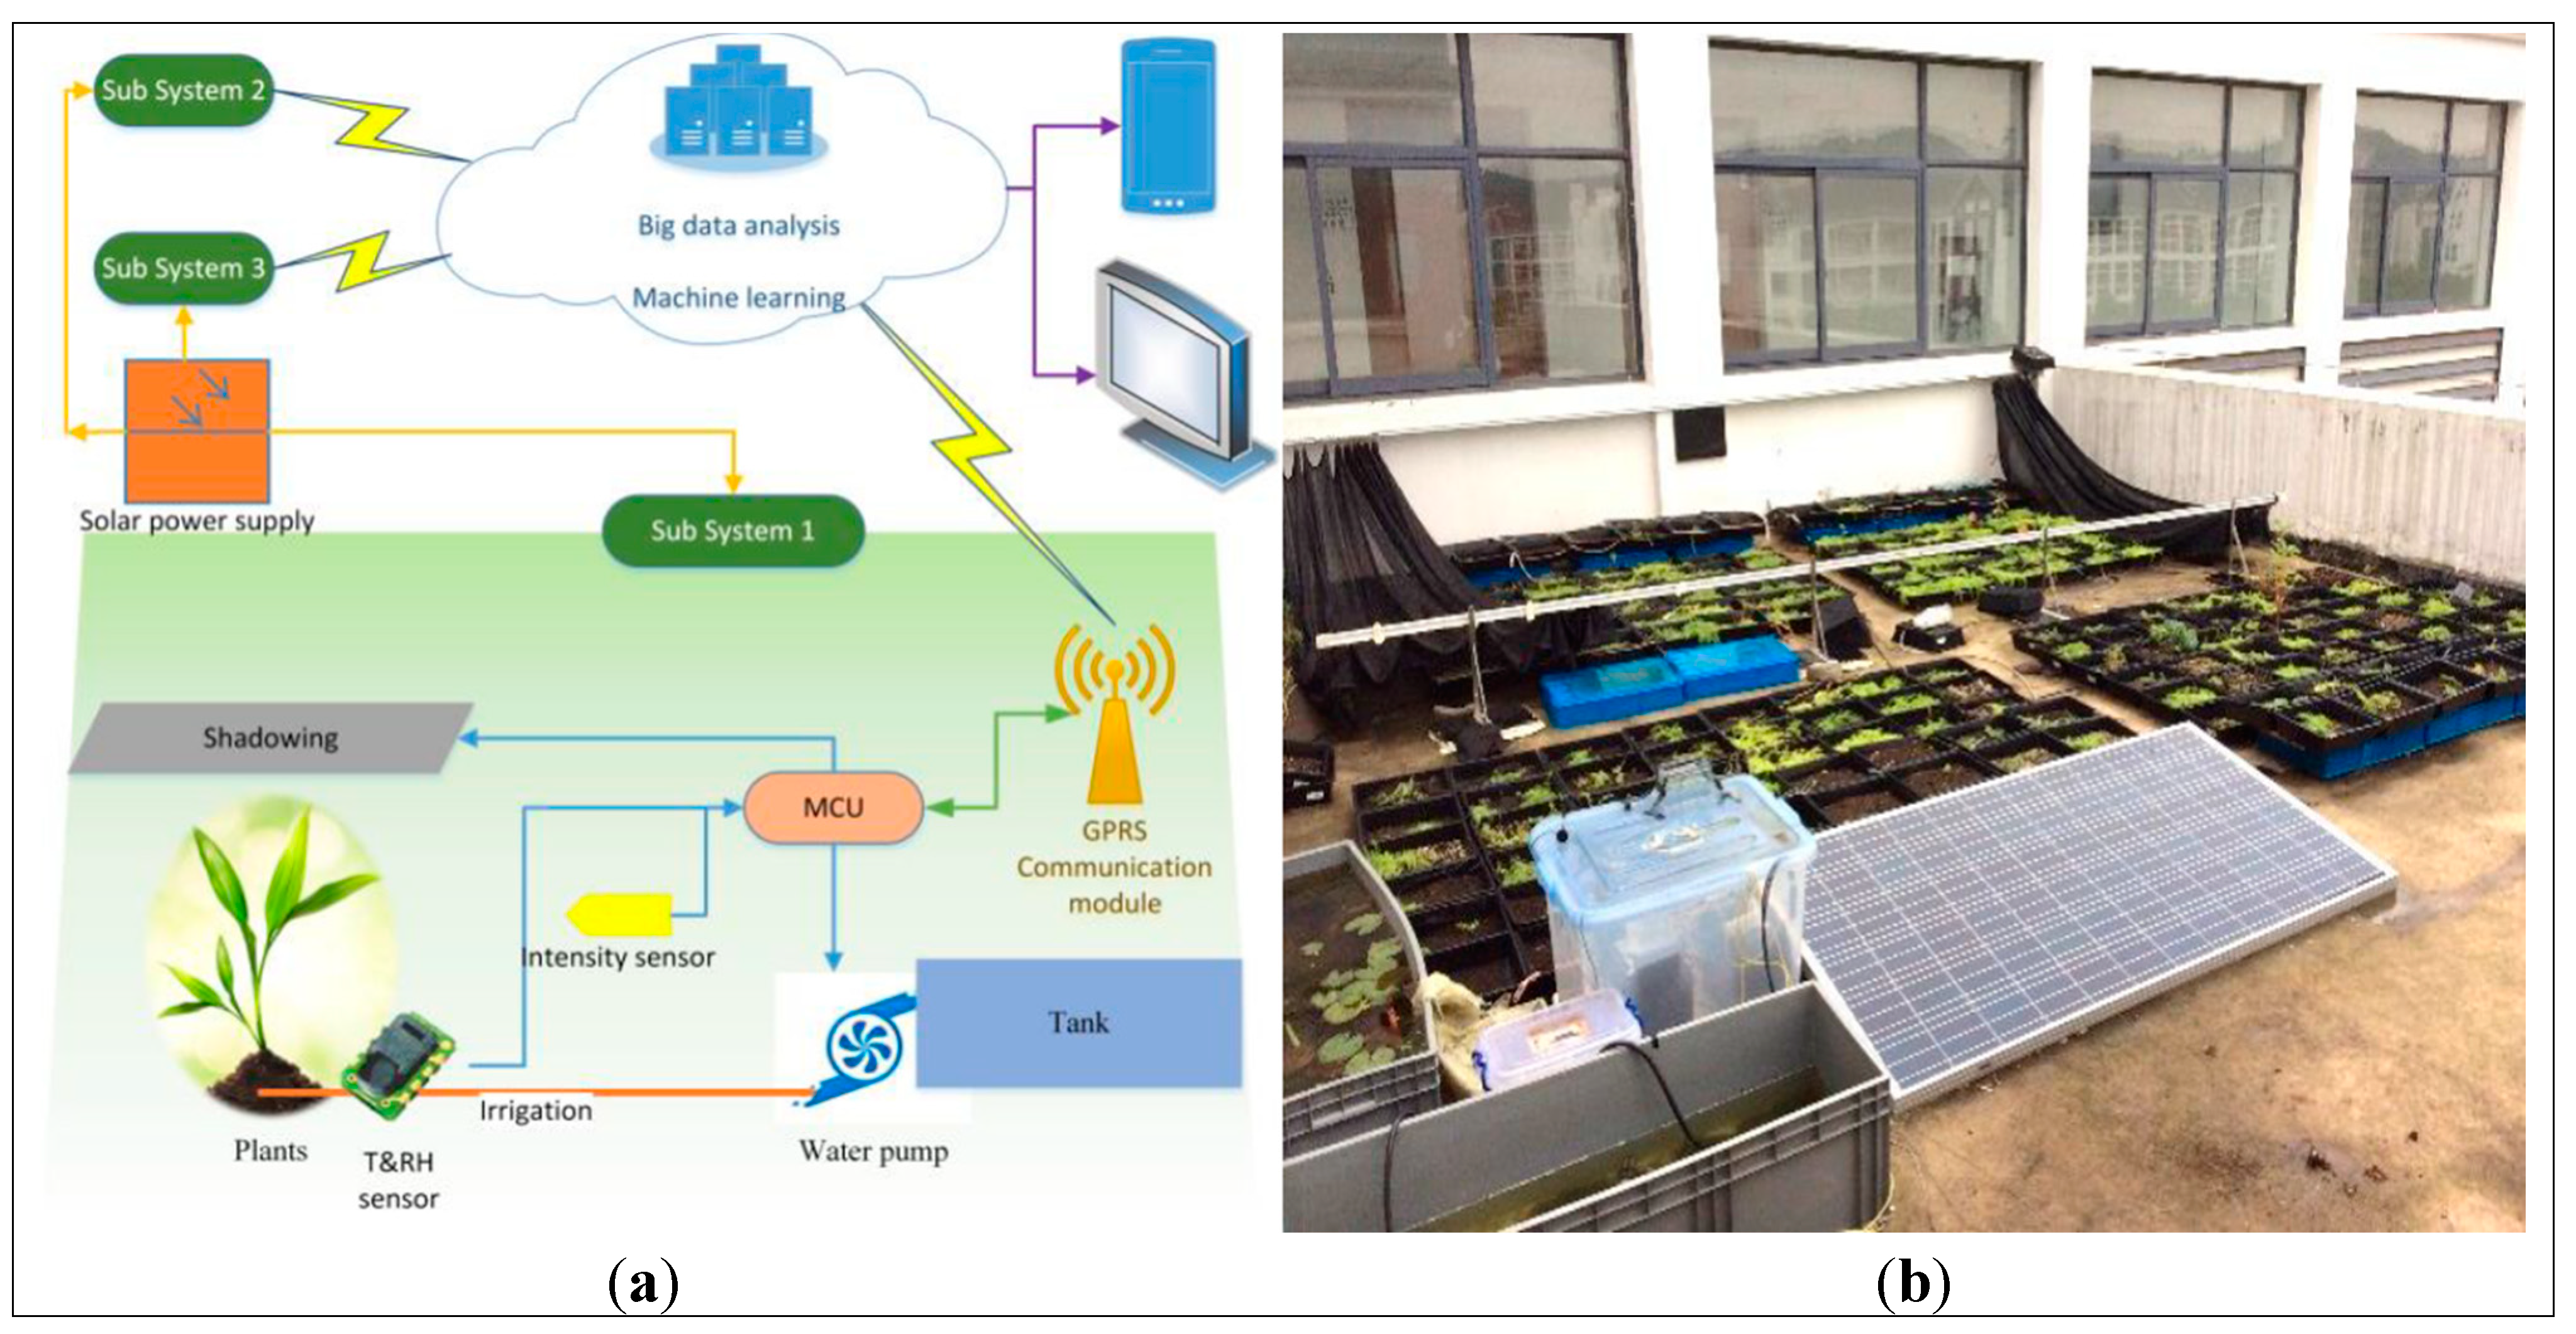
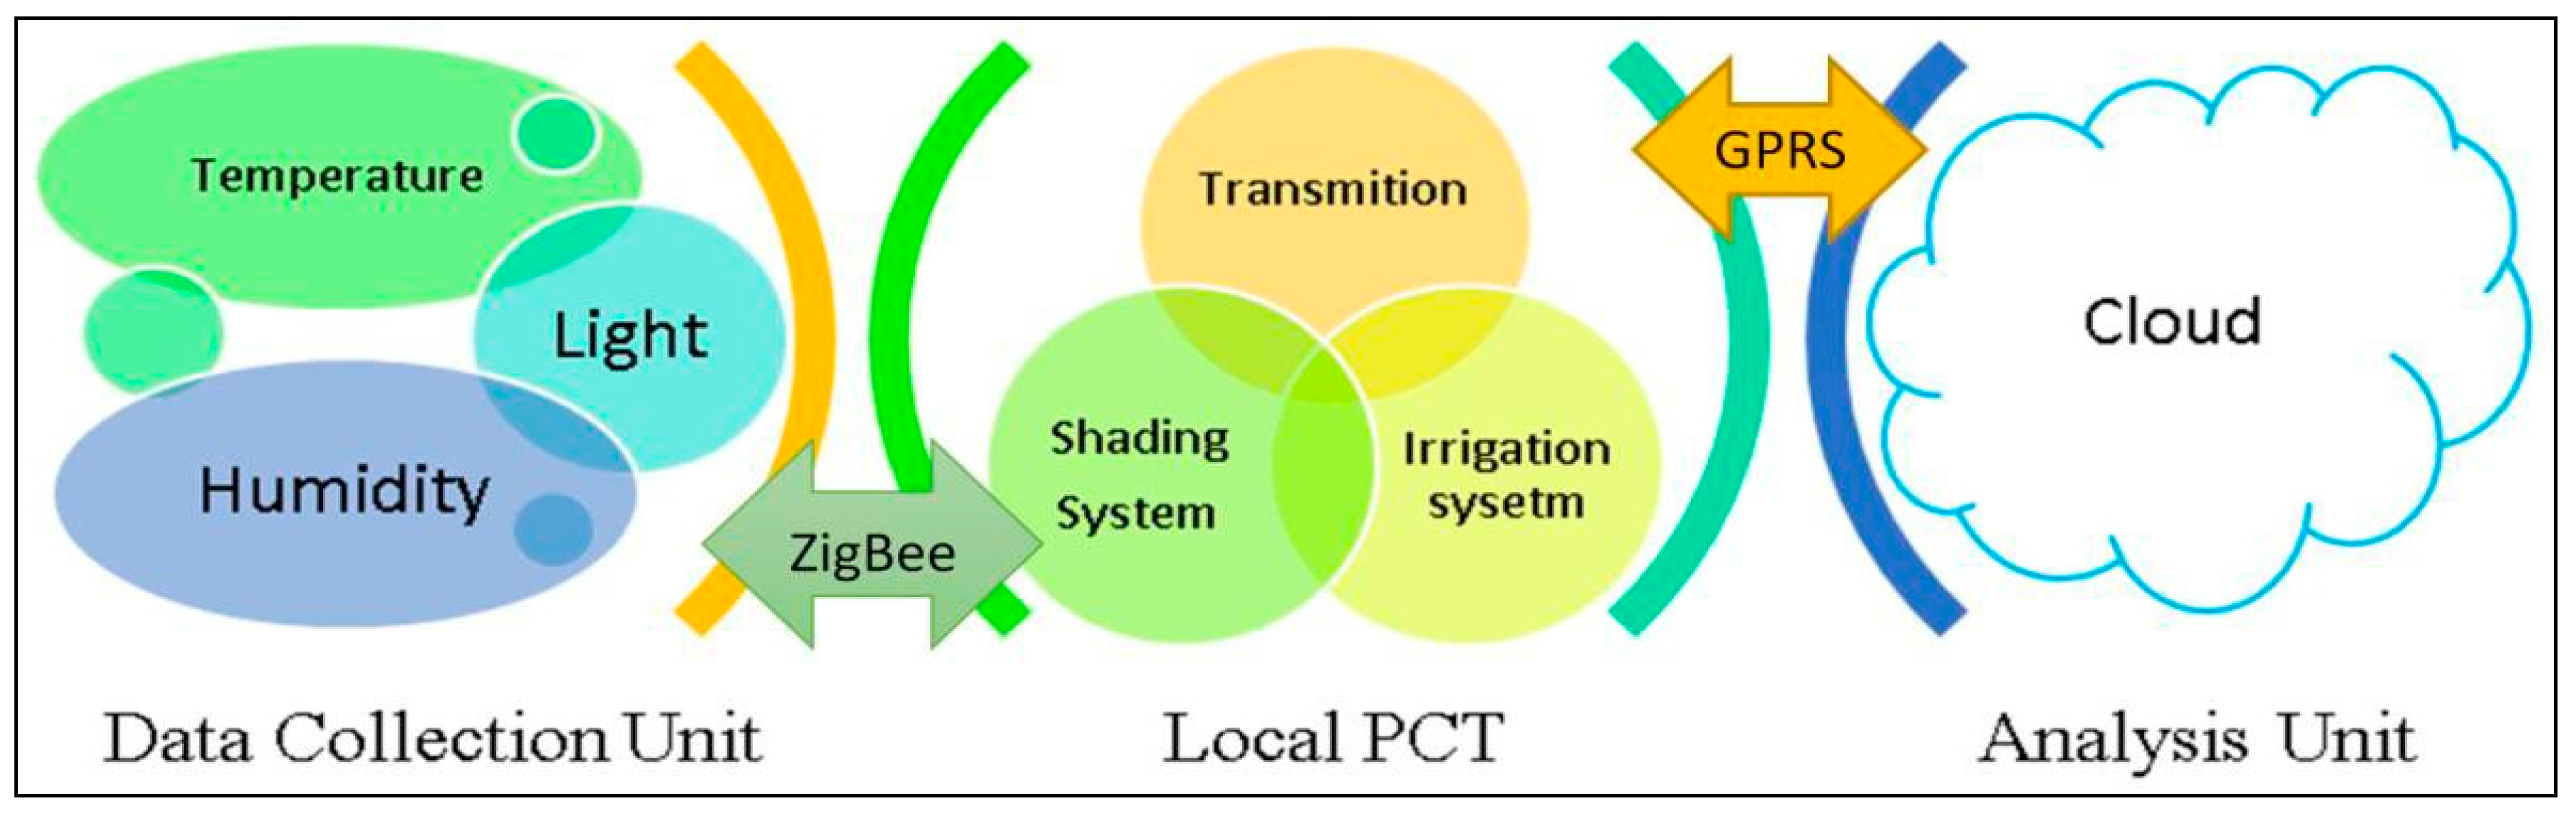
2. The GRM System

2.1. Hardware Design

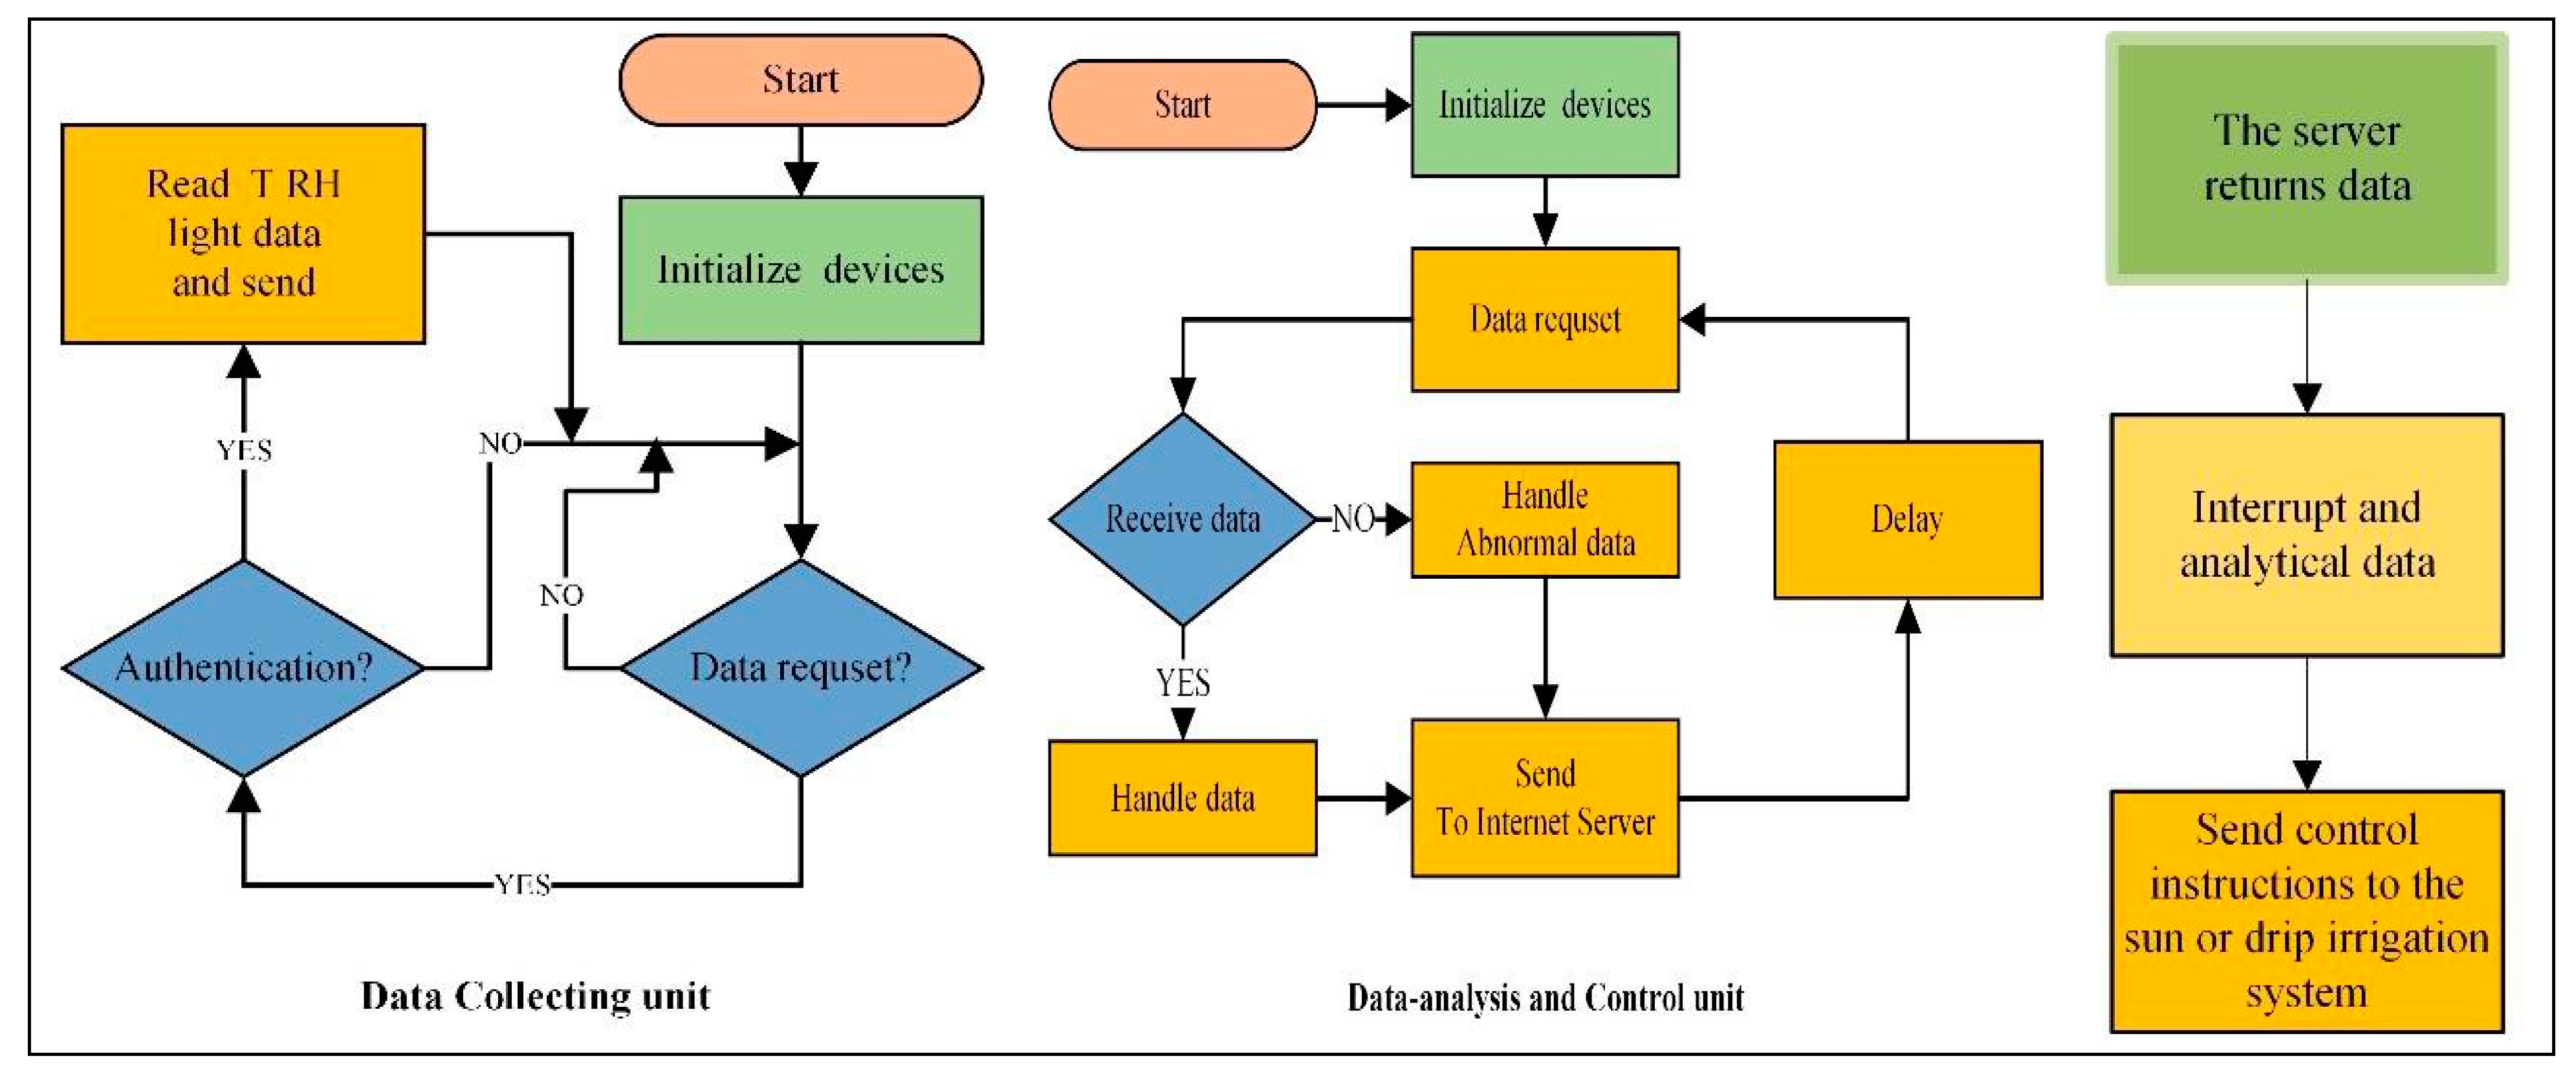
2.2. Software Design

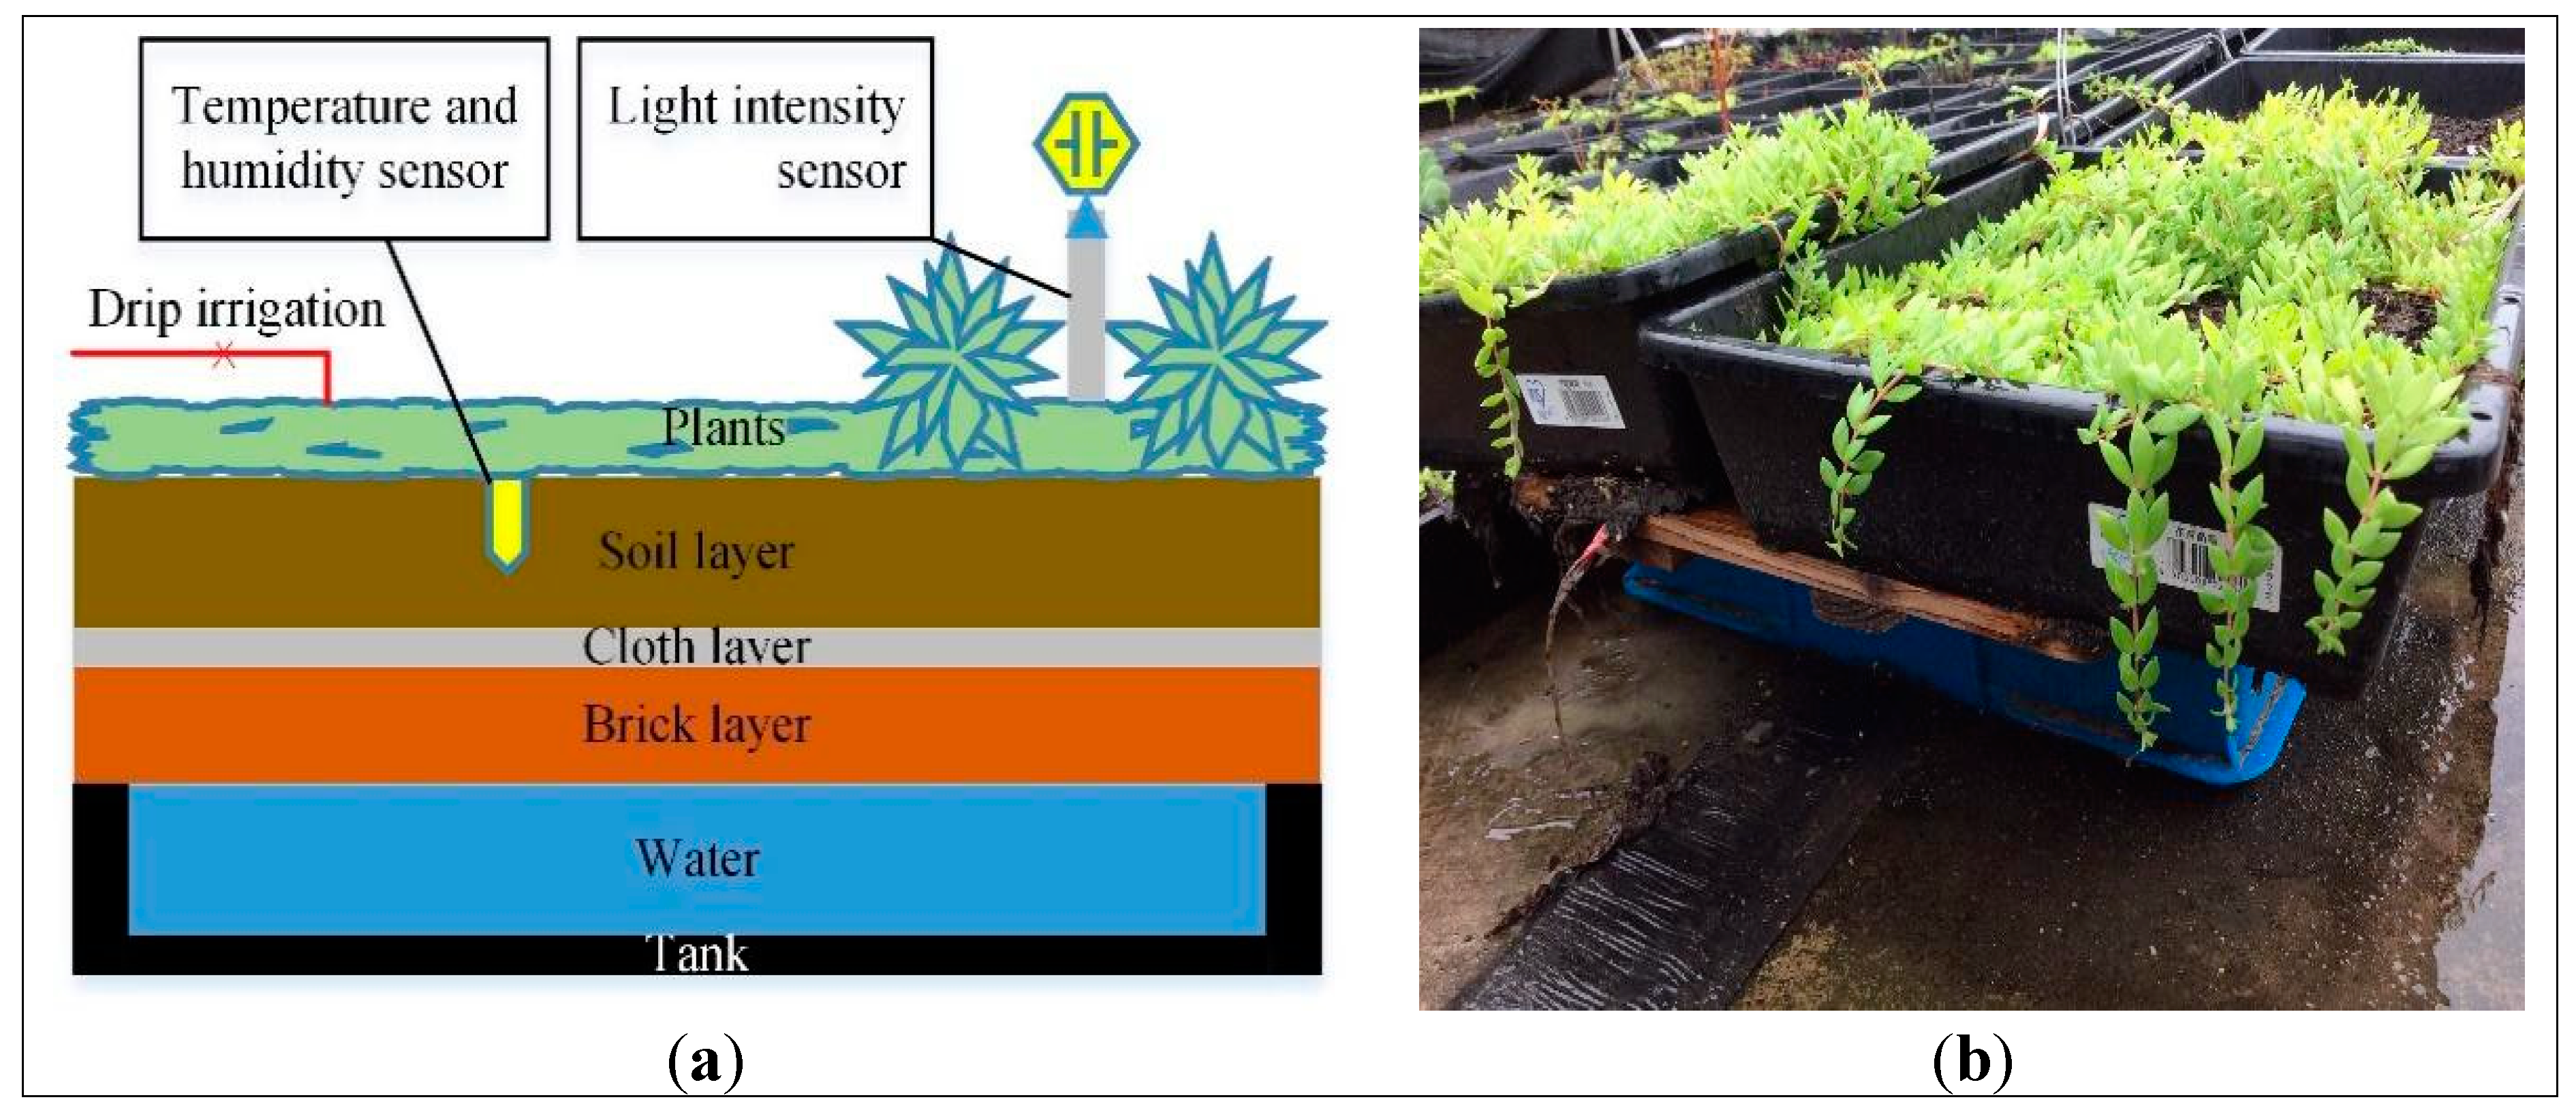
2.3. Pot Structure

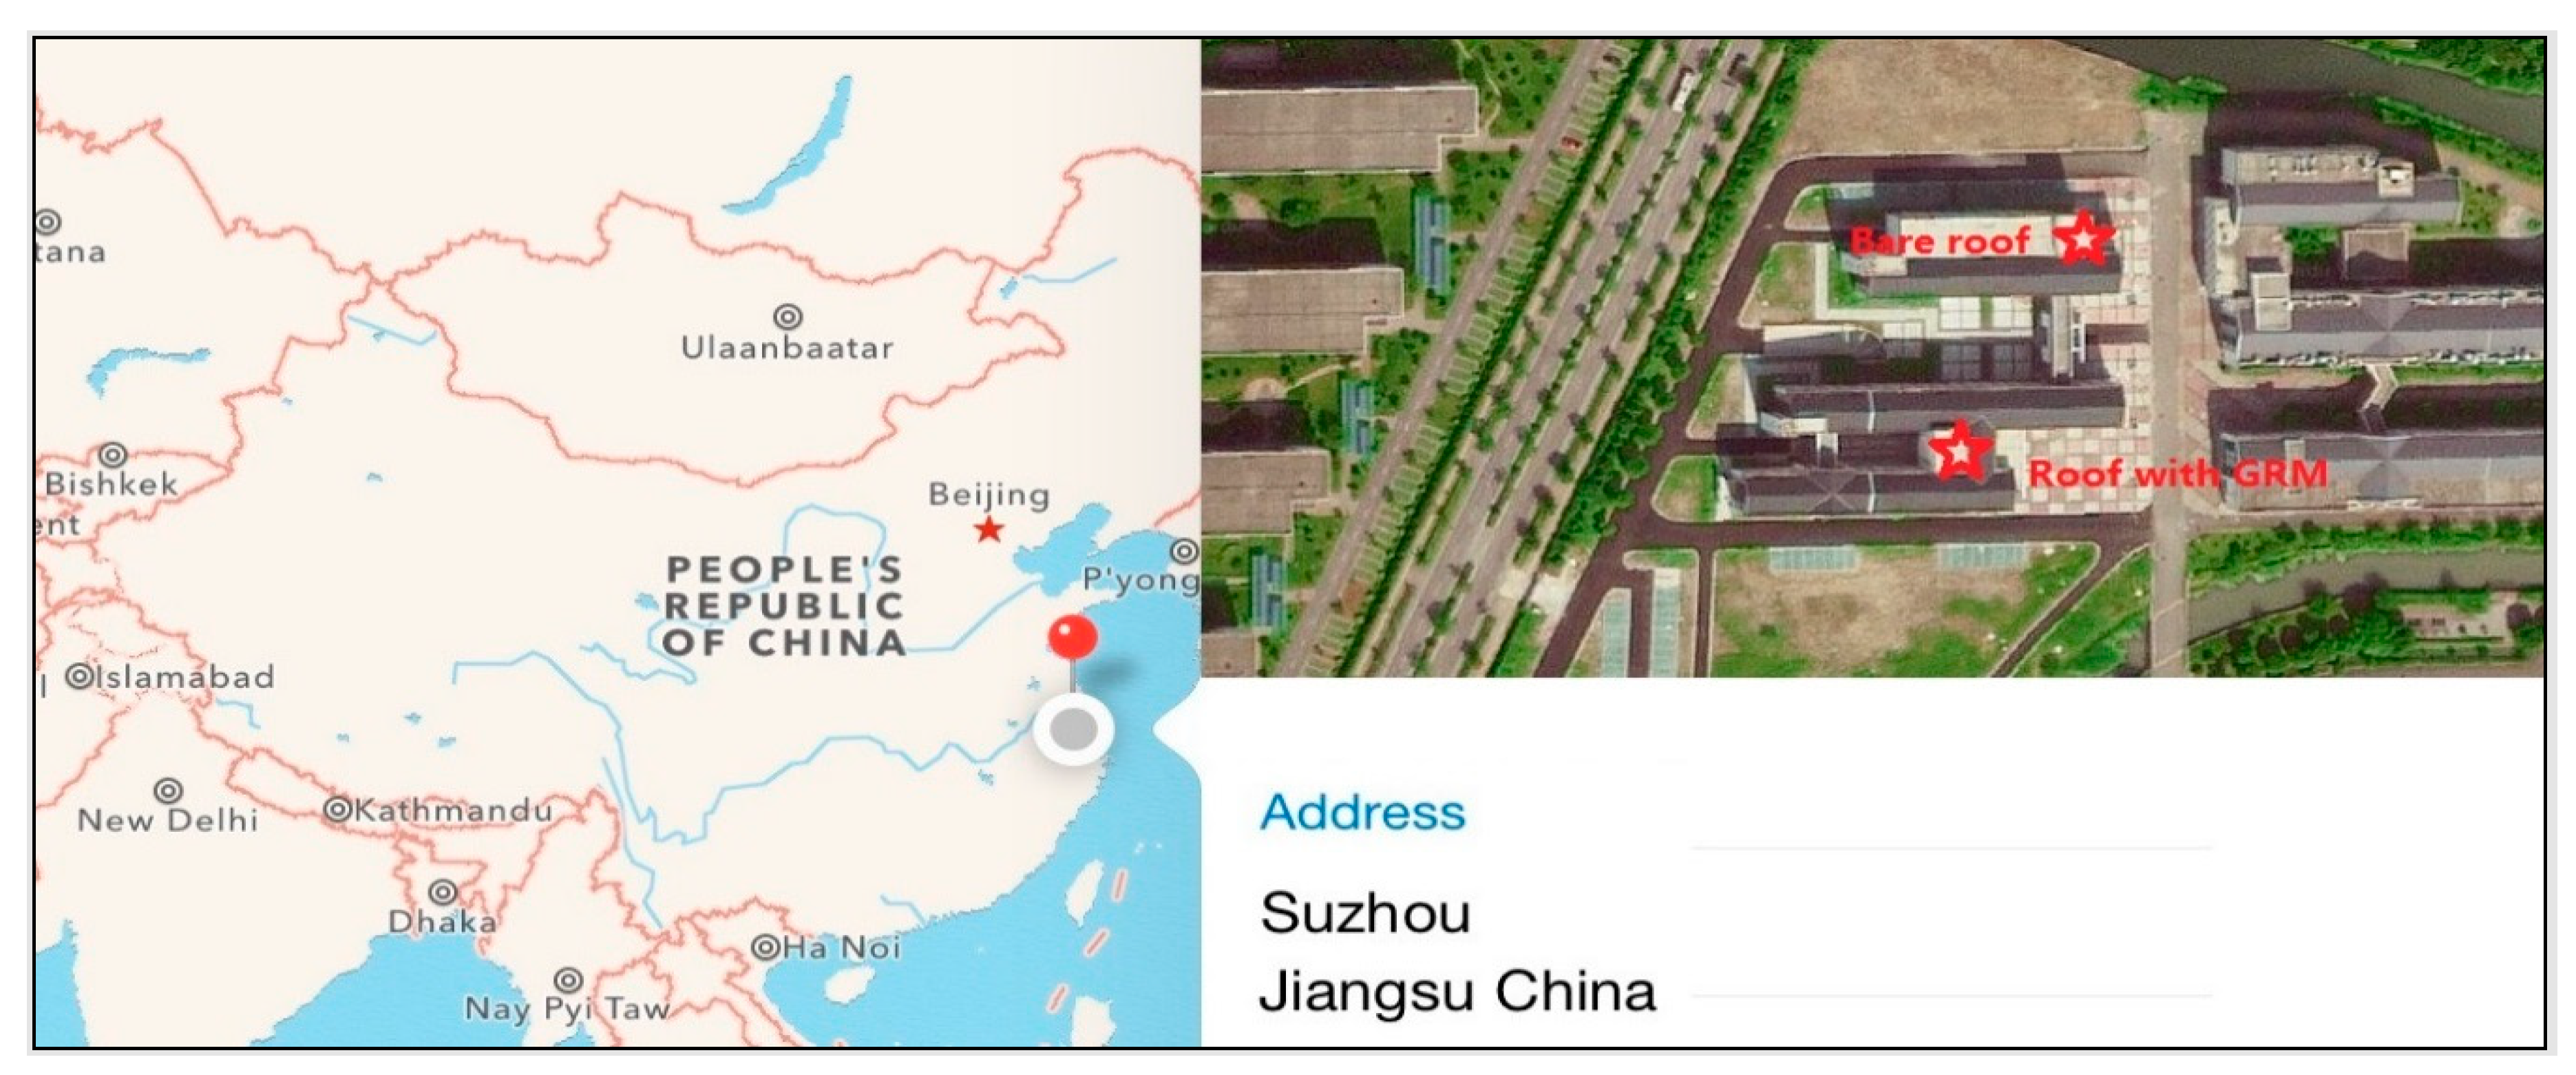
3. Experiment Setup


4. Results and Discussion
4.1. Survival Rate

| Non-Shadowed | Shadowed | |||||||||
| Plant | 3 cm | 3 cm + cover | 6 cm | 6 cm + cover | 9 cm | 3 cm | 3 cm + cover | 6 cm | 6 cm + cover | 9 cm |
| Sedum sarmentosum Bunge | 61% | 65% | 68% | 83% | 95% | 79% | 82% | 89% | 100% | 100% |
| Lolium perenne L. | 62% | 72% | 88% | 90% | 99% | 81% | 91% | 95% | 100% | 100% |
| Capsicum annuum L. | 0 | 0 | 38% | 40% | 61% | 0 | 17% | 58% | 82% | 82% |
| Portulaca grandiflora | 0 | 0 | 19% | 28% | 39% | 0 | 6% | 31% | 49% | 51% |
| Non-irrigated | Irrigated | |||||||||
| 3 cm | 3 cm + cover | 6 cm | 6 cm + cover | 9 cm | 3 cm | 3 cm + cover | 6 cm | 6 cm + cover | 9 cm | |
| Sedum sarmentosum Bunge | 61% | 65% | 68% | 83% | 95% | 86% | 98% | 99% | 100% | 100% |
| Lolium perenne L. | 62% | 72% | 88% | 90% | 99% | 92% | 97% | 99% | 100% | 100% |
| Capsicum annuum L. | 0 | 0 | 38% | 40% | 61% | 65% | 69% | 74% | 80% | 100% |
| Portulaca grandiflora | 0 | 0 | 19% | 28% | 39% | 58% | 63% | 69% | 79% | 100% |
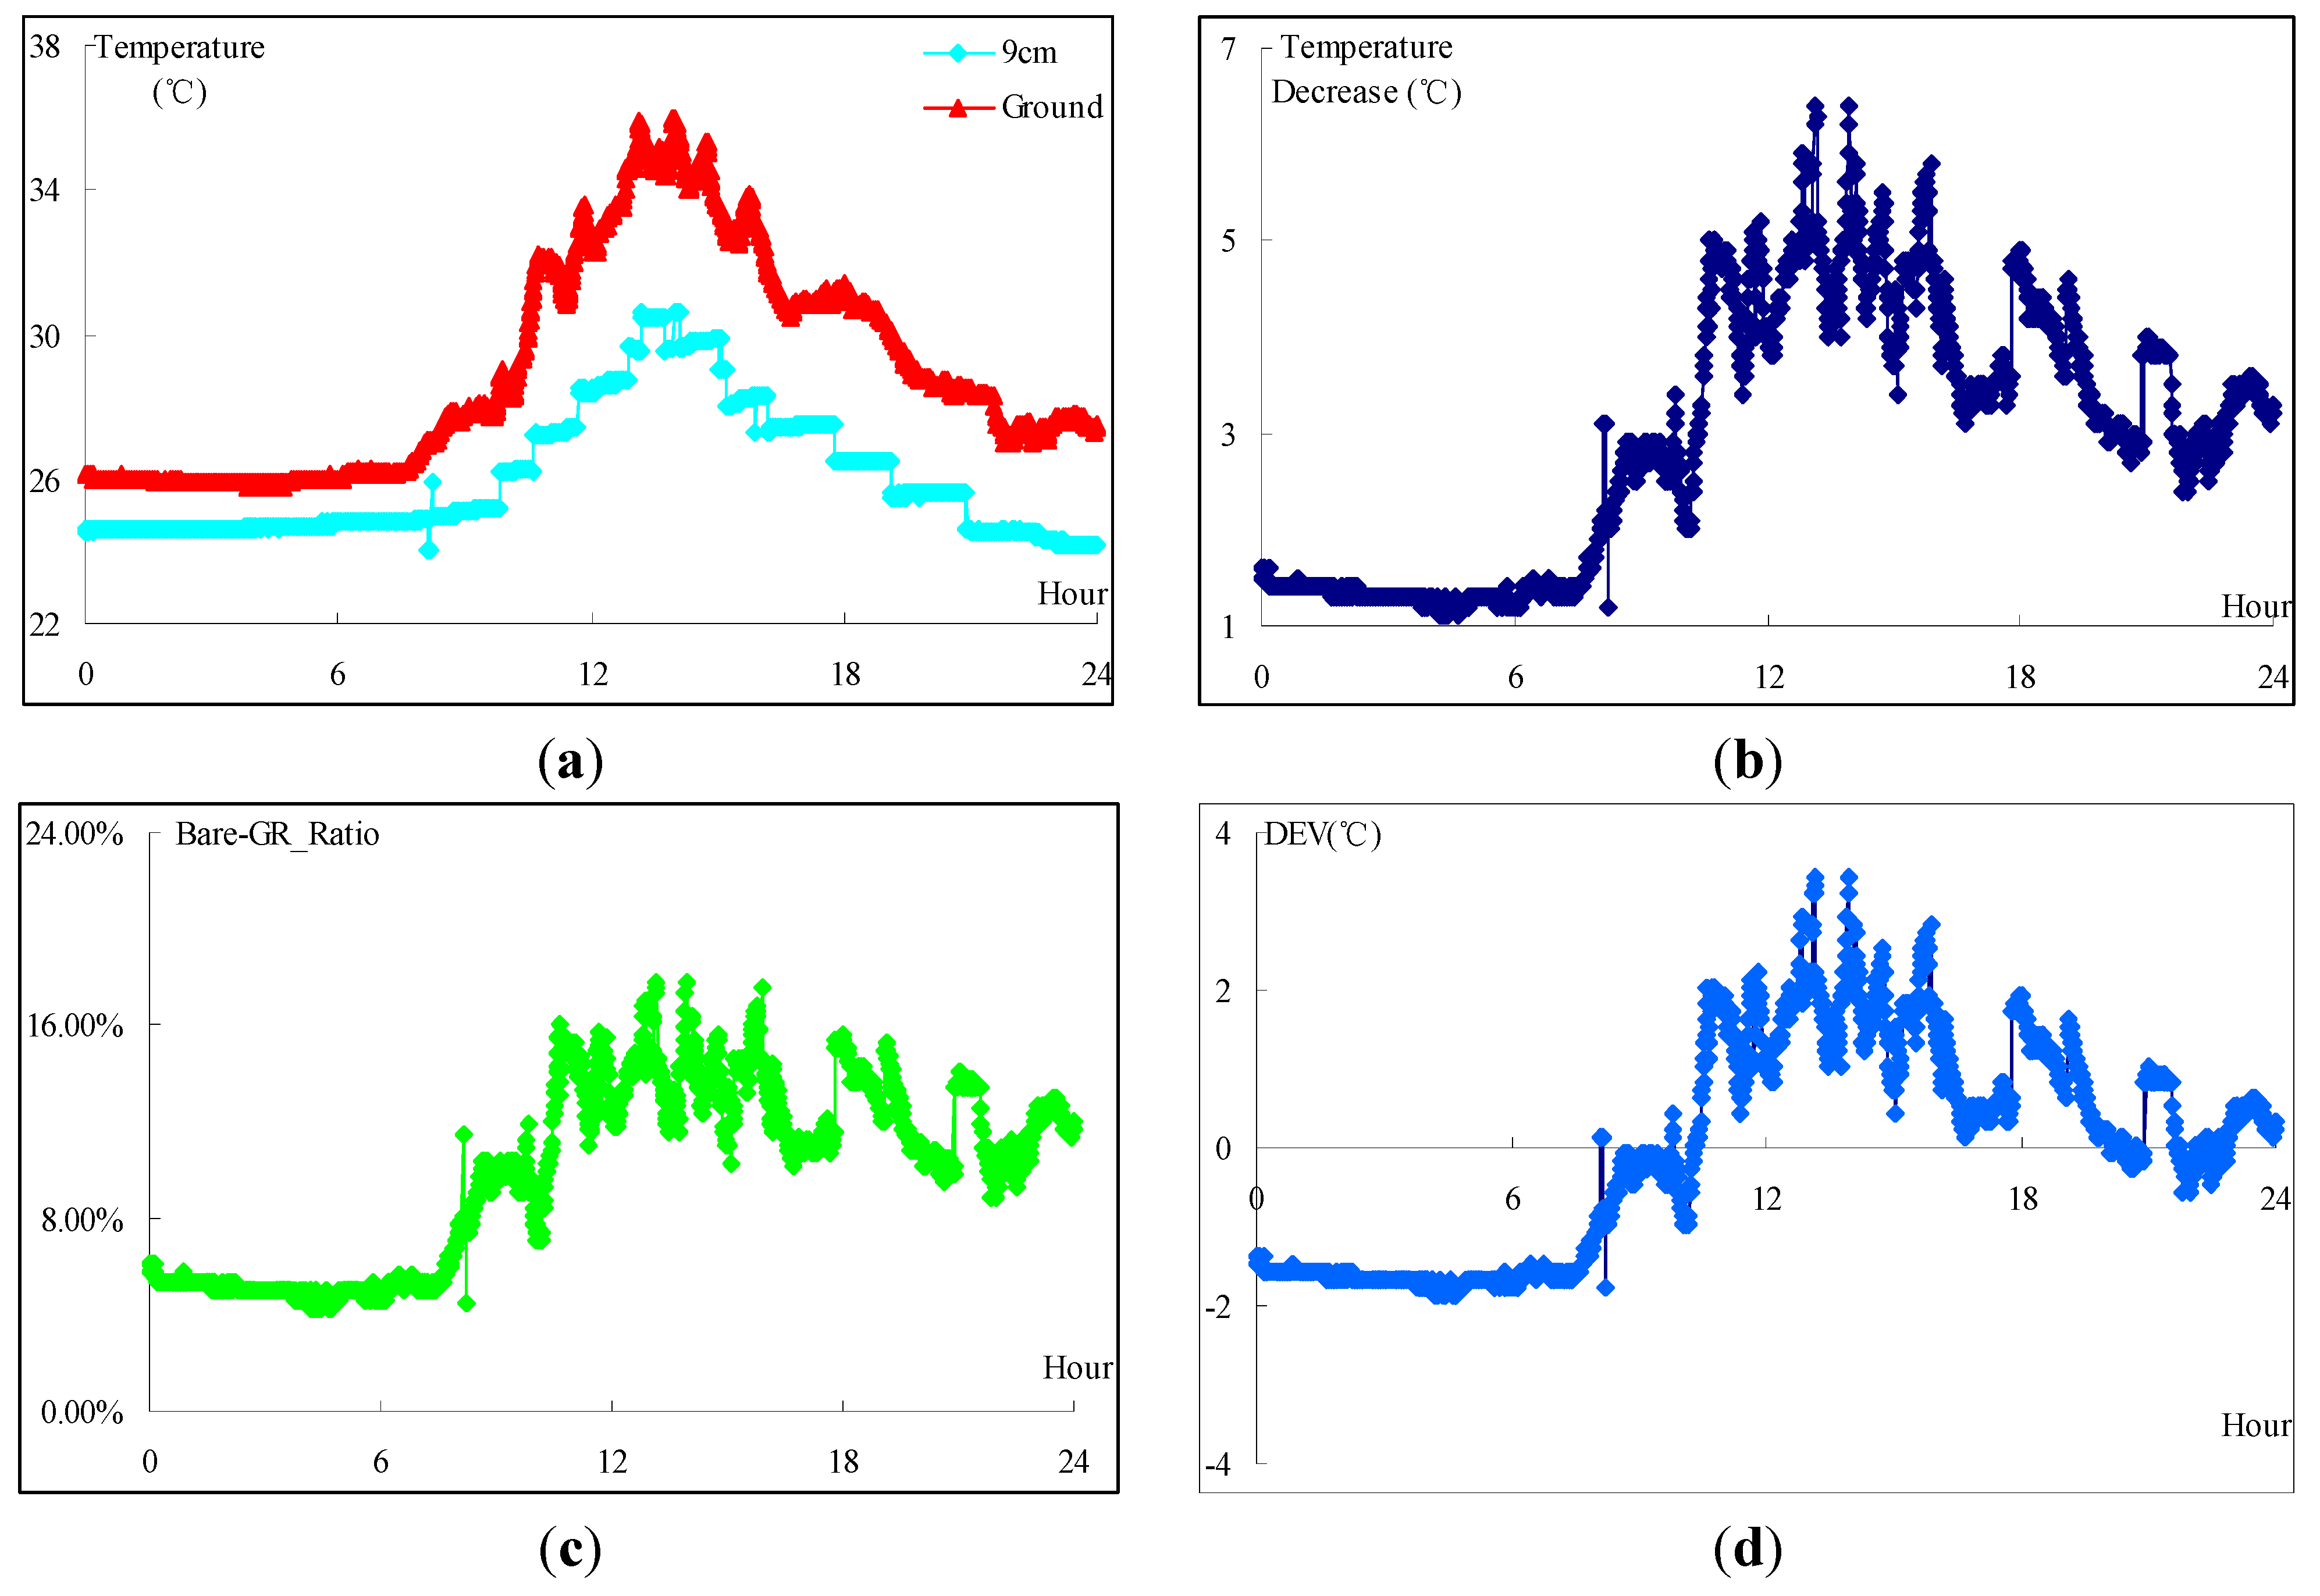
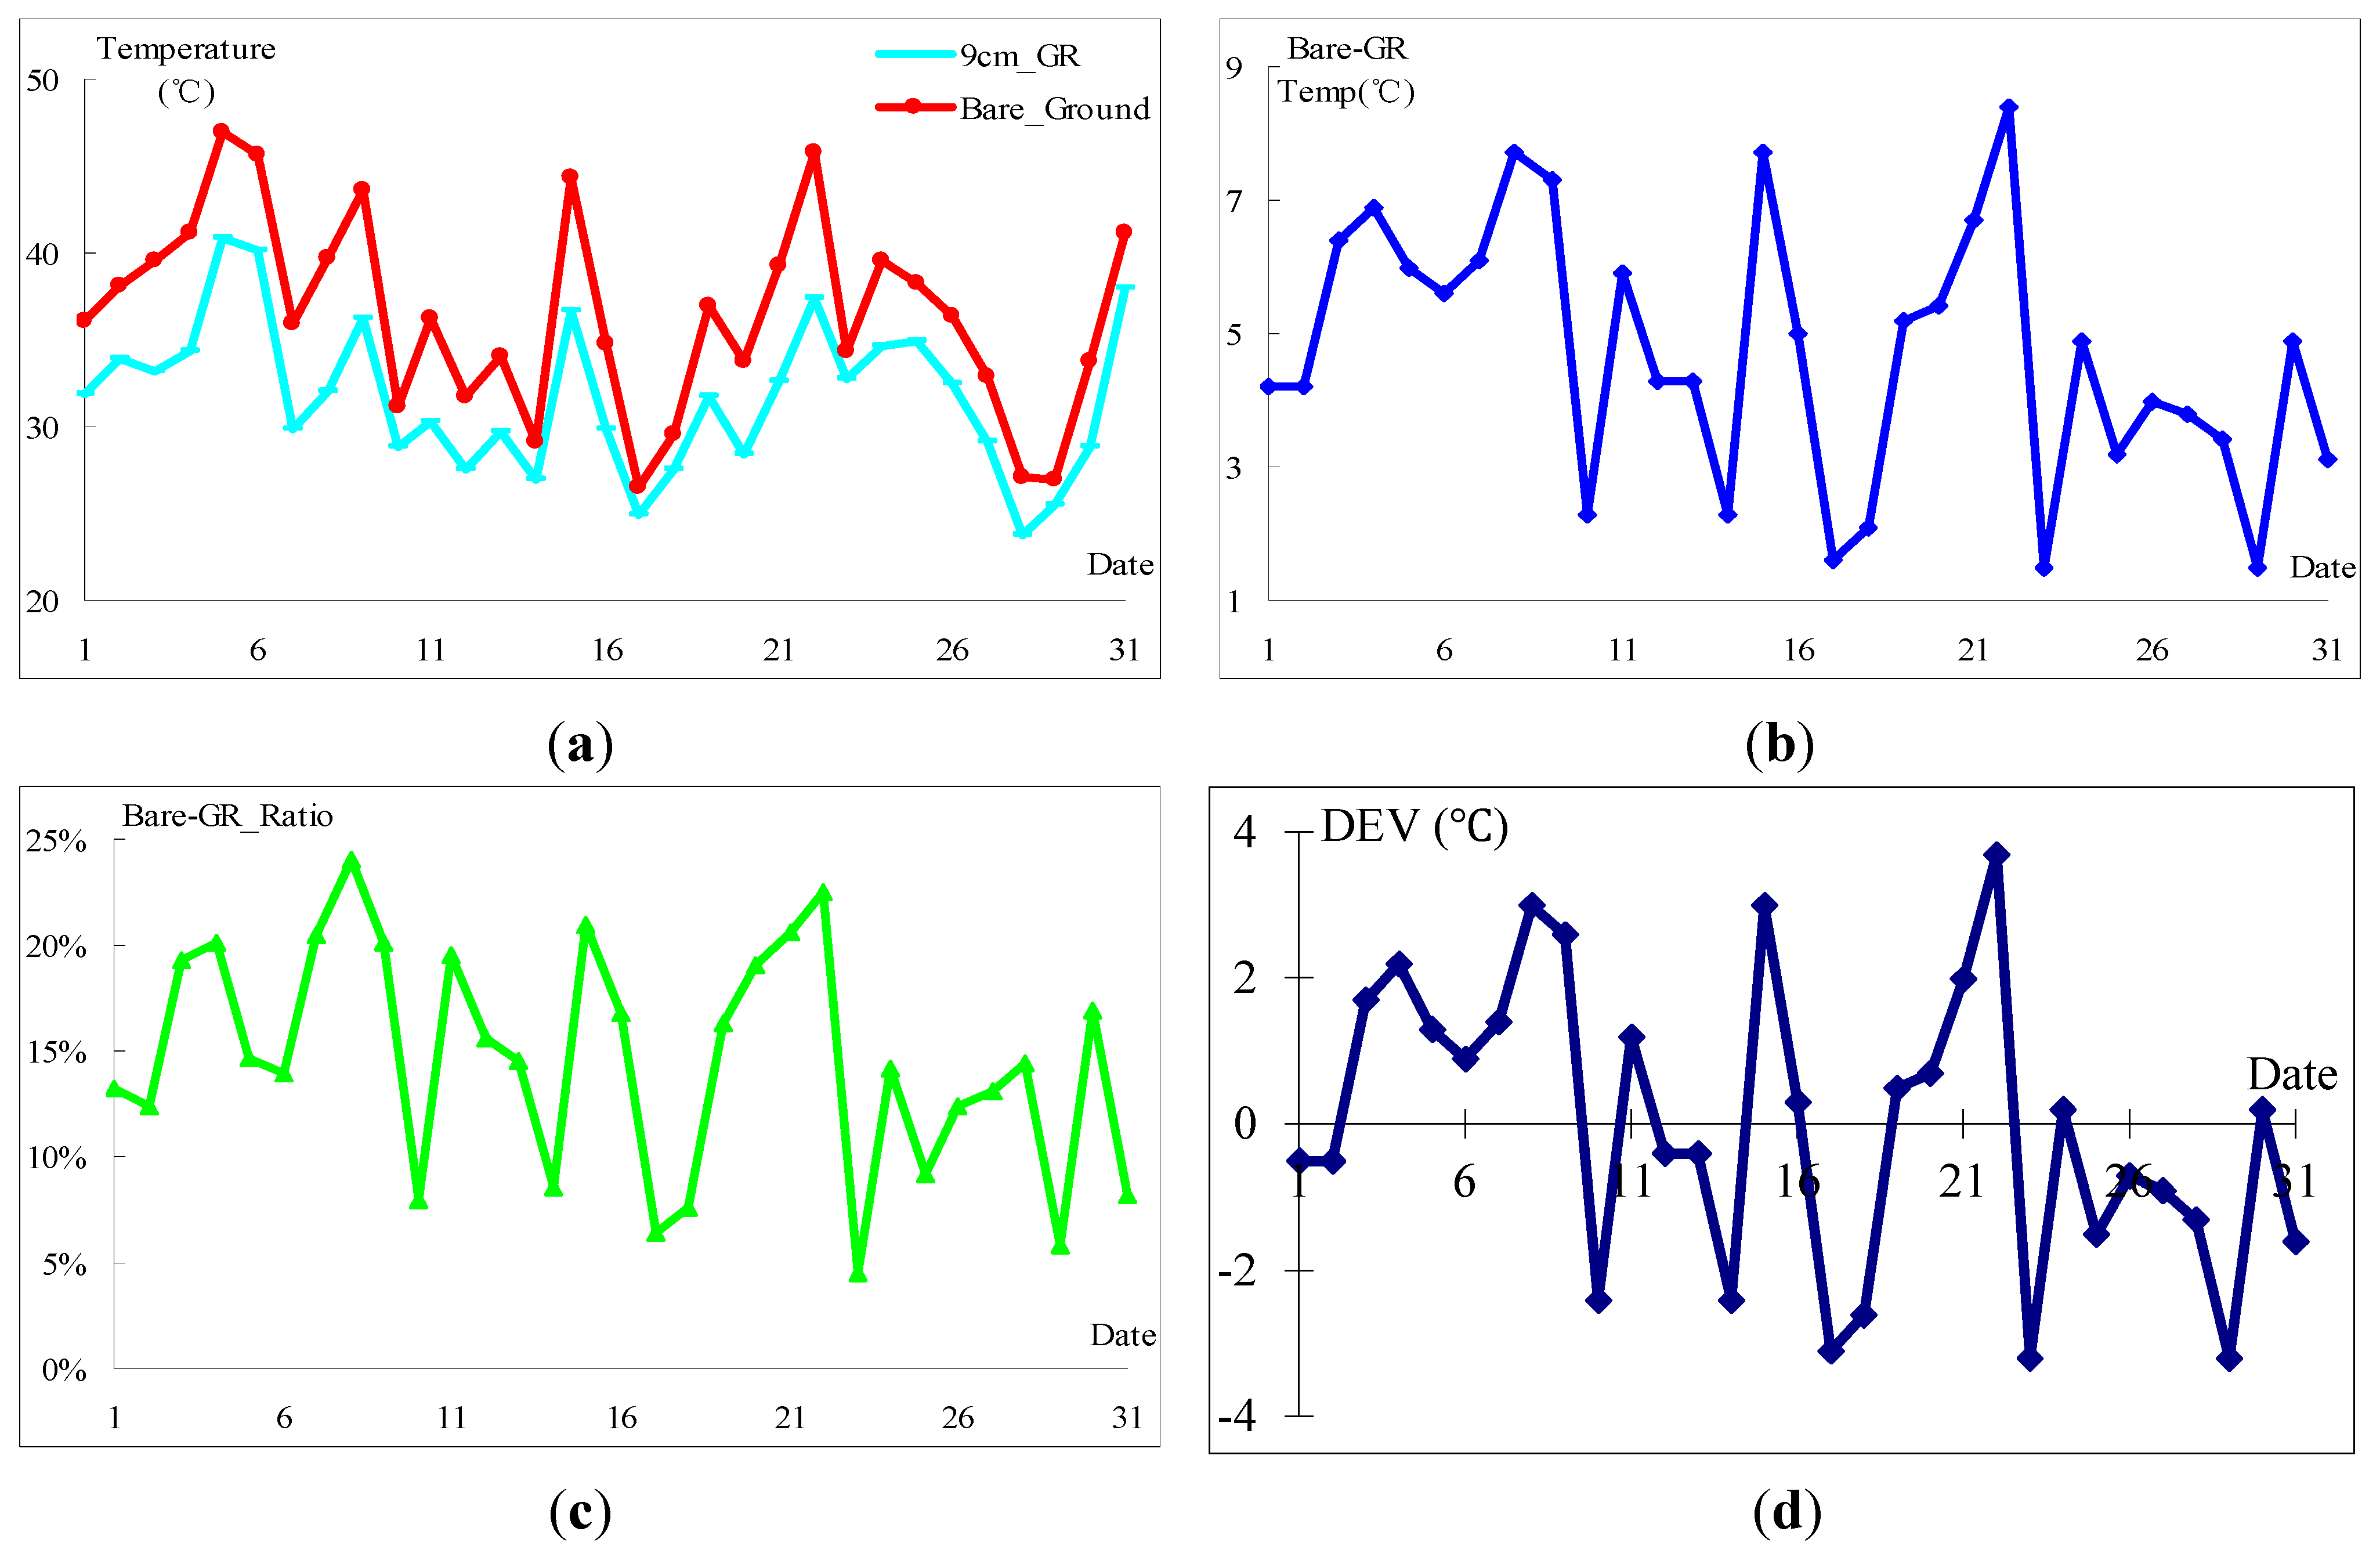
4.2. Thermal Effects

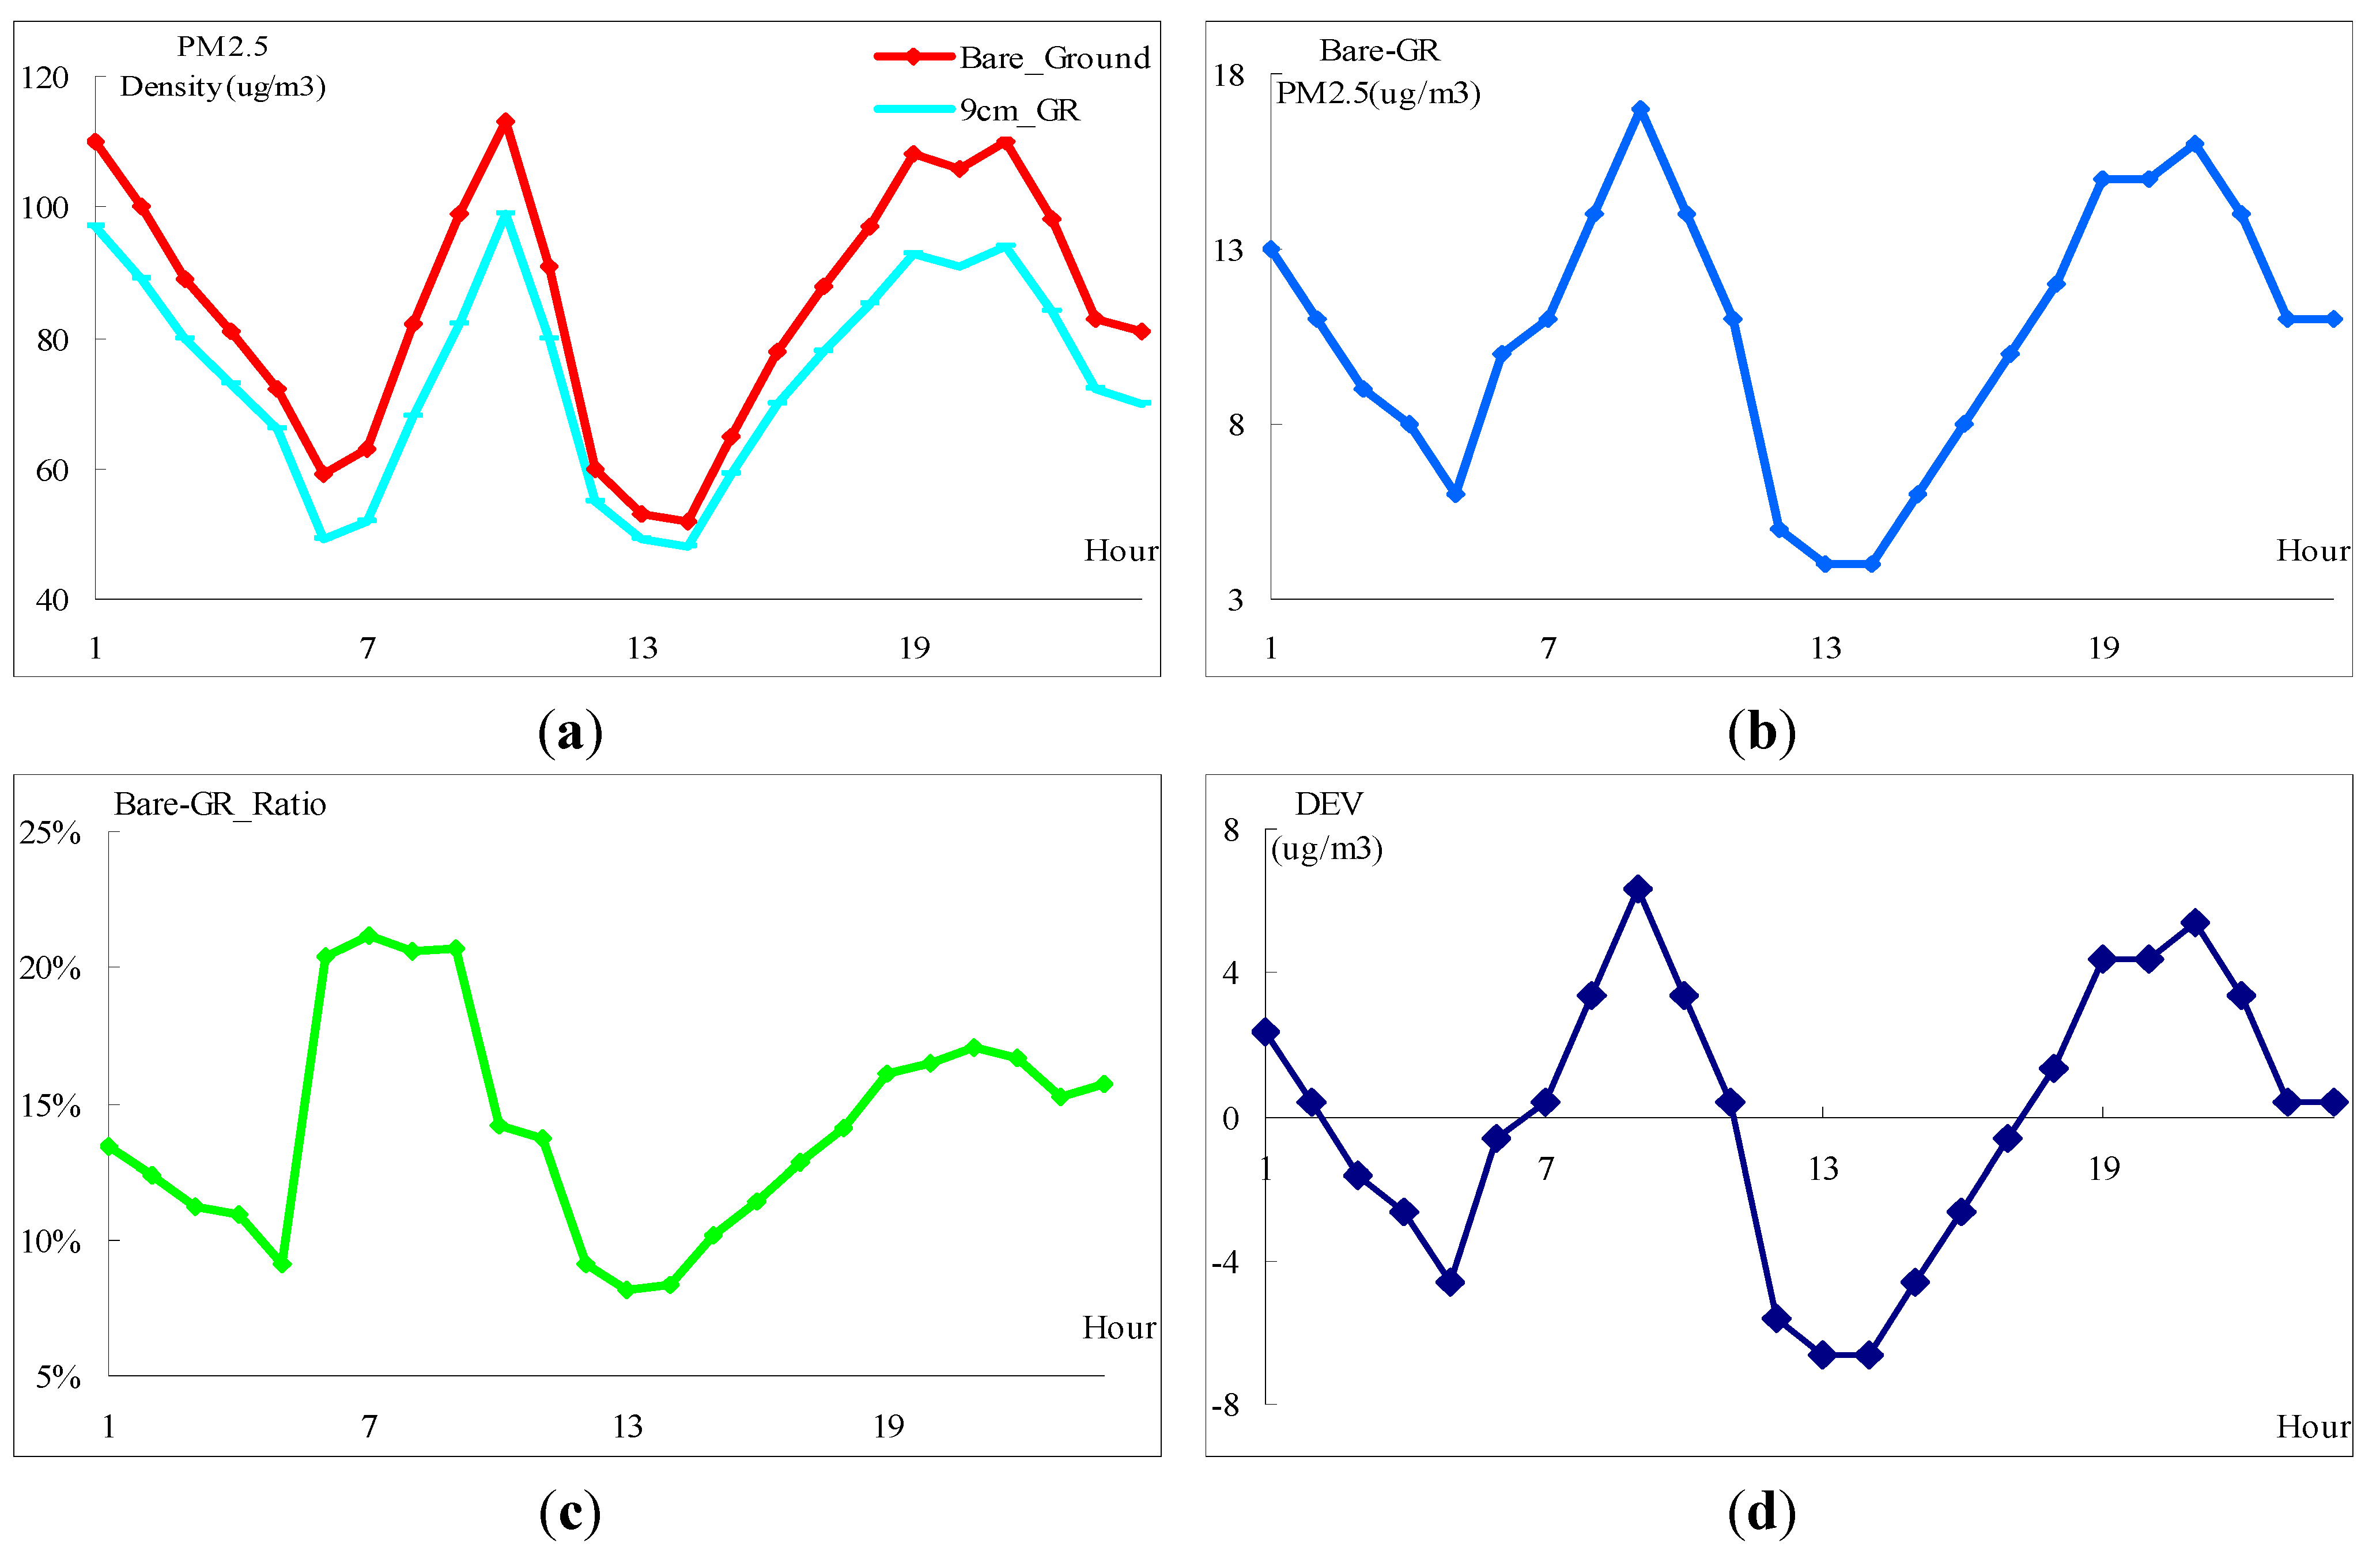
4.3. PM2.5 Reduction
5. Conclusions and Future Work
Acknowledgments
Author Contributions
Conflicts of Interest
References
- Miller, K.A.; Siscovick, D.S.; Sheppard, L.; Shepherd, K.; Sullivan, J.H.; Anderson, G.L.; Kaufman, J.D. Long-term exposure to air pollution and incidence of cardiovascular event in woman. N. Engl. J. Med. 2007, 356, 447–458. [Google Scholar] [CrossRef] [PubMed]
- Kunzli, N.; Mudway, I.S.; Götschi, T.; Shi, T.; Kelly, F.J.; Cook, S.; Burney, P.; Forsberg, B.; Gauderman, J.W.; Hazenkamp, M.E.; et al. Comparison of oxidative properties, light absorbance, and total and elemental mass concentration of ambient PM2.5 collected at 20 European sites. Environ. Health Perspect. 2006, 114, 684–690. [Google Scholar] [CrossRef] [PubMed]
- Peters, A.; Veronesi, B.; Calderón-Garcidueñas, L.; Gehr, P.; Chen, L.C.; Geiser, M.; Reed, W.; Rothen-Rutishauser, B.; Schürch, S.; Schulz, H. Translocation and potential neurological effects of fine and ultrafine particules a critical update. Part. Fibre Toxicol. 2006, 3, 1–13. [Google Scholar] [CrossRef] [PubMed] [Green Version]
- Lin, R.S.; Sung, F.C.; Huang, S.L.; Gou, Y.L.; Ko, Y.C.; Gou, H.W.; Shaw, C.K. Role of urbanization and air pollution in adolescent asthma: A mass screening in Taiwan. J. Formos. Med. Assoc. 2001, 100, 649–655. [Google Scholar] [PubMed]
- Brunekreef, B. Estimation of long-term average exposure to outdoor air pollution for a cohort study on mortality. J. Expo. Anal. Environ. Epidemiol. 2001, 11, 459–469. [Google Scholar] [CrossRef] [PubMed]
- Brunekreef, B.; Holgate, S.T. Air pollution and health. Lancet 2002, 360, 1233–1242. [Google Scholar] [CrossRef] [PubMed]
- Shahbaz, M.; Lean, H.H. Does financial development increase energy consumption? The role of industrialization and urbanization in Tunisia. Energy Policy 2012, 40, 473–479. [Google Scholar] [CrossRef] [Green Version]
- Poumanyvong, P.; Kaneko, S. Does urbanization lead to less energy use and lower CO2 emissions? A cross-country analysis. Ecol. Econ. 2010, 70, 434–444. [Google Scholar] [CrossRef]
- Rizwan, A.M.; Dennis, L.Y.C.; Liu, C. A review on the generation, determination and mitigation of Urban Heat Island. J. Environ. Sci. 2008, 20, 120–128. [Google Scholar] [CrossRef]
- Yuan, F.; Bauer, M.E. Comparison of impervious surface area and normalized difference vegetation index as indicators of surface urban heat island effects in Landsat imagery. Remote Sens. Environ. 2007, 106, 375–386. [Google Scholar] [CrossRef]
- Streutker, D.R. Satellite-measured growth of the urban heat island of Houston, Texas. Remote Sens. Environ. 2003, 85, 282–289. [Google Scholar] [CrossRef]
- Ihara, T.; Kikegawa, Y.; Asahi, K.; Genchi, Y.; Kondo, H. Changes in year-round air temperature and annual energy consumption in office building areas by urban heat-island countermeasures and energy-saving measures. Appl. Energy 2008, 85, 12–25. [Google Scholar] [CrossRef]
- Hassid, S.; Santamouris, M.; Papanikolaou, N.; Linardi, A.; Klitsikas, N.; Georgakis, C.; Assimakopoulos, D.N. The effect of the Athens heat island on air conditioning load. Energy Build. 2000, 32, 131–141. [Google Scholar] [CrossRef]
- Daly, H.E. Toward some operational principles of sustainable development. Ecol. Econ. 1990, 2, 1–6. [Google Scholar] [CrossRef]
- Hopwood, B.; Mellor, M.; O’Brien, G. Sustainable development: Mapping different approaches. Sustain. Dev. 2005, 13, 38–52. [Google Scholar] [CrossRef]
- Durhman, A.K.; Rowe, D.B.; Rugh, C.L. Effect of watering regimen on chlorophyll fluorescence and growth of selected green roof plant taxa. HortScience 2006, 41, 1623–1628. [Google Scholar]
- Fioretti, R.; Palla, A.; Principi, L.G. Green roof energy and water related performance in the Mediterranean climate. Build. Environ. 2010, 45, 1890–1904. [Google Scholar] [CrossRef]
- Ouldboukhitine, S.E.; Belarbi, R.; Jaffal, I.; Trabelsi, A. Assessment of green roof thermal behavior: A coupled heat and mass transfer model. Build. Environ. 2011, 46, 2624–2631. [Google Scholar] [CrossRef]
- Vanuytrecht, E.; van Mechelen, C.; van meerbeek, K.; Willems, P.; Hermy, M.; Raes, D. Runoff and vegetation stress of green roofs in a climate change perspective. Landsc. Urban Plan. 2014, 122, 68–77. [Google Scholar] [CrossRef]
- Madre, F.; Vergnes, A.; Machon, N.; Clergeau, P. A comparison of 3 types of green roof as habitats for arthropods. Ecol. Eng. 2013, 57, 109–117. [Google Scholar] [CrossRef]
- Madre, F.; Vergnes, A.; Machon, N.; Clergeau, P. Green roof as habitats for wild plant species in urban landscapes: First insights from a large-scale sampling. Landsc. Urban Plan. 2014, 122, 100–107. [Google Scholar] [CrossRef]
- Oberndorfer, E.; Lundholm, J.; Bass, B.; Coffman, R.R.; Doshi, H.; Dunnett, N.; Gaffin, S.; Köhler, M.; Liu, K.K.Y.; Rowe, B. Green roofs as urban ecosystems: Ecological structures, functions, and services. BioScience 2007, 57, 823–833. [Google Scholar] [CrossRef]
- Van Mechelen, C.; Dutoit, T.; Kattge, J.; Hermy, M. Plant trait analysis delivers an extensive list of potential green roof species for Mediterranean France. Ecol. Eng. 2014, 67, 48–59. [Google Scholar] [CrossRef]
- Van Mechelen, C.; Dutoit, T.; Hermy, M. Mediterranean open habitat vegetation offers great potential for extensive green roof design. Landsc. Urban Plan. 2014, 121, 81–91. [Google Scholar] [CrossRef]
© 2015 by the authors; licensee MDPI, Basel, Switzerland. This article is an open access article distributed under the terms and conditions of the Creative Commons Attribution license (http://creativecommons.org/licenses/by/4.0/).
Share and Cite
Luo, H.; Wang, N.; Chen, J.; Ye, X.; Sun, Y.-F. Study on the Thermal Effects and Air Quality Improvement of Green Roof. Sustainability 2015, 7, 2804-2817. https://doi.org/10.3390/su7032804
Luo H, Wang N, Chen J, Ye X, Sun Y-F. Study on the Thermal Effects and Air Quality Improvement of Green Roof. Sustainability. 2015; 7(3):2804-2817. https://doi.org/10.3390/su7032804
Chicago/Turabian StyleLuo, Heng, Ning Wang, Jianping Chen, Xiaoyan Ye, and Yun-Fei Sun. 2015. "Study on the Thermal Effects and Air Quality Improvement of Green Roof" Sustainability 7, no. 3: 2804-2817. https://doi.org/10.3390/su7032804