1. Introduction
The Zero Energy Building (ZEB) design has emerged as an imminent priority for designers and multi-disciplinary researchers [
1,
2]. A net zero-energy building (ZEB) is a residential or commercial building with greatly reduced energy needs through efficiency gains such that the balance of energy needs can be supplied with renewable technologies [
3]. Definitions of ZEBs also refer, for example, to different concepts, such as “net zero energy”, “zero net energy”, and “net zero carbon” [
4,
5]. The definition of ZEB in this research refers to the definition of Torcellini
et al. [
3]. Torcellini
et al. [
3] suggests that a good ZEB should, first, be based on energy efficient design, and then utilize available renewable energy resources on site. Especially, the integration of active and passive design elements is important to achieve the required energy efficiency and productivity of a ZEB. Generally it is easier to achieve “Net Zero” Energy Buildings than “Zero” Energy Buildings [
1,
4]. In order to achieve a net zero energy consumption of a building over the period of one year, the total renewable energy production of a building has to either exceed, or at least be similar to, the total final energy of the concerned building.
Building Energy Performance Simulation (BEPS) tools have gained tremendous importance for analyzing energy efficient building designs since they consider the dynamic thermal behavior of buildings, climatic conditions, and user behavior [
6]. Several studies [
7,
8,
9,
10,
11,
12,
13,
14] have shown that the active and passive elements can be simulated successfully for informed, rational decision-making.
Sophisticated active strategies and control logics can be simulated using BEPS. Kim
et al. [
7] reported that dynamic optimal control of the blind position (rolled up/down) and slat angles can be optimized for reduction of the final energy use. Boyano
et al. [
8] used EnergyPlus to investigate the energy saving potentials that about 28% of final energy can be saved by dimming control. Jiang
et al. [
9] conducted simulation studies to compare several types of the central air conditioning system with a heat recovery ventilation system [
9].
With regard to passive strategies, architectural design elements, such as building shape, orientation, and window-to-wall Ratio (WWR), can significantly influence the final energy use of a building. Soussi
et al. [
10] used a BEPS tool to analyze the impact of passive techniques on the final energy. Gong
et al. [
11] used a dynamic simulation tool to investigate optimal combination of seven passive strategies (wall thickness and insulation, roof insulation, window orientation, window-to-wall ratio, glazing, overhang depth) for each of 25 cities in China. Nguyen and Reiter [
12] used EnergyPlus simulation runs to find optimal passive design parameters (building shape, orientation, WWR, overhang) for a residential building, and reported that operating cost could be saved up to about 50%, compared to an original design. Based on the surveyed final energy of 73 buildings from 13 countries, Ramesh
et al. [
13] reported that building’s final energy can be significantly reduced through the use of passive and active strategies, and cautioned that an excessive use of active strategies in a building may be unproductive. Wang
et al. [
14] showed that the effectiveness of passive strategies can vary depending on individual rooms’ thermal characteristics in a residential building.
In this paper, the authors report a ZEB project, in which the energy saving potential of active and passive design elements for a school building was evaluated using BEPS. The production of renewable energy is not discussed here. Rather, this study focuses on the enhancement of the energy efficiency and reduction of the final energy of the school building. The process achieving the ZEB concept for the concerned school building design involved the identification of effective design (or “passive”) and control strategies (or “active”). The difference in energy efficiency between design alternatives was quantified by means of EnergyPlus [
15], a widely used BEPS tool. This paper presents results and insights from the research and design project for the concerned ZEB building in Korea.
2. Project Description
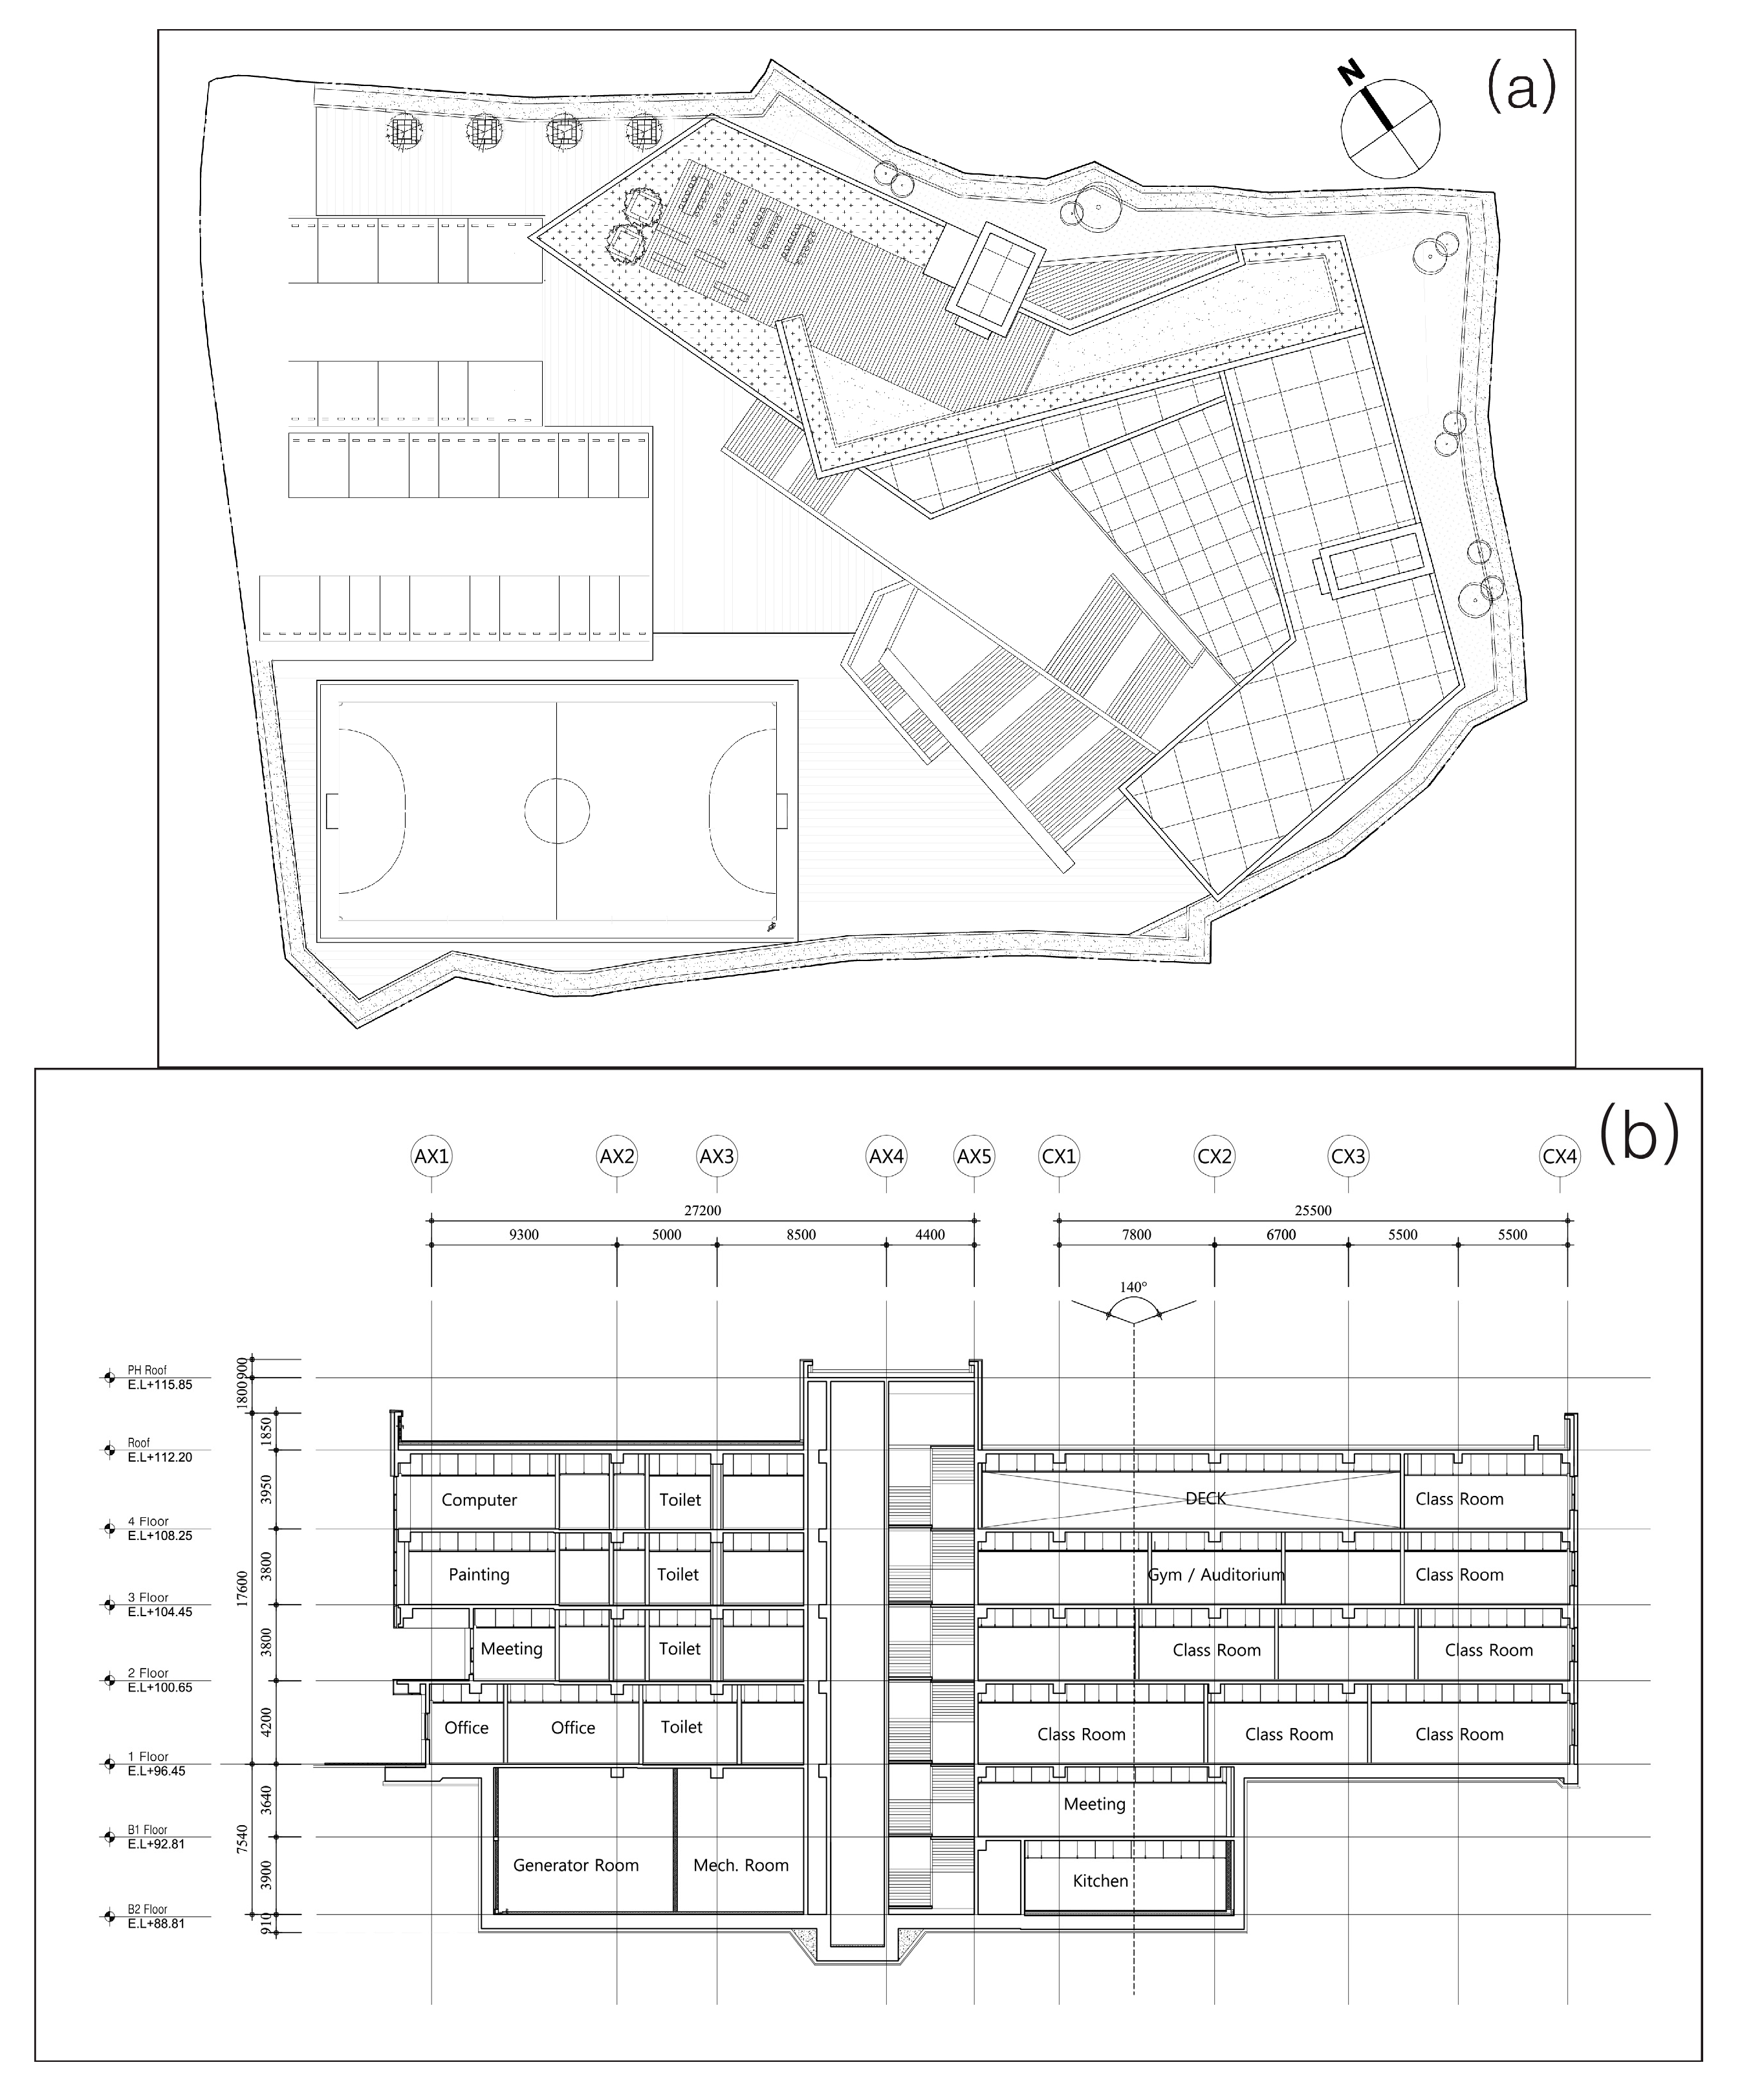
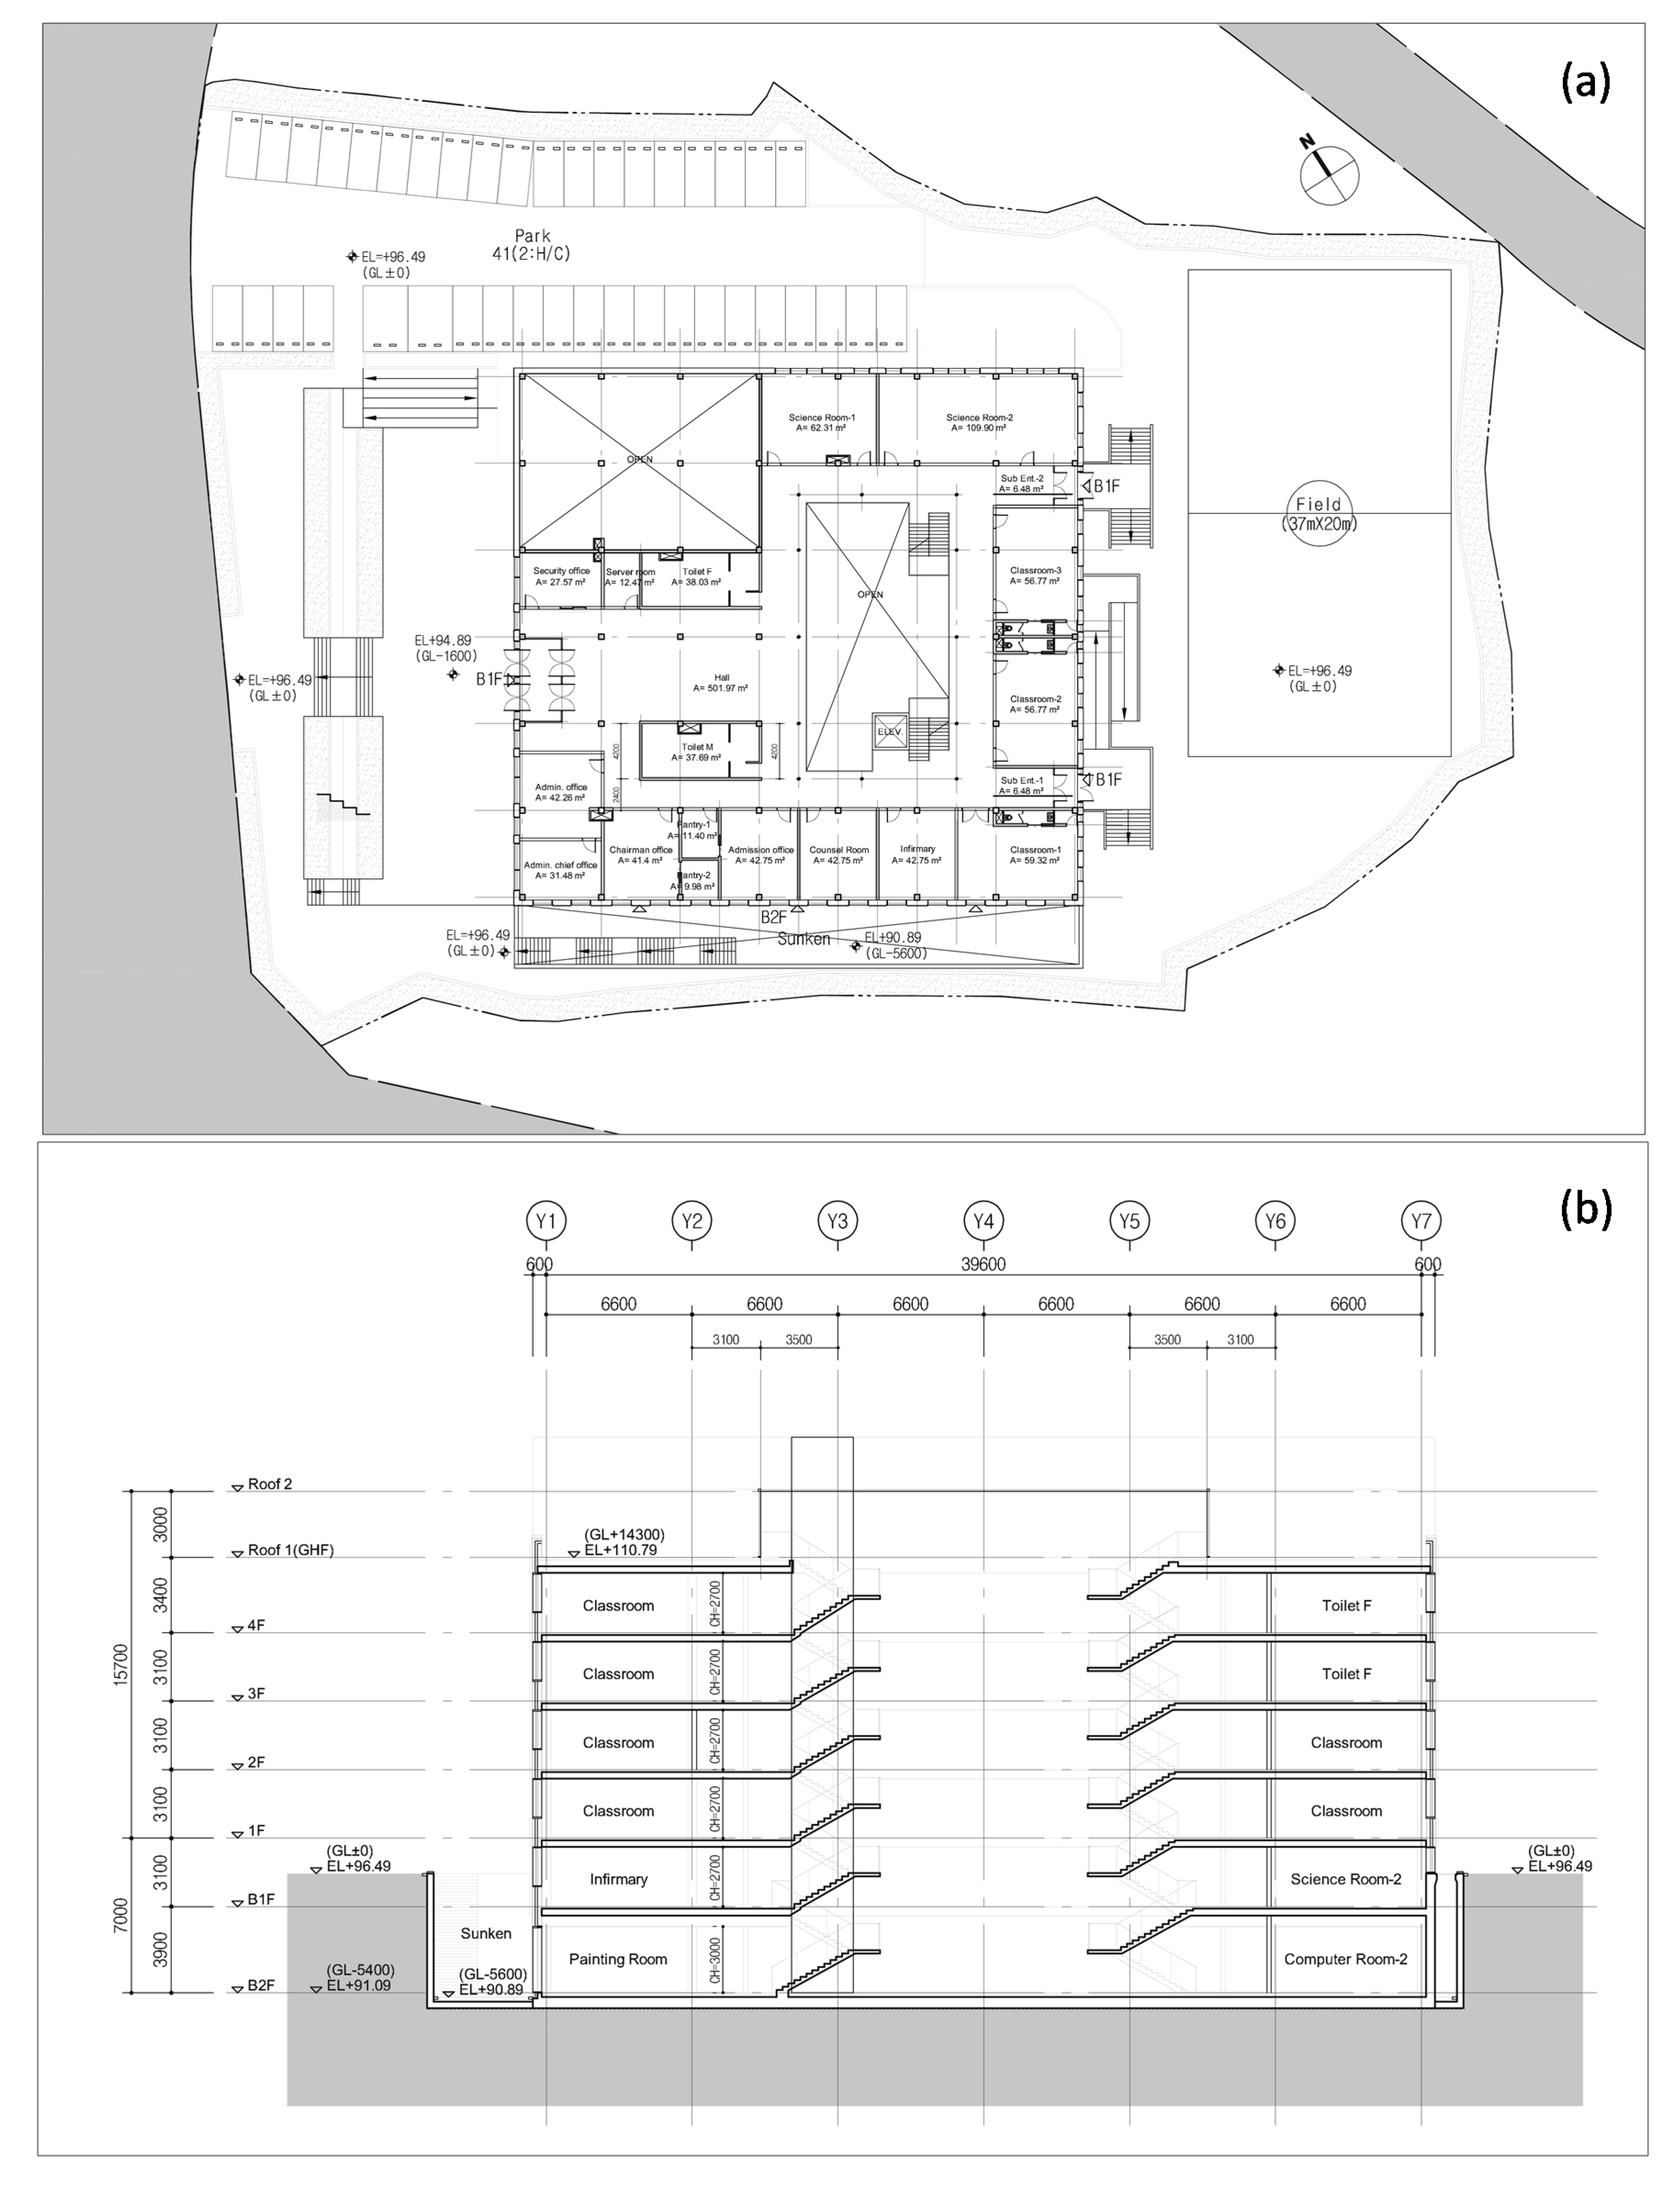
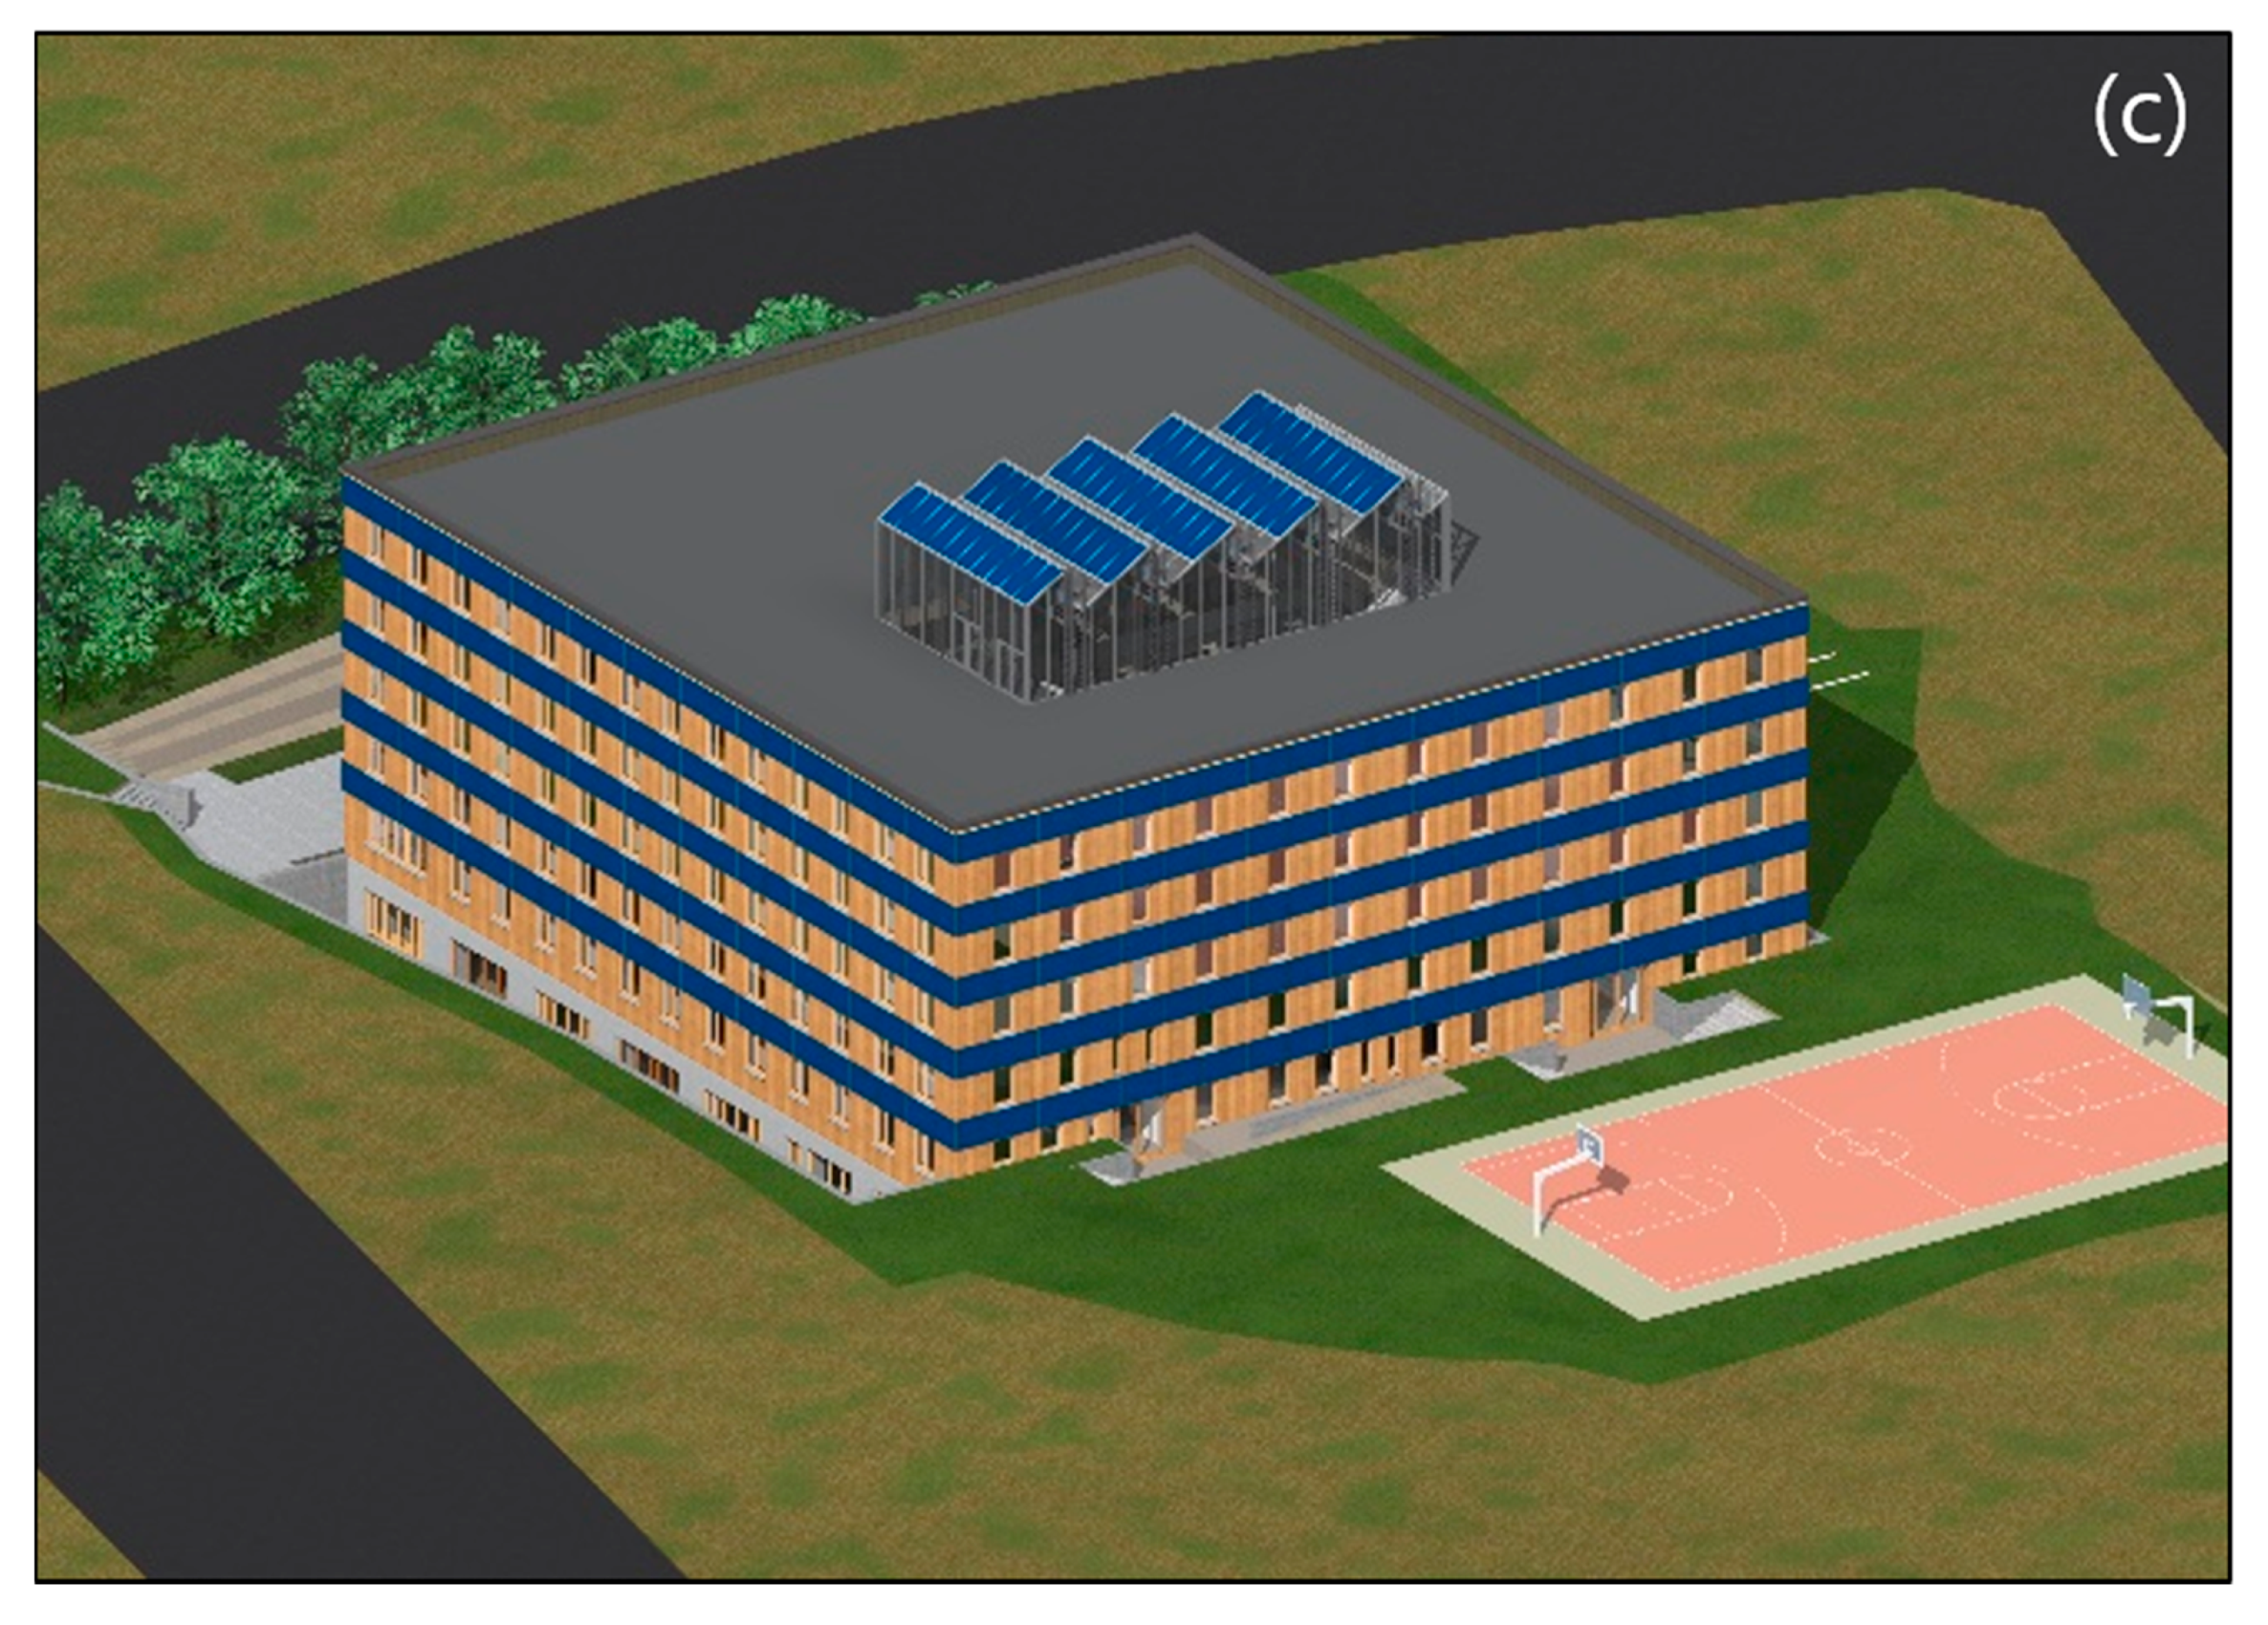
The ZEB school building selected for the study (
Figure 1,
Table 1) was designed as a high school for international students in Korea. The total usable floor area of the building is 7963 m
2. The building has four floors above ground and two floors below ground. The orientation of the main building is towards the southwest. Every room is equipped with an electric heat pump for cooling and heating, and LEDs for lighting. In the above-ground floors there are staff rooms, administrative rooms, and classrooms, while as in underground floors, there is a gymnasium, a cafeteria, a mechanical and electric equipment room, and music rooms with windows opening to a sunken garden. The U-values of building envelopes are: 0.183 W/m
2-K for underground walls, 0.147 W/m
2-K for above ground walls, 0.113 W/m
2-K for roofs, and 0.795 W/m
2-K for windows. The g-value of the window panes is 0.442, whereas the recommended U-values for passive house design are: 0.08–0.15 W/m
2-K for underground walls, 0.06–0.15 W/m
2-K for above ground walls and 0.8 W/m
2-K for windows [
16]. The underground walls and g-value of windows do not meet the passive house design criterion (The g-value of windows for passive house is 0.5).
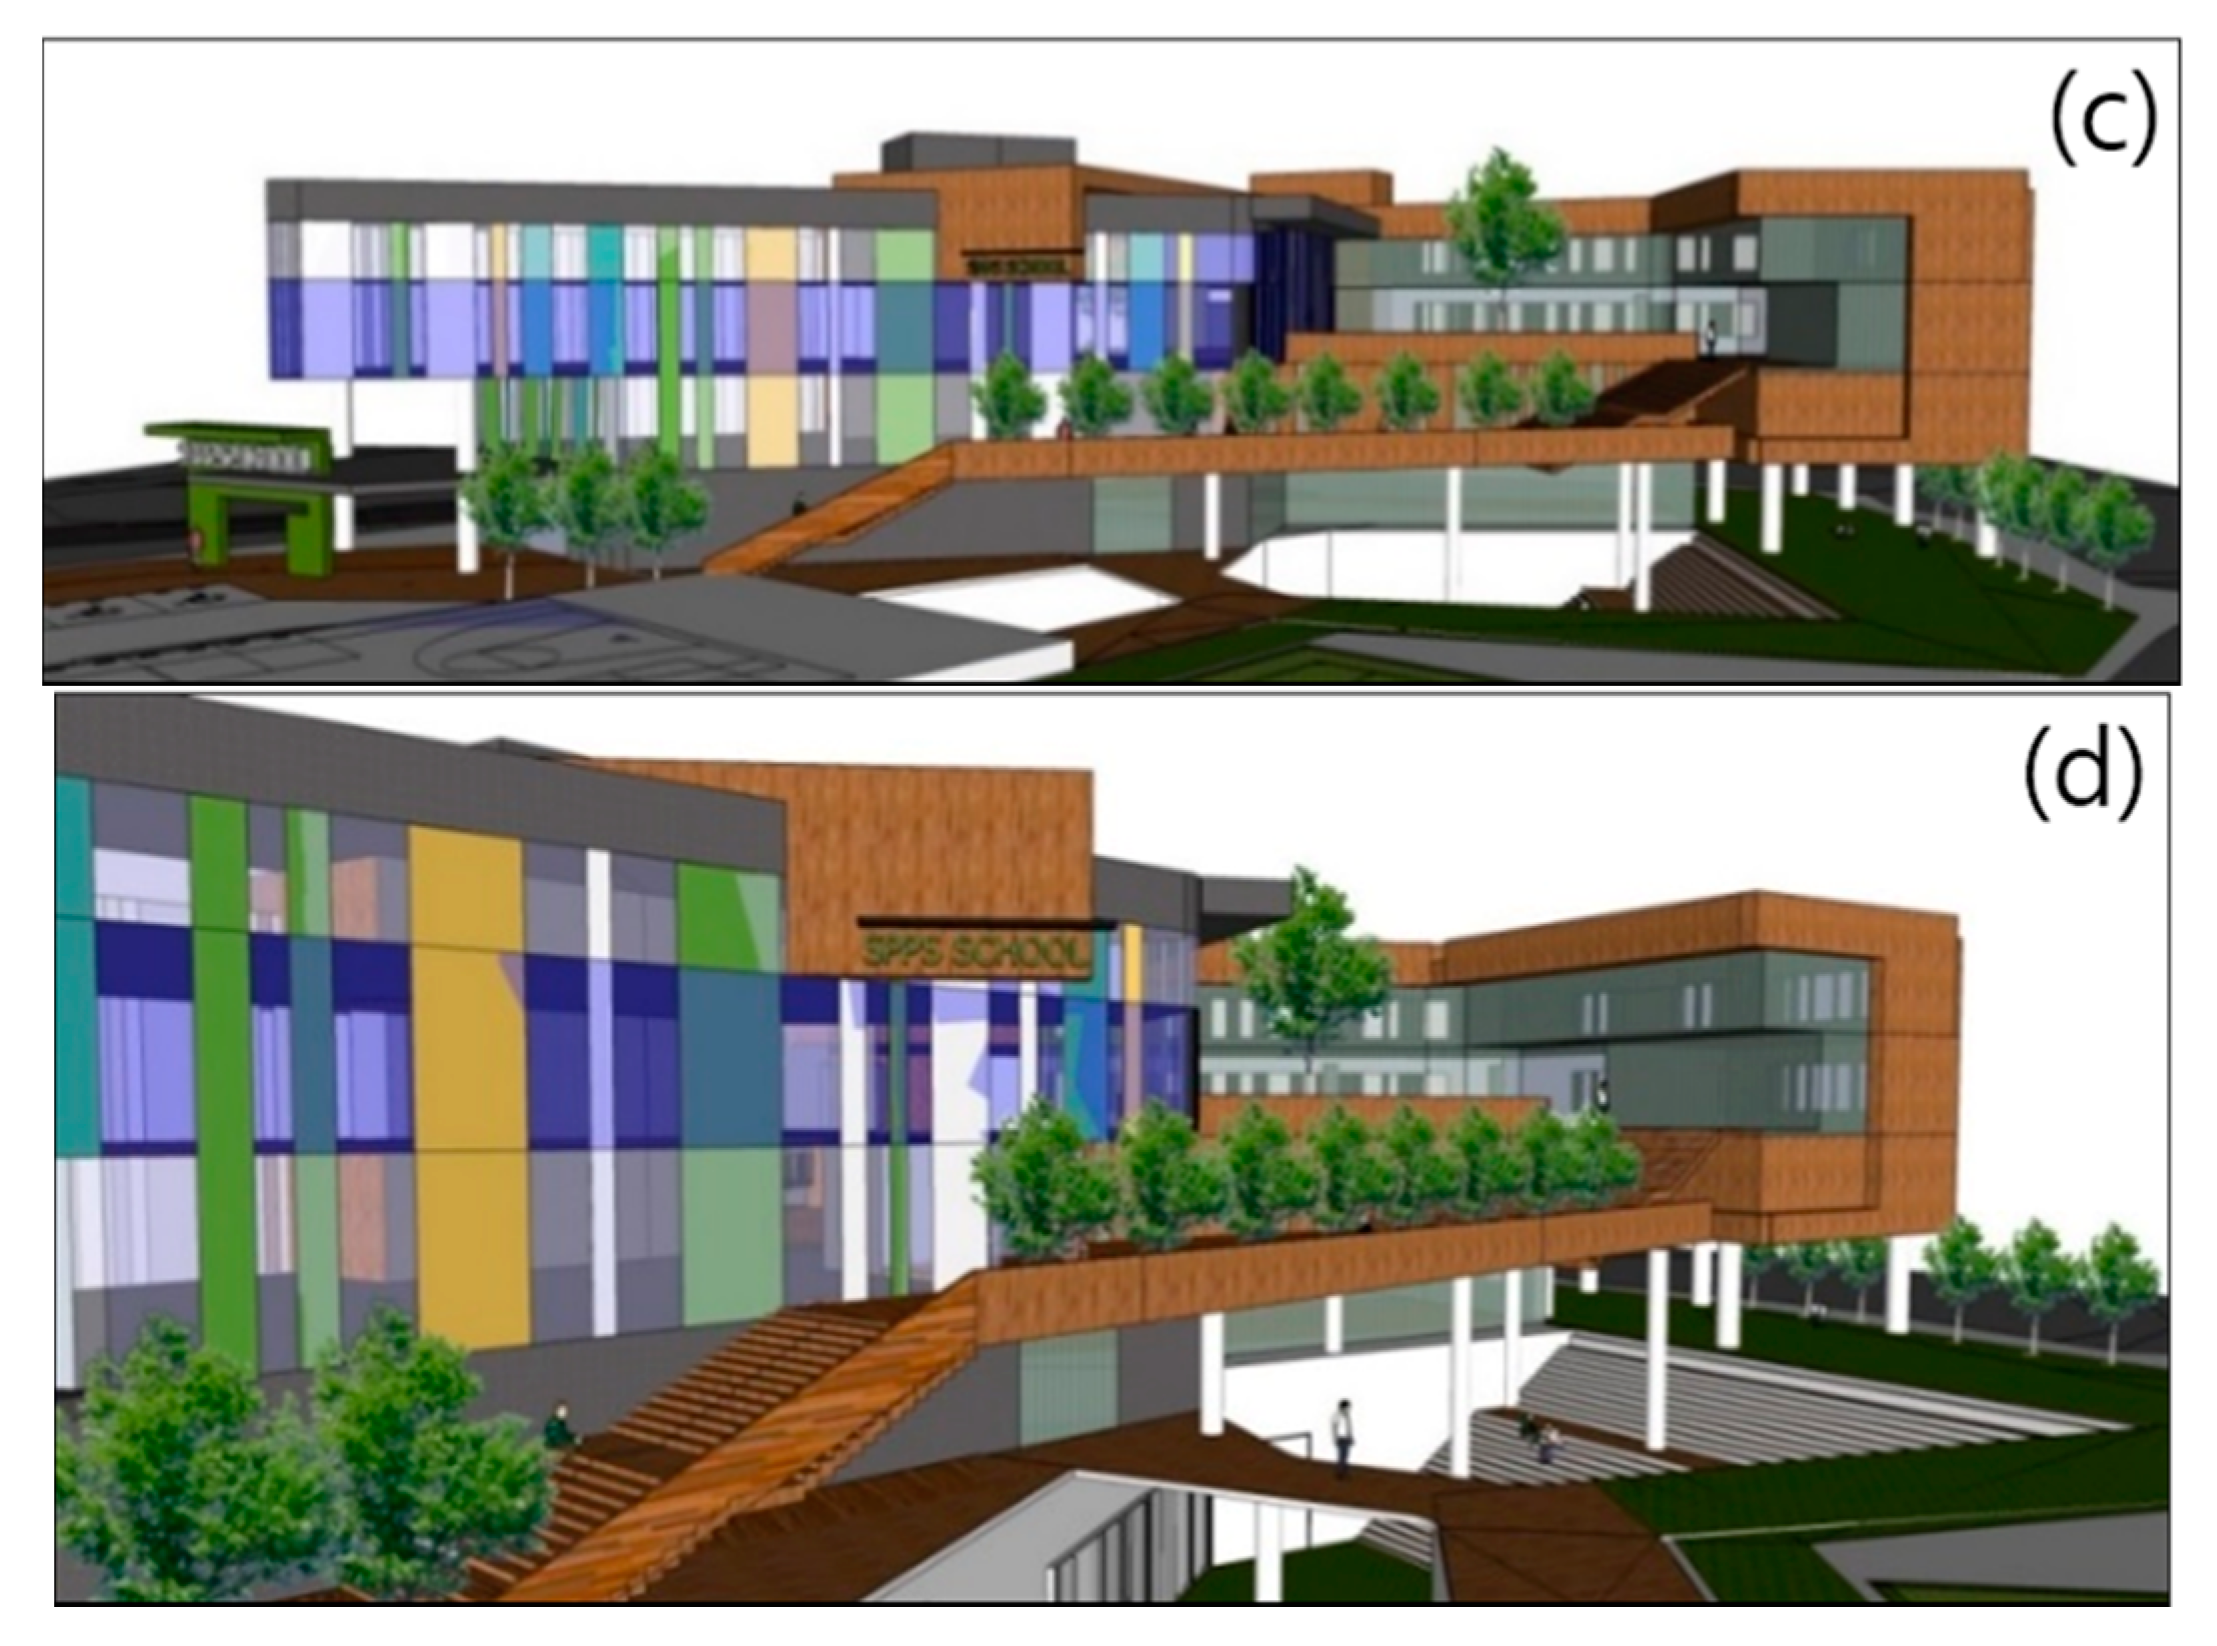
Figure 1.
(a) Site plan; (b) section; (c) 3D view from southeast; and (d) 3D view from the southwest.
Figure 1.
(a) Site plan; (b) section; (c) 3D view from southeast; and (d) 3D view from the southwest.
Table 1.
Building summary.
Table 1.
Building summary.
| | Description |
|---|
| Location | Yongin-si, South Korea |
| Orientation | Southwest |
| Use | Education facility (high school) |
| Stories | Basement: two floors; above ground: four floors |
| Building area | 1996 m2 |
| Gross floor area | 7963 m2 |
| Structure | Reinforced concrete |
| Building height | 17.6 m |
| Floor to floor height | for 1st floor: 4.2 m, for 2nd–4th floors: 3.8 m |
| HVAC system | Ceiling attached Electric Heat Pump (EHP) plus mechanical ventilation system without heat recovery |
| Envelopes | Opaque: high density wood panel |
| Transparent: triple Low-e glass |
| U-values | Underground walls (opaque): 0.183 W/m2-K |
| Above ground walls (opaque): 0.147 W/m2-K |
| Roofs (opaque): 0.113 W/m2-K |
| Windows (transparent): 0.795 W/m2-K (g-value: 0.442) |
| Number of people | 690 (students: 600, teachers and officers: 90) |
The school remains open for five days a week and closes during weekends and the school holiday periods,
i.e., the summer and winter vacations, which are from 27th June to 31th August, and 1st January to 3rd March, respectively. There is no specification of internal heat gains for education facilities in Korean building code. Usually, it is determined based on the engineer’s judgment. Thus, the data for internal heat gains (people, lights, equipment) were assumed from the database of the program DesignBuilder (
Table 2) [
17]. With regard to climate data, the authors used the Seoul weather file downloaded from Weather Analytics [
18]. The weather data file includes hourly weather information such as temperature, solar radiation (global, direct and diffuse), wind speed and wind direction, cloud coverage, rainfall, and relative humidity.
Table 2.
Internal heat gains from DesignBuilder database used in the model of this research.
Table 2.
Internal heat gains from DesignBuilder database used in the model of this research.
| | Classroom | Office | Gymnasium | Cafeteria | Kitchen | Toilet | Ref. |
|---|
| occupant density (person/m2) | 0.25 | 0.10 | 0.14 | 0.20 | 0.18 | 0.11 | DesignBuilder [17] |
| Occupants (W/person) | 126 | 117 | 270 | 99 | 162 | 126 |
| Lights (W/m2) | 9.90 | 9.90 | 9.90 | 9.90 | 9.90 | 9.90 |
| Equipment (W/m2) | 0.00 | 13.00 | 0.00 | 0.00 | 49.50 | 0.00 |
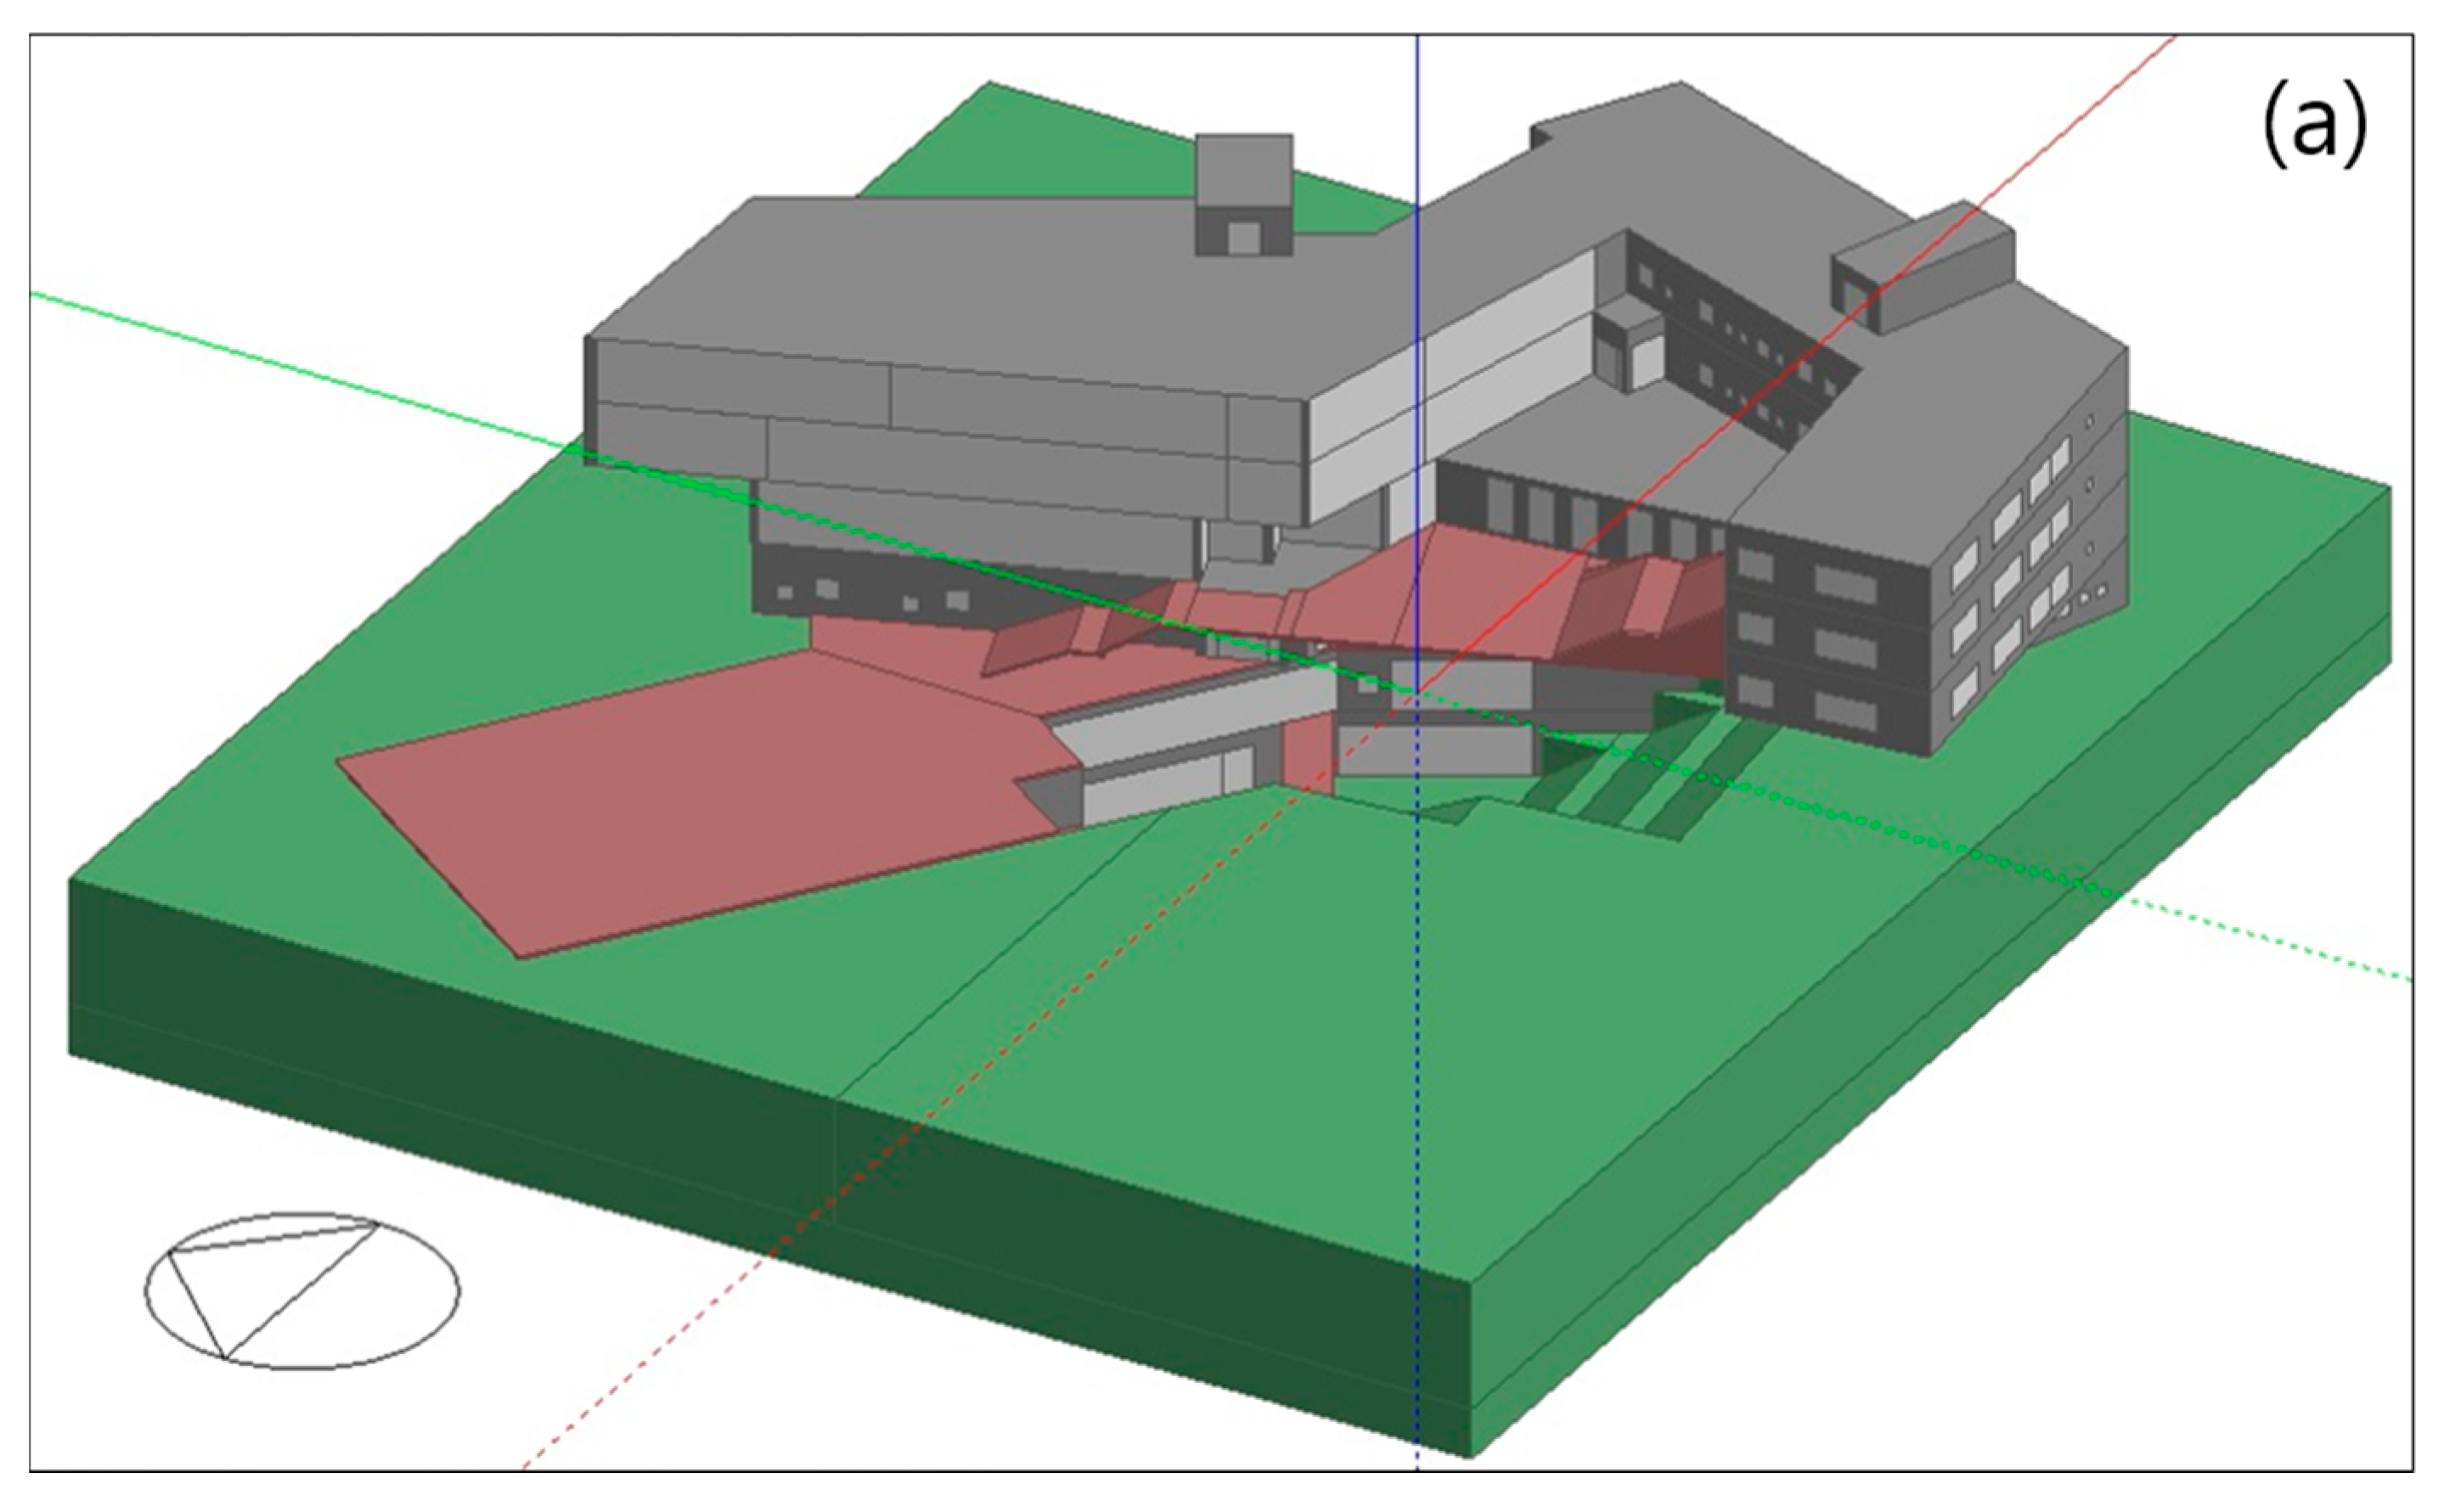
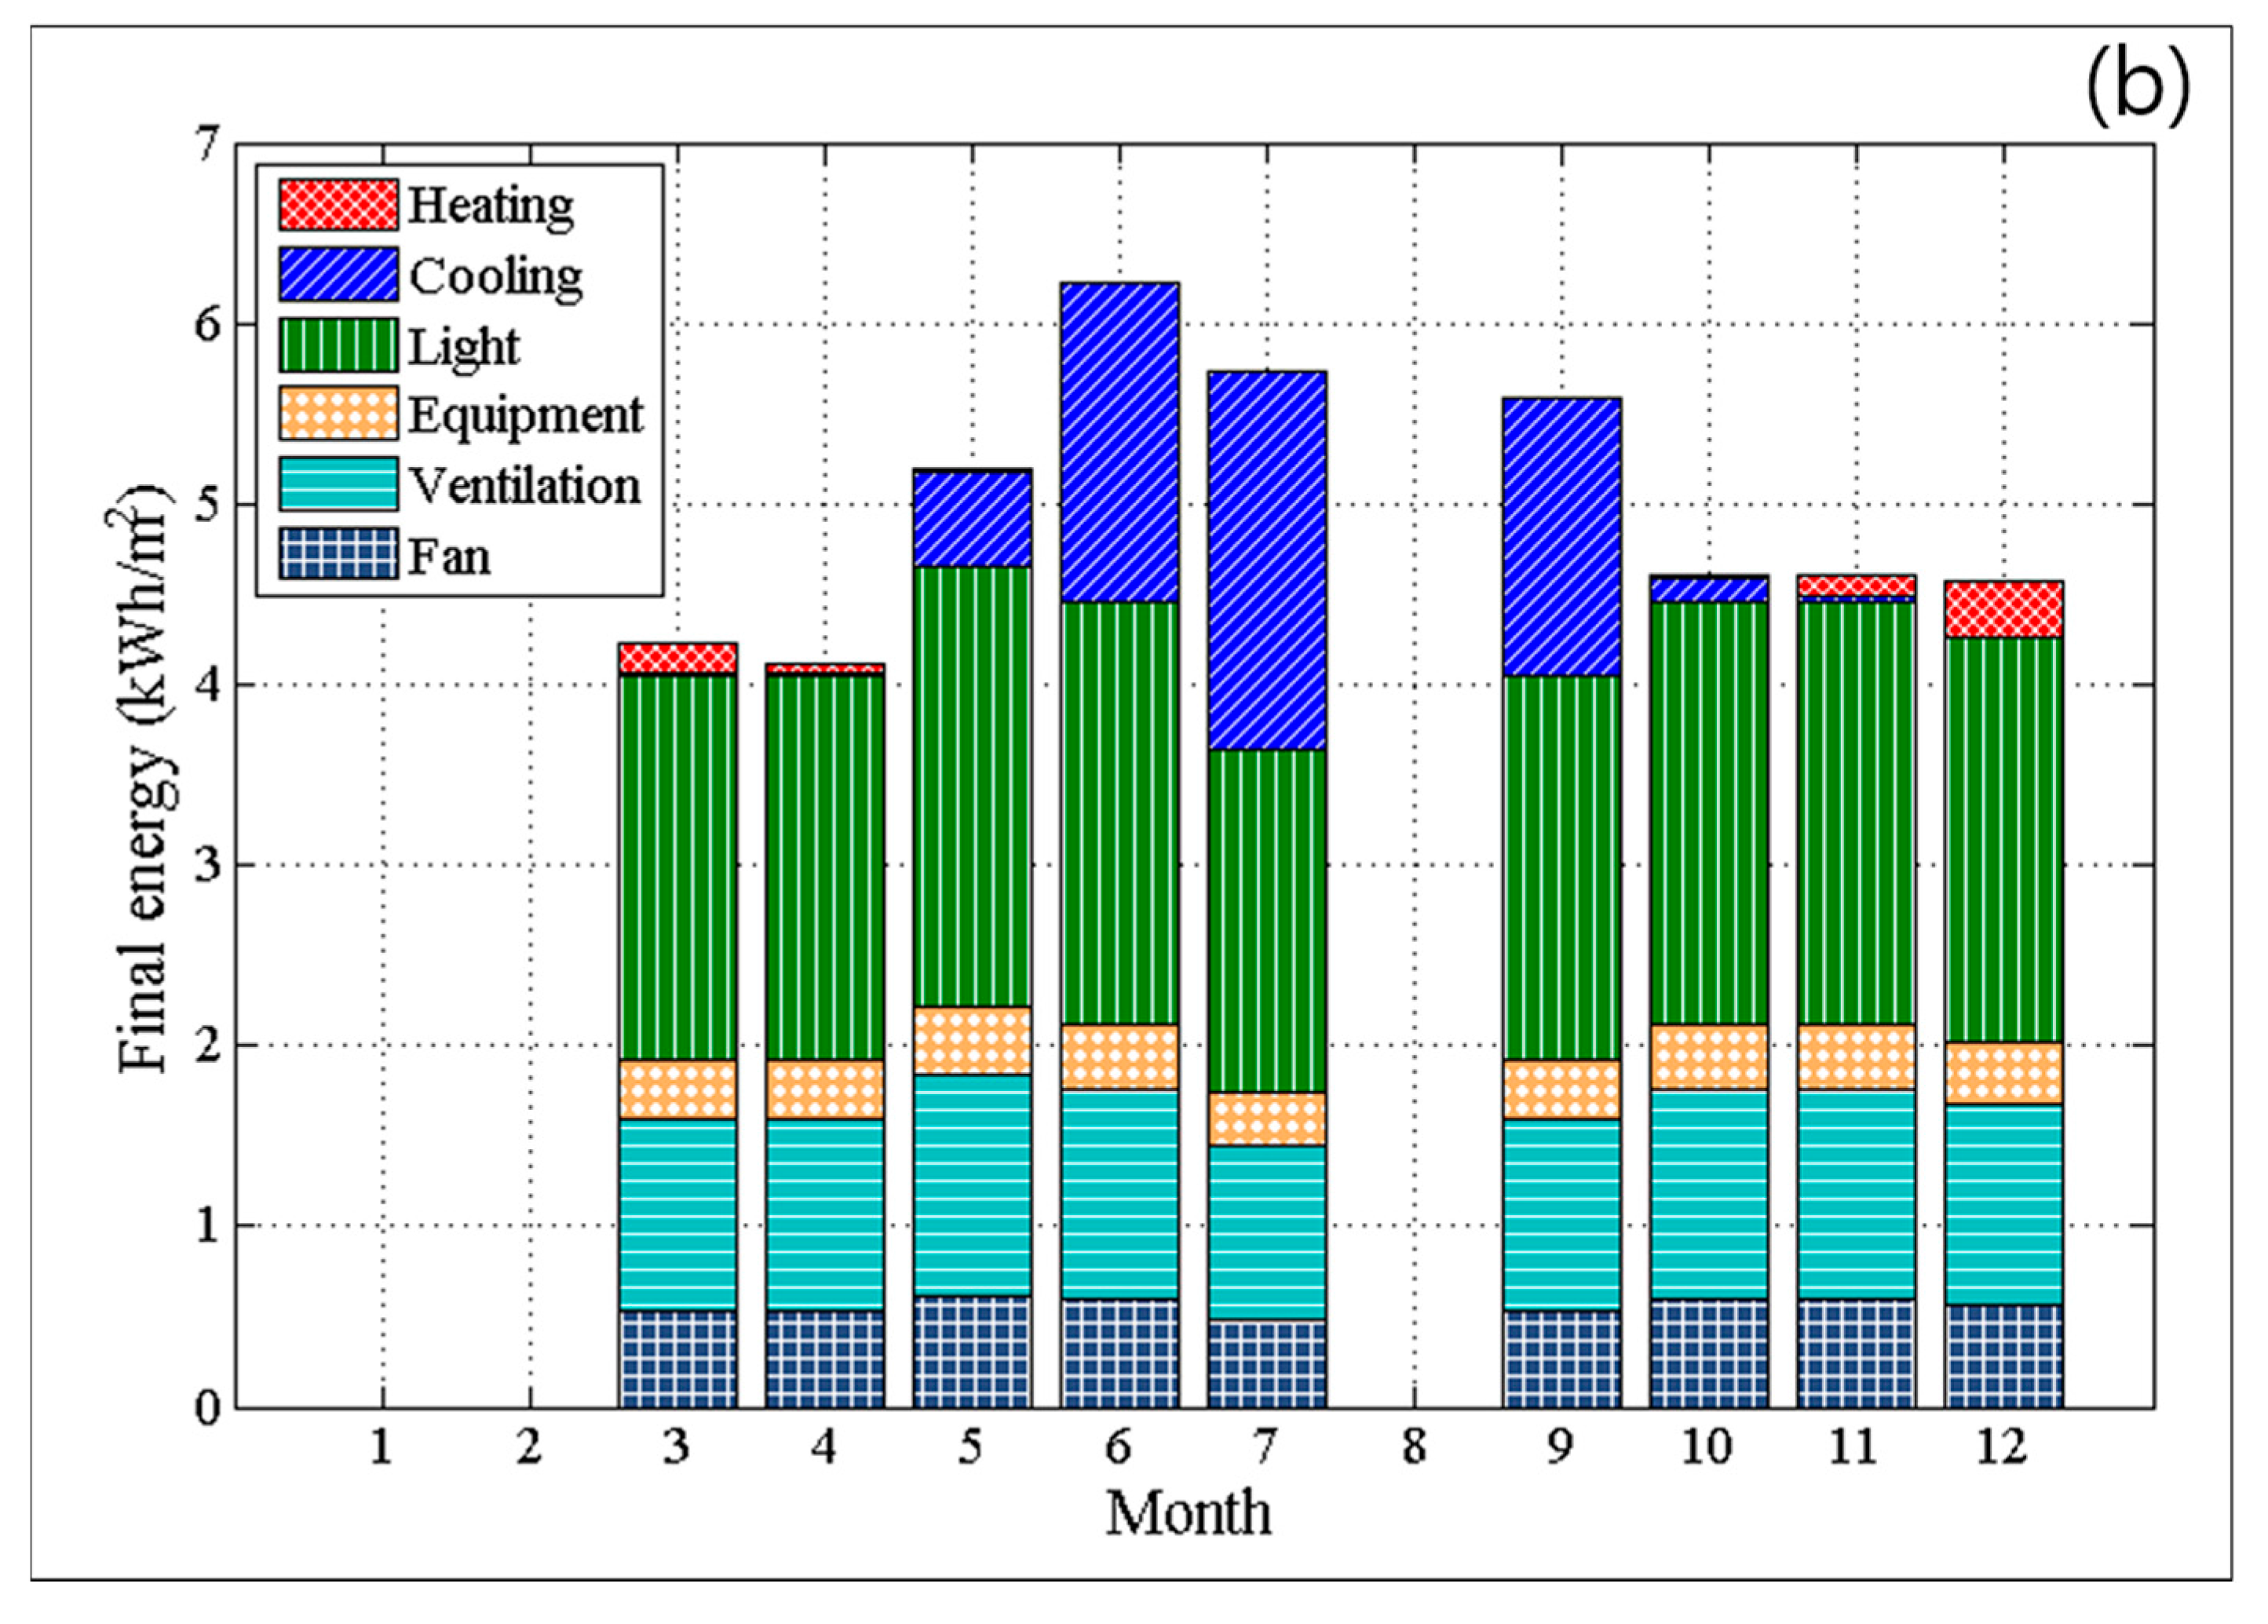
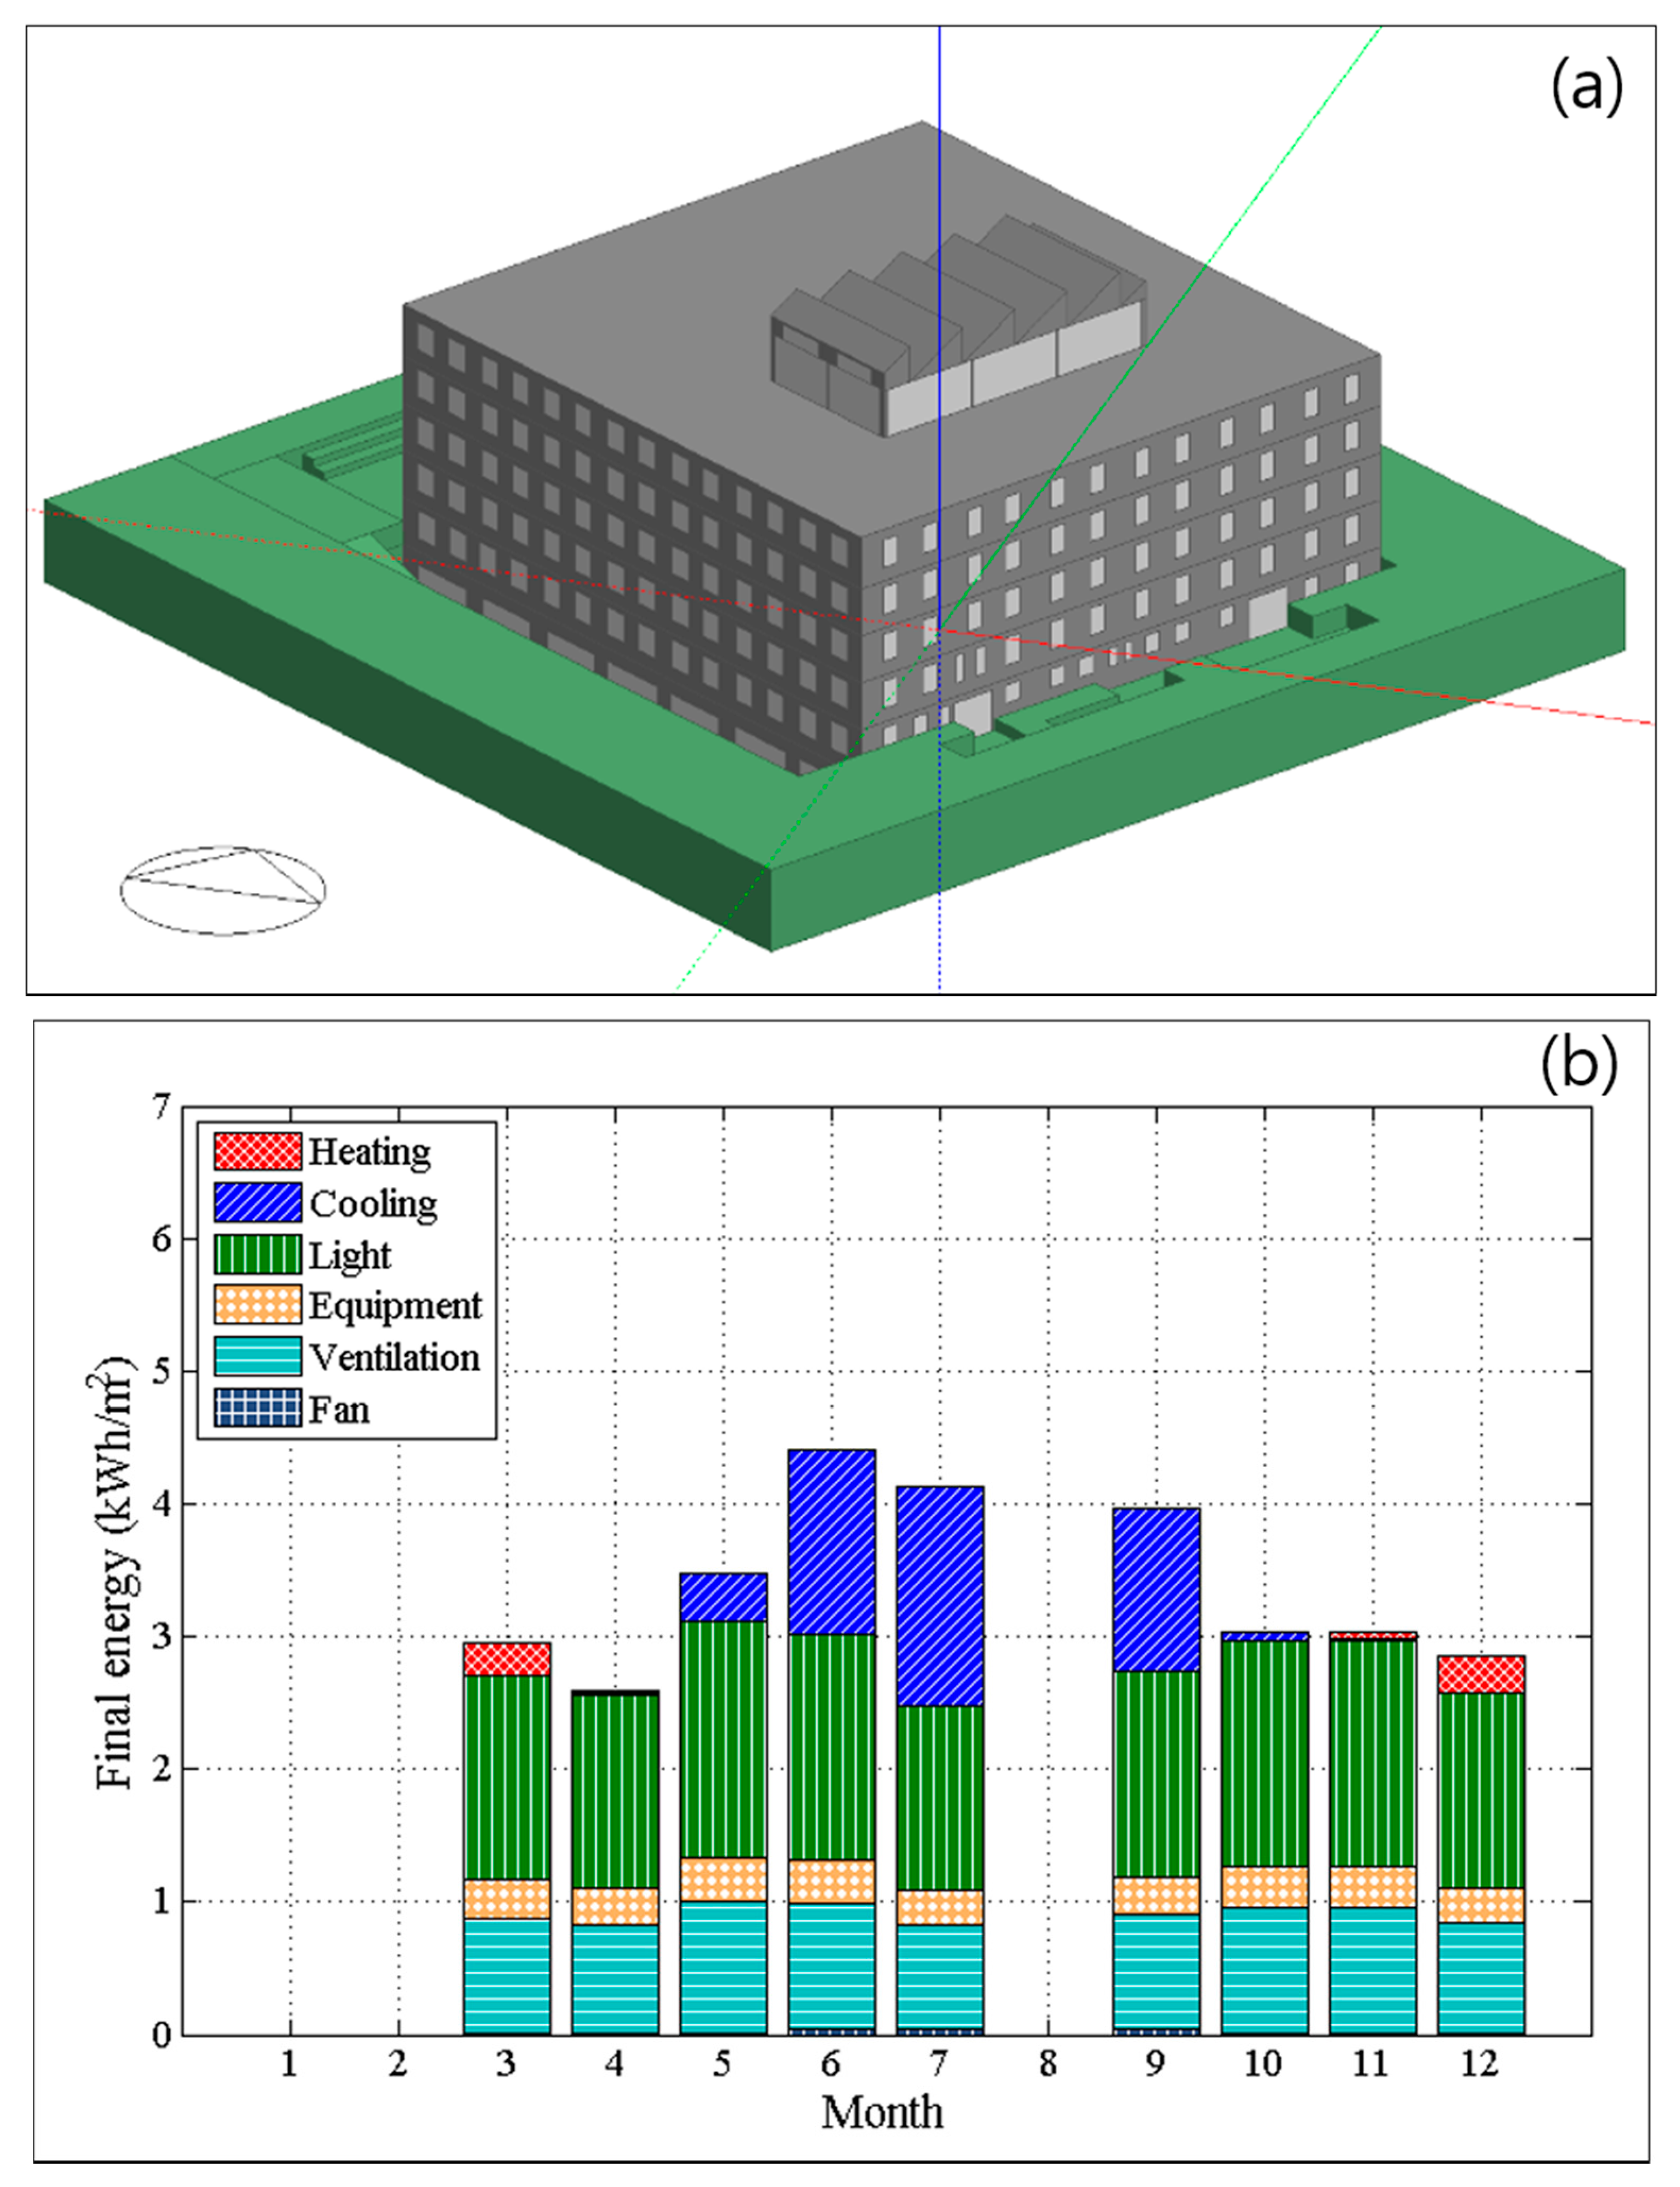
Based on architectural drawings and specifications, the original design was simulated using the program EnergyPlus to investigate the energy efficiency (
Figure 2a). The simulation results of the original school building design are shown in
Table 3 and
Figure 2b. The total annual final energy was 44.86 kWh/m
2-year, which is in the range of the so-called low-energy buildings and is very low in comparison to conventional Korean school buildings. Due to excellent thermal performance of the building envelope, the heating and cooling final energy is relatively low, whereas the lighting final energy accounts for 44.46% (
Table 3) of the total final energy.
Hence, reducing the energy use for artificial lighting became a priority for further reduction of the building’s total final energy. Based on
Table 3, the authors developed active design strategies for the reduction of the building’s total final energy, which will be explained in the following section.
Figure 2.
(a) Simulation model; and (b) final energy of the original school design.
Figure 2.
(a) Simulation model; and (b) final energy of the original school design.
Table 3.
Annual final energy of the original design.
Table 3.
Annual final energy of the original design.
| | Heating | Cooling | Lighting | Equipment | Ventilation | Fan | Total |
|---|
| kWh/m2-year | 0.69 | 6.10 | 19.95 | 3.10 | 10.00 | 5.03 | 44.86 |
| % | 1.53 | 13.60 | 44.46 | 6.90 | 22.29 | 11.22 | 100.00 |
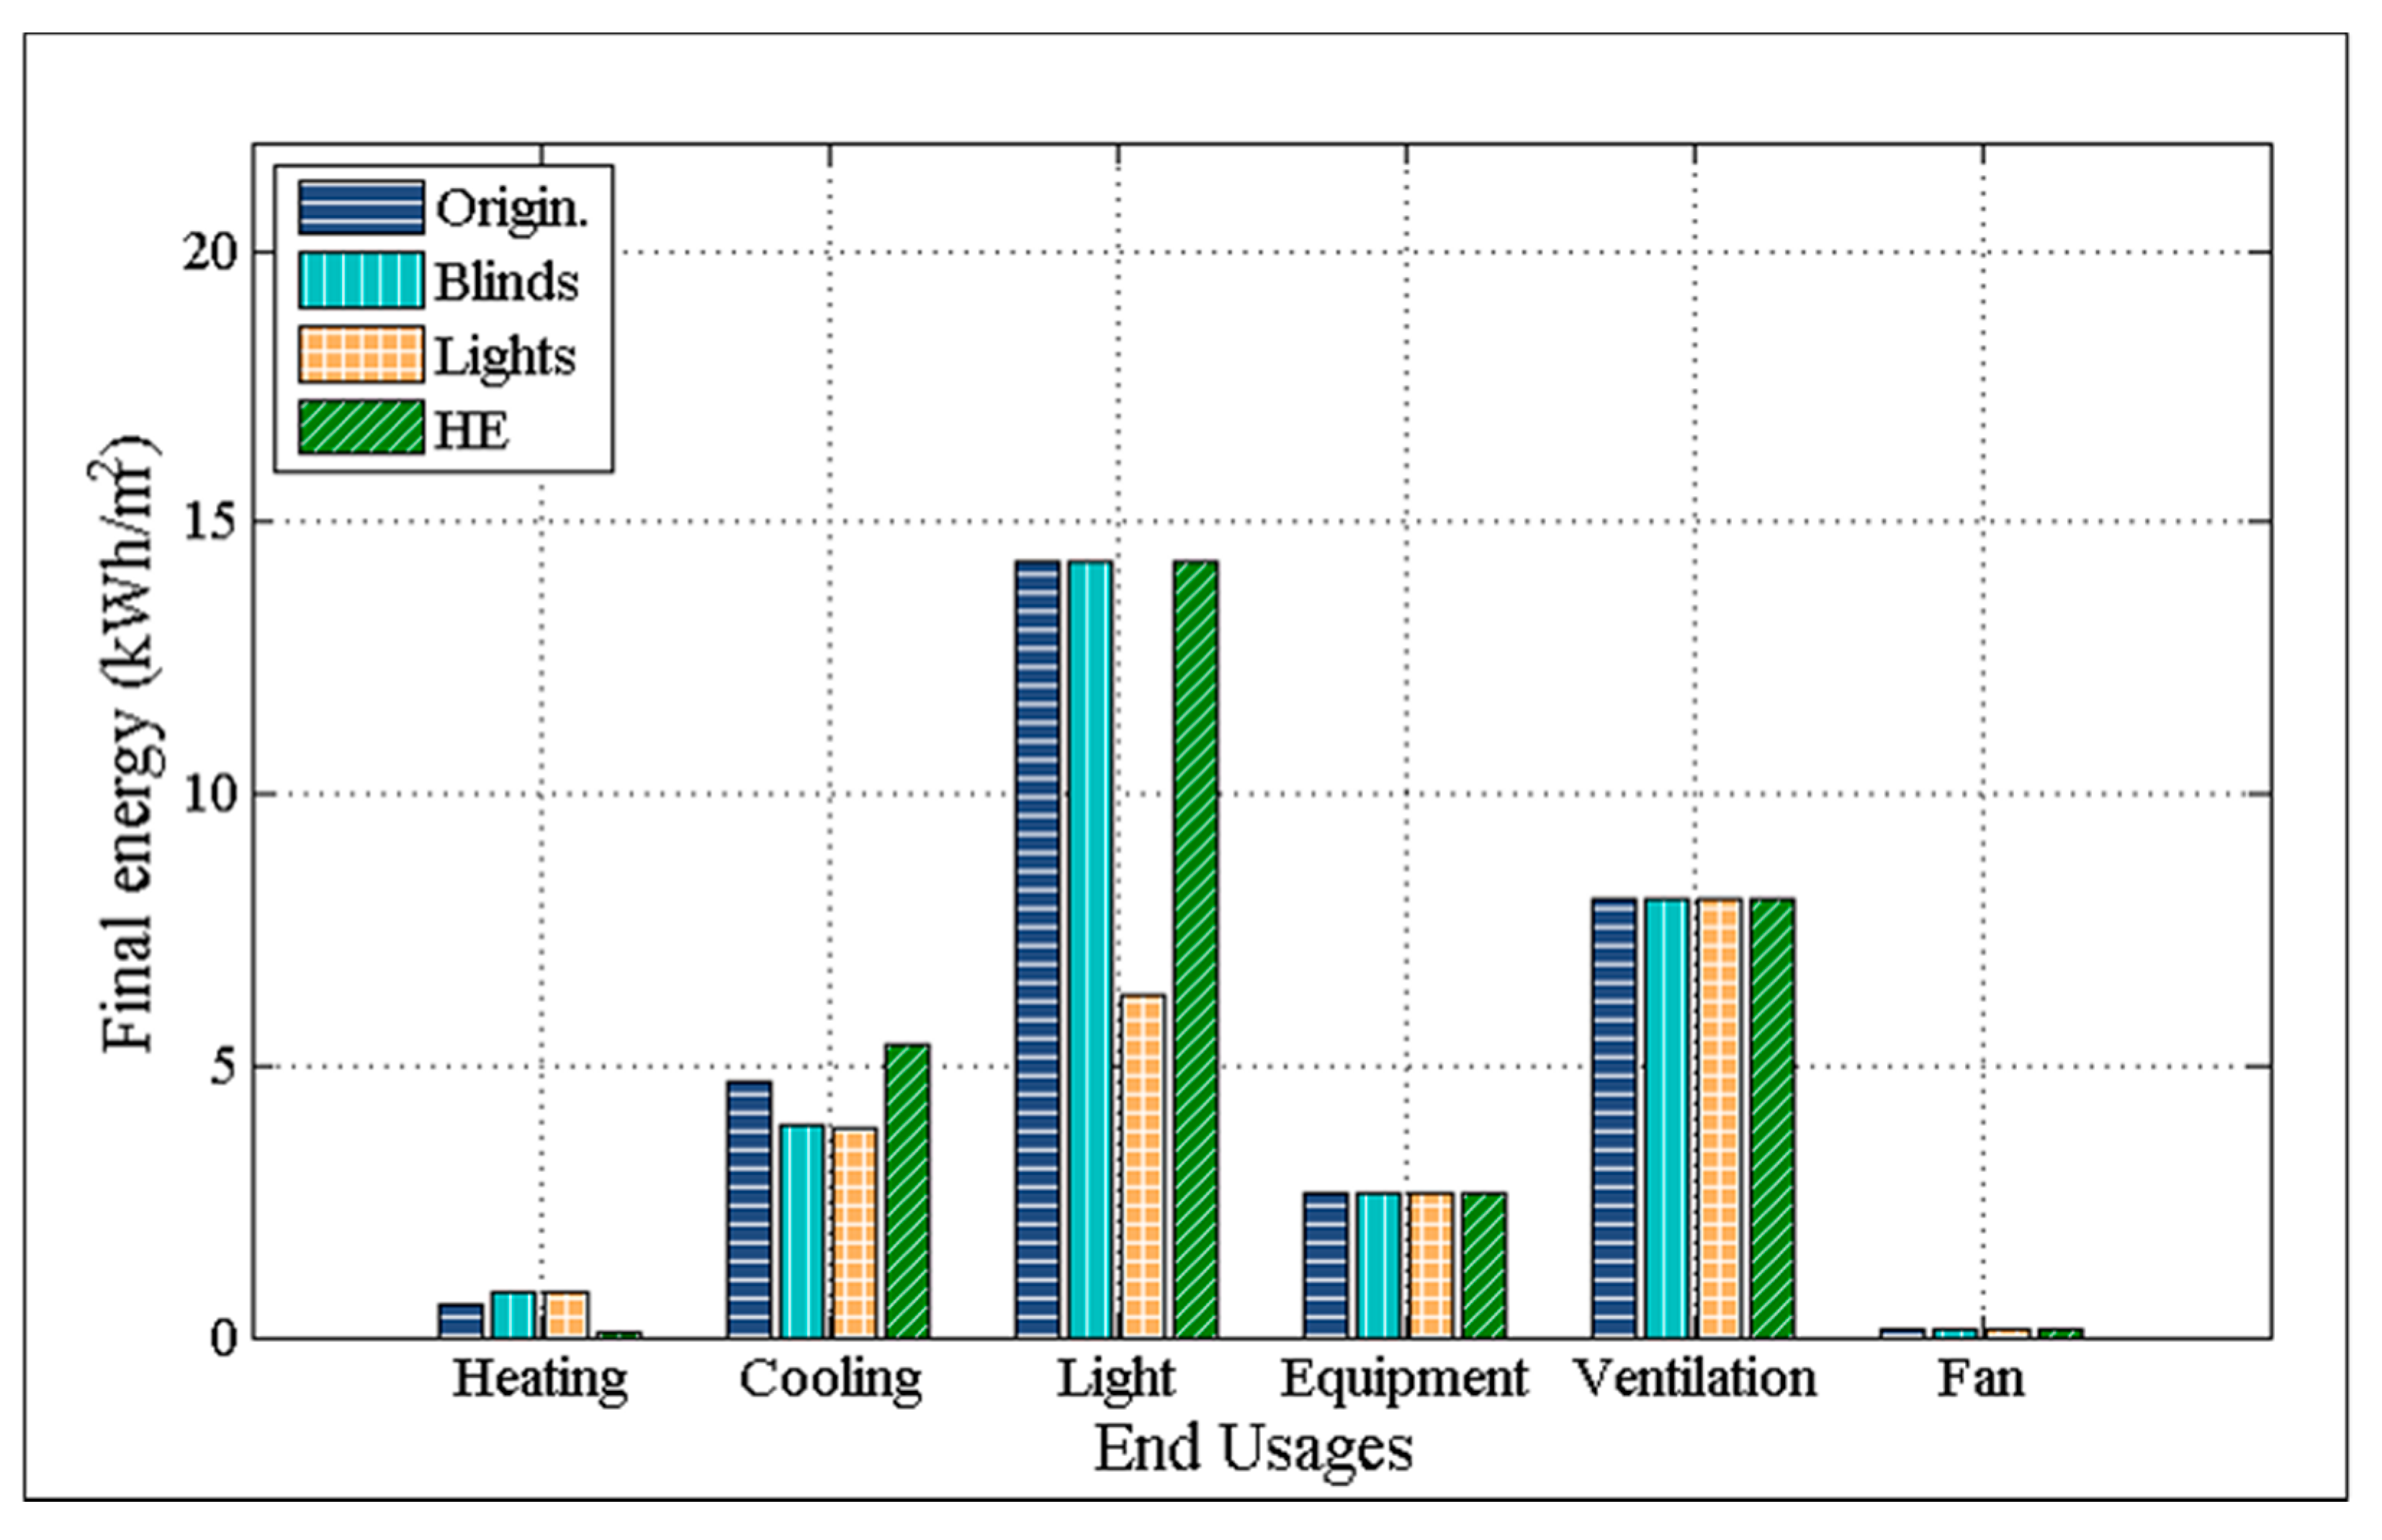
5. Integration of Active and Passive Strategies
The active design strategies discussed in
Section 3.1 were also applied to the re-designed school building.
Table 9 and
Figure 6 show the simulation results. The energy saving potential (%) of each active design strategy (
Table 9) of the re-designed school building is similar to the percentages presented in
Table 4. As shown in
Table 4 and
Table 9, the lighting control is most advantageous. It is noteworthy that the energy consumption of the passive design (30.47 kWh/m
2-year) is better than the best active strategy (lighting control) in the original design (32.27 kWh/m
2-year). When lighting control is applied to the re-design, the energy consumption is reduced to 21.82 kWh/m
2-year, which is close to energy saving rate of 51.36% (
Table 10).
Table 9.
Annual final energy simulation results of the re-design with active strategies (kWh/m2-year).
Table 9.
Annual final energy simulation results of the re-design with active strategies (kWh/m2-year).
| | Heating | Cooling | Lighting | Equipment | Ventilation | Fan | Total | Saving (%) |
|---|
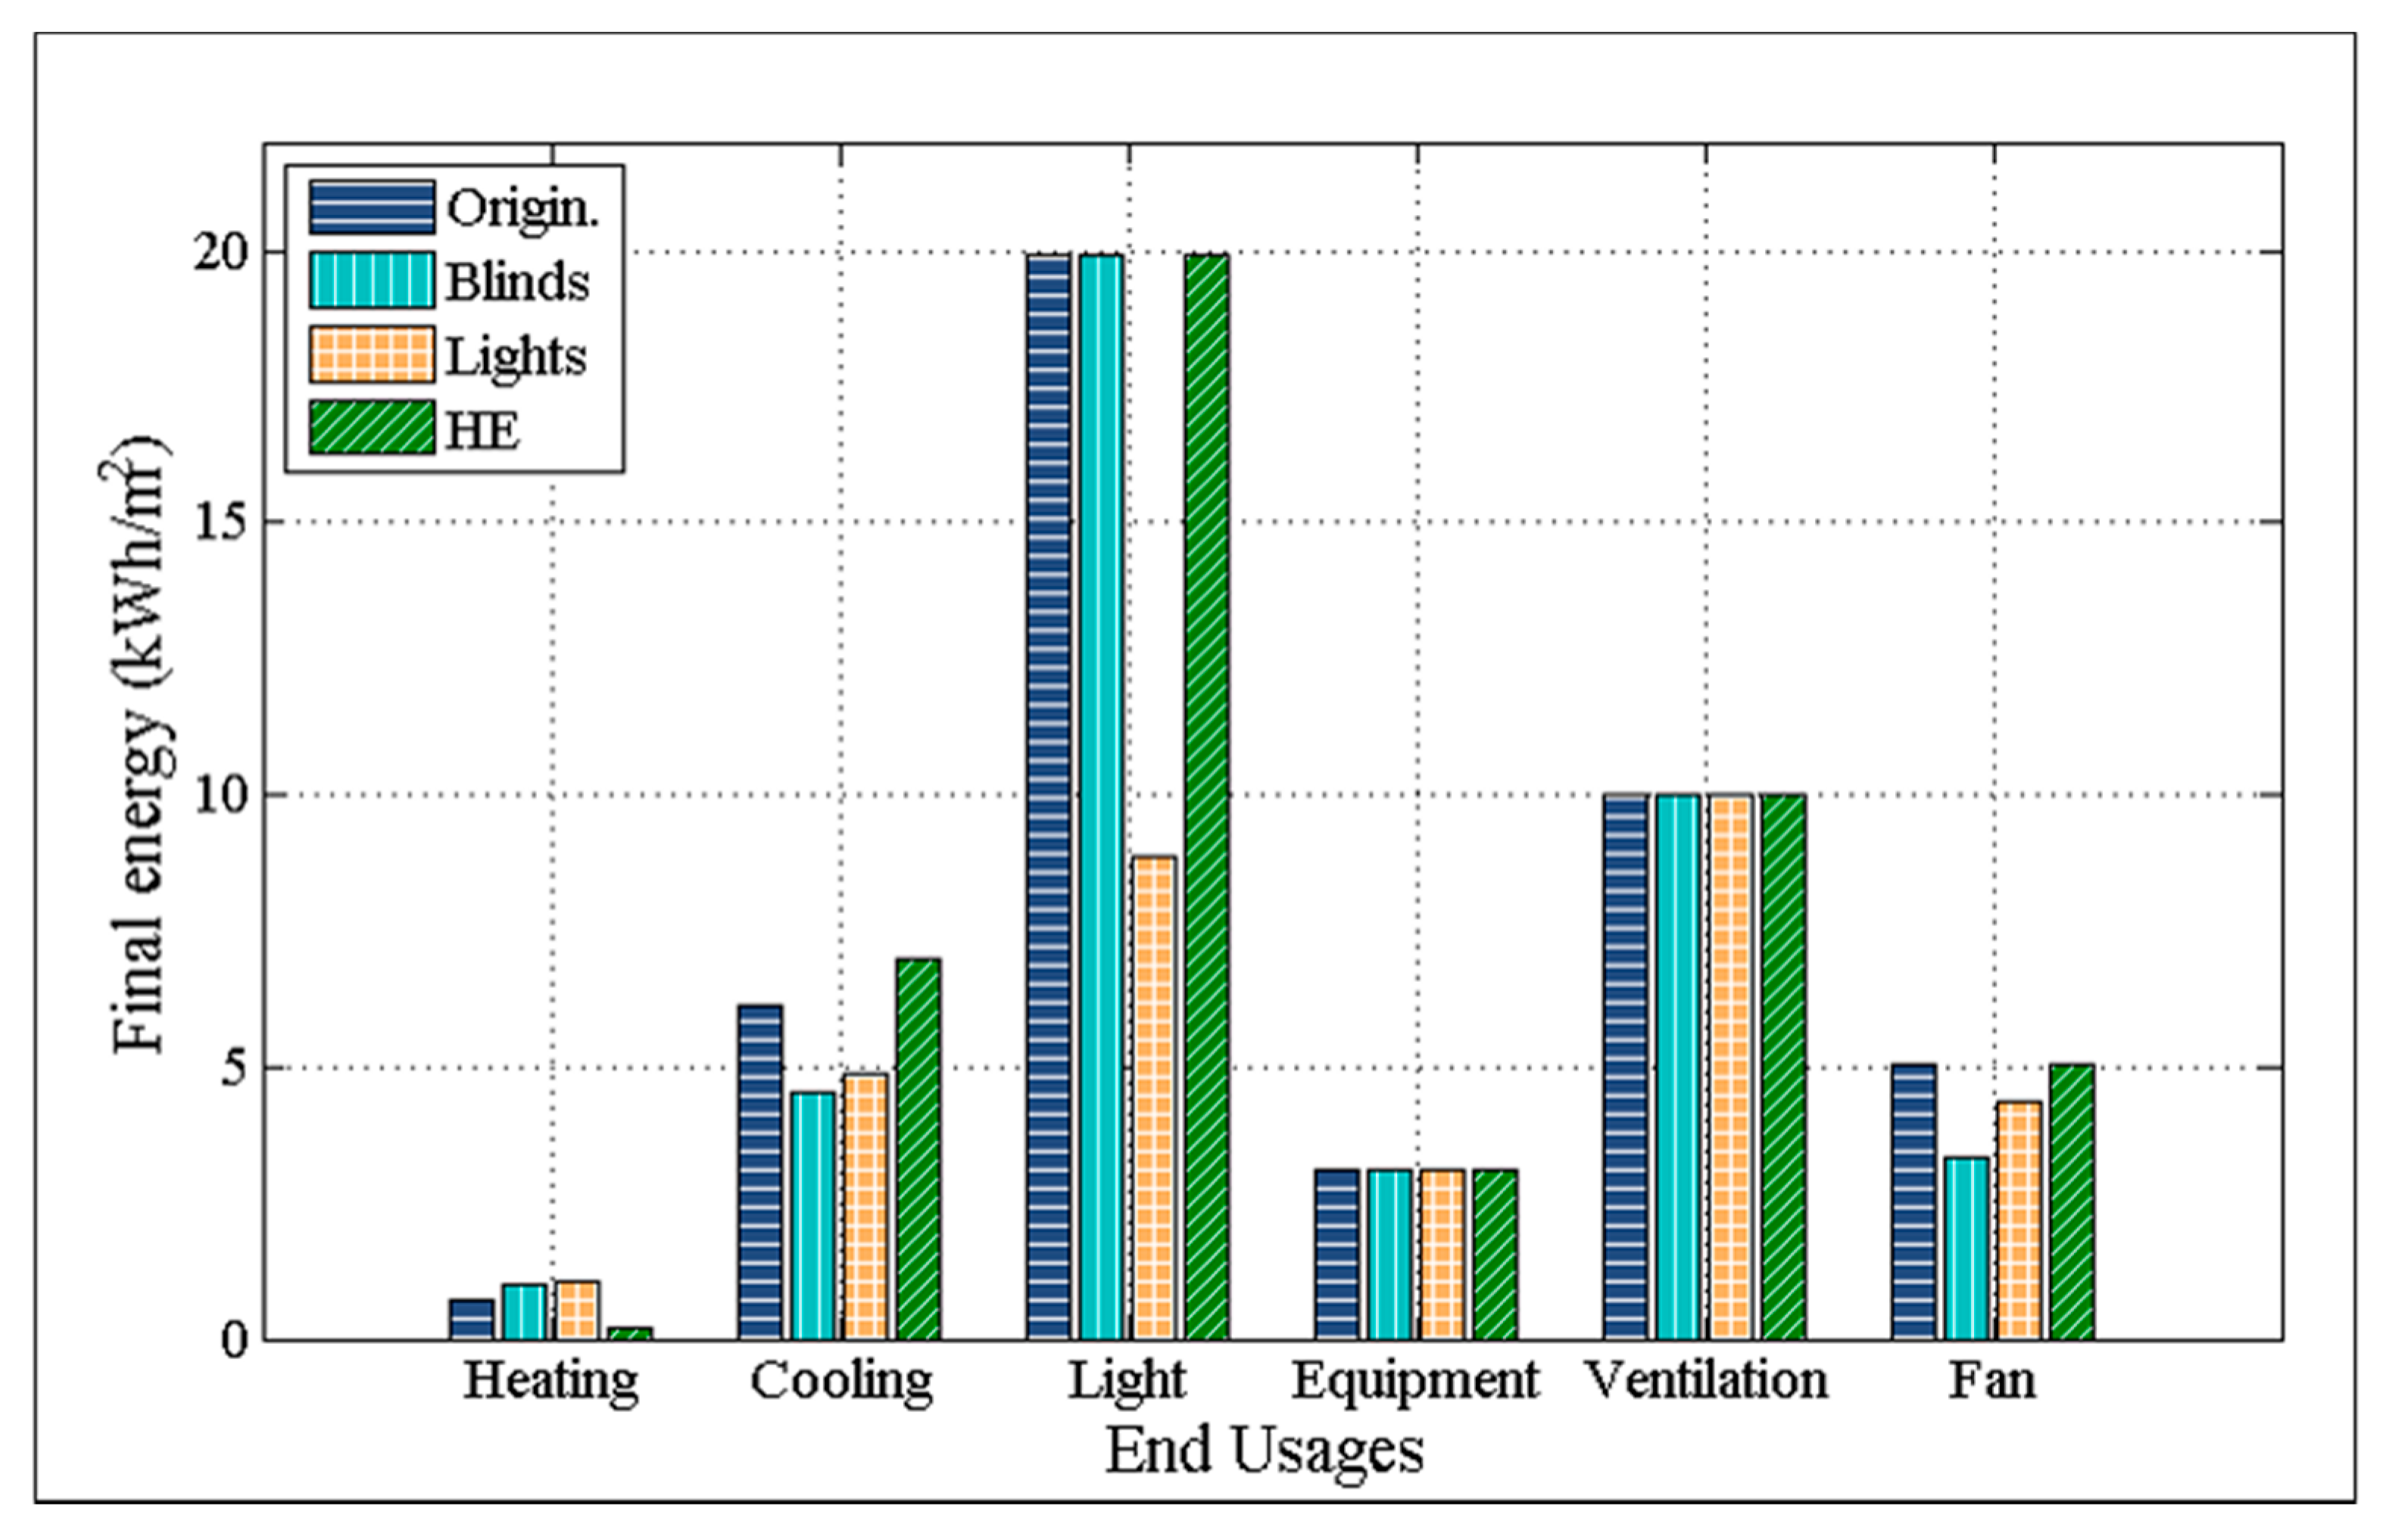
| Passive design | 0.60 | 0.73 | 14.29 | 2.65 | 8.04 | 0.15 | 30.47 | - |
| Blinds | 0.82 | 3.91 | 14.29 | 2.65 | 8.04 | 0.13 | 29.85 | 2.03 |
| Lights | 0.85 | 3.85 | 6.30 | 2.65 | 8.04 | 0.13 | 21.82 | 28.39 |
| HE | 0.06 | 5.36 | 14.29 | 2.65 | 8.04 | 0.15 | 30.56 | −0.31 |
Figure 6.
Annual final energy simulation results of the re-design with active strategies (kWh/m2-year).
Figure 6.
Annual final energy simulation results of the re-design with active strategies (kWh/m2-year).
Table 10.
Integration of active and passive strategies.
Table 10.
Integration of active and passive strategies.
| | Original Design | Original Design with Active Strategies (Active only) | Re-Design (Passive only) | Re-Design with Active Strategies (Passive & Active together) |
|---|
| Best (Lights) | Worst (HE) | Best (Lights) | Worst (HE) |
|---|
| Energy (kWh/m2) | 44.86 | 32.27 | 45.30 | 30.47 | 21.82 | 30.56 |
| Saving (%) | - | 28.07 | −0.99 | 32.08 | 51.36 | 31.88 |
According to the findings the effectiveness of active strategies regarding the reduction of the total final energy vary significantly between the original school design and the re-design. For instance, the final energy saving rate by application of dynamic blinds on the original school design is 6.57%, while the energy saving by application of dynamic blinds on the re-designed school building is only 2.03%.


