The Regional Index of Sustainable Economic Welfare for Flanders, Belgium

Faculty of Business Administration and Public Administration, Ghent University College, Henleykaai 84, Ghent B-9000, Belgium
Sustainability 2013, 5(2), 496-523; https://doi.org/10.3390/su5020496
Submission received: 28 December 2012
/
Revised: 17 January 2013
/
Accepted: 21 January 2013
/
Published: 1 February 2013
(This article belongs to the Special Issue Measuring Socio-Economic Well-Being)
Abstract
:In this paper, the regional Index of Sustainable Economic Welfare (ISEW) is compiled for Flanders for the period 1990–2009. The ISEW is a measure of economic welfare in that it measures the contribution of a country’s or region’s economy to the overall level of well-being of its citizens. It does so by comparing the benefits and the costs of economic activities rather than simply looking at the market value of all final goods and services produced in an economy (Gross Domestic Product-GDP). The ISEW for Flanders shows that the per capita level of sustainable economic welfare in the region decreased between 1990 and 2009. The drop in the ISEW/capita is caused by a deterioration of the net international investment position of Belgium (which is divided over the different regions in the country on a per capita basis) and by an increase in the income inequalities in Flanders. To a lesser extent, the increase of the environmental costs (climate change and the use of non-renewable energy resources) also contributed to the decrease in the ISEW per capita. In the last four years of the study period, the level of sustainable economic welfare in the Flemish region started to rise again, even in 2008 and 2009 during the economic recession.
1. Introduction
Ever since the “Beyond GDP” conference in the European Parliament in November 2007 and the publication of the Stiglitz-Sen-Fitoussi report in September 2009 [1], the development of alternative measures for societal progress has gained momentum. In almost all developed countries around the world, initiatives have been undertaken to design alternative measures to GDP, either by looking at one alternative indicator or at a set of alternative indicators. International organizations have also outlined programs to monitor societal progress, such as the “Beyond GDP” initiative by the organizers of the conference in the European Parliament, the OECD’s World Forums on Statistics, Knowledge and Policy and their Better Life Index, Eurostat’s set of indicators for sustainable development and the UN’s recognition of the need to move beyond GDP in the conclusions of the Rio+20 conference on sustainable development.
On the regional level, governments, governmental bodies and groups of citizens have also undertaken a number of initiatives to promote societal progress beyond GDP. In October 2010, Flanders and the EU Committee of the Regions organized the Open Days 2010 meeting on indicators and policies for sustainable development that included several Beyond GDP workshops. At the end of this meeting, the EU Committee of the Regions supported the European Commission's Beyond GDP agenda and requested to use complementary indicators to GDP for regional development policies. Different approaches are used to go beyond GDP on a regional level, ranging from sets of indicators (e.g., Nord-Pas-de-Calais in France) to single indices expressed in monetary terms (e.g., in Finland, in Siena and Tuscany in Italy and in Vermont and Maryland in the United States).
In this paper, the results of a study on the Regional Index of Sustainable Economic Welfare (R-ISEW) for Flanders will be presented as a regional effort to move “beyond GDP”. The study was called for by the Flemish Environment Agency (VMM) that also provided some of the data required for the compilation of the R-ISEW [2]. In Section 2, the Index of Sustainable Economic Welfare is introduced as a measure of economic welfare and a number of regional applications are reviewed. In Section 3, the compilation of the Regional ISEW for Flanders is reviewed, paying attention to both the methodology used and the data collection process. Section 4 compares the results for Flanders with the Belgian ISEW and the ISEW in a number of neighboring countries, while Section 5 concludes.
2. Beyond GDP: The Index of Sustainable Economic Welfare
In the “Beyond GDP” literature, many alternative measures have been put forward to evaluate policies or societal progress over time. Most of these efforts focus on the development of one alternative measure or index, without paying too much attention to the range of existing measures that are available in the literature or to theoretical considerations regarding the different concepts that are being measured. As a result, few classification schemes for alternative measures exist today.
After reviewing the merits and the drawbacks of the existing schemes, Bleys [3] developed a new substance-based classification scheme in which the alternative measures are categorized by the underlying concepts that they aim to quantify: well-being, economic welfare and sustainability. Measures of well-being aim to comprehensively evaluate either a single person’s life situation or the life situation of a group of people. These measures are multi-dimensional by nature and can be linked to different theoretical conceptualizations of well-being. Measures of economic welfare capture the contribution of a nation’s economy to the overall level of well-being enjoyed by its citizens. They can thus be regarded as measures of the economic dimension of well-being. Measures of sustainability investigate whether the current levels of well-being and economic welfare can be sustained into the future. The alternative measures are further subcategorized according to the different approaches to quantitatively capture the notions of well-being, economic welfare and sustainability.
In this section, the notion of economic welfare is first looked into in greater detail. Next, the Index of Sustainable Economic Welfare (ISEW) is presented as a useful tool to measure this notion. Finally, regional applications of the ISEW are presented as benchmarks for the current study.
2.1. Economic Welfare
In the classification scheme by Bleys [3] outlined above, one of the main conclusions is that the dimension of economic welfare is often overlooked in the “Beyond GDP” debate. New measures focus mostly on the concepts of well-being or sustainability, and even in the Stiglitz-Sen-Fitoussi report, the need to develop a measure of true economic progress is absent. Yet, few economists or policy-makers today will defend the position that GDP is a good measure of well-being or sustainability, whereas the level of economic activities in a country (as measured by GDP) is still often regarded as a good proxy for the economic performance of that country. Arguing that we should focus primarily on the development of alternative measures of well-being and sustainability tends to ignore the fact that GDP is not a good measure of economic welfare.
Economic welfare is used in Bleys [3] to refer to the contribution of a nation’s economy to the overall level of well-being enjoyed by its citizens. Economic welfare can thus be seen as the economic dimension of well-being. Monitoring the level of economic welfare over time involves distinguishing between the costs and benefits of the economic process. The services derived from consumption are widely considered to be the main benefits from economic activities. Yet, in valuing these benefits, several important issues need to be addressed (e.g., proper distinction between intermediate goods and final goods, acknowledgement of defensive and rehabilitative expenditures, deciding on which boundaries to use when looking at consumption, distributional issues, etc.). The costs associated with economic activities are mostly linked to the natural environment [4]: the depletion of natural capital, the proper disposal of wastes and the loss of ecosystem services due to environmental degradation. Constanza et al. [5] argue that the distinction between costs and benefits is essential if one wants to talk about economic welfare rather than the physical scale of an economy.
Different conceptualizations of income have been used to develop measures of economic welfare: economic income, sustainable income and psychic income are the ones that are most widely used. Economic income, defined as the gross income generated by all marketed economic activities, involves summing the incomes accruing from production. As such, economic income is closely linked to the level and pattern of goods and services produced within the nation’s economy. Sustainable income incorporates changes in different types of capital stocks (e.g., human-made capital or natural capital). The central criterion to define the concept of sustainable income has been put forward by Hicks [6]: “We ought to define a man’s income as the maximum value, which he can consume during a week and still expect to be as well off at the end of the week as he was at the beginning”. The same logic holds at the national level and for annual time periods. Psychic income is defined not as the amount of goods and services produced or consumed in a particular year, but as a psychic flux of services derived from the consumption of these goods and services [7]. Services are ultimately psychic, subjective satisfactions in the stream of consciousness of a human being that result from his or her consumption. Fisher also recognized disservices and negative psychic sensations, from labor, pains orother discomforts.
Lawn [4] favors the concept of psychic income to develop measures of economic welfare, as the concept adopts the view that economic welfare depends on the psychic enjoyment of life, whereas other income concepts associate economic welfare with the rate of production and consumption. Furthermore, working with the income concept of Fisher forces one to recognize that the continual maintenance of the human-made capital stock should be seen as a cost and not as a benefit. Finally, the notion of psychic income allows for the consideration of several welfare-related items (e.g., distributional issues) that are overlooked by measures built on other conceptualizations of income. The Index of Sustainable Economic Welfare (ISEW) that is presented in the next section is a measure of psychic income.
2.2. The Index of Economic Welfare (ISEW)
The Index of Sustainable Economic Welfare (ISEW), developed by Daly and Cobb [8], is currently the most widely used measure of economic welfare built on the concept of psychic income. The ISEW captures the overall impact of economic activity on human well-being, as it distinguishes between the benefits and costs of economic activities. It also takes into account several social issues, such as income inequalities and time use. The main advantage of the ISEW over other alternative measures is that it is calculated in monetary terms, so that it can directly be compared to the GDP. All items in the methodology of the ISEW are expressed in monetary terms using valuation methods from different types of literature (e.g., environmental economics for the valuation of environmental degradation, social economics for the valuation of household labor and the welfare losses from income inequalities, and so on). Over the years, the methodology of the ISEW was revised several times. New items were included in the framework and valuation methods were updated. Since 1998, the index is sometimes also referred to as the Genuine Progress Indicator (GPI).
When the ISEW was first advanced in 1989, little effort was made to develop a formal theoretical framework for the index. Items were included in the ISEW based on an extensive review of the criticism that GDP had attracted over the years when used as a measure of economic welfare. Lawn and Sanders [9] and Lawn [4] later provided a theoretical foundation for the ISEW that was built on the income and capital concepts put forward by Fisher. The methodology of the index will be presented in Section 3.2. that presents the compilation of the regional ISEW for Flanders.
Following Daly and Cobb’s initial ISEW study on the United States, the index was calculated for many countries: Germany, the Netherlands, Sweden, the United Kingdom, Portugal, Austria, Italy, Chile, France, the Netherlands, Poland and Thailand3. In each country, minor adaptations were made to the original methodology in order to overcome problems with data availability or to pay attention to country-specific issues. The GPI has already been compiled in the United States, Australia, China, India, Finland, Japan, New Zealand and Vietnam—see Posner and Costanza [10] for an overview of the studies.. A common finding among this series of international studies is the growing divergence between GDP per capita and ISEW per capita, especially during the last two decades. In many countries, this divergence can be explained by an increasing income inequality, rising costs of resource depletion and escalating long-term environmental costs. During the 1980s and 1990s, economic welfare (as measured by the ISEW) levels off or starts to decline in most countries for which the index was calculated. Based on these insights, Max-Neef [11] has put forward the ‘threshold hypothesis’, which states that economic growth contributes to human welfare only up to a certain point—the threshold point—after which further economic growth has a negative impact on welfare.
2.3. Regional Applications
Over the past few years, the interest in calculating regional ISEWs and GPIs has grown. These alternative measures of economic welfare have increasingly been calculated on regional levels (state, province, city) to explore the impact of economic activities in a certain region on the well-being enjoyed by the citizens living in that region. In this section, an overview of all available regional ISEW and GPI studies is given before discussing some of the potential problems in the regional compilations. Finally, the added value of regional studies is looked into.
2.3.1. Available Studies
Posner and Costanza [10] review all available studies that use either the ISEW or the GPI to evaluate regional economic welfare. The authors came across studies in seven different countries that focused on different levels (ranging from states in the US to cities in China). I have added Pulselli et al. [12] to Table 1.

Table 1.
Regional Index of Sustainable Economic Welfare (ISEW) and Genuine Progress Indicator (GPI) studies.
| Country | Regional Level | Most recent publication |
|---|---|---|
| Australia | 1 state | Lawn and Clarke [13] |
| Canada | 3 provinces | Pannozzo et al. [14] |
| 1 city | Anielski and Johannessen [15] | |
| China | 4 cities | Wen et al. [16] |
| Finland | 2 regions | Hoffren [17] |
| Italy | 3 provinces | Pulselli et al. [18] |
| 1 province | Pulselli et al. [12] | |
| United Kingdom | all regions | Jackson et al. [19] |
| United States | 32 counties | Bagstad and Shammin [20] |
| 5 cities | Posner [21] | |
| 3 states | Berik and Gaddis [22] |
Posner and Costanza [10] compare the results of the different regional ISEW and GPI studies to the corresponding national results. They conclude that the differences between the regional ISEW or GPI estimates and the gross regional products are smaller than the differences at the national level. The “threshold hypothesis” outlined above is less clear at the regional level. Posner and Costanza point to three possible explanations. First, regional studies often include fewer items on externalities due to data limitations at the regional level. Second, the authors point to a more unequal distribution of economic costs and benefits between regions, so that some of the regions that have been studied may benefit from having a lower concentration of polluting factories. Finally, Posner and Costanza argue that the economic, social and environmental costs increase with the scale of the economy that is being investigated. It would be interesting to see whether the results of the regional ISEW for Flanders are in line with the conclusions by Posner and Costanza. On the other hand, it should also be noted here that the subsample of regional ISEW and GPI studies used in Posner and Costanza [10] is relatively small, so that no major conclusions can be drawn from their analysis. The only way to test their hypothesis is to undertake an analysis for a country and all its subnational regions all at once.
2.3.2. Feasibility
The feasibility of regional ISEW and GPI studies depends mostly on the availability of the data required in the compilation of the indices. Many regional studies report problems with finding the necessary data at the regional level. Regional data are key to the development of regional ISEWs and GPIs, because working with national averages (e.g., for emissions of air pollutants) obscures regional differences and does not allow exploring the effectiveness with which regional authorities tackle specific problems (e.g., air pollution). Finding the necessary data for ISEW or GPI compilations is not only a problem at the regional level. Differences in data availability at the national level make it hard to compare outcomes of studies for different countries. On the regional level, however, the problems with data availability are amplified. Clarke and Lawn [23] compare the methodology of two regional GPI studies: one for Vermont in the United States [24] and one for Victoria in Australia [13]. It was found that 19 items in these studies were included in only one of the two GPI compilations, whereas none of the 12 items both studies have in common were estimated using the same methodology. Comparing outcomes of different ISEW or GPI studies is difficult, both at the regional and the national level. One needs to closely examine the different methodologies that have been used. The methodology used in the study for Flanders follows the methodology of the Belgian ISEW study [25] as closely as possible in order to make meaningful comparisons between both studies.
Apart from the problems with data availability and limited comparability between studies, regional ISEW and GPI studies may be less relevant given that local authorities often lack the legal responsibilities to formulate policies aimed at improving economic welfare [23]. This is certainly true for studies at a city level, yet less so for the R-ISEW presented in this paper. The region of Flanders has a wide range of responsibilities that allows the Flemish government to take decisions that aim to improve the level of economic welfare in the region.
Finally, Bagstad and Ceroni [26] argue that a number of items in the ISEW or GPI are less meaningful at the regional level. The authors question the relevance of the capital adjustments made in these indices (net investments and changes in the net international investment position) and argue that certain natural goods and services may not be scarce in specific regions, so that correcting for their loss may not always be necessary.
2.3.3. Added Value
Regional ISEW and GPI studies contribute to the public debate on measuring well-being and sustainability in three important ways. First, the regional ISEW and GPI are comprehensive measures of economic welfare based on a broad system analysis that regards the economy as a subsystem of the environment and of society [23]. Next, regional ISEW and GPI studies allow for comparing the levels of economic welfare between different regions and countries and exploring the strengths and weakness of different regions [26], keeping in mind the considerations outlined above. Finally, the ISEW and GPI contribute to the development and evaluation of policy measures, given that they encourage alternative development prescriptions [23]. Posner and Costanza [10] argue that the economic, social and environmental indicators that enter the methodology of the ISEW and GPI offer policy-makers a wide range on information to help them make better decisions.
3. Compiling the Regional ISEW for Flanders, 1990–2009
In this section, the compilation of the regional ISEW for Flanders (1990–2009) is presented. The methodology and data used in the compilation are reviewed in Section 3.2 and Section 3.3, but first, the area under study (Flanders) is presented.
3.1. Flanders
Flanders is the largest region in Belgium. It is located in the northern part of the country, has 6,251,983 inhabitants in 2010 (57.7% of the total population in Belgium) and the official language in the region is Dutch. In 2009, the Gross Domestic Product per resident in the Flemish Region was 31,338€/capita in 2009 prices, making it the second richest of the three regions in Belgium after the Brussels Capital Region (59,802€/capita), but before the Walloon Region (23,066€/capita). The Flemish government has (mostly exclusive) legislative and executive powers for a number of important policy areas: the economy, foreign trade, the health system, the distribution of energy, housing, agriculture, the environment, public transportation, employment, culture and education and science and technology. The Flemish government has great autonomy, as it is set on the same level as the Belgian federal government, each policy area is assigned to only one of the governments and interference is not allowed. This makes the regional ISEW study for Flanders an interesting case, as the Flemish government is responsible for a wide range of policy areas.
3.2. Methodology
The methodology of the ISEW takes the private consumption expenditures of a country or region as its starting point, as it is argued that these consumption expenditures are the main benefits from economic activities. Next, a number of corrections are made to incorporate both positive and negative welfare effects: part of the public consumption expenditures and the value of household labor are added to the private consumption base of the ISEW, while the defensive and rehabilitative part of private consumption expenditures and the welfare losses from income inequalities are deducted. Finally, a number of capital adjustments are made to include the impact of foreign debt and investments on the current level of well-being enjoyed in a country or region. Within the ISEW, the costs of economic activities are mainly due to the loss of ecosystem services that occur either through environmental degradation (water and air pollution, climate change, ozone layer depletion) or through the depletion of natural capital. The ISEW is calculated as the difference between the benefits and the costs of economic activities.
Table 2 provides an overview of the different items included in the regional ISEW for Flanders. Each of the items is placed under the category heading that relates to the general description of the methodology above. In the next section, the valuation methods used for each of these items is presented.
| Column | Item | Sign | Item Category |
|---|---|---|---|
| A | Year | ||
| B | Private consumption expenditures | + | Private consumption expenditures |
| C | Atkinson index of income inequality | ||
| D | Welfare losses from income inequality | - | Welfare losses from income inequality |
| E | Value of household labor | + | Value of household labor |
| F | Services from consumer durables | + | Capital adjustments |
| G | Public expenditures on health and education | + | Non-defensive government expenditures |
| H | Expenditures on consumer durables | - | Capital adjustments |
| I | Private expenditures on health and education | - | Defensive/rehabilitative private expenditures |
| J | Costs of commuting | - | Defensive/rehabilitative private expenditures |
| K | Private expenditures on household waste | - | Defensive/rehabilitative private expenditures |
| L | Costs of car accidents | - | Defensive/rehabilitative private expenditures |
| M | Costs of water pollution | - | Costs of environmental degradation (direct) |
| N | Costs of air pollution | - | Costs of environmental degradation (direct) |
| O | Costs of noise pollution | - | Defensive/rehabilitative private expenditures |
| P | Loss of farmlands | - | Depletion of natural resources |
| Q | Depletion of non-renewable resources | - | Depletion of natural resources |
| R | Costs of climate change | - | Costs of environmental degradation (long-term) |
| S | Costs of ozone layer depletion | - | Costs of environmental degradation (long-term) |
| T | Net capital growth | +/- | Capital adjustments |
| U | Changes in the net international investment position | +/- | Capital adjustments |
| V | Index of Sustainable Economic Welfare (ISEW) | ||
| W | ISEW per capita | ||
| X | Gross Regional Product (GRP) | ||
| Y | GRP per capita | ||
| Z | Population |
3.3. Item by Item
In the compilation of the regional ISEW for Flanders, the methodology used in the ISEW study for Belgium [25] is followed as closely as possible to allow for meaningful comparison between the national and the regional level. Bleys [27] can be consulted for a full description of the methodology used in the Belgian ISEW. All items in the ISEW for Flanders are valued in monetary terms (constant 2000 prices).
3.3.1. Column A—Year
The ISEW for Flanders was calculated for the period 1990-2009. As the regional accounts for Flanders only go back to 1995, economic data for the Flemish region prior to 1995 had to be estimated using national data. Some of the environmental and social data for the earlier years in the study period also had to be estimated using regression models or be based on national data. The data required in the compilation of the regional ISEW for Flanders became more available over the years, making future updates of the study easier.
3.3.2. Column B—Private Consumption Expenditures
At the moment, private consumption expenditures are not reported in the Regional Accounts for Flanders, yet a workgroup in the National Bank of Belgium is looking into the possibility of dividing the Flemish Regional Product according to the different types of expenditures. The private consumption expenditures for Flanders were estimated using average expenditures per household from the household budget surveys (Statistics Belgium) and data on the number of households in Flanders.
3.3.3. Columns C and D—Atkinson Index and Welfare Losses from Income Inequality
Changes in income inequalities in Flanders are monitored through the Atkinson index for income inequality I (column C). This measure of income inequality is generally preferred in ISEW and GPI studies over the Gini coefficient, as it has a clear welfare theoretical interpretation that takes into account a society’s preference for more or less equality. This preference is expressed through a parameter ε in the formula of the Atkinson index that can be interpreted as the amount of money that a society is willing to see lost in the process of transferring income from a richer person to a poorer one [28]. The societal preference for more or less equality can be estimated by looking at the public redistributive instruments in place in a country or region [29], but this exercise had not yet been carried out for Belgium or Flanders. In line with the ISEW for Belgium, it was decided to use a value of 0.8 for ε, the same as the one used in the UK study [30].
Data on the distribution of incomes in Flanders (per decile) is taken from publications on the living standards in Flanders (fiscal statistics on incomes) available from Statistics Belgium. For each income decile, the difference between the total taxable income and the total taxes was taken as a proxy for the distribution in net incomes. The welfare losses from income inequality (column D) are calculated by multiplying the personal consumption expenditures (column B) by the Atkinson Index I (column C). These welfare losses are then subtracted from the consumption base of the ISEW.
3.3.4. Column E—Value of Household Labor
The value of household labor in Flanders is estimated by multiplying the time spent on household labor by the shadow price of these activities. Time use studies are used to estimate the time spent on household labor in 1988, 1999, 2004 and 2005 [31,32] for residents aged between 18 and 75 years old. Data for the other years in the study period were estimated using linear interpolation. As this was not possible for years after 2005, the estimated time per person spent on household labor in 2005 was used for all subsequent years. Next, the wage rate of cleaning personnel is taken as the shadow price of household activities. Data on this wage rate is available on the ECODATA website as a part of the consumer price index (CPI). As these data are only available on the national level, it was assumed that the wage rate in Flanders is the same as the national average. The number of Flemish inhabitants aged between 17 and 85 years old was taken from Statistics Belgium. Comparing the data of Flanders to those for Belgium, one finds that the Flemish spent a little less time on household labor than the national average.
3.3.5. Columns F and H—Services from and Expenditures on Consumer Durables
The treatment of consumer durables as a capital stock is the first of three capital adjustments made in the ISEW methodology. Consumer durables are goods that last longer than one year, a typical example being household appliances. It would be incorrect to count the expenditures on durables in one year as consumption, since consumers will benefit from their services during a period that exceeds one year. At the same time, durables purchased in previous years will also render services to consumers. From the above, it is clear that durable consumer goods should be considered as a capital stock. Within the ISEW framework, treating durables as a capital stock implies adding an estimate of the services they render in a certain year and deducting the expenditures made on them in the same year (as these expenditures are already included in the personal consumption expenditures base of the index). In column F, the estimated value of the services of consumer durables is added, while the annual expenditures on these goods are subtracted in column H.
The Flemish ISEW methodology accounts for four kinds of durable consumer goods: household appliances, household durables, private vehicles and electronics. Expenditures on these goods are to be subtracted from the private consumption base, as the services provided by the stock of consumer durables are included in this column. Data on expenditures per household on the durable consumer goods listed above are available in the household budget surveys. Multiplying these estimates per household by the number of household in Flanders leads to the total annual expenditures on consumer durables in Flanders (column H). The total value of the stock of consumer durables is calculated using an estimated average lifetime of eight years for all consumer durables and a linear depreciation path (which leads to a depreciation rate of 12.5% annually). The value of the services that this stock provides each year (column F), is obtained by multiplying the total value of the stock by a constant factor of 0.2, assuming that this factor will account for both interest and depreciation. The interest can be regarded as the implicit annual payment for the services of capital [33]. As in most other studies, an interest rate of 7.5% is used in the calculations.
3.3.6. Column G—Public Expenditures on Health and Education
In the original ISEW [8], most of the public expenditures are regarded as defensive expenditures that are necessary to maintain a certain level of welfare, rather than adding to the level of welfare experienced by the inhabitants that the government serves. In the ISEW for Belgium [27], public consumption expenditures are treated more or less in the same way as in the original ISEW—half of the expenditures on health and on all types of education are included (where the original ISEW includes only half of the expenditures on higher education). This methodological adjustment was made because of problems with data availability, as there is no separate registration in the national accounts of spending on the different types of education. The Flemish ISEW uses the same methodology as used in the ISEW for Belgium. Consolidated data on the public expenditures on both education and health are only for the period after 2004 from the Federal Public Service (FPS) of Budget and Management Control, but the data gap was filled using budget data of the Flemish government and a redistribution of national figures based on population numbers.
3.3.7. Columns I, J, K, L and O—Defensive and Rehabilitative Private Expenditures
A large portion of the personal consumption expenditures does not contribute to the level of well-being enjoyed by the consumers. These expenditures are regarded as either “defensive” expenditures that are made to prevent the undesirable side effects of the economic process or as “rehabilitative” expenditures that are made to restore the productive capacity of the economy. In the Flemish ISEW compilation, the following defensive and rehabilitative expenditures are subtracted from the consumption base: private expenditures on health and education, the costs of commuting, the costs of personal pollution control, the costs of car accidents and the costs of noise pollution.
To be consistent with the treatment of public expenditures on health and education, where data on expenditures on higher education were missing, it was opted to use the same methodology as applied in column G: only half of the private expenditures on health and all education are to be included. Data on private expenditures on health and education in Flanders were taken from the household budget surveys for the period 1996–2009. For the years prior to 1996, expenditures were estimated using linear interpolation and a budget survey for 1988.
As the costs of commuting are partly borne by consumers, private expenditures on commuting need to be subtracted from the consumption base of the ISEW. Private expenditures on transport are taken from household budget surveys in the same way as expenditures on health and education. The Research Centre of the Flemish Government publishes on its website the results of a study on travel motives: the percentage of commuting displacements in the total distance travelled decreased from 24.5% in 1995 to 21.8% in 2009. The percentage in 1995 was used for all years in the study period prior to 1995. The costs of commuting are estimated by multiplying the private expenditures on transportation by the percentage of the total distance travelled for commuting purposes.
Private expenditures on pollution abatement and control (e.g., the purchase of air filters or water filters) are to be subtracted from the total personal consumption expenditures, as they are defensive in nature. The average cost to Flemish households of processing 1,000 tons of waste is calculated based on household expenditure surveys conducted by Statistics Belgium, the total number of households in Flanders and the total amount of household waste generated for the period 1999–2006. This average cost estimate is then applied to the total amount of household waste generated in each year for the period 1990–2009 (data from the Flemish Environmental Agency–VMM) in order to compute the defensive costs made for waste processing. Waste-related household expenditures in the household expenditure surveys include: the purchase of garbage bags, taxes on household waste, rent or purchase of garbage containers and waste-related expenses of tenants. The total amount of household waste generated in Flanders increased with 63.2% over the study period (from 2.11 million tons in 1990 to 3.44 million tons in 2009).
Costs associated with car accidents are rehabilitative, as they involve repairing damage to both property and humans. Since defensive and rehabilitative hospital and medical costs have already been accounted for in columns F and H, this column only keeps track of the non-injury related costs of car accidents. To calculate the non-medical costs of car accidents, cost estimates of ICF Consulting [34] are used. In order to avoid double-counting, only the property damage and insurance administration cost estimates of the ICF Consulting study are considered. The estimates are available in 2002€ and are deflated to 2000€ using an estimated inflation rate of 3%, as suggested by the study itself. The study was carried out by European Union order and estimated country-specific cost-adjustment factors. Specific cost estimates for Flanders were not found, so that the national estimates from ICF Consulting are used here. These estimates were made for four types of accidents: fatal accidents, serious injury, slight injury and damage only. Data on the number of car accidents in Flanders is found at the Belgian Institute for Road Safety (BIVV) and the website of Statistics Belgium. However, these data sources only provide figures for the first three types of accidents included in the ICF Consulting study. Since no other data are available, the fourth category (damage only) is omitted. A simple multiplication of the property damage and insurance administration costs by the number of accidents in each year provides an estimate of the rehabilitative costs of car accidents in Flanders.
The costs of noise pollution in Flanders are calculated using a marginal cost estimate of the noise generated by road traffic equal to €0,0003 per vehicle kilometer [35]. This estimate is applied to the total number of vehicle kilometers travelled each year in Flanders (data available on the website of the Research Centre of the Flemish Government) in order to provide cost estimates of noise pollution. Sources of noise pollution other than road traffic are not considered within the Belgian ISEW.
3.3.8. Columns M and N—Costs of Water Pollution and Air Pollution
The costs of environmental degradation included in the Flemish ISEW can be divided into two categories: costs in the short run (water and air pollution) and costs in the longer run (climate change and ozone layer depletion). The latter are included in columns R and S and will be presented below. In columns M and N, the costs of water pollution and air pollution are deducted from the consumption base, as these costs are a direct result of economic activities and should be included in any measure of economic welfare.
In the Belgian ISEW study [27], a point estimate of the costs of water pollution in Belgium is taken from the original ISEW study for the United States [8], since no specific water pollution cost estimate was available for Belgium at the time the study was carried out. For the Flemish region, a specific cost estimate is available within the European research project “Aquamoney”: De Nocker et al. [36] estimate the total benefits of arriving at a good water quality in the Flemish rivers at €682 million (2006€) for the year 2006. This point estimate is used in the ISEW study for Flanders as a reference when estimating the costs of water pollution: the estimated benefits indicate the value of the ecosystem services of waterways that are lost due to water pollution. The point estimate is spread throughout the study period 1990–2009 using the Belgian Biotic Index (BBI) that looks at the presence of various macro-invertebrates in the water. The BBI values vary between 0 (extremely poor quality) and 10 (extremely good quality). Scores for a large number of water samples are available at the Flemish Environment Agency (VMM). The average scores of all samples in one year can be regarded as a measure of the quality of surface water in Flanders. The distance between the yearly average score and the maximum score (seen here as the “good water quality” referred to in [36]) is used to estimate the costs of water pollution in all years other than 2006. As the quality of surface water in Flanders is improving over time (higher BBI scores), the costs of water pollution are declining. We have to keep in mind here that the methodology used to estimate the costs of water pollution in Flanders is different than the one used in the Belgian ISEW study.
In the Flemish ISEW, the costs of air pollution are estimated by multiplying the air pollutant emissions by their respective marginal social costs. Five air pollutants are considered here: SO2, NOx, PM (particulate matter), CO and NMVOC (non-methane volatile organic compounds). Data on the emissions of these pollutants in Flanders are found in the set of headline indicators for 2010 of the Environmental Report of the Flemish Environment Agency (VMM). For SO2, NOx, CO and NMVOC, data are available for 1990, 1995, 1996 and 2000–2009. Emissions in all other years are estimated using linear interpolation. For particulate matter, data are only available for 1995 and 2000–2009. As the emission rate of PM is closely linked to the consumption of fossil fuels [30] it is possible to work with the emission to fuel consumption ratios using time series analysis or by keeping these ratios constant over time (depending on the amount of original information on the emissions). Data on fossil fuel consumption are available on the Energy Balance of Flanders (Flemish Environmental Agency-VMM). The marginal social costs of the emissions of air pollutants are taken from Jackson et al. [30] for CO and De Nocker et al. [37] and the Flemish Institute for Technological Research (VITO) for all other types of air pollutants. Using the recent estimates by De Nocker et al. [37] partially overcomes one of the oldest problems in the ISEW methodology, namely relying on old cost estimates that are taken from studies in other countries. Table 3 compares the estimates by De Nocker et al. [37] with the ones that are most widely used in ISEW studies [30].
Table 3.
Estimated marginal social costs of air pollutants [37].
3.3.9. Columns P and Q—Loss of Farmlands and Depletion of Non-Renewable Resources
Within the original ISEW methodology, natural capital depletion is reflected in three items: loss of wetlands, loss of farmlands and depletion of non-renewable natural resources. Since the majority of European countries, including Belgium, have relatively few wetlands (as indicated on the Ramsar website), the value of their eventual loss is not factored in most European ISEW studies. Jackson et al. [30] propose to employ a broader approach in which the loss of natural habitats is accounted for. However, since no comprehensive data set on natural habitats was found for Belgium or Flanders, this item was omitted from the Belgian and the Flemish ISEW. The value of lost productivity of agricultural lands is subtracted from the consumption base in column P, where lost and degraded farmlands are accounted for in two ways: through valuing the forgone benefits of lost farmlands and estimating the costs of erosion and compaction. Column Q deals with the depletion of non-renewable natural resources.
The Belgian ISEW includes the costs of lost farmlands using a similar methodology as the one put forward by Daly and Cobb [8]. Data on the total amount of farmlands in Belgium from Statistics Belgium, Goedseels and De Somer [38] and the Center for Agricultural Economics (CLE) are used, while the original cost estimate is converted to €349.6 per acre (in 2000 prices). This cost estimate was applied to the cumulative loss of farmlands since 1910. The loss of farmland productivity due to soil deterioration is also an important cost relevant to the sustainability of agricultural production. As no cost estimates of productivity loss due to erosion or compaction exist for Belgium, the necessary data for these estimates were obtained through a rescaling of the American estimates [8] based on the differences in total agricultural area (data from UN’s FaoStat). All assumptions used in the original calculations were taken over as well. As the required data to repeat this exercise outlined above are not available for Flanders, the Belgian estimates are rescaled to the Flemish region using the ratio of the total surface of agricultural land in Flanders to the Belgian total (data available through the Agricultural Surveys by the FPS Economy, SMEs, Self-employed and Energy).
In order to put a monetary value on the depletion of non-renewable resources, Cobb and Cobb [33] estimate the amount of money that has to be put aside in order to compensate future generations for the loss of natural capital. Consumption of primary fuels (coal, oil, gas, nuclear) is valued using a replacement cost factor, which reflects the costs involved in replacing each barrel of oil equivalent of energy consumed with renewable energy resources. The replacement cost was taken to be $75 in 1988 (or around €89.5 in 2000 prices) and is assumed to be subject to a 3% per year increase to account for the increasing costs of supplying each marginal unit of energy. This methodology is used in the calculation of both the Belgian and the Flemish ISEW, working with the replacement cost estimates proposed in the US study. The total amount of non-renewable energy (including coal) consumed each year in Flanders is taken from the Energy Balance of Flanders (Flemish Environmental Agency–VMM). Data are available for 1990, 1995 and 2000–2009. Non-renewable energy consumption in other years is estimated using linear interpolation.
3.3.10. Columns R—Costs of Climate Change
The alternative approach to estimate the costs of climate change was first proposed by Jackson et al. [30] in their ISEW study on the United Kingdom: “the basic idea is to assign to each ton of emissions from 1900 onwards a “marginal social cost”, which reflects the total (discounted) value of all future damage arising from that ton of emissions”. For each year, the costs of emissions are calculated by multiplying the carbon emissions in that year by the marginal social cost estimate for that year. The estimate of the total costs of climate change in a particular year is obtained after accumulating the costs from 1900 up to that year. Like most other marginal cost estimates of carbon emissions, the marginal social cost estimate used by Jackson et al. [30] varies over time to be consistent with the fact that the damage is dependent on the stock of carbon in the atmosphere and on the rate of economic growth [39]. In the UK ISEW, a cost estimate of £11.4 (in 1990 prices) per ton of carbon emitted is used for 1990, based on Fankhauser [40]. Next, Jackson et al. [30] assume that the marginal social cost in any year is proportional to the cumulative carbon emissions from the year 1900 up to that year. Most ISEW studies, including the one for Belgium, use the valuation method proposed by Jackson et al. [30]. However, Talberth et al. [41] updated the methodology in an interesting way, as they argued that the emissions of carbon dioxide should only be accumulated from the year in which there was a global carbon overshoot, which was, according to the IPCC [42], in 1964. Talberth et al. [41] also argued not to include the total emissions of carbon dioxide in any given year, but only that part of the emissions above the Earth’s carbon sequestration capacity, estimated at 3 gigatons (Gt) carbon per year [42]. The adjusted methodology proposed by Talberth et al. [41] was used in the Flemish ISEW.
Data on the emissions of greenhouse gasses in Flanders are available in the Flanders State of the Environment Report (MIRA) set of headline indicators for 2010 by the Flemish Environment Agency (VMM) for 1990, 1995 and 2000–2009. This set of indicators contains information on all greenhouse gasses: CO2, CH4, N2O, HFKs, PFKs and SF6 (where other ISEW studies mostly look at CO2 emissions). Data for the periods 1991–1994 and 1996–1999 were estimated using linear interpolation, whereas data for the years prior to 1990 were estimated using data on the consumption of fossil fuels in Belgium since 1900 (Statistics Belgium). As mentioned above, only that part of yearly emissions since 1964 that effectively contributes to an increase in the atmospheric concentration of carbon dioxides needs to be included in this column. NatureGeoScience and the Global Carbon Project estimated the distribution of the total carbon dioxide emissions according to three types of final destinations: atmospheric increase, ocean sinks and land sinks. The proportion of carbon dioxide emissions that leads to an atmospheric increase went up from 39.9% in the period 1964–1969 to 46.3% in the period 2000–2009. These percentages are used to determine the proportion of the greenhouse gas emissions in Flanders since 1964 that add to the atmospheric concentration of these gasses.
The marginal social costs of emissions of greenhouse gasses (expressed in CO2 equivalents) in Flanders in 2009 were taken from De Nocker et al. [37]: €20/ton CO2 (2009 prices) or 16.72€/ton CO2 (2000 prices). This point estimate is spread over the study period using accumulated emissions of greenhouse gasses in Flanders since 1964. This results in a marginal social cost estimate for the year 2000 of 9.82€/ton CO2 (2000 prices), or 41.3% lower than the 2009 estimate.
Finally, the annual costs of climate change in Flanders are estimated by multiplying that part of the yearly emissions in greenhouse gasses in Flanders that adds to the atmospheric concentration of CO2 by the estimated marginal social costs of these emissions. The annual costs are accumulated for all years since 1964 to arrive at the total costs of climate change in each year. Again, there is a significant difference in the methodology used in the Flemish ISEW and the Belgian ISEW that follows the methodology outlined by Jackson et al. [30].
3.3.11. Column S—Costs of Ozone Layer Depletion
In the Belgian ISEW, the costs of ozone layer depletion are estimated using cumulative consumption figures of all Montreal-listed CFCs. An estimate of the per capita CFC consumption figure for the European Union was made using data on ozone depleting substance (ODS) production from the AFEAS—website reference 12 and information on CFC consumption for the European Union and for Europe as a whole (UNEP Geo Data Portal). Since no data on Belgian CFC consumption were available, it was decided to multiply the per capita CFC consumption figure for the European Union by the total population of Belgium in order to arrive at a cumulative CFC consumption figure for Belgium. Conversion of the cost estimate used in Jackson et al. [30] has led to a unit cost of €53.71 (2000 prices) per kilogram of CFC-equivalent emissions. Each year, this unit cost is applied to the cumulative CFC consumption in Belgium. As specific data on CFC consumption in Flanders are not available, the same methodology as described above (working with EU averages) was used to estimate the costs of ozone layer depletion in Flanders.
3.3.12. Columns T and U—Net Capital Growth and Changes in the Net International Investment Position
Because of the complementarity of human-made and natural capital, sustainable economic welfare requires both types of capital to be non-declining. In terms of human-made capital, this implies that the quantity of capital goods per worker should not decline. Therefore, should the additions to the stock of human-made capital goods be greater than the necessary minimum requirement, referred to as the “growth requirement” by Daly and Cobb [8], the difference constitutes an increase in a nation’s productive capacity, which constitutes a clear benefit. Net capital growth is calculated using five-year rolling averages to flatten out big year-on-year changes in the number of people employed or in the net capital stock (private capital only). Data on the number of people employed are obtained from the HERMREG database, a joint project by the Federal Planning Bureau, the Research Centre of the Flemish Government, the Walloon Institute for Evaluation, Prospectives and Statistics and the Brussels Institute for Statistics and Analysis, while the changes in the net capital stock for Flanders were estimated using national data from the National Bank of Belgium and data on the proportion of the gross capital investments in Flanders compared to numbers for Belgium.
As Daly and Cobb [8] claim that sustainability requires long-term self-reliance, they include in their methodology a measure of changes in the net international investment position to account for the degree of a country’s self-reliance. Any tendency towards net borrowing is regarded as unsustainable consumption, since the borrowed welfare must eventually be paid back [43]. The international investment position of a country is a statistical report that presents the cumulative size of a country’s foreign assets and liabilities at a given point in time. The net international investment position (NIIP) is calculated as the difference between a country’s claims on others and the claims of foreigners on the country. The NIIP allows one to observe whether the country is a net creditor (when assets exceed liabilities) or a net debtor (when liabilities exceed assets). If a country is a net creditor, it will receive interest payments from other countries. Data on the net international investment position (NIIP) of Belgium are taken from EconStats. Five-year rolling averages of the changes in the NIIP are added to the ISEW base. Belgium has been a net creditor country throughout the entire period for which data are available. Since there are no data available on this item for Flanders, the changes in the NIIP for Belgium were scaled down to the regional level using the proportion of gross investments in Flanders in the Belgian total.
3.3.13. Columns V, W, X, Y and Z—ISEW, GRP and Population
The Index of Sustainable Economic Welfare (ISEW—column V) for Flanders is calculated by adding columns E, F G, T and U to column B, while subtracting columns H to S. The ISEW is expressed in millions constant 2000 euro. Per capita, ISEW in Flanders (column W) is calculated by dividing column V (ISEW) by column Z (population). The HERMREG database provides figures on the Gross Regional Product (GRP) of Flanders, both in current and in constant prices. Column X provides GDP data in millions constant 2000 euro. Column Y provides figures on the per capita GRP in Flanders by dividing column X (GDP) by column Z (population). Population figures are taken from Statistics Belgium.
4. Results
In this section, the results of the Flemish ISEW are presented. In Section 4.1, the overall trend over time is discussed and the different item categories (see Table 2) are analyzed in greater detail. Section 4.2 compares the ISEW results for Flanders with the ones for Belgium and some of itsneighboring countries.
4.1. Flanders
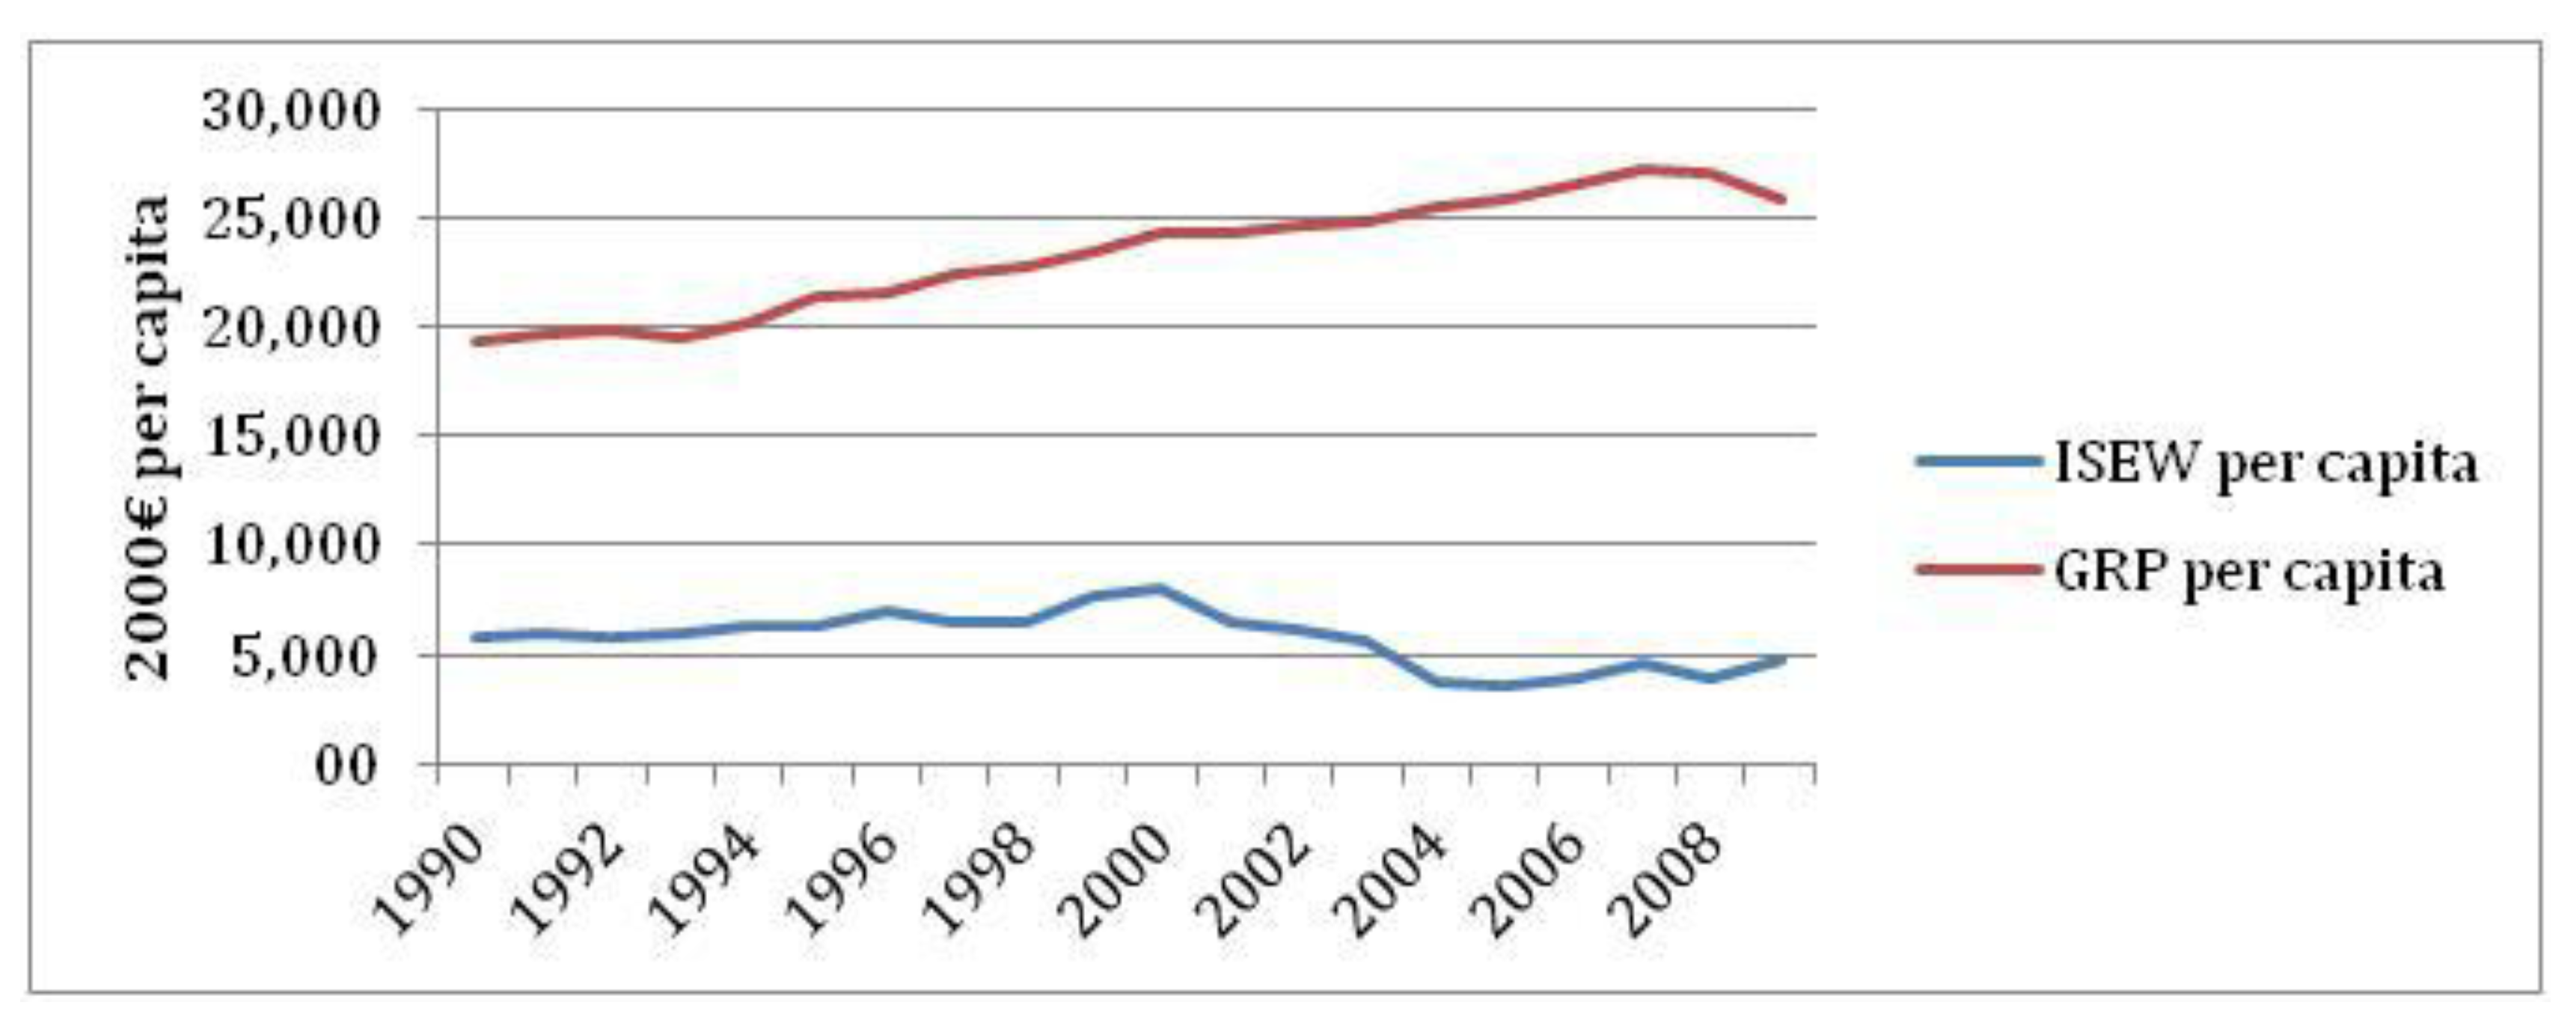
The results of the Flemish ISEW analysis are shown in Figure 1 that plots the per capita GRP against the per capita ISEW for the region. Both indices are expressed in constant prices (€ per capita—2000 prices). Although average annual growth rates vary over the period under consideration, GDP/capita shows an almost continuous increase. In fact, only in 1993, 2008 and 2009, the GRP/capita for Flanders decreased. The ISEW per capita shows a markedly different evolution over time, as the level of sustainable economic welfare in the region dropped from €5739.1 in 1990 to €4804.5 in 2009. When the study period is divided into smaller time frames (see Table 4), one can clearly identify the period between 2000 and 2005 to be responsible for the overall decline in economic welfare. The drop of the ISEW in this period is caused by a decrease in the capital adjustments made to the consumption base of the ISEW. At the end of the 1990s, the net capital growth in Flanders drops as a result of a decrease in investments and an increase in employment that increased the ‘growth requirement’ in the item. Initially, this drop is compensated by an increase in the net international investment position of Belgium (which is divided over the different regions in the country on a per capita basis), yet after the year 2000, the NIIP of Belgium starts to deteriorate. Although Belgium remains a net creditor throughout the entire study period, the claims on other countries drop from €154 billion in 2000 to €83 billion in 2004 (prices of 2000). Next, a rising level of income inequality in Flanders in the early 2000s resulted in an increase in welfare losses that added to the decrease in the Flemish ISEW per capita. To a lesser extent, the increase of the environmental costs (climate change and the use of non-renewable energy resources) also contributed to the drop of the ISEW per capita in the early 2000s. In the last four years of the study period, the level of sustainable economic welfare in the Flemish region started to rise again, even in 2008 and 2009 during the economic recession. The increase in ISEW/capita in these two last years is mostly due to Belgium’s improving net international investment position and higher than average (2000s) decrease in the direct costs of environmental degradation. In 2008, the welfare losses due to income inequality were lower than average due to a drop in the Atkinson Index, which indicates that income is more evenly distributed, yet in 2009, the income inequality in Flanders was at its highest level. However, the increase in the losses from income inequality in 2009 was fully offset by a substantial increase in private consumption expenditures in that year. In both 2008 and 2009, the net capital growth in Flanders was falling rapidly due to a drop in investments that is far greater than the drop in the capital requirement caused by a rising level of unemployment.
Figure 1.
Gross Regional Product and the Index of Sustainable Economic Welfare for Flanders, 1990–2009 (in 2000€/capita).
Figure 1.
Gross Regional Product and the Index of Sustainable Economic Welfare for Flanders, 1990–2009 (in 2000€/capita).
| Period | ISEW/capita | BRP/capita |
|---|---|---|
| 1990–1995 | +1,84% | +2,00% |
| 1995–2000 | +4,81% | +2,58% |
| 2000–2005 | −15,04% | +1,21% |
| 2005–2009 | +6,45% | +0,39% |
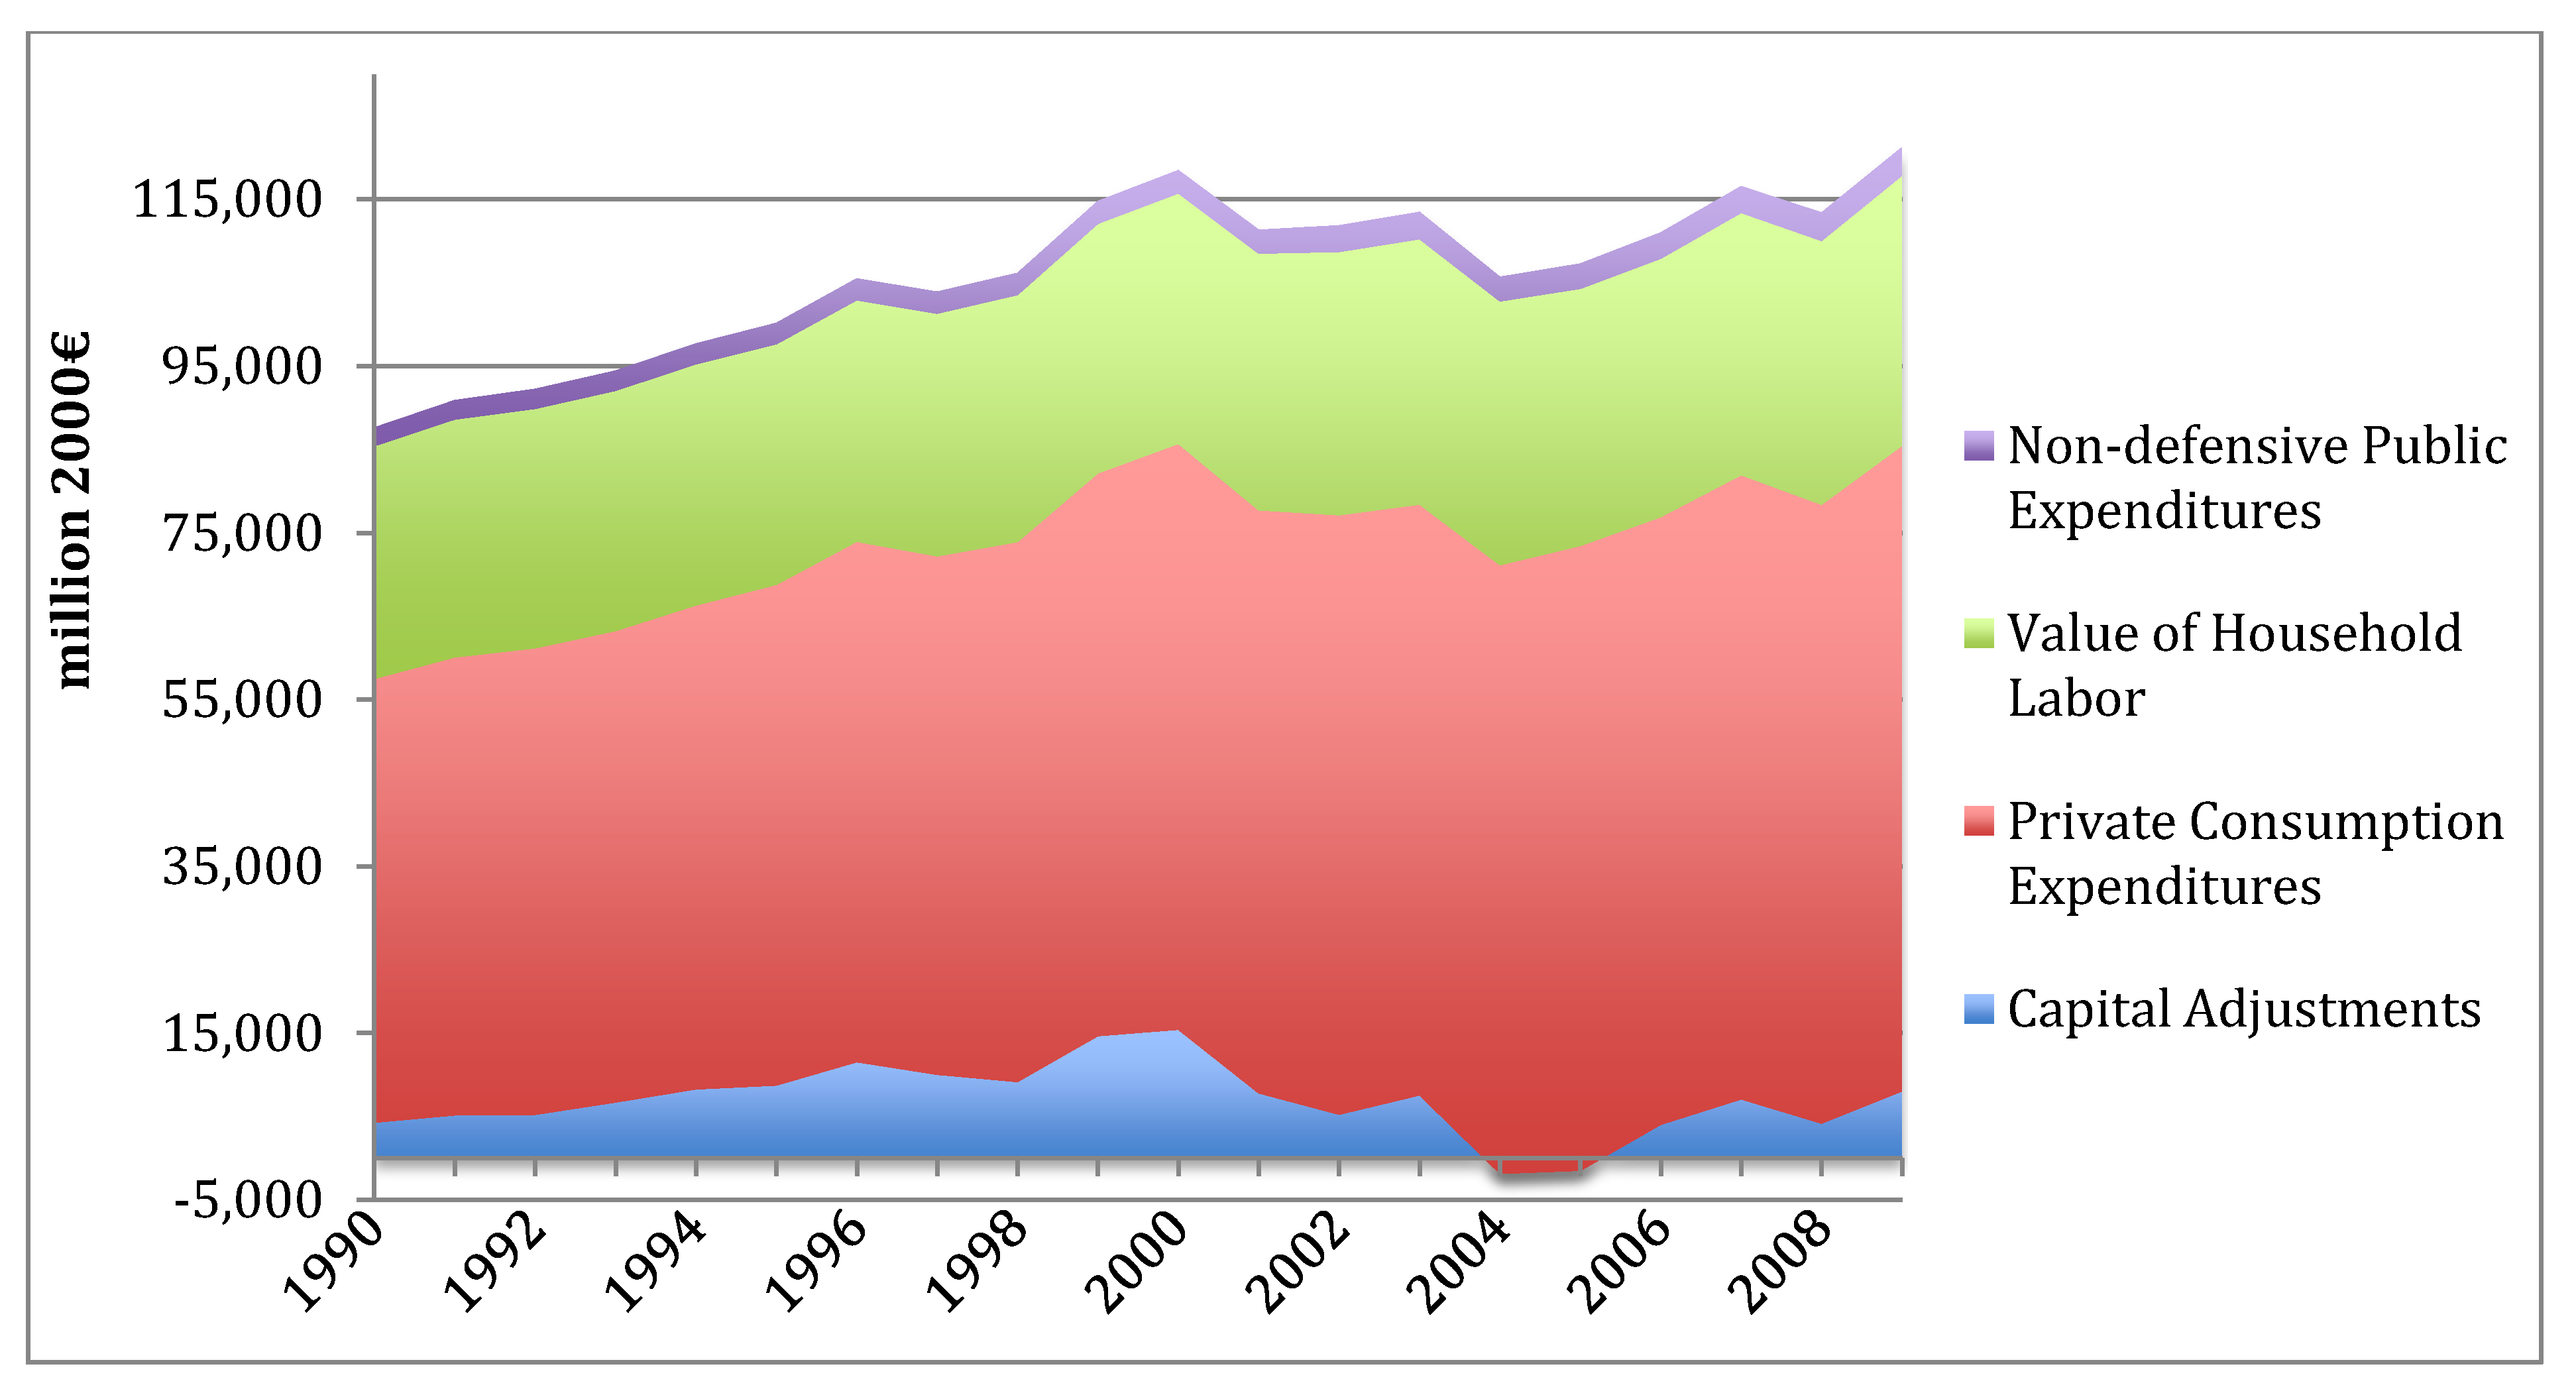
Figure 2 plots the different item categories that add to the regional ISEW for Flanders. Private consumption expenditures are by far the most important item in the index, making up for between 60% and 70% of the total of all positive items in the ISEW. The value of household labor is the second most important item within the ISEW (about 25% of the total of all positive items). The proportion in the ISEW made up by the capital adjustments (consumer durables, net capital growth and changes in the net international investment position) is rather small, yet the evolution over time of this item category is very irregular and has a large influence on the evolution over time of the ISEW. The non-defensive public expenditures on health and education make up for only 2% or 3% of the total of positive items.
Figure 2.
Positive item categories in the Flemish ISEW (in million €-2000 prices).

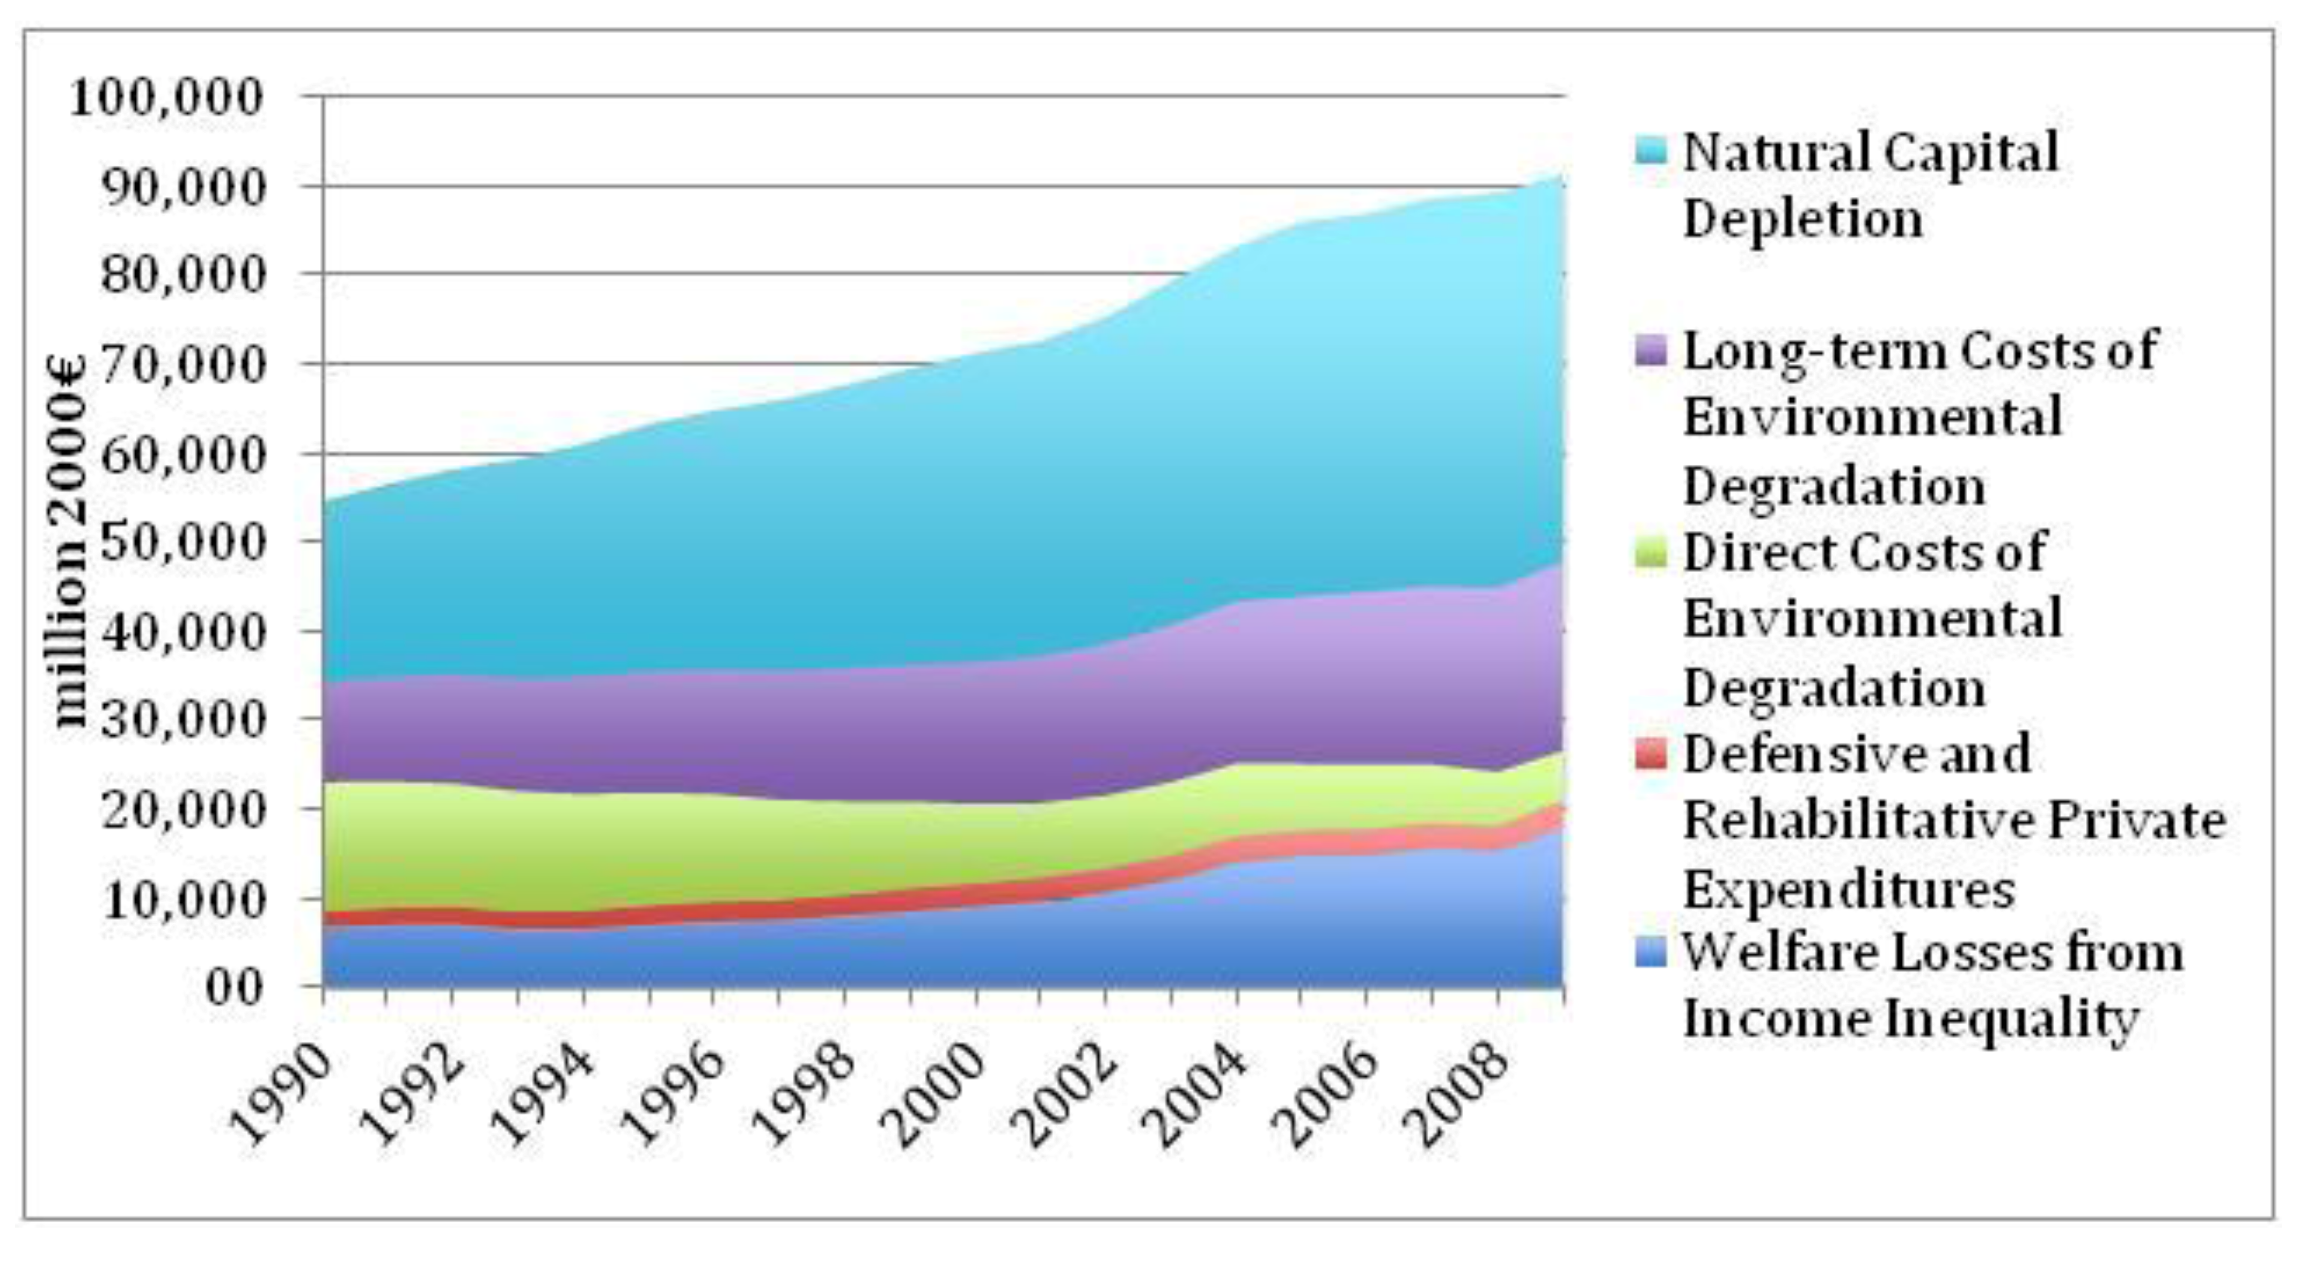
In Figure 3, the negative item categories in the ISEW are plotted in absolute values. The direct costs of the environmental degradation category are the only ones that decrease over time: the costs of water pollution decreased 31% between 1990 and 2009, while the costs of air pollution decreased by 62% over the same period, reflecting increased levels of surface water quality and lower emissions of air pollutants. The other negative item categories increased over time. Welfare losses from income inequalities increased rapidly in the 2000s, reflecting an increase in the Atkinson Index from 0.127 in 2000 to 0.206 in 2009. The depletion of natural capital increased over the study period, largely due to increased consumption levels of non-renewable energy resources (209.9 million BOE on 1990 versus 258.3 million BOE in 2009) and an increase of the estimated replacement costs that are assumed to grow at a rate of 3% per year in the ISEW methodology. Given that the methodology of both items in the costs of the long-term environmental degradation category use cumulative emissions of CFCs or greenhouse gasses, it is obvious that this item category increases over time. Private defensive and rehabilitative expenditures also increase over time, yet the growth rate of this item category decreases after the year 2000, as at that time, the costs of commuting start to decrease (lower percentage of displacements for commuting purposes) and the costs of car accidents also decrease (lower number of car accidents in Flanders). In absolute values, the depletion of natural capital is the most important negative item category in the ISEW, as it makes up about 50% of the total of all negative items. Next, the long-term costs of environmental degradation and the losses from income inequalities are also important categories (23% and 20% in 2009, respectively). Finally, the direct costs of environmental degradation and the defensive and rehabilitative private expenditures constitute 6% and 3% of the total of all negative ISEW items.
Figure 3.
Negative item categories in the Flemish ISEW (in million €-2000 prices).

4.2. Comparative Analysis
In this section, the Flemish ISEW is first compared to the ISEW for Belgium after recalculating some of the items in the ISEW for Flanders in order to increase comparability. Next, the results of the Flemish study are compared to results from ISEW studies in neighboring countries.
4.2.1. Belgium
The ISEW for Belgium was calculated by Bleys [27] using a methodology that is different for some of the items within the index. As a result, a direct comparison between the Flemish and the Belgian ISEW is difficult. In order to increase the comparability of both studies, the ISEW for Flanders was recompiled using the methodology of the ISEW for Belgium. The results of this exercise are presented here.
Four adjustments are made to the methodology of the Flemish ISEW. First, the value of household labor is estimated by multiplying the time spent on household labor by the number of people aged between 16 and 75, instead of those aged between 18 and 75 (as was done in Section 3). Next, both the costs of water pollution and air pollution were estimated using the valuation methods outlined in the Belgian ISEW methodology. The point estimate for water pollution was taken from the US ISEW [8], while the marginal social costs of air pollutant emissions were taken from Jackson et al. [30]. Finally, the costs of climate change in Flanders were estimated using cumulative emissions since 1900 and the lower marginal social cost estimate by Fankhauser [40].
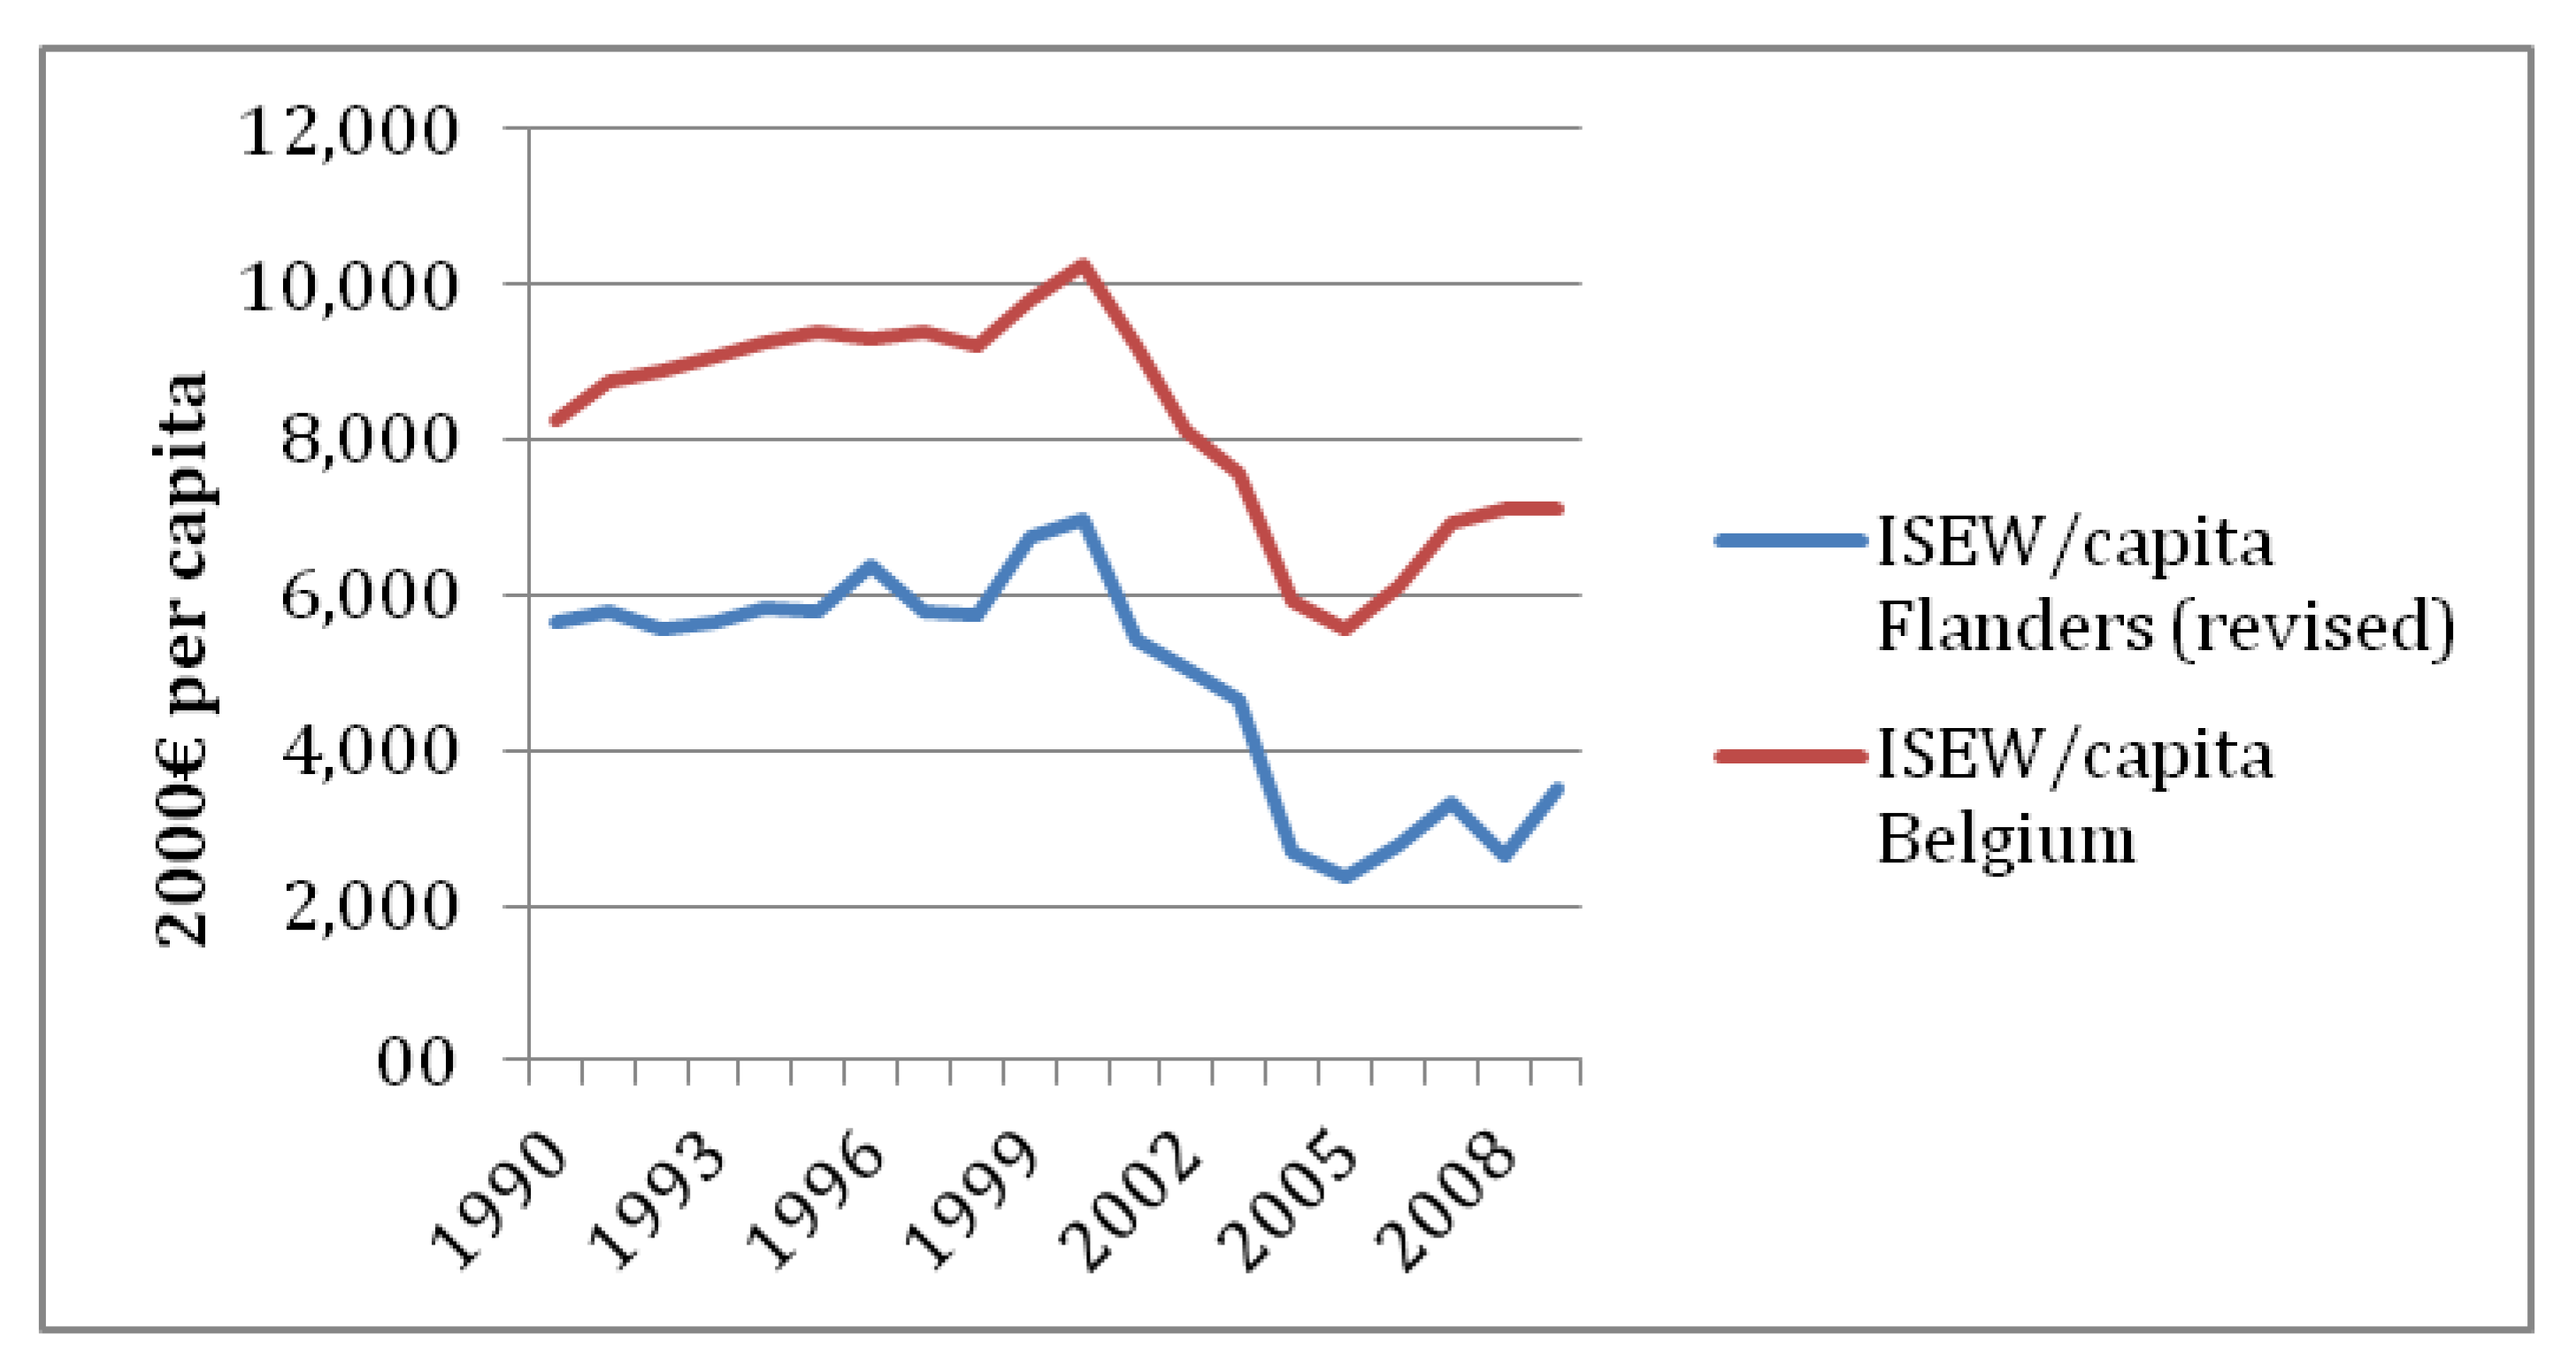
Figure 4 presents the recalculated ISEW for Flanders and the ISEW for Belgium for the period 1990–2009 (expressed in per capita terms). It shows that, although there is a difference in absolute terms, both indices reveal a similar trend over time in the levels of sustainable economic welfare registered in Flanders and in Belgium. The difference in absolute values is caused by differences in the underlying data series—these can be either real differences or differences imposed by data sources—and not by differences in valuation methods. The estimated private consumption expenditures in Flanders are on average 12% lower than those in Belgium, yet the estimates for Belgium are taken from the System of National Accounts, while those for Flanders are derived from household budget surveys. Next, a number of cost items in the ISEW are higher in Flanders than in Belgium: the costs of air pollution in Flanders are on average 25% higher, the depletion of natural capital is 11% higher and the estimated costs of climate change are 38% higher. These differences reflect either real differences (e.g., the emissions of air pollutants per capita in Flanders is higher than in Belgium) or differences in data sources. When different data sources are used, it is difficult to determine the extent to which the observed differences between estimates for Flanders and for Belgium are caused by this problem. Workgroups at different levels are looking into the possibility of coming up with comparable data for a number of ISEW items (e.g., the workgroup at the National Bank of Belgium is looking at the regional accounts mentioned in Section 3.2—column B).
Given the differences in the underlying data series, it is difficult to directly compare the ISEW for Flanders with the ISEW for Belgium. We cannot conclude here that the level of sustainable economic welfare in Flanders is lower than in Belgium. As a result, it is not possible to verify the hypothesis of Posner and Costanza (see Section 2.3.1). Both ISEW studies can, however, be used on their own, given the high level of consistency in their methodology and in the data series used. Both studies point at a drop in economic welfare in the period 2000–2005 caused by a deterioration of the net international investment position of Belgium, an increase in the costs of environmental degradation, increased replacement costs of the consumption of non-renewable energy resources and a more unequal distribution of incomes.
Figure 4.
The ISEW per capita for Flanders and Belgium (in €/capita – 2000 prices).

4.2.2. Neighboring Countries
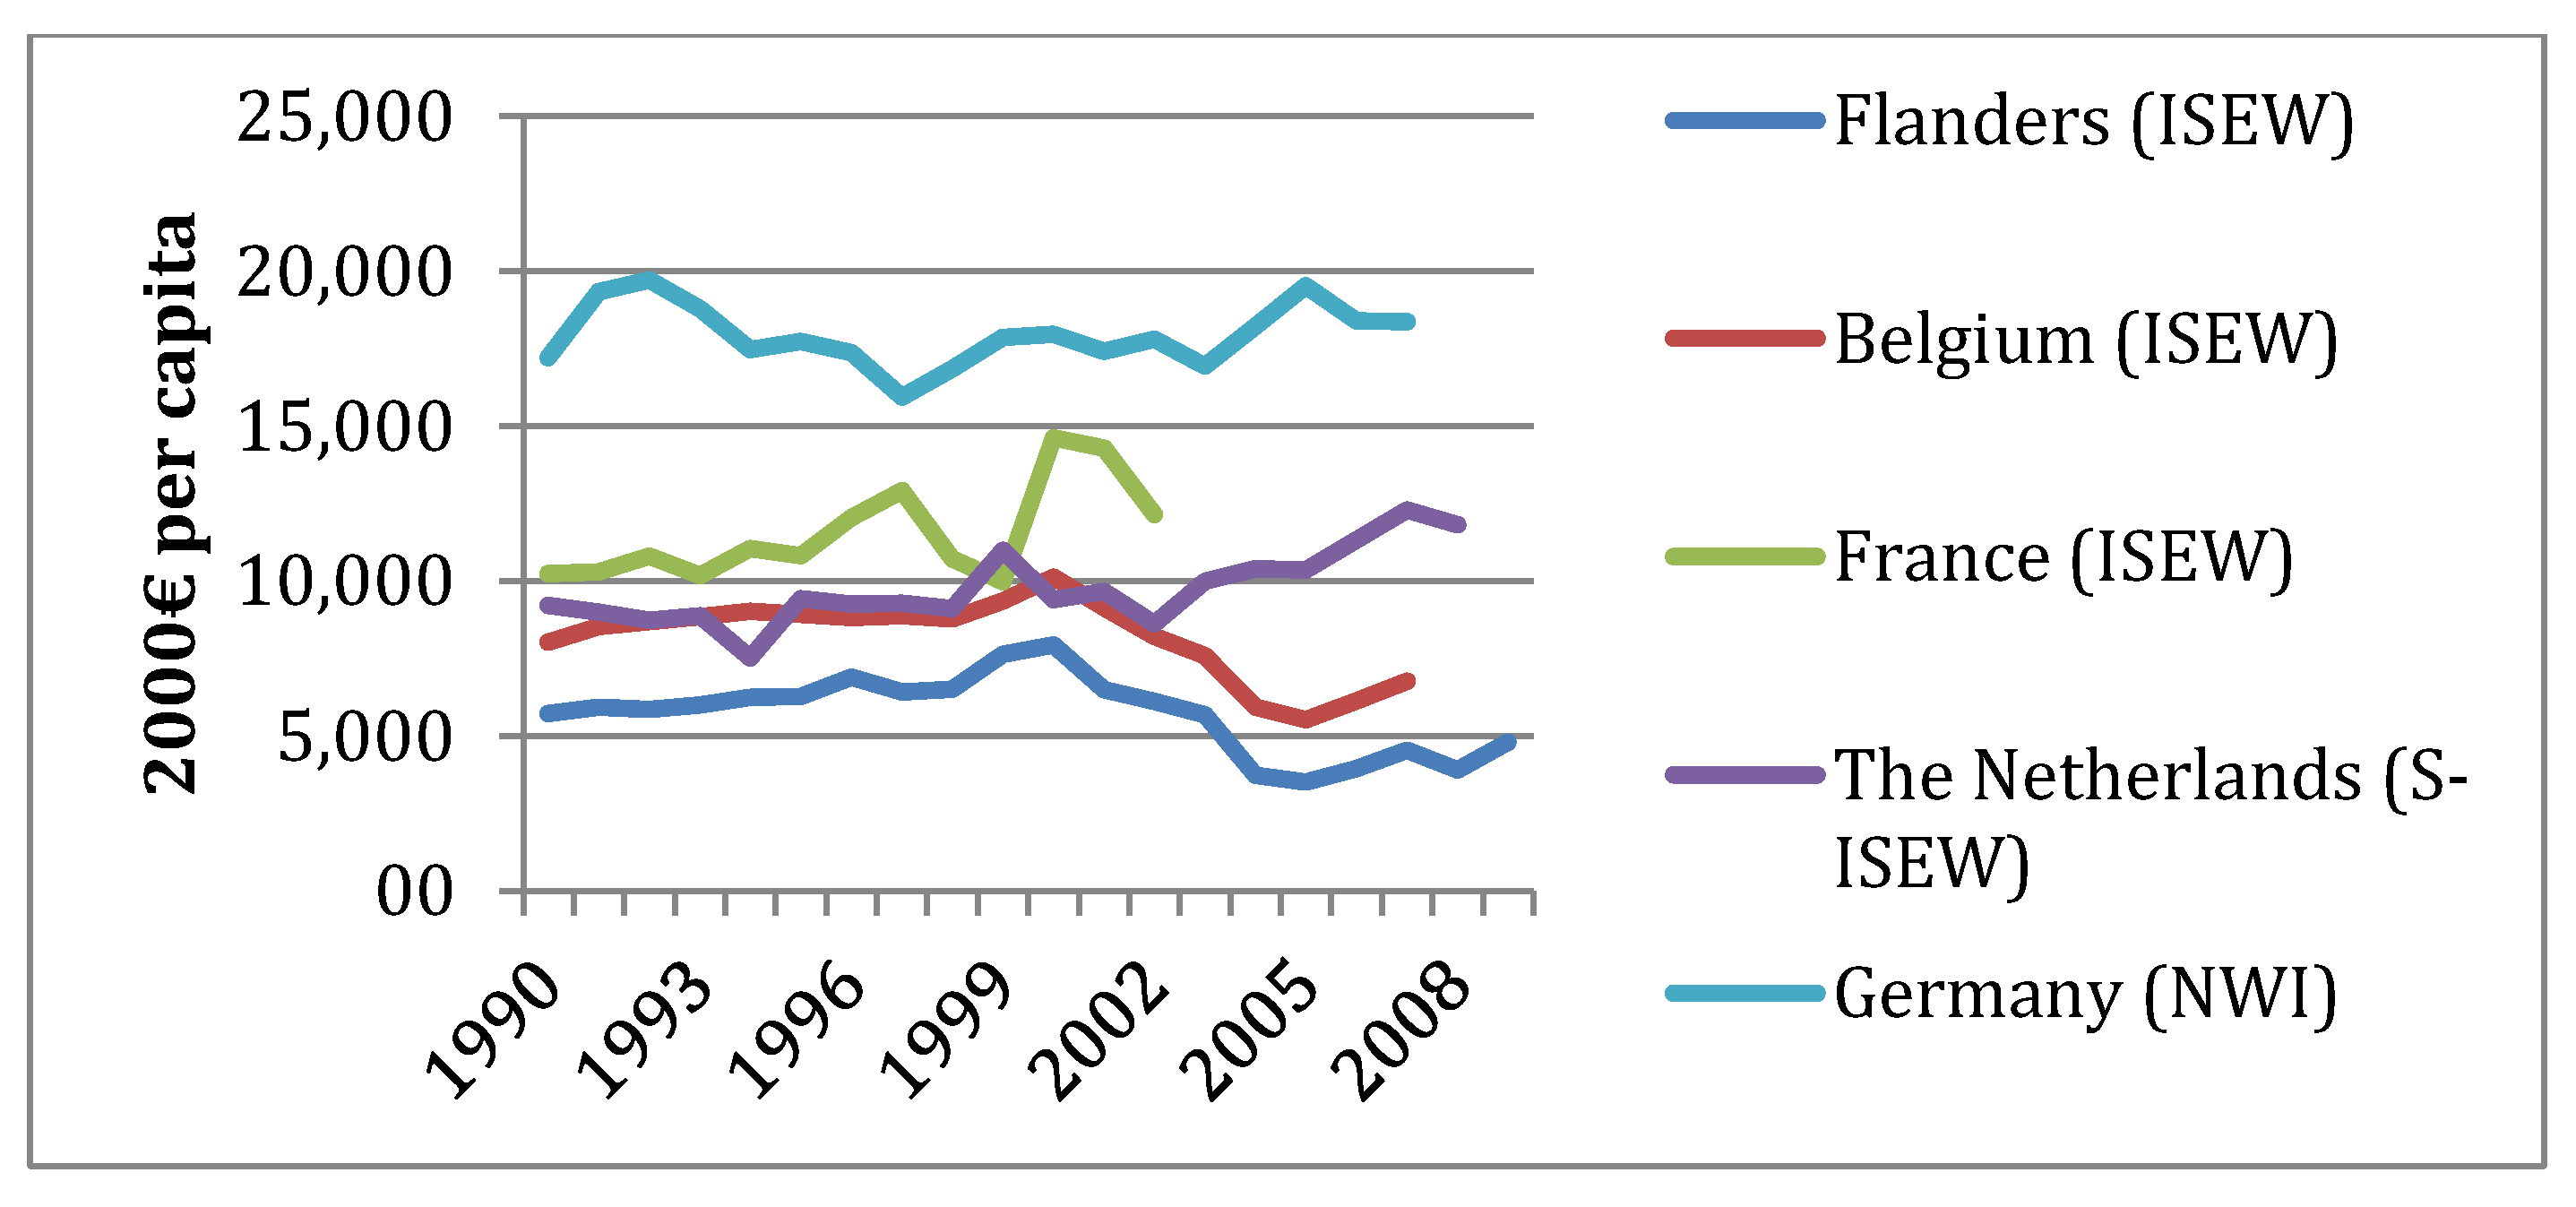
Comparing the ISEW for Flanders with the index for other countries or regions is difficult. Both the differences in the methodology used (list of items and valuation methods) and differences in the time series hamper a direct comparison between ISEW compilations. However, general evolutions over time and underlying reasons that explain these evolutions can be compared. In this section, the Flemish ISEW will be compared with the ISEW for France [44], the Simplified ISEW for the Netherlands [45] and the National Welfare Index (NWI), another variant of the ISEW, for Germany [46]. Figure 5 presents the results of the different studies on alternative measures of economic welfare in these countries. Given the methodological differences between the studies, it is not possible to directly compare the estimates—one cannot say that the level of economic welfare in Germany is about three times as high as in Flanders, as a substantial part of the observed discrepancy is due to differences in the methodologies used in both studies. However, Figure 5 does allow exploring changes over time in economic welfare in the different countries individually.
Evidence for the neighboring countries shows that economic growth does not fully contribute to the level of economic welfare. The distance between the ISEW per capita (or NWI per capita for Germany) and the GDP per capita increases in all three neighboring countries, although the increase is different in all countries. The drop in the level of sustainable economic welfare is highest in Flanders. In Section 4.1, it was shown that the main reason for this drop in economic welfare in Flanders was the deterioration of Belgium’s net international investment position (NIIP). In the neighboring countries, the fluctuations in the NIIP are also the main driver of the trend over time of the ISEW (or NWI). For a smaller country, international trade is often more important than for bigger countries (in % of total economic activities), so that the impact of changes in the NIIP on the trend over time of the ISEW is likely to be greater in these countries (e.g., Belgium). It should be stressed here again that the net international investment position of Belgium is positive, which indicates that Belgium holds more external financial assets than it has liabilities. As a result, the worsening of the international position that caused the ISEW for Belgium and Flanders to decline in the early 2000s does not need to be alarming. For some of the neighboring countries, the situation is different. Germany, for instance, has a negative NIIP, so that a worsening of this position effectively undermines the future economic welfare of the country.
Figure 5.
Measures of Economic Welfare for Flanders, Belgium and neighboring countries (in €/capita–2000 prices).
Figure 5.
Measures of Economic Welfare for Flanders, Belgium and neighboring countries (in €/capita–2000 prices).

All ISEW studies in neighboring countries point to increases in social and ecological costs of economic activities that outweigh the benefits of these activities. In all neighboring countries, rising costs of environmental degradation, an increased rate of natural capital depletion and growing welfare losses from income inequalities are reported.
4.3. Discussion
A few words of caution on the use of the ISEW are at place here. The valuation methods of a number of items in the index have been contested in the past. For instance, a researcher has to choose between a number of options when estimating the costs of climate change: should he or she look at the impact of past emissions on the current level of well-being, should he or she look at the impact of the current emissions on future generations or should he or she include both? Next, the valuation method used to estimate the depletion of natural capital in the ISEW has also attracted criticism. Currently, the annual consumption of non-renewable energy resources is valued at a replacement cost that increases at a rate of 3% a year. This fixed escalation factor causes the estimated costs of natural capital depletion to increase exponentially and does not allow for technological improvement nor for the actual changes in non-renewable energy use. Finally, the use of cumulative emissions in the valuation of both the costs of climate change and of ozone layer depletion is often contested. Using cumulative emissions of CFCs, for instance, implies that the costs of ozone layer depletion are never decreasing and a post-Montreal Protocol world in which the ozone concentrations in the lower stratosphere over Antarctica is expected to return to pre-1980 levels by about 2060–2075 [47]. In 2009, the costs of ozone layer depletion constituted about 28.7% of the total long-term costs of environmental degradation. It is clear that the ISEW could benefit from a clear and theoretically better supported set of valuation methods that draw from recent research efforts. In this paper, a number of very recent studies on cost estimates for water and air pollution were used that were specifically set up for the Flemish region. These estimates indicate that newer valuation methods have been made available that contribute to the overall value of the index.
A second problem with using the ISEW is that it is difficult to compare the results of ISEW compilations in different countries due to problems with data availability and personal choices from the researchers in the compilations. This lack of comparability underlines the need for a widely accepted and internationally agreed upon methodology for the ISEW. In this methodology, a number of updated valuation methods should be included, so that the monetary estimates in the index are made according to the latest available data and techniques. The process to arrive at such an updated methodology has been started. This study makes a contribution to this process by exploring new valuation methods for both the costs of water pollution and air pollution. When a standardized methodology is agreed upon, the ISEW can be compiled for a series of countries or regions, allowing for a meaningful comparison of the results.
When the ISEW was first put forward by Daly and Cobb [8], the items included in the index were mostly taken from the different critiques on GDP as a poor indicator of economic welfare. A theoretical foundation of the index was not established until fourteen years later; Lawn [4] used the income concept of Fisher—income as a psychic stream of services in the mind of individuals. Lawn put in a great effort to point out that almost all ISEW items fitted well into this theoretical foundation. When revising the ISEW methodology, the theoretical foundation of the index should be put at the center of the discussion, as properly separating capital stocks and flows of services can help to overcome some of the methodological inconsistencies pointed out by ISEW critics [25]. Lawn [4] alluded to the fact that the ‘net capital growth’ item (NCG) did not fit well into the income concept of Fisher, arguing that additions to the stock of human-made capital should not be regarded as income and dropping the item in subsequent GPI studies (e.g., [13]). Bleys [25] went one step further and argued that also the “changes in the net international investment position (NIIP)” item should be dropped from the index. He argued that if one wishes to investigate the long-term financial self-reliance of a country, one should look at the actual NIIP itself and not at the annual changes in this stock. Using these changes in the NIIP could be misleading, as for countries with a decreasing, but positive, NIIP, the ISEW is adjusted downwards, while these countries have no foreign debt at all. Also, for smaller countries with a relatively open economy, such as Belgium, the NIIP item as currently employed has a significant and even overwhelming impact on the overall evolution of the index. Many regional studies drop the “changes in NIIP” item, as the meaning of NIIP becomes obscured at the regional level (e.g., [18]).
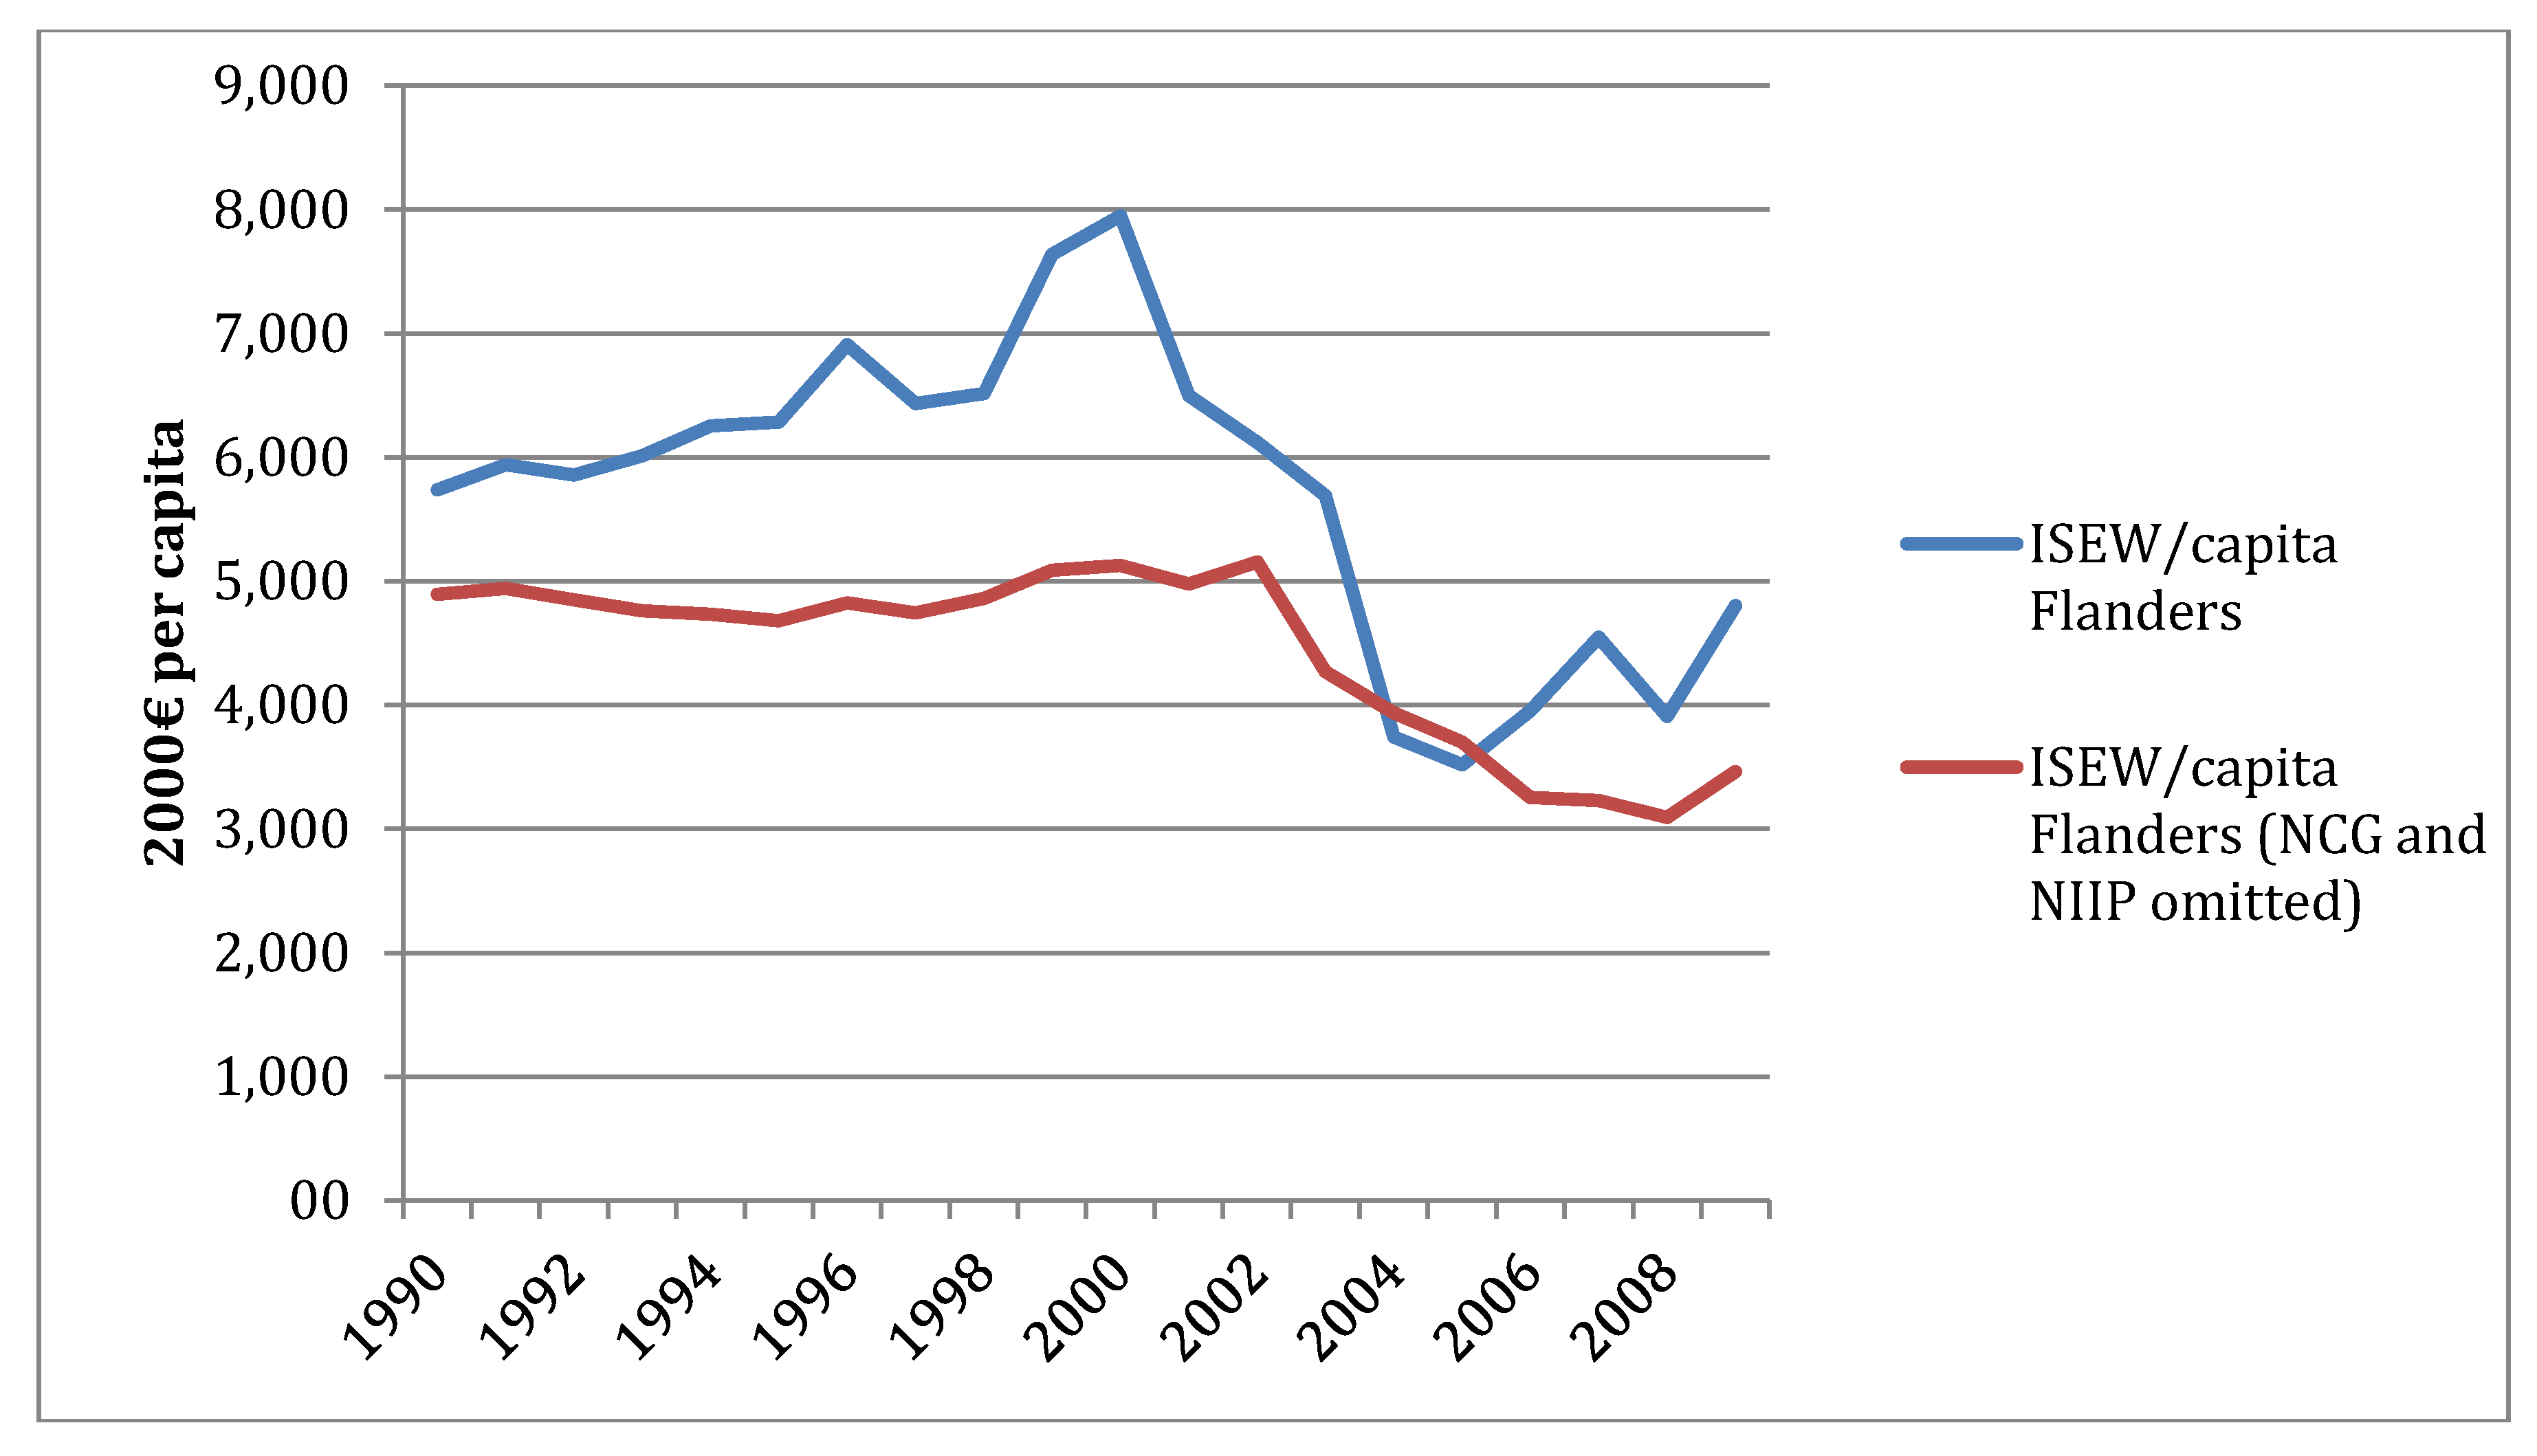
Figure 6 depicts the impact of dropping both the “net capital growth” and the “changes in the net international investment position” items from the Flemish ISEW. The impact of the omissions is significant: the maximum difference between the original ISEW and the adjusted ISEW is about €3,000/capita (in 2000 prices). The “adjusted” ISEW for Flanders starts to decline in 2002 due to increasing welfare losses from income inequality and rising costs of climate change.
Figure 6.
Omitting the net capital growth (NCG) and changes in net international investment position (NIIP) items from the ISEW for Flanders.
Figure 6.
Omitting the net capital growth (NCG) and changes in net international investment position (NIIP) items from the ISEW for Flanders.

5. Conclusions
The ISEW for Flanders that is calculated in this paper shows that the level of sustainable economic welfare in the region did not increase between 1990–2009. When the study period is divided into smaller time frames, one can clearly identify the period between 2000 and 2005 to be responsible for the overall decline in economic welfare. The drop of the ISEW in this period is caused by a deterioration of the net international investment position of Belgium (which is divided over the different regions in the country on a per capita basis) and by an increase in the income inequalities in Flanders. To a lesser extent, the increase of the environmental costs (climate change and the use of non-renewable energy resources) also contributed to the drop of the ISEW per capita. In the last four years of the study period, the level of sustainable economic welfare in the Flemish region started to rise again, even in 2008 and 2009 during the economic recession.
The trend over time of the ISEW in Flanders is quite different from the trend over time of the Gross Regional Product (GRP). The ISEW looks beyond the value of market transactions and takes into account non-market activities, such as household labor, the distribution of incomes and the environmental impact of production and consumption. As a result, the ISEW can be stimulated using a wide range of policy measures: reducing pollution levels, striving for a more equal distribution of incomes, increasing government expenditures on health and education or switching towards a cleaner energy production system. The system approach of the ISEW is one of the main benefits of the index over GDP.
The ISEW for Flanders was recently picked up as a headline indicator for the Pact 2020 of the Flemish government [48]. This Pact 2020 sets goals for the region to achieve by 2020: Flanders wants to excel as an innovative, sustainable and social society by that time. The Pact 2020 is translated into a more tangible “Flanders in Action” (Vlaanderen in Actie [49]) project. Other headline indicators for Pact2020 include GDP per capita, the cost of labor, labor productivity, the share of added value created by the industry and a number of competitiveness and investment indicators.
In Pact 2020, the ISEW is used specifically to monitor the progress made by the Flemish economy towards a competitive and polyvalent knowledge economy that generates welfare in a sustainable way. The official goal included in Pact 2020 is to increase the ISEW for Flanders, yet no formal targets are set for 2020. The extent to which the ISEW for Flanders will impact on regional policy-making remains to be seen, but the inclusion of the index as a headline indicator in Pact 2020 is an important step forward. It opens up the possibility to validate policy options with tools that look further than GDP.
Acknowledgments
The research described was ordered and financed by the Flemish Environment Agency (VMM) in the framework of Flanders Environmental Reporting (MIRA). I would like to thank Nathalie Dewolf at MIRA (VMM) for the coordination of the project on the ISEW for Flanders and all other members of the scientific committee (Sara Ochelen, Kim Creminger and Dieter Braekeveld) for their useful comments on the compilation of the index. I am also indebted to two anonymous reviewers for their useful notes on both the compilation and the text.
Conflict of Interest
The author declares no conflict of interest.
References and Notes
- Stiglitz, J.; Sen, A.; Fitoussi, J.-P. Report by the Commission on the Measurement of Economic Performance and Social Progress. 2009. Available online: http://www.stiglitz-sen-fitoussi.fr/ (accessed on 12 December 2012).
- Bleys, B. De Index voor Duurzame Economische Welvaart (ISEW) voor Vlaanderen, 1990–2009 (in Dutch), study carried out for the Vlaamse Milieumaatschappij, MIRA, MIRA/2012/04; Hogeschool Gent. Vlaamse Milieumaatschappij: Mechelen, Belgium, 2011. [Google Scholar]
- Bleys, B. Beyond GDP: Classifying Alternative Measures for Progress. Soc. Indic. Res. 2012, 109, 355–377. [Google Scholar]
- Lawn, P. A Theoretical Foundation to Support the Index of Sustainable Economic Welfare (ISEW), Genuine Progress Indicator (GPI), and Other Related Indexes. Ecol. Econ. 2003, 44, 105–118. [Google Scholar] [CrossRef]
- Costanza, R.; Farley, J.; Templet, P. Background: Quality of Life and the Distribution of Wealth and Resources. In Understanding and Solving Environmental Problems in the 21st Century: Toward a New, Integrated Hard Problem Science; Costanza, R., Jorgensen, S., Eds.; Elsvier: Amsterdam, the Netherlands, 2002; pp. 221–258. [Google Scholar]
- Hicks, J. Value and Capital; Clarendon Press: Oxford, UK, 1939. [Google Scholar]
- Fisher, I. The Nature of Capital and Income; Kelley: New York, NY, USA, 1906. [Google Scholar]
- Daly, H.; Cobb, J. For the Common Good: Redirecting the Economy toward Community, the Environment and a Sustainable Future; Beacon Press: Boston, MA, USA, 1989. [Google Scholar]
- Lawn, P.; Sanders, R. Has Australia Surpassed its Optimal Macro-Economic Scale? Finding Out with the Aid of “Benefit” and “Cost” Accounts and a Sustainable Net Benefit Index. Ecol. Econ. 1999, 28, 213–229. [Google Scholar]
- Posner, S.; Costanza, R. A Summary of ISEW and GPI Studies at Multiple Scales and New Estimates for Baltimore City, Baltimore County, and the State of Maryland. Ecol. Econ. 2011, 70, 1972–1980. [Google Scholar]
- Max-Neef, M. Economic Growth and Quality of Life: A Threshold Hypothesis. Ecol. Econ. 1995, 15, 115–118. [Google Scholar]
- Pulselli, F.; Bravi, M.; Tiezzi, E. Application and use of the ISEW for assessing the sustainability of a regional system: A case study in Italy. J. Econ. Behav. Organ. 2012, 81, 766–778. [Google Scholar] [CrossRef]
- Lawn, P.; Clarke, M. Comparing Victoria’s Genuine Progress with that of the Rest of Australia. J. Econ. Soc. Pol. 2006, 10, 115–138. [Google Scholar]
- Pannozzo, L.; Colman, R.; Ayer, N.; Charles, T.; Burbidge, C.; Sawyer, D.; Stiebert, S.; Savelson, A.; Dodds, C. The 2008 Nova Scotia Genuine Progress Index; GPI Atlantic: Glen Haven, Canada, 2008. [Google Scholar]
- Anielski, M.; Johannessen, H. The Edmonton 2008 Genuine Progress Indicator Report; Anielski Management: Edmonton, Canada, 2009. [Google Scholar]
- Wen, Z.; Zhang, K.; Du, B.; Li, Y.; Li, W. Case Study on the Use of Genuine Progress Indicator to Measure Urban Economic Welfare in China. Ecol. Econ. 2008, 63, 463–475. [Google Scholar]
- Hoffren, J. Measuring Sustainable Well-being on Sub-national Level with Genuine Progress Indicator (GPI) in Finland; Regional Council of Päijät Häme and Joint Authority of Kainuu Region: Finland, 2011. Available online: http://freshproject.eu/fresh-downloads/good-practice-reports.html/ (accessed on 7 November 2012).
- Pulselli, F.; Ciampalini, F.; Tiezzi, E.; Zappia, C. The Index of Sustainable Economic Welfare (ISEW) for a Local Authority: A Case Study in Italy. Ecol. Econ. 2006, 60, 271–281. [Google Scholar] [CrossRef]
- Jackson, T.; McBride, N.; Abdallah, S.; Marks, N. Measuring Regional Progress: Regional Index of Sustainable Economic Welfare (R-ISEW) for all the English Regions; New Economics Foundation: London, UK, 2008. [Google Scholar]
- Bagstad, K.; Shammin, M. The genuine progress indicator as a measure of regional economic welfare: a case study for northeast ohio. Ecol. Indic. 2012, 18, 330–341. [Google Scholar]
- Posner, S. Estimating the Genuine Progress Indicator for Baltimore. M.Sc. Thesis, University of Vermont, Burlington, VT, USA, 2010. [Google Scholar]
- Berik, G.; Gaddis, E. The utah genuine progress indicator (gpi),1990 to 2007: A report to the people of utah, 2011. Available online: http://www.utahpop.org/gpi.html (accessed on 9 December 2012).
- Clarke, M.; Lawn, P. Is Measuring Genuine Progress at the Sub-National Level Useful? Ecol. Indic. 2008, 8, 573–581. [Google Scholar]
- Costanza, R.; Erickson, J.; Fligger, K.; Adams, A.; Adams, C.; Altschuler, B.; Balter, S.; Fisher, B.; Hike, J.; Kelly, J.; et al. Estimates of the genuine progress indicator (gpi) for vermont, chittendon county, and burlington from 1950 to 2000. Ecol. Econ. 2004, 51, 139–155. [Google Scholar]
- Bleys, B. Proposed changes to the index of sustainable economic welfare: An application to belgium. Ecol. Econ. 2008, 64, 741–751. [Google Scholar] [CrossRef]
- Bagstad, K.; Ceroni, M. opportunities and challenges in applying the genuine progress indicator/index of sustainable economic welfare at local scales. IJEWE 2007, 3, 132–153. [Google Scholar] [CrossRef]
- Bleys, B. Beyond GDP: The Index of Sustainable Economic Welfare.
- Atkinson, A. The Economics of Inequality; Oxford University Press: Oxford, UK, 1975. [Google Scholar]
- Cowell, F.; Gardiner, K. Welfare Weights; STICERD Working Paper; London School of Economics: London, UK, 1999. [Google Scholar]
- Jackson, T.; Marks, N.; Ralls, J.; Stymne, S. Sustainable Ecomonic Welfare in the UK, 1950–1996; New Economics Foundation: London, UK, 1997. [Google Scholar]
- Glorieux, I.; Moens, M.; Koelet, S.; Coppens, K. Tijdsbesteding in Vlaanderen 1988–1999 (in Dutch). TOR 2001/16; TOR Research Group: Vrije Universiteit Brussel, Brussels, Belgium, 2001. [Google Scholar]
- Glorieux, I.; Minnen, J.; Vandeweyer, J. De Tijd Staat Niet Stil - Veranderingen in de Tijdsbesteding van Vlamingen tussen 1999 en 2000 (in Dutch). 2005/25; TOR Research Group: Vrije Universiteit Brussel, Brussels, Belgium, 2005. [Google Scholar]
- Cobb, C.; Cobb, J. The Green National Product: A Proposed Index of Sustainable Economic Welfare; University Press of America: Lanham, MD, USA, 1994. [Google Scholar]
- ICF Consulting, Costs-Benefit Analysis of Road Safety Improvements; ICF Consulting: London, UK, 2003.
- Transport & Mobility Leuven, Verkeersindices: Congestie- en Milieukosten (in Dutch); Transport & Mobility Leuven: Leuven, Belgium, 2002.
- De Nocker, L.; Broekx, S.; Liekens, I. Economische Waardering van Verbetering Ecologische Toestand Oppervlaktewater op basis van Onderzoeksresultaten uit Aquamoney, 2011/RMA/R/248; VITO: Mol, Belgium, 2011. [Google Scholar]
- De Nocker, L.; Michiels, H.; Deutsch, F.; Lefebvre, W.; Buekers, J.; Torfs, R. Actualisering van de Externe Milieuschadekosten (algemeen voor Vlaanderen) met betrekking tot Luchtverontreiniging en Klimaatverandering, study carried out for the Vlaamse Milieumaatschappij, MIRA, MIRA/2010/03; VITO: Mol, Belgium, 2010. [Google Scholar]
- Goedseels, V.; de Somer, P. Van Akker naar Markt: een Halve Eeuw Productie en Commercialisatie in de Belgische Landbouw (in Dutch); Nationale Dienst voor Afzet van Land-en Tuinbouwprodukten: Brussels, Belgium, 1988. [Google Scholar]
- Clarkson, R.; Deyes, K. Estimating the Social Cost of Carbon Emissions; Department of Environment, Food and Rural Affairs: London, UK, 2002. [Google Scholar]
- Fankhauser, S. The social cost of greenhouse gas emissions: an expected value approach. Energy J. 1994, 15, 157–184. [Google Scholar]
- Talberth, J.; Cobb, C.; Slattery, N. The Genuine Progress Indicator 2006; Redefining Progress: Oakland, CA, USA, 2007. [Google Scholar]
- IPCC-Intergovernmental Panel on Climate Change, Climate Change 2001. The Scientific Basis; Cambridge University Press: Cambridge, UK, 2001.
- Jackson, T.; Stymne, S. Sustainable Economic Welfare in Sweden: A Pilot Index 1950–1992; Stockholm Environmental Institute: Stockholm, Sweden, 1996. [Google Scholar]
- Nourry, M. Measuring sustainable development: some empirical evidence for france from eight alternative indicators. Ecol. Econ. 2008, 67, 441–456. [Google Scholar] [CrossRef]
- Bleys, B. Simplifying the ISEW: Methodology, data sources and a case study for the Netherlands. IJEWE 2007, 3, 103–118. [Google Scholar] [CrossRef]
- Diefenbacher, H.; Zieschank, R. Measuring Welfare in Germany-A Suggestion for a New Welfare Index. Environmental Research of the Federal Ministry of the Environment, Nature Conservation and Nuclear Safety-Project No. (FKZ) 3707 11 101/01; Federal Environment Agency (Umweltbundesamt): Dessau-Roßlau, Germany, 2010. [Google Scholar]
- US EPA, Achievements in Stratospheric Ozone Protection—Progress Report; Office of Air and Radiation-United States Environmental Protection Agency: Washington, DC, USA, 2007.
- DAR/SVR, Pact 2020: Kernindicatoren Meting 2012 (in Dutch); Diensten voor het Algemeen Regeringsbeleid Studiedienst van de Vlaamse Regering: Brussels, Belgium, 2012.
- Vlaanderen In Actie Pact 2020. Available online: http://www.vlaandereninactie.be/ (accessed on 21 December 2012).
© 2013 by the authors; licensee MDPI, Basel, Switzerland. This article is an open access article distributed under the terms and conditions of the Creative Commons Attribution license (http://creativecommons.org/licenses/by/3.0/).
Share and Cite
MDPI and ACS Style
Bleys, B. The Regional Index of Sustainable Economic Welfare for Flanders, Belgium. Sustainability 2013, 5, 496-523. https://doi.org/10.3390/su5020496
AMA Style
Bleys B. The Regional Index of Sustainable Economic Welfare for Flanders, Belgium. Sustainability. 2013; 5(2):496-523. https://doi.org/10.3390/su5020496
Chicago/Turabian StyleBleys, Brent. 2013. "The Regional Index of Sustainable Economic Welfare for Flanders, Belgium" Sustainability 5, no. 2: 496-523. https://doi.org/10.3390/su5020496