Review

An Integrated Model Based on a Hierarchical Indices System for Monitoring and Evaluating Urban Sustainability

1
Department of Geography and Planning, University of Saskatchewan, Saskatoon, SK S7N5C8, Canada
2
Sustainable Cities International, West Hastings Street, Vancouver, V6B1G8, Canada
*
Author to whom correspondence should be addressed.
Sustainability 2013, 5(2), 524-559; https://doi.org/10.3390/su5020524
Submission received: 21 October 2012 / Revised: 24 January 2013 / Accepted: 25 January 2013 / Published: 1 February 2013

Abstract

:
Over 50% of world’s population presently resides in cities, and this number is expected to rise to ~70% by 2050. Increasing urbanization problems including population growth, urban sprawl, land use change, unemployment, and environmental degradation, have markedly impacted urban residents’ Quality of Life (QOL). Therefore, urban sustainability and its measurement have gained increasing attention from administrators, urban planners, and scientific communities throughout the world with respect to improving urban development and human well-being. The widely accepted definition of urban sustainability emphasizes the balancing development of three primary domains (urban economy, society, and environment). This article attempts to improve the aforementioned definition of urban sustainability by incorporating a human well-being dimension. Major problems identified in existing urban sustainability indicator (USI) models include a weak integration of potential indicators, poor measurement and quantification, and insufficient spatial-temporal analysis. To tackle these challenges an integrated USI model based on a hierarchical indices system was established for monitoring and evaluating urban sustainability. This model can be performed by quantifying indicators using both traditional statistical approaches and advanced geomatic techniques based on satellite imagery and census data, which aims to provide a theoretical basis for a comprehensive assessment of urban sustainability from a spatial-temporal perspective.

1. Introduction

Approximately 50% of the world’s populations reside in cities, and the United Nations Population Fund reports that 60% will be living in urban areas by the year 2025; by 2050, this percentage will rise to 70% [1,2]. Global urbanization will become a critical issue associated with human development over the course of the 21th century [3]. Urban area, as a complex system, is closely associated with, and considerably dependent upon, other broader systems at regional and global levels for resource input and waste output [4]. Therefore, it is of great significance to focus on the process of urban development in order to improve urban system itself and other related systems.
Since the concept of sustainable development was first put forward in the well-known report Our Common Future in 1987 by the UN World Commission on Environment and Development (the Brundtland Commission) [5], urban sustainability emerged thereafter and gained increasing popularity by governments, administrators, urban planners, and scientific communities in North America, Europe, and the Asian Pacific Region [6,7,8,9,10]. Although there are a number of diverse definitions of urban sustainability by different communities in different areas concerning their own different situations, the core value of urban sustainability always lies in the balance of environmental, economic, and social development.
To date, accelerating urbanization problems including urban sprawl, land cover change, land use change, and environmental degradation within the complex urban system have impacted residents’ Quality of Life (QOL) and threatened the goal of sustainable development. Nevertheless, monitoring and evaluating urban sustainability, as well as investigating the influence of urbanization on QOL, is still in its infancy due to a lack of an integrated urban sustainability indicator model based on a comprehensive interpretation of urban sustainability. In addition, the urban sustainability indicators (USIs) found in previous frameworks have limitations due to poor measurements and quantification which make it difficult to compare the results. In regards to spatial-temporal analysis and information extraction functions, remote sensing (RS) and Geographic Information Systems (GIS) have become powerful tools and data sources for discovering the spatial-temporal process of urbanization, the quantitative distribution of QOL and their interrelationships. It is of great urgency and necessity to explore those approaches and sources of data for monitoring and assessing urban sustainability more efficiently.
The present review summarizes the universally accepted interpretations of urban sustainability as well as their indicator systems. It also discusses three important domains (urbanization, urban environment, and QOL) closely linked with urban sustainability and the available methods for USI measurements. To overcome the limitations found in previous studies, we attempt to provide a comprehensive understanding of urban sustainability by incorporating different domains into one holistic definition. A potential integrated model is established based on a hierarchical system for monitoring and evaluating urban sustainability. The USIs in the proposed model can be quantified by applying both traditional statistical approaches and advanced geomatic techniques (remote sensing and GIS) to satellite imagery and census data from a spatial-temporal perspective. This study is intended to provide a theoretical basis as well as practical methodologies for future research and decision making on urban sustainability.

2. Current Challenges and Opportunities in the Development of USI Models

2.1. Development of Urban Sustainability Indicator (USI) Models

Urban sustainability can be considered as both a desirable goal and an ongoing process [11]. Although over 80 definitions concerning different circumstances can be found in related literature from diverse disciplines, the widely accepted interpretation of urban sustainability always emphasizes balancing development in three primary domains: urban economy, society, and environment [5,12]. Overall, the definition of urban sustainability can be divided into two categories, holistic and narrow. The former highlights the general status of urban development with an offset view of different domains while the latter focuses more on one or two relevant domains concerning different circumstances. Accordingly, USIs as “parameters or values derived from parameters” are developed to form different USI models for quantitatively measuring and evaluating urban sustainability from both the holistic and narrow perspectives [13,14,15,16,17,18,19,20,21,22,23,24,25].
To systematically monitor and assess urban development progress towards sustainability, previous studies have described step by step procedures for developing USI models [13,26]. First of all, an unambiguous interpretation of urban sustainability is required to provide the overall direction of the USI system. Establishing a suitable framework and defining a set of selection criteria are deemed two essential steps in this whole process [27]. Based on the previously accepted indicator selection criteria of specific domains concerning sustainability (e.g., social indicators, urban indicators, and environmental indicators) listed by [13] and the fundamental requirements suggested by [15,21,27,28], we summarized a more general set of six standards (clearly defined and scientifically representable, responsive to target goals and audience, data available, numerically measurable, spatially and temporally comparable, and cost-effective) with the most consensuses to fit the selection of USIs. These USIs are supposed to characterize the relevant phenomena or aspects of urban development very well and be informative to the public in a spatial-temporal dynamic pattern. They should also be easily quantified with available measurement data in an acceptable expense.
According to the identified selection criteria, a preliminary list of possible urban sustainability indicators are supposed to be proposed based on specialized knowledge as well as the suggestions from other stakeholders (general public or policy makers). Then both equal and unequal weighting of the importance of identified selection criteria can be used to evaluate each proposed initial indicator. This indicator evaluation process can be based on the one-step procedure, a sequential procedure, or a hybrid procedure summarized by [26]. The specific goal for local development and adopted methodologies may also contribute to adding to or reducing from the original indicator set. Finally, after the selection of final indicators for the USI system, the effectiveness of this system should be tested in real case studies for evaluating urban sustainability [29].

2.2. Problems and Opportunities in Current USI Models

Currently established USI models include “Sustainable Seattle indicators” [23], “Hamilton-Wentworth Indicators” [30], “British Columbia State of Sustainability Indicators” [16], “Taipei’s sustainability index” [31], and “London’s urban sustainability indicators” [32]. However, several limitations can be found in these USI models.
Firstly, efficient USI models are supposed to reflect inter-generational equity (future generation and current generation), intra-generational equity (social equity and geographical equity), ecological equity (species conservation, minimizing environmental impact, and efficient resources use), and human well-being [13,14]. Assessing inter-generational equity requires temporal tracking over periods based on the same evaluation standard, while monitoring intra-generational equity needs spatial comparison among geographical areas at different levels (international, national, regional, urban, neighbourhood). However, the current USIs normally measured by traditional census or tabular data cannot easily provide such temporal and spatial pattern of urban sustainability change. To this point, lacking spatial and temporal analysis can be identified as a dominant limitation of current USIs.
For the measurement and quantification of USIs, it is difficult to collect the expected census data by conducting social surveys which are time-consuming, expensive, and labor-intensive. In most USI models, the census data collected for quantifying USIs are commonly objective data merely indicative of the physical status or socioeconomic conditions of urban development. Subjective data (e.g., people’s perceptions, feeling, and sense) is almost ignored. This is likely due to the increased difficulty in acquiring such data which involves face-to-face interviews, detailed questionnaire design, collaborations with multiple agencies, and ethics approvals. However, as principle participants in urban activities, urban residents’ living experience and perspectives impact and in turn are impacted by urban development in an interactive manner. Most current USI models highly dependent on census data lack such encompassing measurement and quantification from both objective and subjective aspects, which can degrade the accuracy of urban sustainability monitoring and also hamper the investigation of linkages between indicators in different domains.
Another shortage in existing USIs lies in the weak integration of possible indicators from different domains to provide a comprehensive understanding of urban development. Maclaren argued that multiple indicators are required to measure the multiple dimensions of urban sustainability because indicators devoted to any single domain fail to draw the whole picture [27]. However, more indicators included for a wider coverage of urban development results in more complexity caused by measurement and quantification. Therefore, minimizing the amount of indicators without sacrificing the information content is another requirement for maximizing the efficiency of urban sustainability evaluation. To solve this problem, constructing composite USI can be a possible way by conjoining multiple specific indicators into a more integrated one [33]. For example, QOL is such a composite indicator that incorporating multiple dimensions of urban life (economic, social, educational, and environmental) into one single well-being index. This can be found in a growing body of research by [34,35,36,37,38]. Similarly, urban sustainability can also be evaluated by such composite indicator indices at different integrated levels for planning and policy-making purposes.
It is therefore of great significance to establish an integrated USI model based on a hierarchical indices system. This model should incorporate both objective and subjective information to provide a more accurate evaluation of urban sustainability. Additionally, geospatial data (satellite imagery and maps) and traditional census data are both needed to guarantee an effective spatial-temporal pattern analysis of urban sustainability distribution which is indispensable for decision makers in formulating and implementing adaptive strategies.

3. Important Domains of Urban Sustainability Evaluation

3.1. Urbanization

Urbanization can be simultaneously considered both an issue and a process that links different physical and social systems to a high concern of sustainability with regards to environmental problems, public infrastructures, service development, and policy making [39]. Global economic growth has driven this issue to experience an unprecedented period. An increasing number of unsustainable problems arising from this urbanization process include urban population growth, urban sprawl, and land cover/land use change, which has drawn great concern from a variety of stakeholders such as policymakers, urban planners, social scientists, geographers, economists, environmentalists, entrepreneurs, and urban residents [40]. Particularly, such urbanization issues have negatively affected sustainable spatial planning of environmental and socioeconomic development [17]. Key elements of urban spatial sustainability include balancing population growth, guaranteeing sufficient green space, and minimizing urban sprawl, natural area change, and use of environmentally-damaging materials (e.g., impervious surface) [17,41,42].

3.1.1. Population Growth

Population growth in urban areas is considered a key factor driving urban growth during the urbanization process [43]. An unprecedented population increase has emerged compared to that in historical records. In the middle of 20th century, no more than 30% of global population settled in cities. By 2006, approximate 50% of the global population was living in urban areas and around 70% will become urban residents by the middle of the 21th century [2]. In addition, there is a distinctly expanding population discrepancy between the developing and developed world. From 1950 to 1975, the number of urban inhabitants increased by more than 20 million per annum in developing countries while the number in developed countries increased by around 10 million. By 2030, the annual increase (74.5 million) of urban residents in developing regions will be much higher than that in developed regions (1.5 million) [44].
Population is considered an essential factor in determining urban spatial sustainability, which can be illustrated by comparing the population living demands in an urban area to its carrying capacity [15]. Huang et al. [22] argued that extreme population increase can exert serious strain on infrastructure and commodity provision and further degrade QOL. Specifically, if the urban carrying capacity (e.g., urban facilities, service, ecological environment, economy) can meet the need of population growth in both short and long terms, then the urban development can be regarded as sustainable. Otherwise, if the population growth rate exceeds the urban carrying capacity in either the short term or long term, then the urban sustainability goal has not been achieved. Therefore, it is quite dependent on the local socioeconomic development to assess the sustainable status of the population in any given area. Overall, a slightly growing or stable population is desirable for achieving a sustainable goal [23]. Comparison of the rate of urban sprawl and population growth can help to assessing sustainability from a carrying capacity perspective [43]. Demographical USIs (e.g., total population, population density, population growth rate, mortality, birth rate, etc.) have been widely used in many urban sustainability systems such as the United Nations Center for Human Settlements (UNCHS), the Europe Environment Agency (EEA), the World Health Organization Healthy Cities Indicators (WHOHCI), British Columbia State of Sustainability Report [16], and Sustainable Seattle Report Card (SSRC) [23].

3.1.2. Urban Sprawl and Land Cover/Land Use Change

Urban dynamic spatial-temporal patterns (e.g., structure, forms, and organization) play a critical role in explaining the interdependence of urban systems and broader systems. Monitoring urban patterns is considered an important procedure for urban planners and administrators towards urban sustainability [15,45]. In addition, the impacts of urban patterns on urban environmental conditions also belong to the urban sustainability domain. Variations of urban sprawl, and land use/land cover (LULC) over different time periods are regarded as indicators that can demonstrate the urban dynamic spatial-temporal patterns. Such indicators are widely accepted by different communities and are used in diverse urban sustainability evaluation frameworks.
Urban sprawl or expansion, as a result of urban growth, has posed a great strain on urban environment, society, and economy [46]. Relative literature indicates that there is a growing urban decentralization trend with either an increasing or decreasing population size [41]. The traditional sustainable idea of urban development is supposed to be a “compact city” through densification while the other development mode is “green city” with eco-suburban areas expanded from the center city [15]. The compact city is similar to the “fill-in” mode characterized by self-support functions, which is more accepted by sustainable urban planners due to the philosophies of energy-conscious spatial development. The high proximity of dense urban patterns allows reduction of energy use and emission of motorized transportation for commuting and service accessibility (e.g., shopping, education, and medicine). In addition, concentrated housing pattern (e.g., apartments, row houses, and co-houses) within such compact mode requires much less space heating compared to most separated single-family houses in suburban areas which are greatly facilitated by the urban sprawl process [47]. Furthermore, the land use conversion from natural surfaces to urban areas can also be decreased to protect biodiversity. Therefore, the compact urban development mode of minimizing expansion is compatible with the goal of urban sustainability [48]. However, Orrskog [49] pointed out that too high-density urban planning goes against sustainability because of lacking ecological recycling within an open urban scenario. Overall, urban sprawl can cause more biodiversity loss compared to urban densification owing to the higher distribution of species diversity in peripheral undeveloped areas. Alberti [15] concluded that the scattered urban model violates the primary goal of sustainability in developed countries: minimizing energy use (transportation, space heating) and natural area transformation.
Land cover refers to natural or man-made materials present on the earth surface such as vegetation, soil, water, and impervious surfaces while land use is about what is caused by anthropogenic activities including residential, commercial, industrial, and agricultural areas, etc. [50]. Land cover and land use change can impact both local and regional environmental conditions, and is further associated with global change process for its interaction with climate, ecosystem, biochemical cycles and anthropogenic actives [51]. Also, urban land use pattern is highly linked with energy consumption and air pollution patterns as well as transportation trends. Urbanization has facilitated the transformation of natural land covers (e.g., soil, vegetation) to urban land uses such as industry, commerce, and residence covered by impervious surfaces, which strongly impact the whole earth ecosystem [43].
Improper land use and destruction in the urban development process can cause huge damage to both the environmental and human beings as illustrated in examples of ecological balance, species extinction, flood, drought, sandstorms, global warming and pollution. Studying the spatial distribution of urban LCLU change across time can help monitor urban dynamic process for an improved understanding of urban sprawl, which supports making better strategies of land planning and management for future sustainable development [52]. Therefore, urban land cover (e.g., total area, total built-up area, open area, transportation network, etc.) and land use have been selected as source sustainable indicators in a number of USI systems including the United Nations Center for Human Settlements (UNCHS), the Europe Environment Agency (EEA), and the Leicester Core Set of Sustainable Development Indicators. Since urban sprawl and land cover/land use change is of great significance for achieving urban sustainability, it is an urgent need to monitor and evaluate the magnitude and spatial-temporal pattern of urban dynamic process.

3.2. Urban Environment

An urban environmental system is a necessary component of the whole urban ecosystem, which is of primary importance to urban sustainability. With respect to urban environmental policies which emphasize either “ecology within the city” or “city in ecology”, environmental quality always to a high extent determines urban residents overall well-being (e.g., health, recreation, etc.). Urban environmental issues generally involve energy use, biodiversity conservation, landscape amenity, and natural resource protection. Specific urban environmental concerns comprise aspects of green vegetation space (GVS), impervious surface area (ISA), water quality, and urban air condition (temperature and components). All of these elements are associated closely with the overall quality of the physical environment as well as residential QOL [15]. It is of great necessity to assess urban environmental conditions by investigating such features for further examining the urban QOL from a sustainable perspective.

3.2.1. Green Space (GS)

Green space or vegetation area is, in an absolute sense, an indispensable component of urban sustainability. A number of advantages of green space can be found in urban sustainable development. Firstly, vegetation plays a critical role in cooling the air and saving energy, which is consistent with the sustainable goal of a low-energy future highlighted by [5]. Secondly, green vegetation can absorb the pollutant emissions (e.g., carbon dioxide, sulfur dioxide, etc.) released by consumption of fossil fuels and in doing so help mitigate the greenhouse effect as well as reduce urban noise improving the health of inhabitants. Increasing green space is also a helpful strategy for reducing habitat loss, preventing species extinction, and protecting biodiversity. In addition, adequate vegetation is necessary to ameliorate urban environment to provide more outdoor recreation opportunities which can profoundly improve urban QOL, ultimately contributing to urban sustainability.
Indicators developed from the vegetation perspective can reflect the quality of urban environment as well as the health level of the ecological economic system, providing feedback information for sustainability assessment. Huang et al. [22] pointed out that decreased green space caused by economic development is one influential factor contributing to Taipei city’s unsustainable status, so he suggested using one green coverage ratio to indicate the life-support capability in urban areas for sustainability evaluation. Different vegetation-related indicators (e.g., green space area per capita, green space area per income, green space diversion, public access to green space, etc.) can be found in a number of USI systems designated into different categories for sustainability evaluation. For example, percent green area has been selected as an urban land cover indicator in EEA indicator systems while both green space surface area and public access to green space have been chosen as environmental indicators in the WHO’s healthy cities indicator system. In addition, measures of quantity, quality and accessibility to green space serve to indicate the good quality wildlife habitat lost to development in the Core Sustainable Development Indicators in Leicester [53]. Green space was also considered as an input variable representing the environmental conditions in the urban QOL framework by [54] for Canada Mortgage and Housing Corporation studies.

3.2.2. Water Quantity and Quality

As one of the essential resources used for drinking, agriculture, industry and recreational purposes, water is a vital component to maintain human life and urban development. Both water quantity and quality are closely linked with residents’ health and safety. The available water amount and water purity in an urban area can greatly affect residents’ daily domestic water supply for drinking, washing, and other usage. In addition, water contributes significantly to improving the urban environment in terms of cooling temperature, purifying air, beautifying landscape, and preventing dryness [55]. Therefore, urban water has significant implications with sustainability. However, urbanization problems along with other anthropogenic activities can degrade both water quantity and quality by reclamation and contamination. Metropolitan Toronto Planning Department [56] in their report The State of the Environment Report: Metropolitan Toronto indicated that a stress-condition relationship exist between urbanization process (land use change and contaminating activities) and water quality status owing to the altered drainage patterns, disturbed natural hydrological cycle, and polluted water from different sources. Diverse water-related indicators can be found in most frameworks of urban sustainability, such as the Concentration of contaminants in water responsive to the ecosystem indicators domain proposed by the National Round Table on Environment and Economy [57], % treated water indicator and times water unswimmable due to pollution as potential environmental indicators for Measuring the Health of a Community [58]. Also, the Alberta Round Table Vision-Indicators Matrix regarded Conditions of major rivers relative to water quality standards as an indicator for sustainability evaluation.

3.2.3. Impervious Surface Area (ISA)

Impervious surface commonly refers to water-resistant materials including asphalt, concrete, and other construction substances used for building roofs, roads, sidewalks, and parking lots. Urban land uses of impervious surface mainly contain transportation, commercial areas, industrial zones as well as parts of residential spaces (e.g., buildings roofs, sidewalks, etc.) [59]. As a predominant element of the built environment, impervious surfaces can characterize the composition of urban morphology, which is a major concern in assessing urban sustainability [27]. Because impervious surfaces used for buildings and infrastructures are mostly produced from non-renewable resources by high energy-cost processing and transportation, expanding impervious surfaces severely violate the sustainable goal of reducing energy use. In addition, such non-porous urban materials can alter the surface albedo and runoff regimes resulting in reduced evaporation and damage to the natural hydrological cycle [60]. Moreover, the increasing impervious surface is considered a key driving factor of the rising urban heat island (UHI) effect attributing to its high heat absorption, thermal capacity, and conductivity [51]. Therefore, the amount of impervious surface area (ISA) acts as a critical indicator of urban environmental quality as well as areal pollution of watersheds or runoff [61]. Extracting ISA variation allows detecting LCLU change for developing urban growth models to monitor dynamic urbanization processes [62]. Mapping impervious surface can also play an indispensable role in providing input information for many land-atmosphere energy and exchange models, leading to a better understanding and preservation of the whole urban ecological system [63]. Associated USIs can be found in the Leicester Core Set of Sustainable Development Indicators which were intended to measure the quality of the built environment, the sustainable use of materials and land, and the accessibility impacted by land use change.

3.2.4. Urban Surface Temperature

Urban surfaces characterized by non-porous materials have much higher thermal absorption and capacity in comparison to other land covers such as vegetation or water. A huge amount of solar heat can be stored by impervious surfaces in the day time and subsequently released at night, which causes urban areas experience a higher temperature compared to their rural counterparts. This phenomenon is referred to as urban heat island (UHI) effect and is exacerbated by rapid urbanization processes [51,60]. Particularly, increased amount of impervious surfaces as well as decreased vegetated areas has noticeably intensified this phenomenon. Moreover, the rising urban surface temperature is also contributed to by the release of urban waste heat including house heating, transportation, industry, and other disruptive anthropogenic activities. The UHI effect has posed considerably adverse impacts to urban sustainability by threatening both environmental quality and human health. The rising temperature can facilitate some harmful chemical reactions releasing poisonous gases and particles (e.g., photochemical smog) which severely degrade air and water quality and some can even lead to species extinction. Also, the UHI, a public health hazard, has given rise to high levels of human diseases and mortality because of either the associated pollutants or the extreme heat stress itself [60,64]. Therefore, sustainability indicators with temperature concern can be found in previous literature. For example, the National Round Table on Environment and Economy [57] adopted temperature (daily and trends over time) as one of the preliminary USI in the ecosystem domain. Temperature changes were also included as state indicators of environment quality in the OECD Pressure-State Response approach [65]. Li and Weng [59] also incorporated remote sensing derived land surface temperature as an environmental variable into the QOL model to assess the QOL in Indianapolis, U.S.

3.3. QOL

3.3.1. Definition of QOL

From an overall perspective, QOL is a composite indicator for measuring the personal satisfaction level with surrounding living status [66]. Previous literature has demonstrated that there are diverse definitions of QOL by either emphasizing the individual subjective sense in terms of “active, happy, or high self-esteem” or highlighting the objective linkages existing between the personal conditions and the external environments.
Consequently, there are two primary types of variables used for developing QOL, and these variables can be taken as sub-indicators that compromise QOL. One type are called objective indicators (or proxies) which focus on the measurements of objective urban circumstances including physical and built environment, and socioeconomic development (e.g., population density, housing density, green vegetation, impervious surface, unemployment rate, etc.) [33]. The other type are subjective indicators which highlight the personal perception of their experienced urban conditions. Those indicators are mainly comprised of individual values, attitudes, and senses. For example, the green space area in a neighbourhood belongs to the objective category while the residents’ satisfaction with their green space area in the same neighbourhood is a subjective indicator. The objective indicators are usually measured using data from indirect data sources (e.g., census data, biophysical field data, photographs, maps, or satellite imagery). Subjective indicators are mainly obtained directly from attitudinal data based on interviews, surveys or questionnaires by adopting various forms (e.g., face-to-face, telephone, online, etc.) [26]. For theoretically evaluating QOLs, both objective and subjective indicators are needed to complement each other for a more comprehensive and accurate understanding of QOL [47].
There are advantages and limitations in both types of QOL indicators. First the subjective indicators are advantageous in that they are first-hand information which can indicate the residents’ well-being more accurately. However, it is difficult to conduct psychological data collection due to the time-consuming and expensive measurements needed, ethical issues, as well as interviewees’ accessibility, so the use of subjective indicators are quite limited for establishing a comprehensive QOL for sustainability evaluation. In addition, the validity and reliability of subjective indicators are questioned by researchers because of the difficulty in quantifying and comparing QOLs interpersonally. Also, since the flexibility exists in residents’ psychological evaluations towards their actual living standards, the honesty and accuracy of the interviews’ feedback is viewed with skepticism. On the other hand, objective indicators can be obtained from accessible data sources such as census, field work, or imagery acquisition. In addition, they are capable of being quantified and compared based on standardized values. The disadvantages of objective indicators lie in the measurement errors during data recording (e.g., underreporting mortality) and subjective judgment inevitably introduced by indicators selection. Take the evaluation of an indicator such as building density towards sustainability for example. High building density can be interpreted as “negative” because this urban pattern destroys the natural urban landscape from an environmental aspect while it can be explained as ”positive” from an economic development perspective. Therefore, a universally accepted indicator assessment criteria within most communities is needed to avoid the weakness shown by the objective indicators.
Theoretically, a well-developed QOL model should be based on the incorporation of both physical and psychological variables [67,68]. Nonetheless, few studies were able to take the subjective variables into the proposed QOL model due to the huge challenges posed by data collection. Some early researchers [69,70] believe that the objective indicators can represent the subjective ones based on the assumption that there is a high correlation existing between the two. However, others [71,72] argued that there is little association between subjective and objective indicators owing to the complexity of psychological processes. QOL studies conducted by Jacksonville Community Council have demonstrated that subjective indicators are necessary components of a QOL model by collecting such data through telephone interviews for years.

3.3.2. Sustainable Implications of QOL

QOL has significant sustainable implications because of the close connections of individual well-being to the corresponding urban circumstances. As a composite index, QOL is capable of representing the socioeconomic and environmental conditions associated with local people’s life. To comprehensively evaluate the sustainable level of a city, it is necessary to incorporate both subjective values of peoples’ perception and the objective status of the physical environment into the whole urban context [15]. Also, social and economic variables are needed to develop the QOL model for sustainability evaluation [27]. For example, to create London as a “sustainable world city”, the Mayor of London in 2000 pointed out that it is necessary to “create a QOL index for London, adapted to the cities’ specific needs, including measures of crime, health, air and water quality, road traffic levels, access to green space, and re-use of polluted and derelict land”. Alberti [15] argued that subjective information has always been paid little attention by most communities when it comes to measuring urban sustainability. Support for this view comes from the United Kingdom’s Local Government Management Board which emphasized that subjective indicators should be incorporated into urban sustainability indicators due to the community based values and expectations [24].
Despite the popularity of developing various USIs frameworks, previous literature and planning reports demonstrated that there is a weak integration of potential USIs in existing urban sustainability evaluation systems. A “synthetic value” derived from an integrated system of multiple indicators is required to measure and evaluate the whole picture of an urban situation [25]. In addition, there is a lack of linkages among the different dimensions of an explicit interpretation of urban sustainability from both objective and subjective perspectives. Also, the USIs developed for previous frameworks cannot be completely compared or quantified due to their poor measurements and quantification.
Furthermore, little attention has been paid to the spatial and temporal patterns of urban development. The strengths of geomatic approaches, including GIS and remote sensing has not been fully explored for the urban dynamic analysis. Most remote sensing and GIS based research separately investigated economic, social, or environmental aspects of urban development either on urban sprawl, land use, or urban environmental problems (GV, ISA, UHI) while other studies applied such spatial methods merely for assessing QOL. However, urbanization issues (urban sprawl and land use, urban environmental problems) and QOL are of great association with spatial sustainability. The detachment of assessing each dimension of urban sustainability without a spatial-temporal perspective is a common disadvantage of much contemporary urban sustainable studies.

4. Availability of Potential Approaches

A lot of research has shown that both traditional statistical approaches and advanced geospatial technologies (RS and GIS) have great potential for investigating urban problems [39]. In Particular, the incorporation of both methodologies can significantly enhance the ability of researchers in characterizing urban morphology [52,73,74,75], monitoring the urban dynamic process [43,45,51,76], investigating urban environmental problems [51,77,78,79], and assessing urban QOL [59,80,81,82]. Statistical approaches mainly include correlation-regression analysis, the expansion method, factor analysis, principal component analysis (PCA), and analysis of variance [59,81].
Advanced geospatial techniques have excellent capabilities to integrate multiple data sources (e.g., census data, satellite imagery, and maps) into one platform and extract diverse spatial-temporal information from the complex urban system. First, remote sensing can provide huge amounts of data (e.g., aerial photography, satellite imagery) with different spatial and temporal resolutions which enable large-scale and continuous coverage of the study area. In addition, remote sensing data processing techniques and Geomatic Information Systems have powerful spatial analysis functions for incorporating tabular or attribute data with spatial data to facilitate investigation of biophysical and socioeconomic information at different scales [82]. Compared to traditional non-spatial methods, RS and GIS hold great possibility for characterizing urban LULC change information, urban dynamic growth, and environmental conditions due to their advantages in mapping and handling massive datasets in a time-labor efficient way [83]. Moreover, developing a dynamic prediction model from spatial-temporal perspective can contribute significantly to the understanding of future urban expansion, which allows for an effective evaluation of the proposed planning policies before being put into action [84]. However, the combination of aforementioned statistical and geospatial approaches has until recently been limited to a relatively narrow range of application. The exploration of urbanization and human QOL needs to be expanded to include both analyses.

4.1. Urban Expansion and Land Use Change

Urban sprawl is commonly quantified by deriving the built-up area difference between different periods from physical field survey, historical maps, or remotely sensed imagery [75]. LULC change can be conducted by combining remote sensing change detection techniques and GIS spatial analysis functions [51]. Weng [73] detected the trend and spatial pattern of land use change in the Zhujiang Delta of South China based on geospatial analysis and stochastic modeling. He also found a large loss of cropland in the past decade resulting from an abnormal urban growth which demonstrated the impacts of urban sprawl on land use dynamic conversion. Seto and Kaufmann [74] studied the same region by applying an econometric model with inputs of Landsat Thematic Mapper (TM) imagery of 30 m spatial resolution and economic-demographic data, which indicated that the external investment in industry is the paramount driver of local land use change. Similarly, the spatial-temporal dynamics of urban sprawl in the city of Shijiazhuang (China) was explored by [43] who integrated socioeconomic census data, historical maps, and satellite imagery to the GIS spatial analysis platform. LULC change detection was also carried out in this study and was found to be greatly driven by this urban expansion phenomenon as well as other influencing factors. In addition, urban sprawl and LULC studies are also conducted in Africa. Tewolde and Cabral [45] employed remote sensing object-oriented classification and a multi-layer perception neural network to develop an urban growth model which can predict the land use change and urban expansion in the next decade. In this study high spatial resolution imagery (IKONOS-2 of 1 m and Quickbird of 0.6 m), DEM data, and land cover maps were used simultaneously as ancillary data to assist classification and accuracy assessment.

4.2. Urban Environment Detection

4.2.1. Mapping Vegetation

Remote sensing provides an effective tool for accurately mapping and monitoring vegetation abundance. Compared to natural vegetation measuring, urban vegetation requires imagery with higher spatial resolution due to its heterogeneity and comparatively smaller geographical scales [85]. Small [78] demonstrated that 10 to 20 m is the most appropriate spatial scale to identify urban structures. In fact, Landsat TM imagery of 30 m spatial resolution is not appropriate for characterizing urban features due to the image pixels of mixed spectral features. Multispectral Satellite Pour l'Observation de la Terre (SPOT) 4 and 5 imagery of 20 m spatial resolution can be used to extract urban land cover distribution as well as vegetation abundance. As a ratio-based index, Normalized Difference Vegetation Index (NDVI) calculated from red and near-infrared reflectance can be used to indirectly estimate the amount of green biomass [50]. Price [86] pointed out that NDVI is sensor dependent because of the different definitions of spectral regions of different instruments. [87] suggested that Chlorophyll Index (green red ratio) derived from high spatial resolution IKONOS satellite imagery better estimate urban vegetation compared to NDVI owing to its sensitivity to multiple canopy layers particularly in dry seasons. Another popular approach to estimate urban vegetation is named spectral mix analysis (SMA) which is capable of characterizing spectral heterogeneity of the urban mosaic [88]. SMA is developed based on a linear mixture model with different proportions of “end members” (fundamental components of the urban landscape) reflectance within one image pixel, which shows great advantages in analyzing Landsat TM and SPOT imagery for urban classification [77,79,89]. With the development of remote sensors for obtaining high spatial resolution (<10 m) imagery, texture analysis and object-oriented techniques can also make accurate urban land cover information extraction possible [85].

4.2.2. Mapping Impervious Area

Early studies used remote sensing approaches to identify ISA based on the simple classification of roads, parking lots, rooftops, and buildings [90,91,92]. More recent research computed ISA by considering it as a basic category of urban land cover and land use (LCLU) classification systems [61]. However, similar to urban vegetation mapping, it is difficult to guarantee a high accuracy of SIA extraction from heterogeneous urban areas using traditional pixel-based classification methods. It is possible that moderate satellite imagery with a spatial resolution between 10 m to 100 m (e.g., Landsat TM or SPOT) suffer from the scale problems owing to the impure pixels of mixed land covers when applied to extract information from the urban mosaic. Remote sensing classification confusion can be frequently caused by the spectral mixture within the instantaneous field of view. Therefore, both SAM methodologies and high spatial resolution imagery are needed for accurately extracting impervious surface features (e.g., area, percentage or pattern) from the urban landscape [62,79,93,94]. Xian [95] investigated the urban spatial and temporal patterns of both Las Vegas and Tampa by developing a subpixel imperviousness assessment model (SIAM). A Vegetation-Impervious surface-soil (VIS) model developed by [77] has proved successful in quantifying different physical compositions of the urban environment based on parameter standardization [79,94,96].

4.2.3. Urban Water Quality

Urban Water coverage can be obtained by land cover analysis based on remote sensing classification. In particular, it is possible to improve the accuracy of water retrieval from satellite imagery by adopting some advanced classification techniques such as SMA or object oriented approaches. Band ratio indices are another way to quantitatively distinguish water information with a certain threshold from the imagery of the urban landscape such as Normalized Difference Water Index (NDWI) by [97].

4.2.4. Urban Surface Temperature

Since 1972, remotely sensed thermal radiation ranging from 8 to 13 µm of the electromagnetic spectrum has been utilized to retrieve land surface temperature based on the physical theories of the Stefan-Boltzmann law, Wien’s displacement law and Planck’s law [98]. Both day and night land surface temperature can be derived from the thermal energy obtained by satellite sensors. Digital brightness of the thermal imagery can record the radiant energy as an expression of the thermal emissivity of distinct objects [85]. Previous research has shown that diverse satellite imagery of different spatial, temporal and spectral resolutions have been exploited to extract the land surface temperature for interpretation of the urban heat island phenomenon. Low spatial resolution imagery such as the Advanced Very High Resolution Radiometer (AVHRR) within an Instantaneous Field of View (IFOV) of 1 km allows for spatial-temporal analysis of surface temperature in Houston, Texas at a regional scale [99]. Similar applications can also be found in the research by [86,100]. Compared to low spatial resolution imagery, thermal infrared imagery of moderate spatial resolution, such as TM (120 m) and Enhanced Thematic Mapper Plus (ETM+) (60 m), are more popular for small-scale (e.g., local, neighbourhood) urban studies. For example, Chen et al. [101] applied multi-temporal TM and ETM+ data to retrieve the spatial variation of brightness temperature in Shenzhen (China) from 1990 to 2000, showing that obvious heat island effects can be identified in the most urbanized regions. In addition, existing literature has also demonstrated that surface temperature has a negative relationship with water and vegetation percentages but a positive linkage with impervious surface area. These aforementioned impacts of land cover and land use pattern can be obtained by spatial statistical analysis of classification results and the surface temperature distribution.

4.3. QOL Assessment

Previous literature shows great potential and availability for geomatic techniques and statistical approaches in assessing QOL from a spatial perspective. Lo and Faber [80] estimated QOL in Athens-Clarke County (Georgia, US) by incorporating TM imagery-derived environmental information (e.g., land use land cover percentage, NDVI, and surface temperature) and socioeconomic census data (e.g., population density, per capita income, median home value, and percentage of college graduates). The intercorrelation of different variables was also investigated by this study which presented a comprehensive explanation of the multiple contributors to the overall QOL. The methodologies proposed by this study can perfectly match the essential characteristics of QOL (subjectivity and objectivity) interpreted in early studies [102,103] by conducting both the subjective and objective QOL assessments respectively based on PCA and GIS overlay approaches. Likewise, Li and Weng [59] adopted the same idea in the QOL study of Indianapolis city (US) and they expanded the original variable set to encompass more input information such as the impervious surface area extracted from satellite imagery, poverty, employment rate and house characteristics for the quantitative QOL model. In addition, they used ETM+ imagery instead of TM for surface temperature retrieval which improved the spatial resolution of the thermal band from 120 m to 60 m. Moreover, they conducted Pearson’s correlation and factor analysis to reduce the redundant information of the dataset to derive combined information representing different aspects of QOL. Similar QOL studies can also be found in [82,104,105].

4.4. Opportunities in Available Methodologies

These aforementioned approaches are nothing new since they have been widely applied in a number of studies including environmental studies, urban planning, and some social sciences. However, most of these techniques were just used separately to investigate one or two aspects of urban development. Some focus on urban sprawl or land use while others concentrate on impervious surface extraction, urban heat island study, or urban vegetation mapping as well as for quality of life modeling. Such issues are highly associated with urban sustainability; they have rarely been studied together based on integrated geomatic approaches for a comprehensive urban sustainability study. In a sense, the promising remote sensing and GIS techniques have still not been fully explored to depict a whole picture of urban sustainability due to their detached applications. Some statistical data can further illustrate this point. For example, in the world-famous citation database Web of Science users can access 3043 articles on urban sustainability if “urban sustainability” has been selected for the search topic. However, if the search topic is set to “urban sustainability” and “remote sensing” at the same time, the search result is only 47 records. Similarly, only 120 articles can be found if the search topic is set to ‘urban sustainability’ and ‘GIS’. If the topic is set to “urban sustainability”, “remote sensing”, and ‘GIS’ simultaneously, only 20 articles are returned. This indicates that approximately 1.5% ~ 3.9% of urban sustainability studies have used advanced geospatial techniques. Accordingly the spatial-temporal comparability of these USIs is somehow challenged. It is necessary to explore the potential of advanced geomatic approaches in such aspects for improving the evaluation of urban sustainability.

5. A Potential Integrated Model for Evaluating Urban Sustainability

To lay the theoretical foundation for efficiently monitoring and evaluating urban sustainability, it is of great importance and priority to establish an integrated USI model based on an appropriate understanding of urban sustainability. Then candidate urban sustainable indicators need to be determined according to the different domains and themes identified within the framework model.

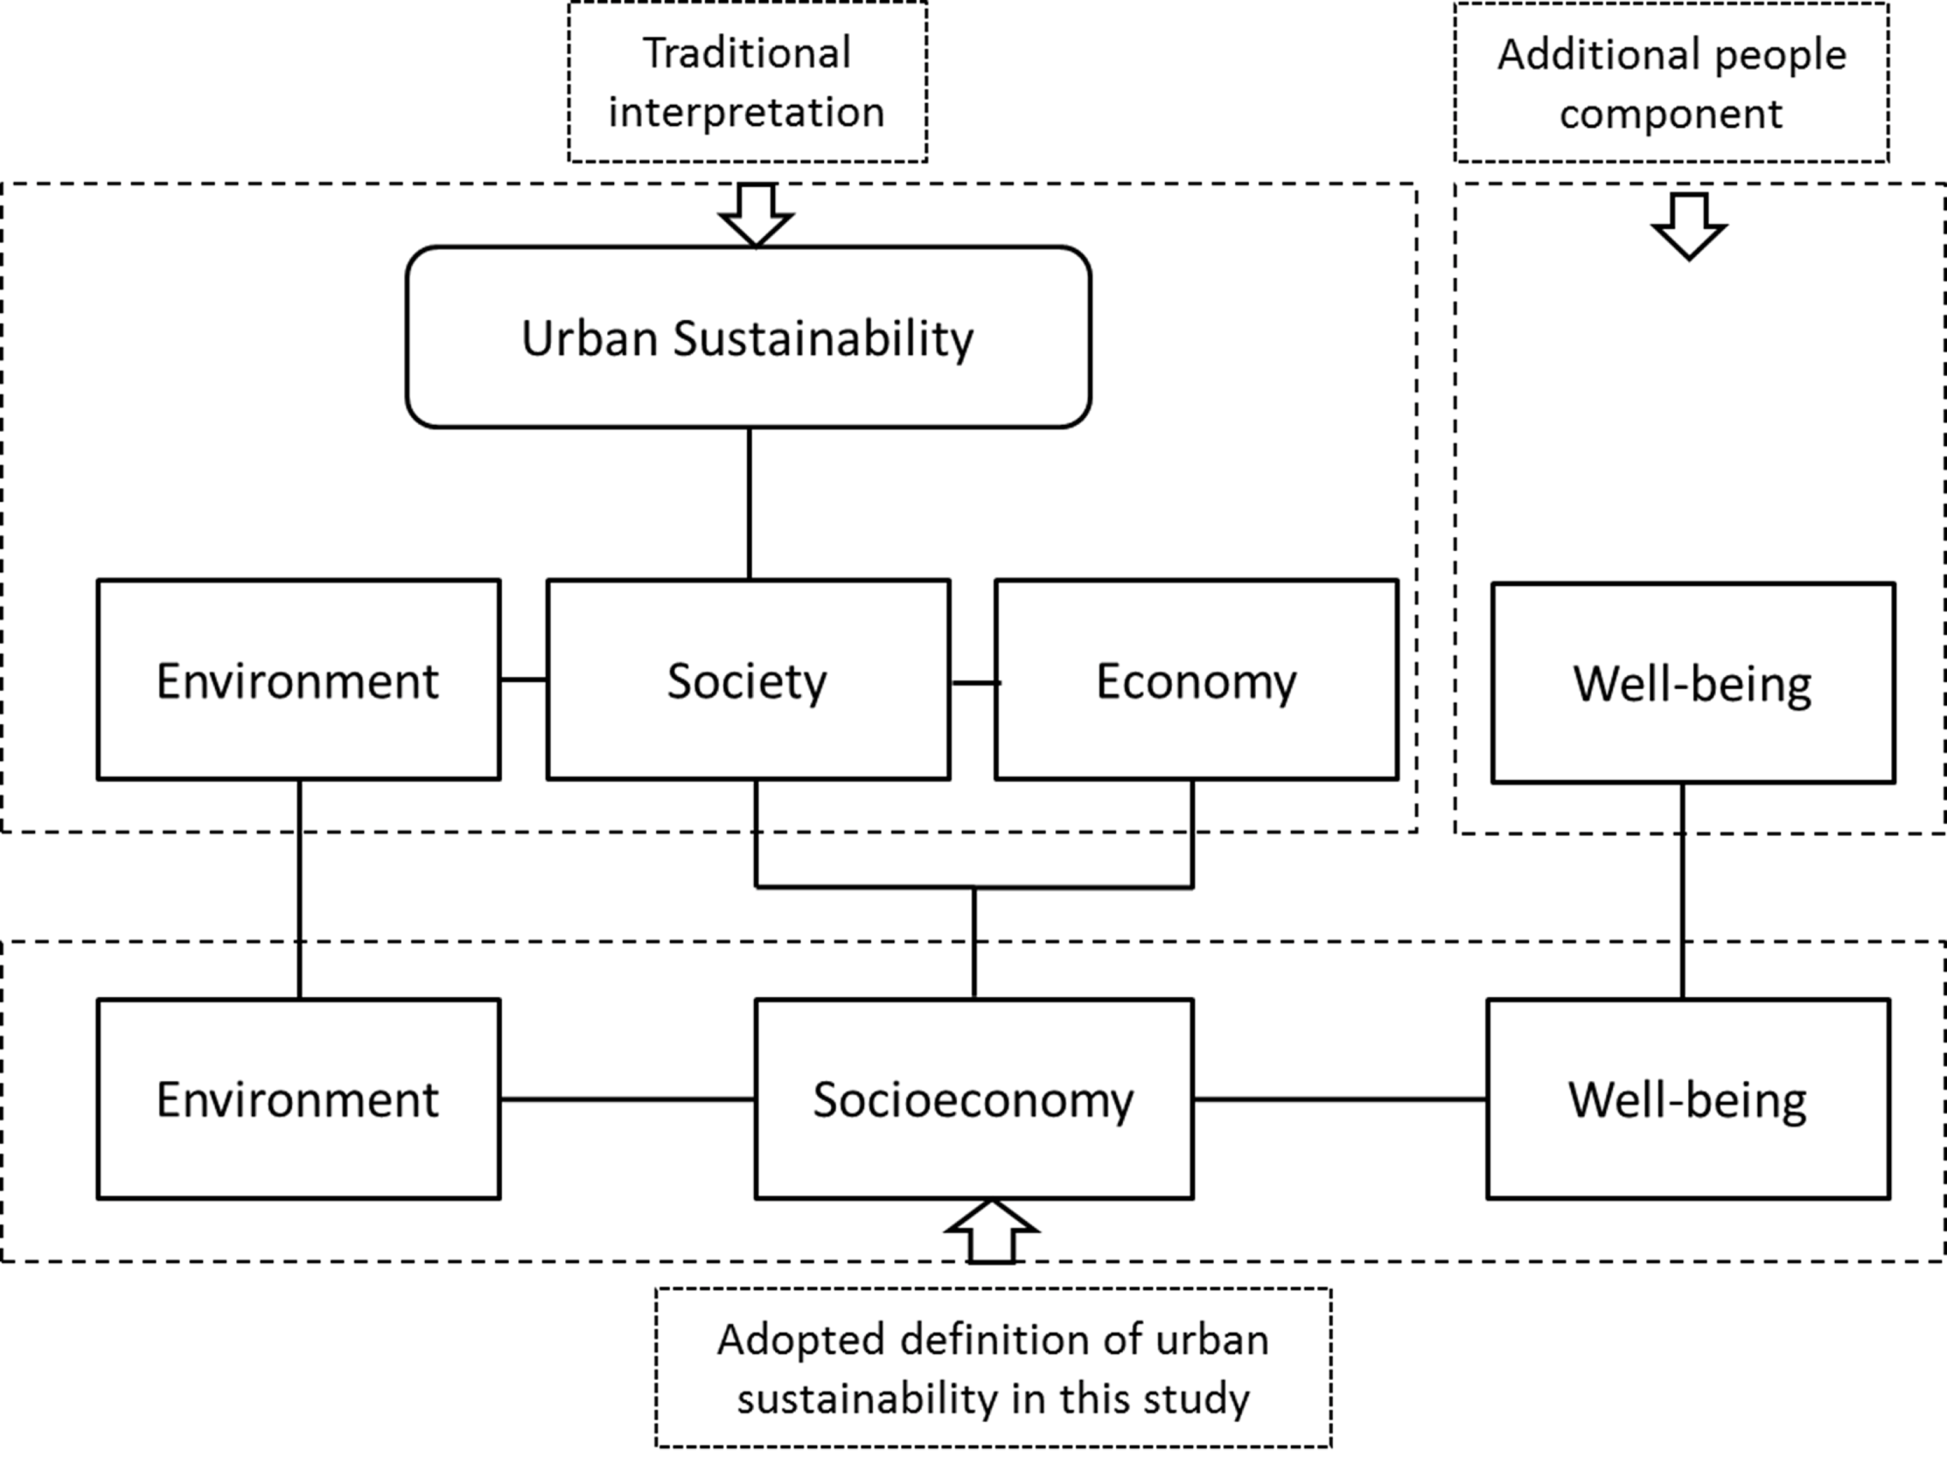
5.1. Define a Suitable Interpretation of Urban Sustainability

We adopt a holistic interpretation of urban sustainability which could be explained as: A sustainable city is one undergoing development in harmony with its environment, economy, society and people’s well-being. Although this definition has been rejected by the United Kingdom’s Local Government Management Board in their description of urban sustainability owing to a lack of innovation, we still suggest this traditional way in explaining urban sustainability. Because this interpretation is comprehensive enough to cover different aspects of urban development all of which are highly relevant to sustainability. The USI model established based on this interpretation of urban sustainability can be more suitable for application in different urban contexts due to its generality and comprehensiveness. In addition, people’s well-being can provide more subjective information of urban sustainability status while the other three basic domains (environment, society, and economy) can reflect more objective evidence. People as an essential component of urban activities are supposed to be taken into consideration for explaining urban sustainability. Since there is a large portion of overlap between social and economic domains, we would prefer to simplify the interpretation of urban sustainability into a balance of three dimensions: environment, socioeconomic, and well-being (Figure 1). This identified coverage will constitute the fundamental domains of a hierarchical multiple-indicator system for our proposed USI model.

5.2. Establish the Framework of the Integrated USI Model

First, this integrated USI model will be a domain-based framework. As Keirstead and Leach [21] suggested, USIs should be presented within clearly allocated categories, themes, and sub-themes focusing on policy goals. Our proposed USI model will encompass three basic categories (environment, socioeconomic, and well-being) according to the definition of the appropriate urban sustainability aforementioned. The specific themes and sub-themes within the three broad domains are determined based on the key influential elements extracted from the literature. The socioeconomic domain contains the theme of urbanization consisting of sub-themes such as population growth, urban sprawl, and urban land use change. The environmental domain comprises four key aspects which are green space, impervious surfaces, water quality, and surface temperature. The well-being domain mainly focuses on the theme of QOL which encompasses multiple sub-themes explained by material living, surrounding status, and individual’s development [59]. In addition, this USI model can also be considered as a process-outcome framework in that the socioeconomic domain acts as a stressor agent while the environment and well-being domains represent the condition agents. The environment domain can also play the stressor role in the outcome of well-being. This model can be shown by Figure 2 in a graphic illustration. The accessible and measureable indicators can be found in following Section 5.3. and the discussion of this proposed model is in Section 6 with regards to its advantages and limitations.
Figure 1. The adopted coverage of urban sustainability.
Sustainability 05 00524 g001
Figure 2. The potential integrated urban sustainability indicator (USI) model for monitoring and evaluating urban sustainability.
Sustainability 05 00524 g002

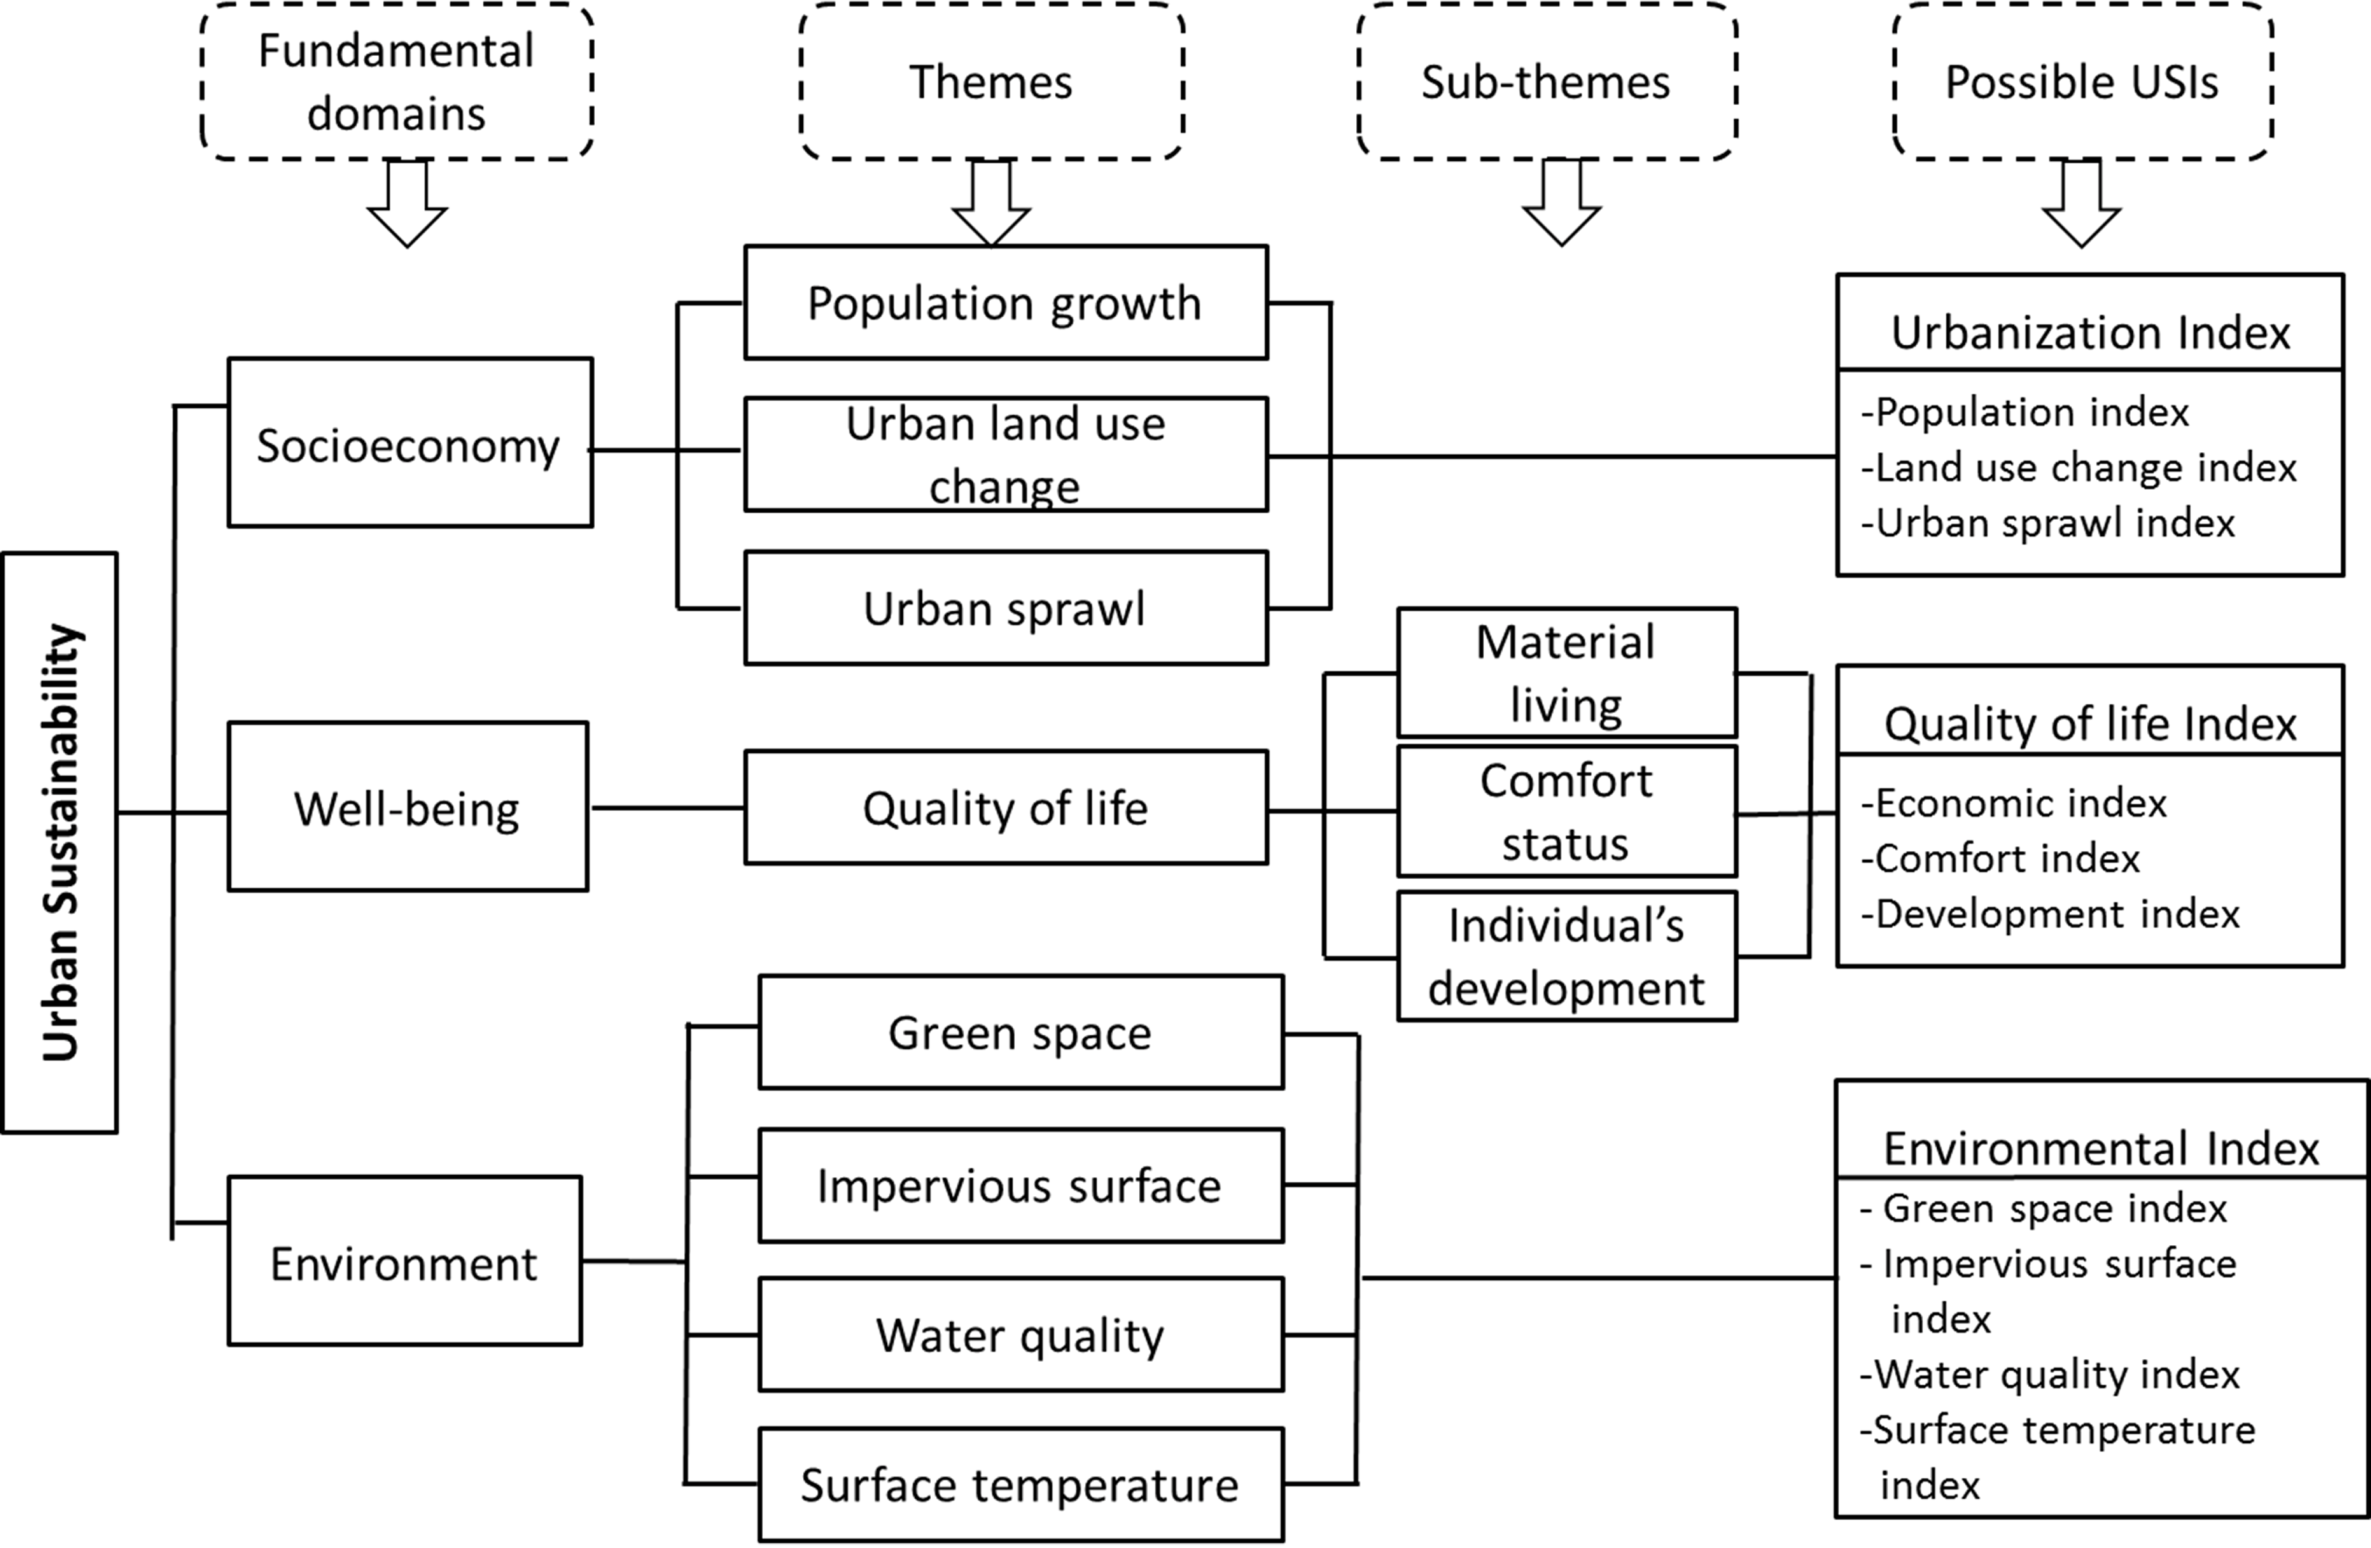
5.3. Identify Preliminary Indicators and Measurements for the USI Model

Different interpretations of urban sustainability can lead to different selection of indicator set, so both academic and practical literature were studied to identify suitable USIs capable to evaluate the fundamental domains within the USI model. This step is critical to determine whether an accurate measurement and assessment of urban sustainability can be achieved using a synthesized framework. Existing USI models including State-of-Environment Reporting, Health City Reporting, QOL Reporting, The United Kingdom’s Local Government Management Board, Hodge’s Framework for Systematic Sustainability Reporting, and Developing Indicators of Urban Sustainability were examined to draw appropriate indicators for our proposed integrated USI model. The advantages and disadvantages of each possible indicator should be assessed according to the identified indicator selection criteria. The validity, accessibility, and measurement of the potential indicators should be considered and evaluated as well.
To efficiently measure and quantify this proposed USI model, a hierarchical indices system was developed at three integrated levels (Figure 3). In this system, all urban sustainability indicators will be quantified in the format of index; this allows standardized calculation of different indicators as well as easy comparability among indicators to overcome such weakness pointed out by researchers in most existing USIs models. The hierarchical relationships exist based on the degree of integrity or synthesis for different indicators. Level 1 indices represent the most specific USI set some of which can be directly measured using the census data or imagery information, such as Population index, Land use index, Green space index, and Safety index. Level 2 indices are more integrated and they can be calculated based on a function with Level 1 indices as input parameters, such as Environmental index, Quality of Life index, and Socioeconomic index. The single Level 3 index called Urban sustainability index is the most integrated compared to indices in the other two levels. It will be derived based on all Level 2 indices. The formula for indices calculation will be weighted linear equations. All objective variables in equations can be obtained from available census data or imagery information while the weights for objective variables are from social surveys or set equal.
Figure 3. A three-level hierarchical indices system for quantification of the USI model.
Sustainability 05 00524 g003
In this study, a preliminary USI model was established with a selected USI set composed of fourteen indicators ranged from Level 1 to Level 3, which was aimed to achieve evaluation of urban sustainability from detail to more synthetic perspectives. Ten Level 1 USI indices (e.g., Population index, Land use change index, Urban sprawl index, Economic index, etc.) are defined as specific subsets of three Level 2 USI indices (Urbanization index, Quality of Life index, and Environmental index). All USI indices in Level 1 and Level 2 are considered as subsets of the most integrated and comprehensive Level 3 index (Urban sustainability index). Each Level 1 USI index can describe one specific dimension of its superset of Level 2 indices. In similar, each Level 2 USI index depicts a specific picture of the superset of Level 3 index- urban sustainability.
Figure 4. Description and measurements of potential USIs.
Sustainability 05 00524 g004
A brief description is provided below to show how to calculate the multiple indices for quantification of the proposed USI model. First, because Level 1 USI indices are single ratio based indices or derived based on a group of single ratio based indices, they can be very easily calculated using the available census data or imagery-derived information (Figure 4). For example, Land use change index can be derived from the ratio of changed urban area to the total urban area in the current year. Or Green space density index can be obtained based on the ratio of green vegetation area to the total urban area. Second, for Level 2 indices, they can be quantified based on a weighted addition of all Level 2 indices in its subset. Weights for objective indices including Urbanization index and Environmental index are set equal because we assumed there is no priority for objective change of urban development. Weights for the composite index Quality of life are set according to the social survey results since the human well-being status is determined by both objective conditions and subjective perceptions. For the final Urban sustainability index, three input variables which are Level 2 indices are given equal weights because three fundamental domains are considered to be the same important in determining urban sustainability. However, concerning the different urban sustainability goals set in different urban polies, the weights can be flexibly set for the identified USIs. As Gosselin [25] suggested, the balance of different domains within urban sustainability and the reference from other studies should be taken into consideration.
This hierarchical system can provide good quantification of the USI model. All the Level 1 and Level 2 indices are developed according to different domains, themes, and sub-themes of the integrated USI model shown in Figure 2. In particular, the Level 3 Urban sustainability index enables a quantitatively overall evaluation of the progress towards urban sustainability from a spatial-temporal perspective.

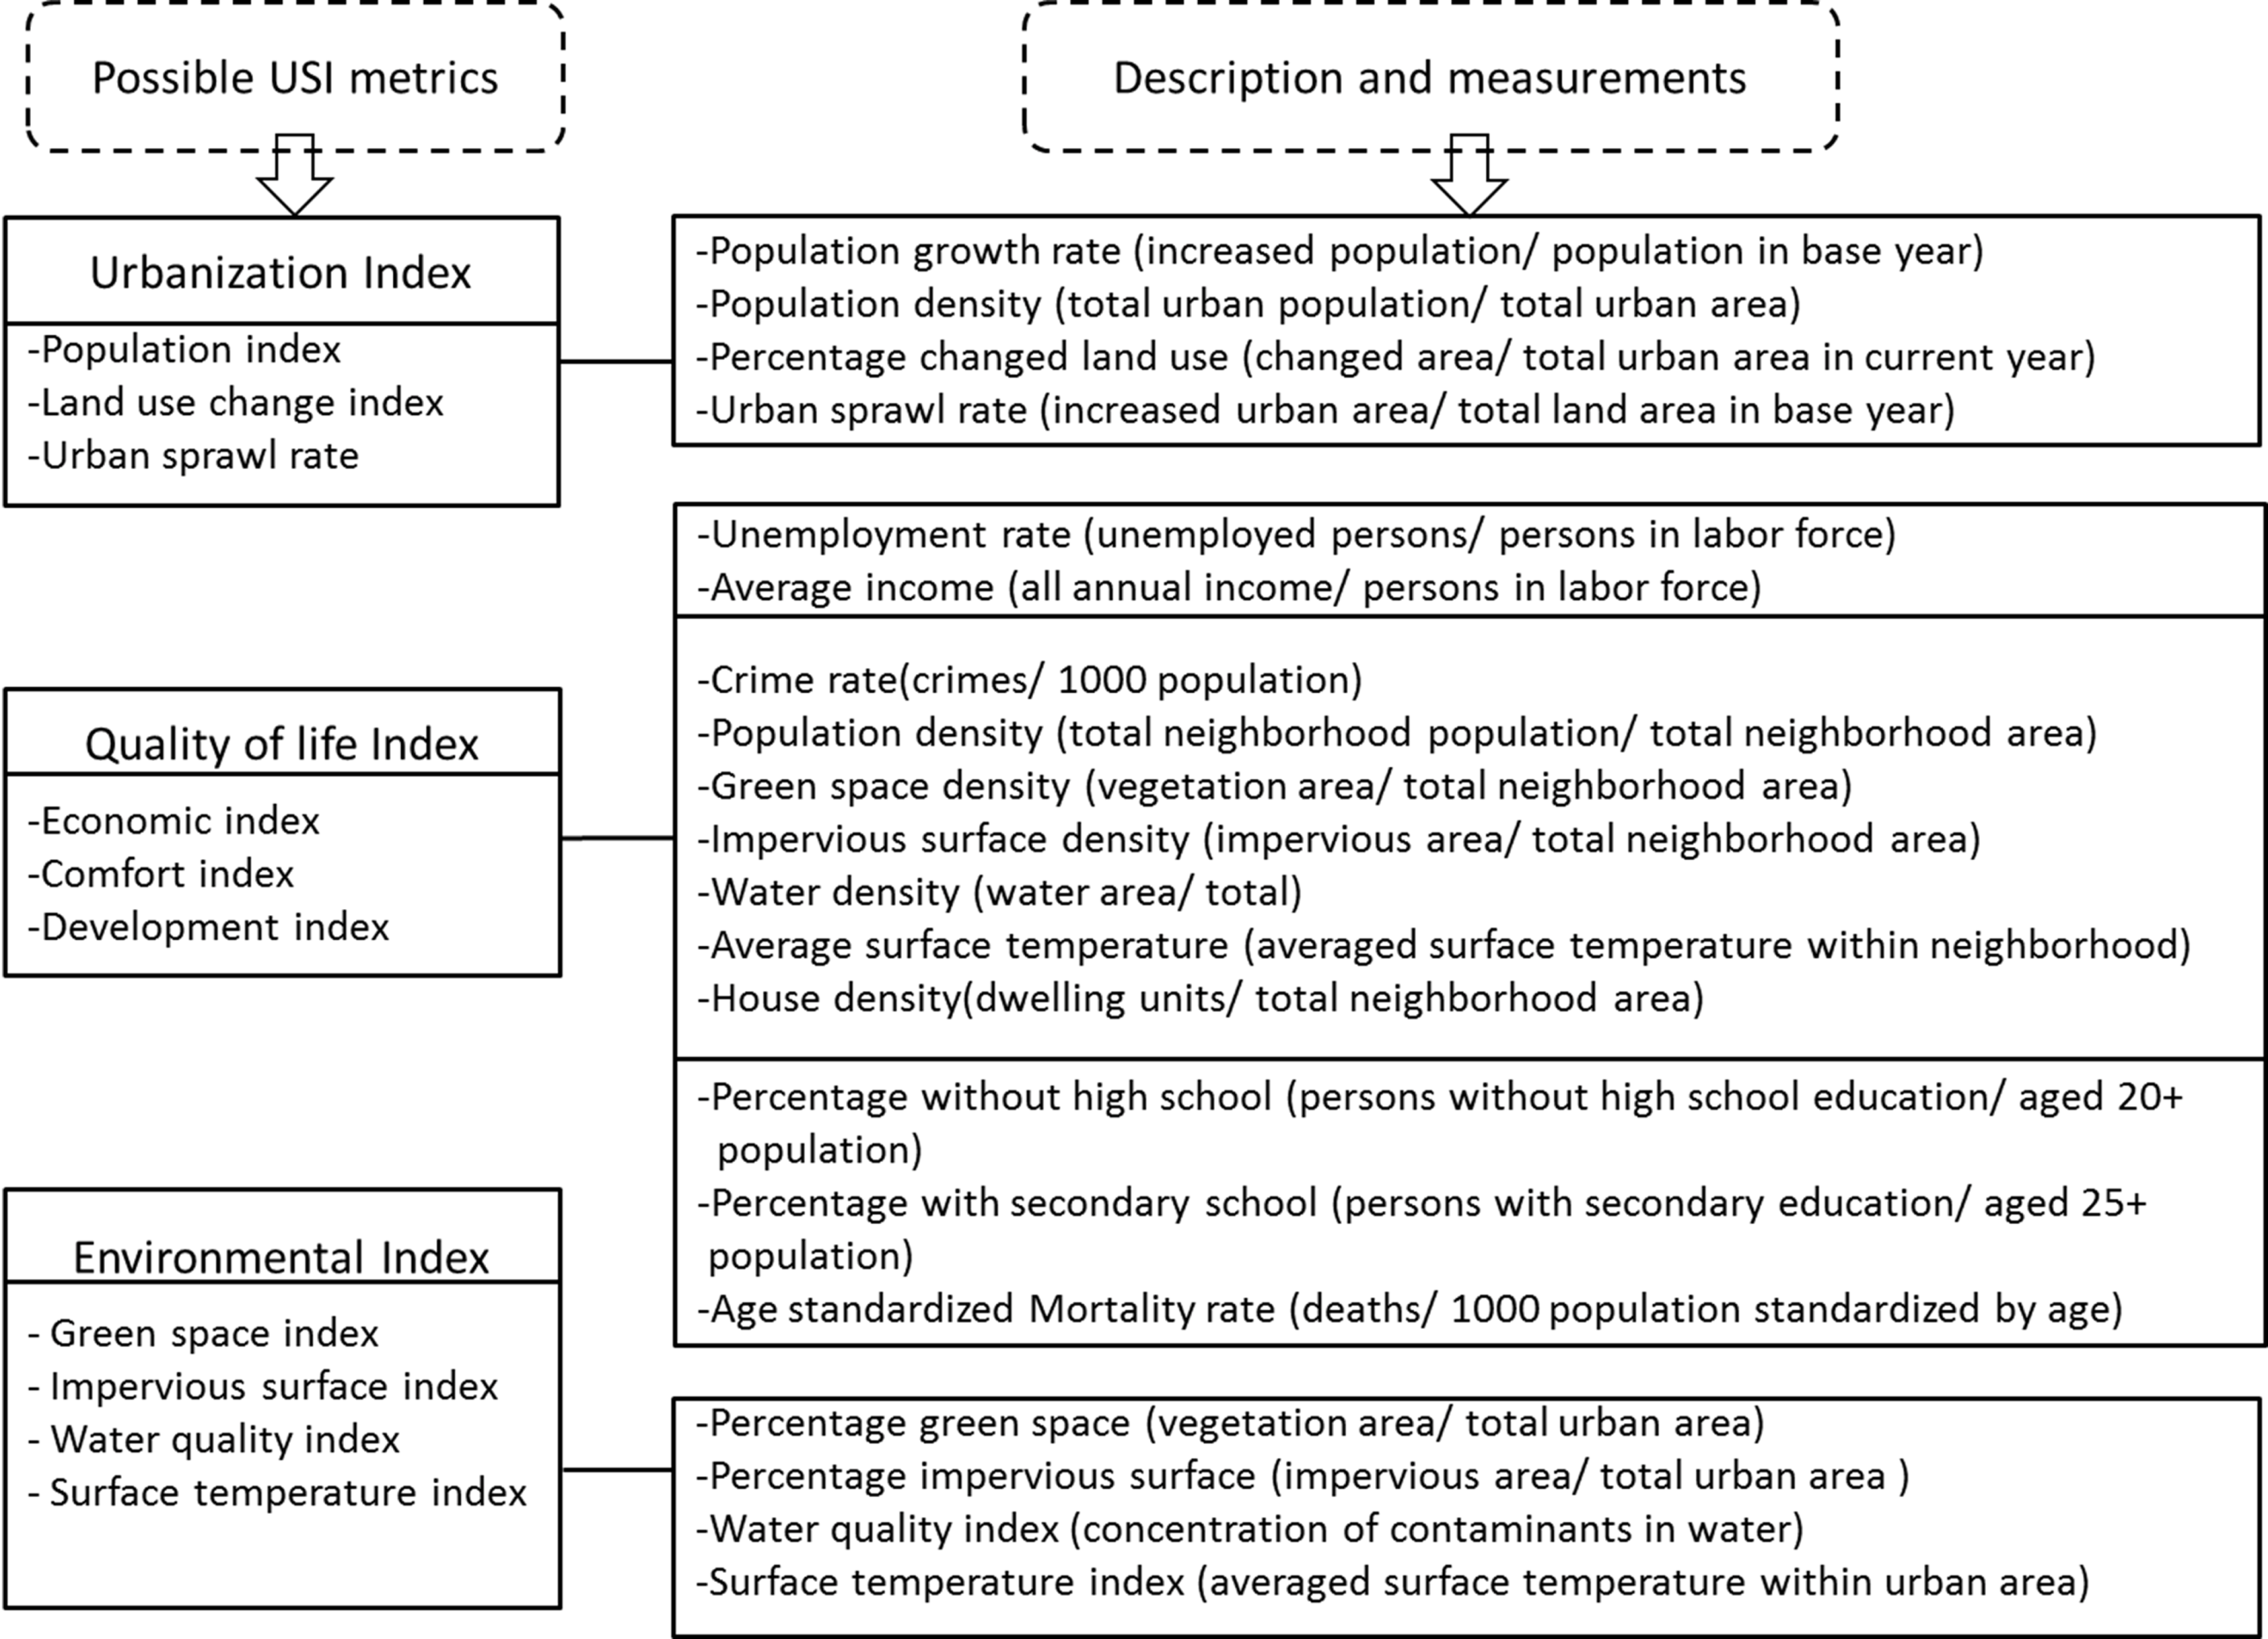
5.4. Indicator Evaluation and Determination

To build trust and approval of the proposed USI model, the initial indicators would be evaluated against the identified selection criteria to fit the context of specific urban sustainability study. To maintain the integrity and hierarchy of the proposed USI model, the actual evaluation should be directly conducted on the specific measurements (e.g., Population growth rate, Population density, Green Space area) in replace of urban sustainability indicators [25,29]. Equal weights are supposed to give each USI selection criteria based on a simple dichotomy by marking yes or no. Measurements with more than three criteria marked yes should be selected as the final USI measurement for calculating the indicators in the integrated USI system. The evaluation process was suggested to take the form of simple questionnaire surveys among policy makers and the general public. Alternatives in more consistency with the selection criteria are possibly included in the original list of USI measurements.

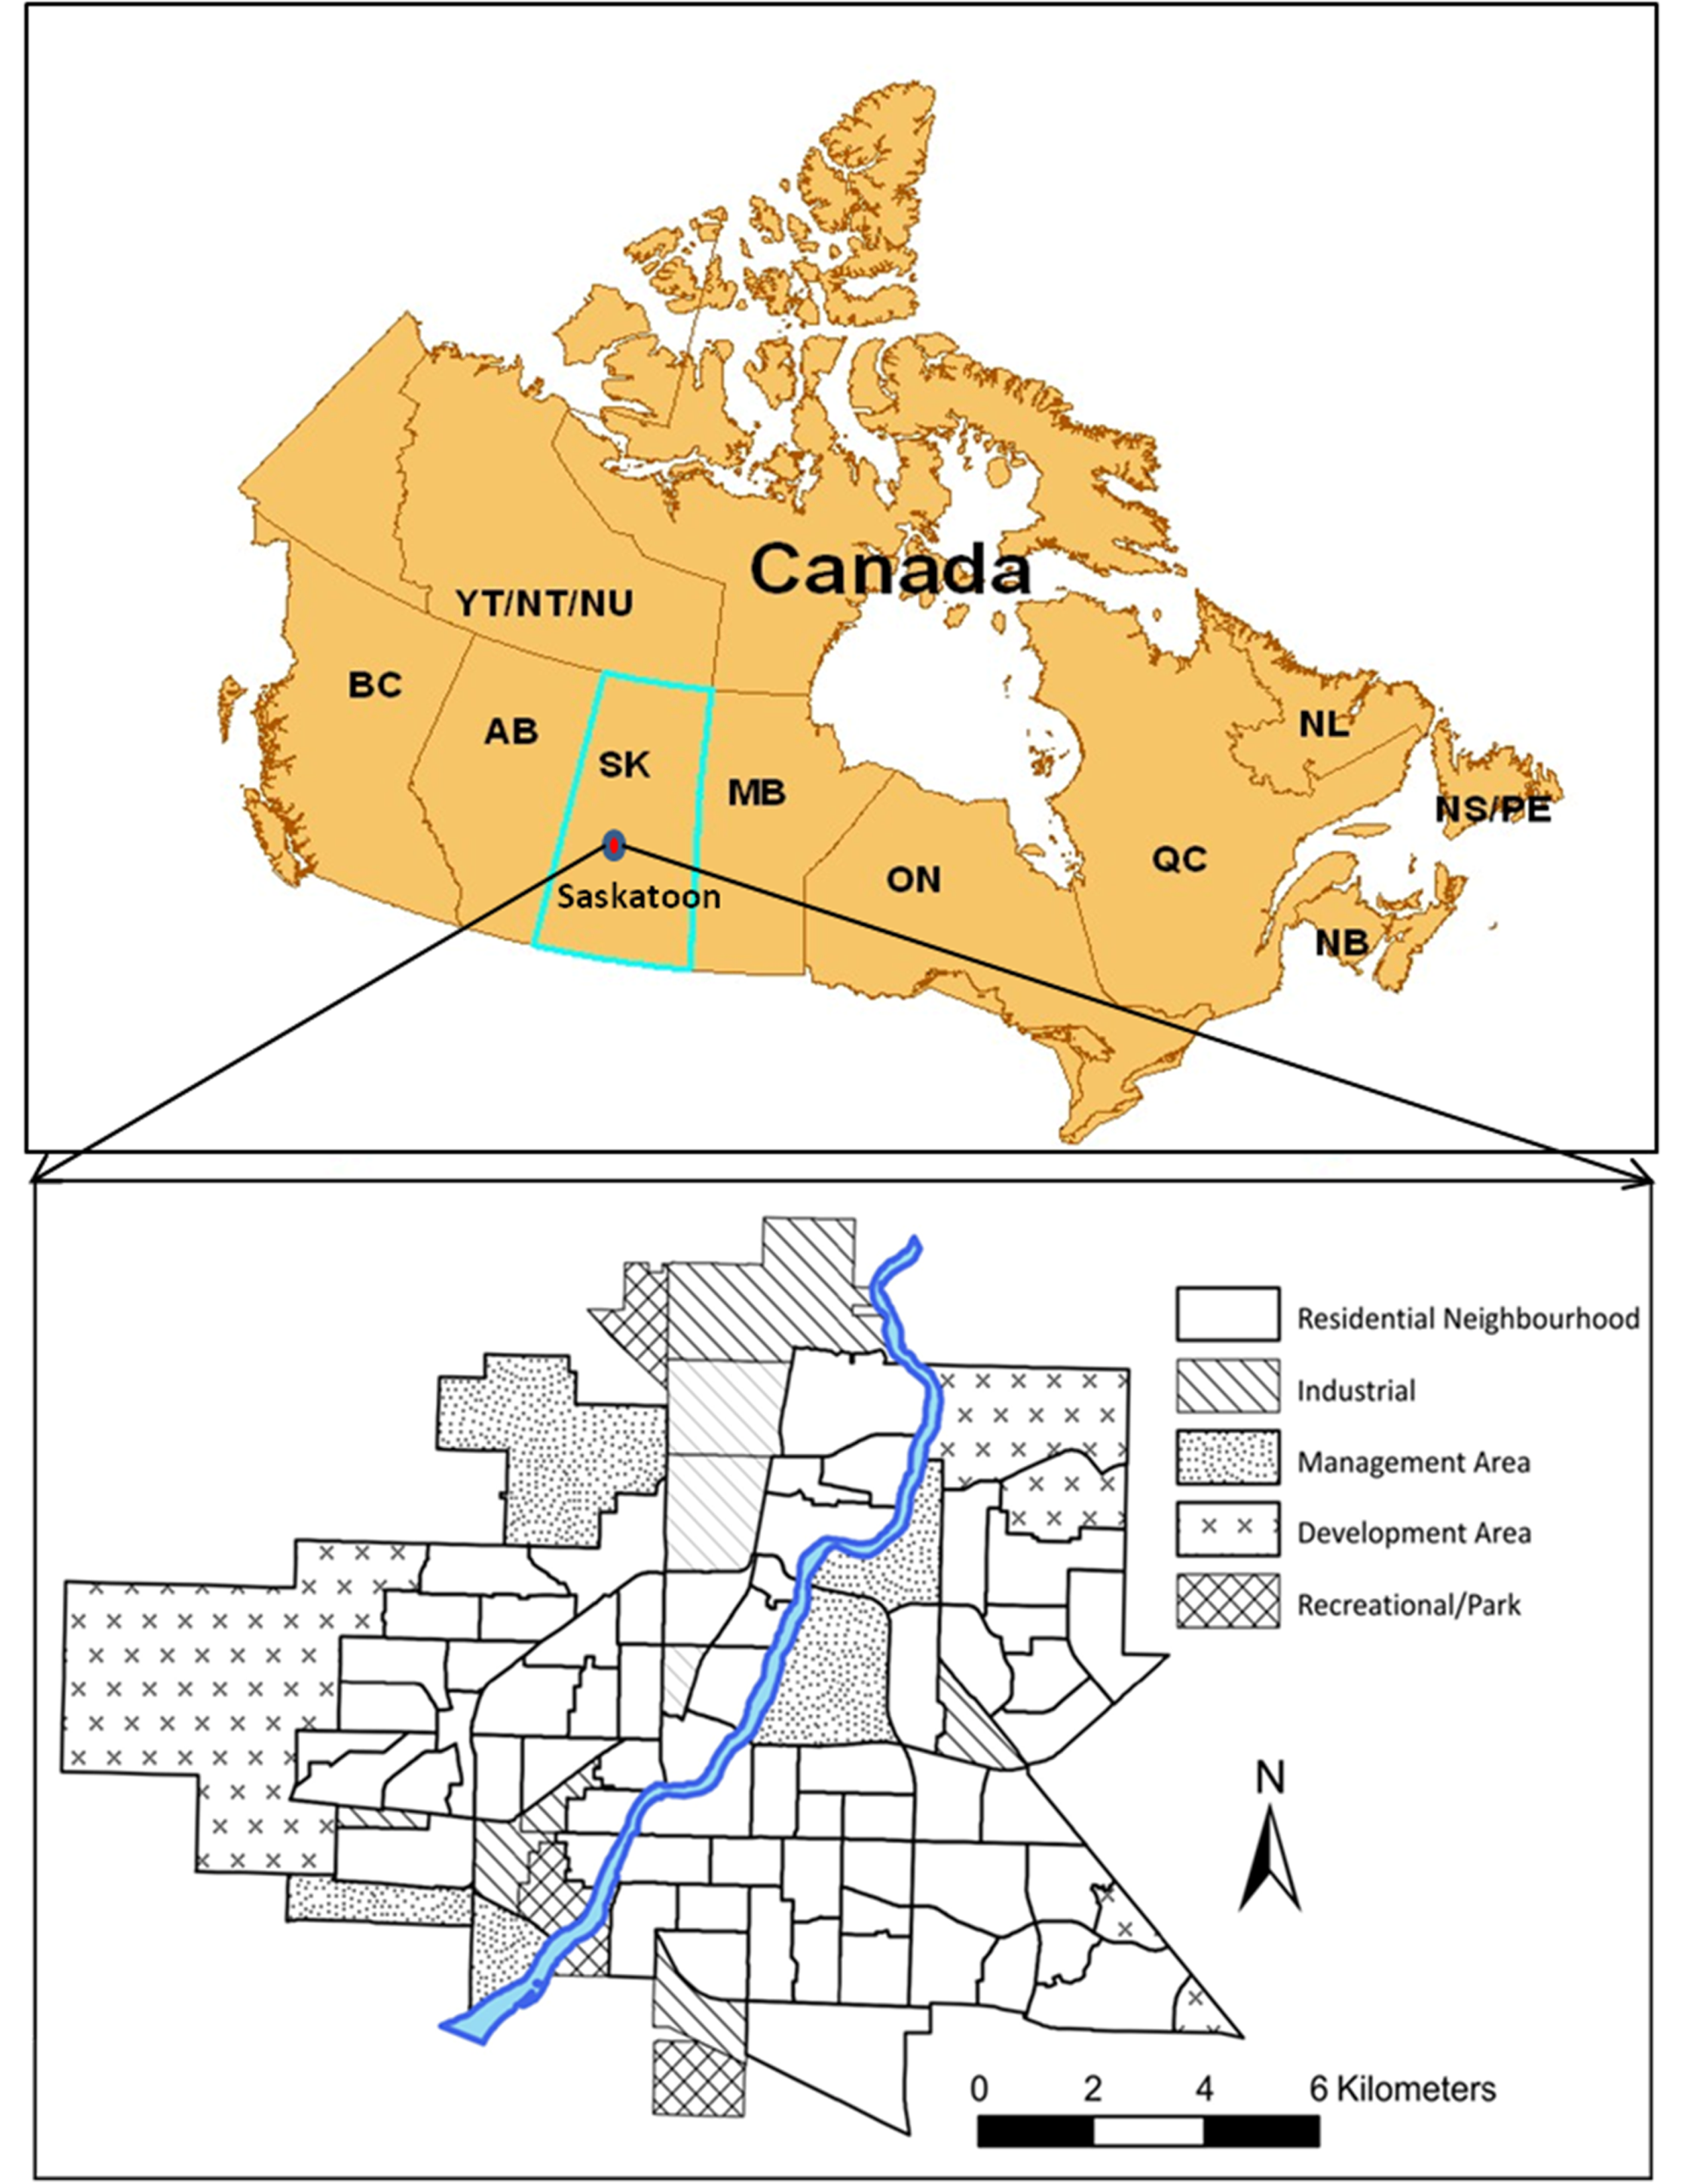
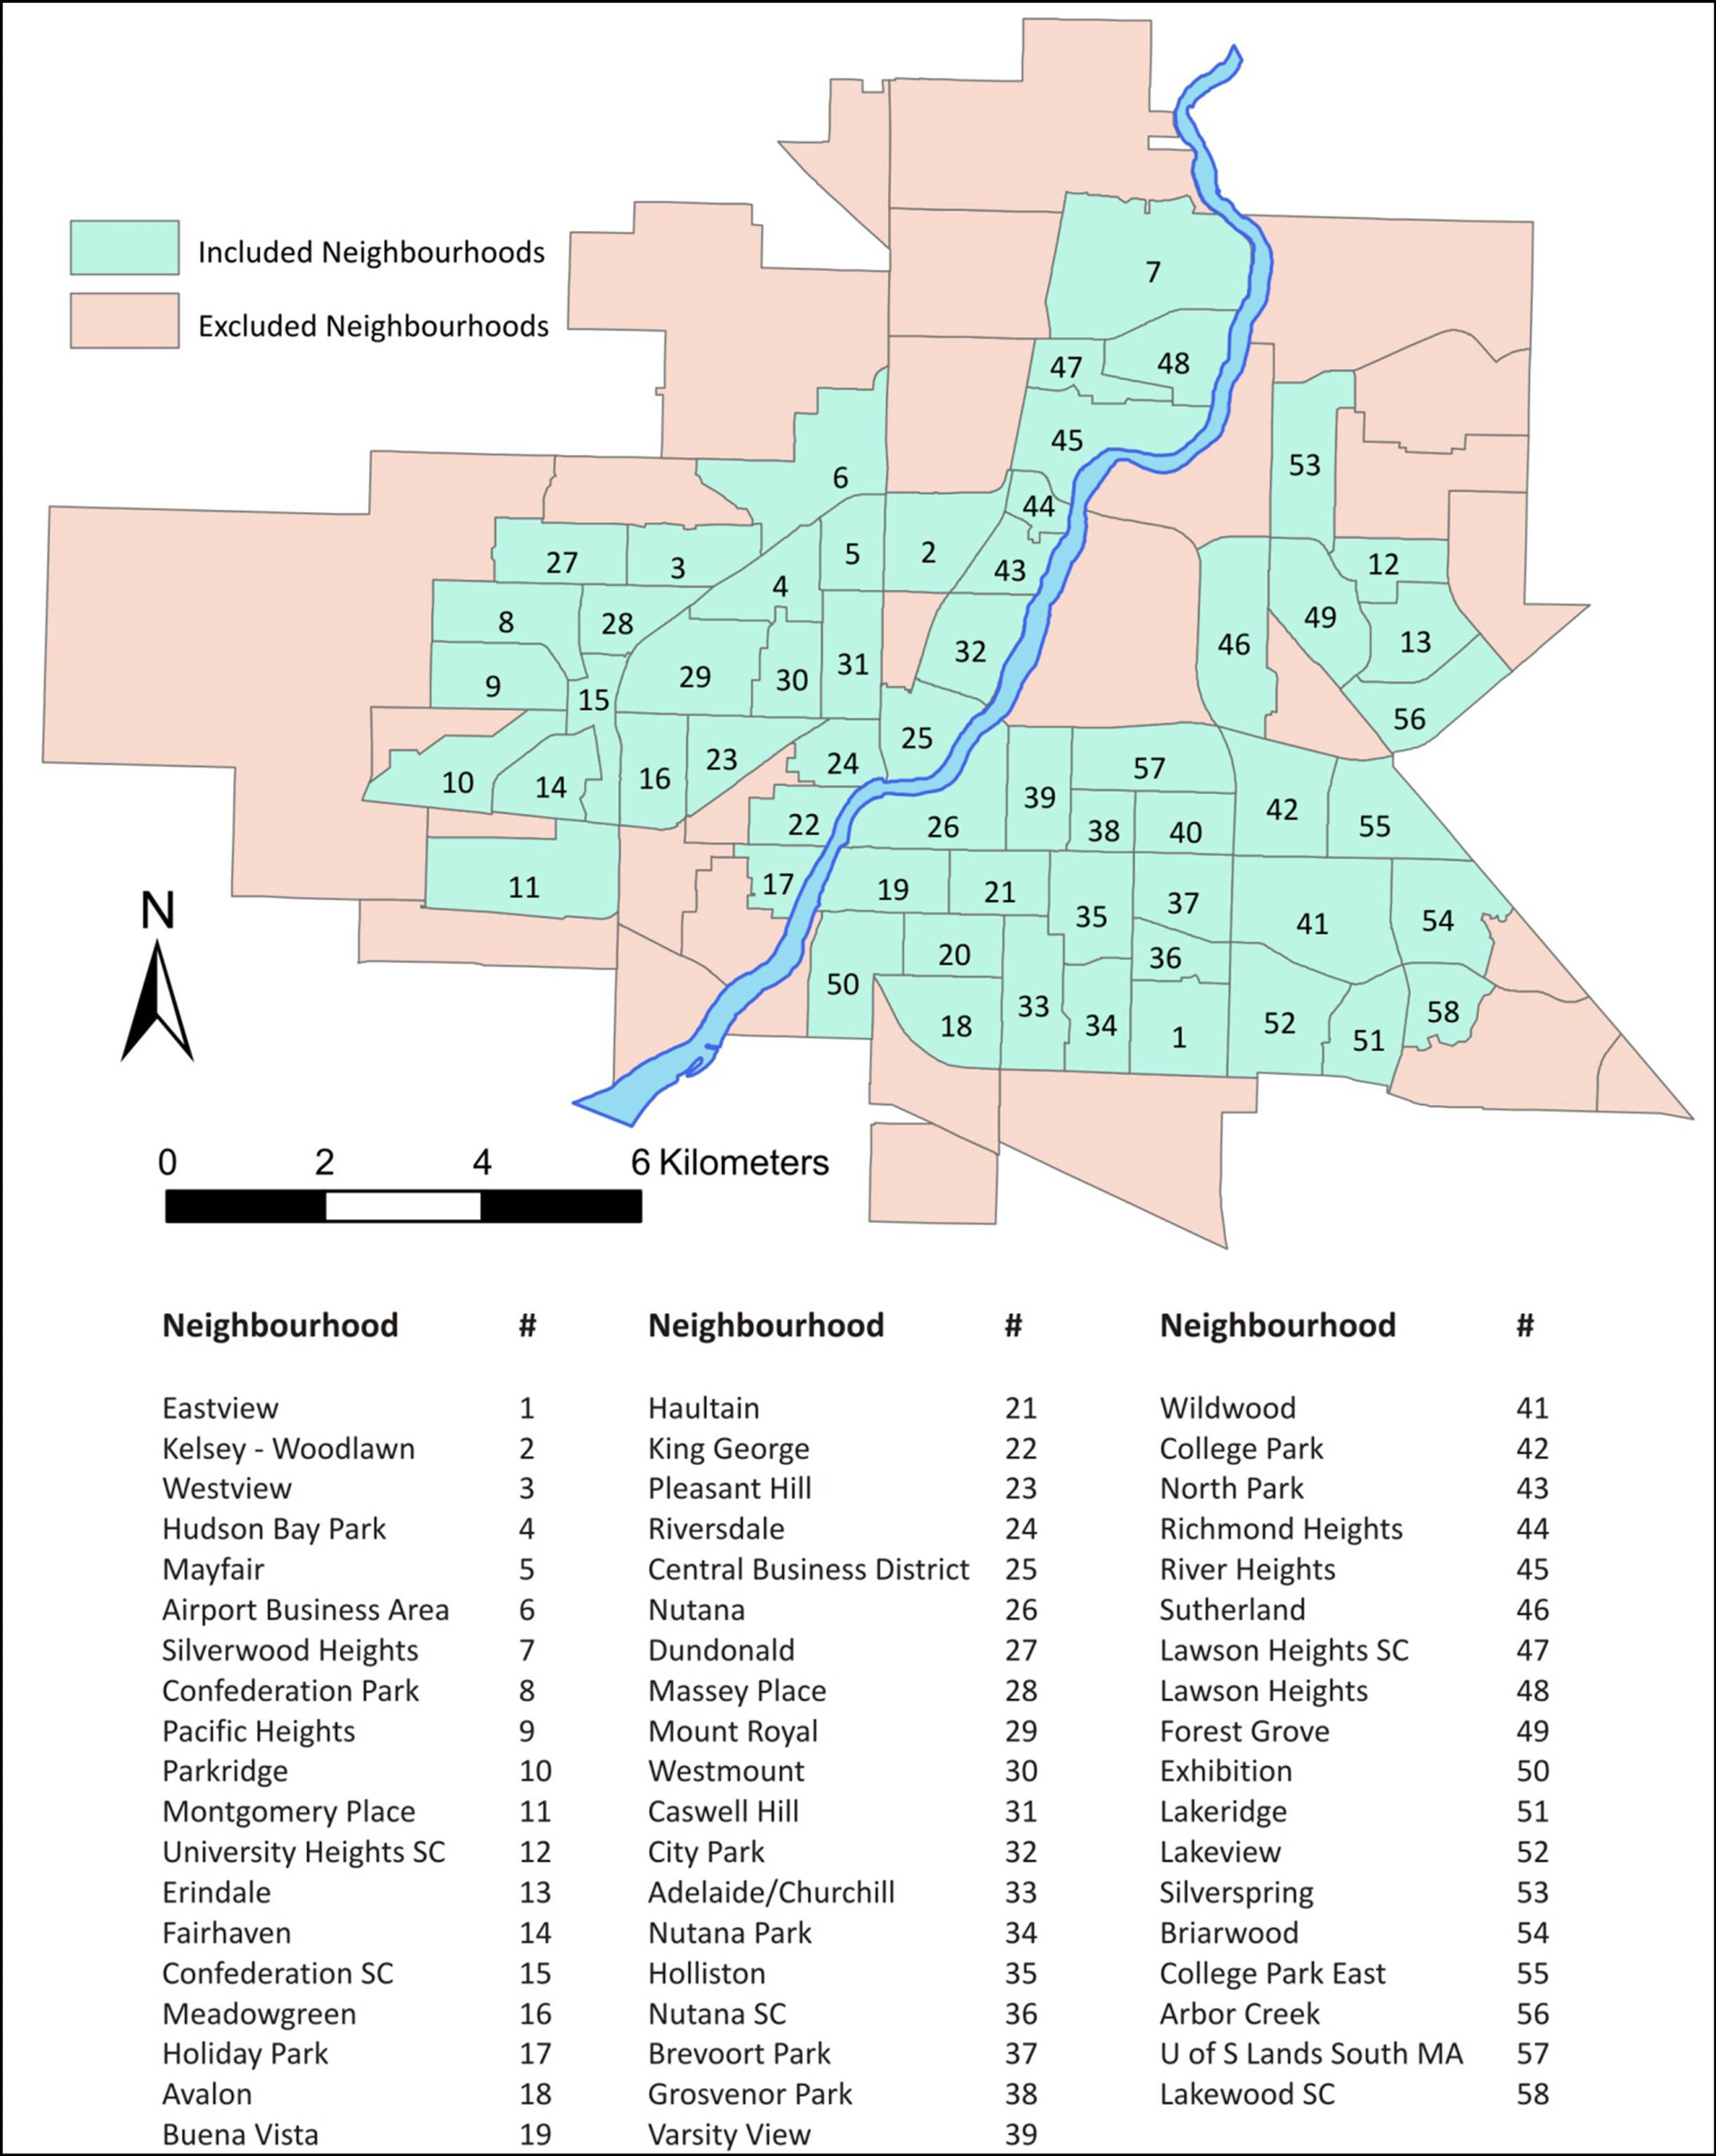
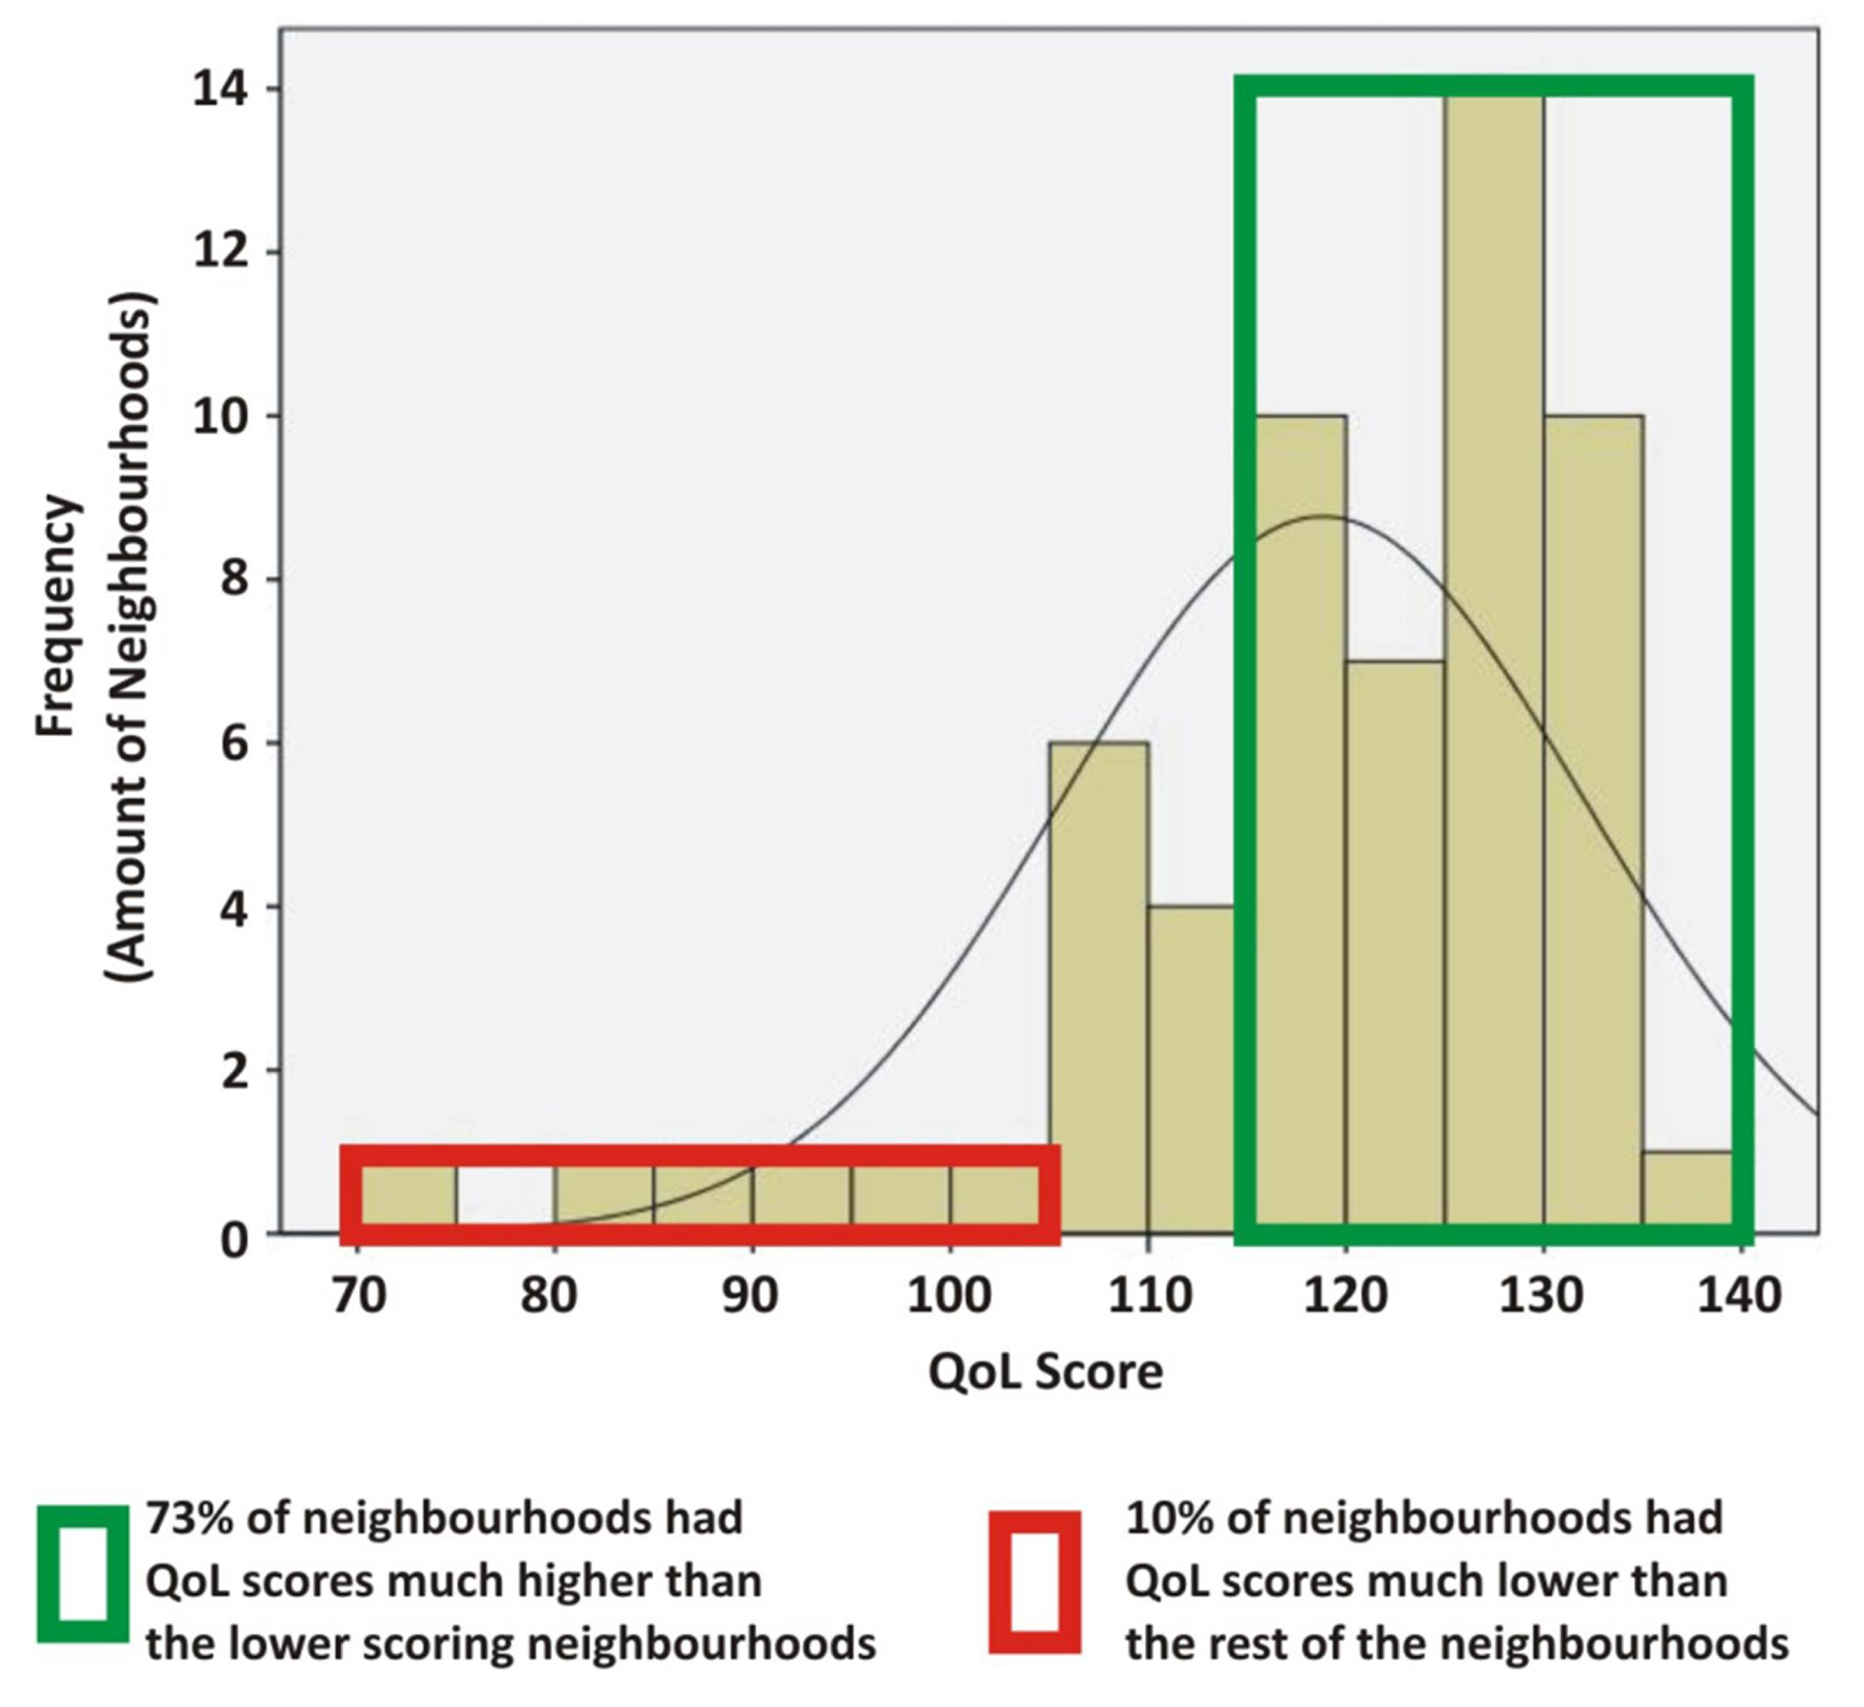
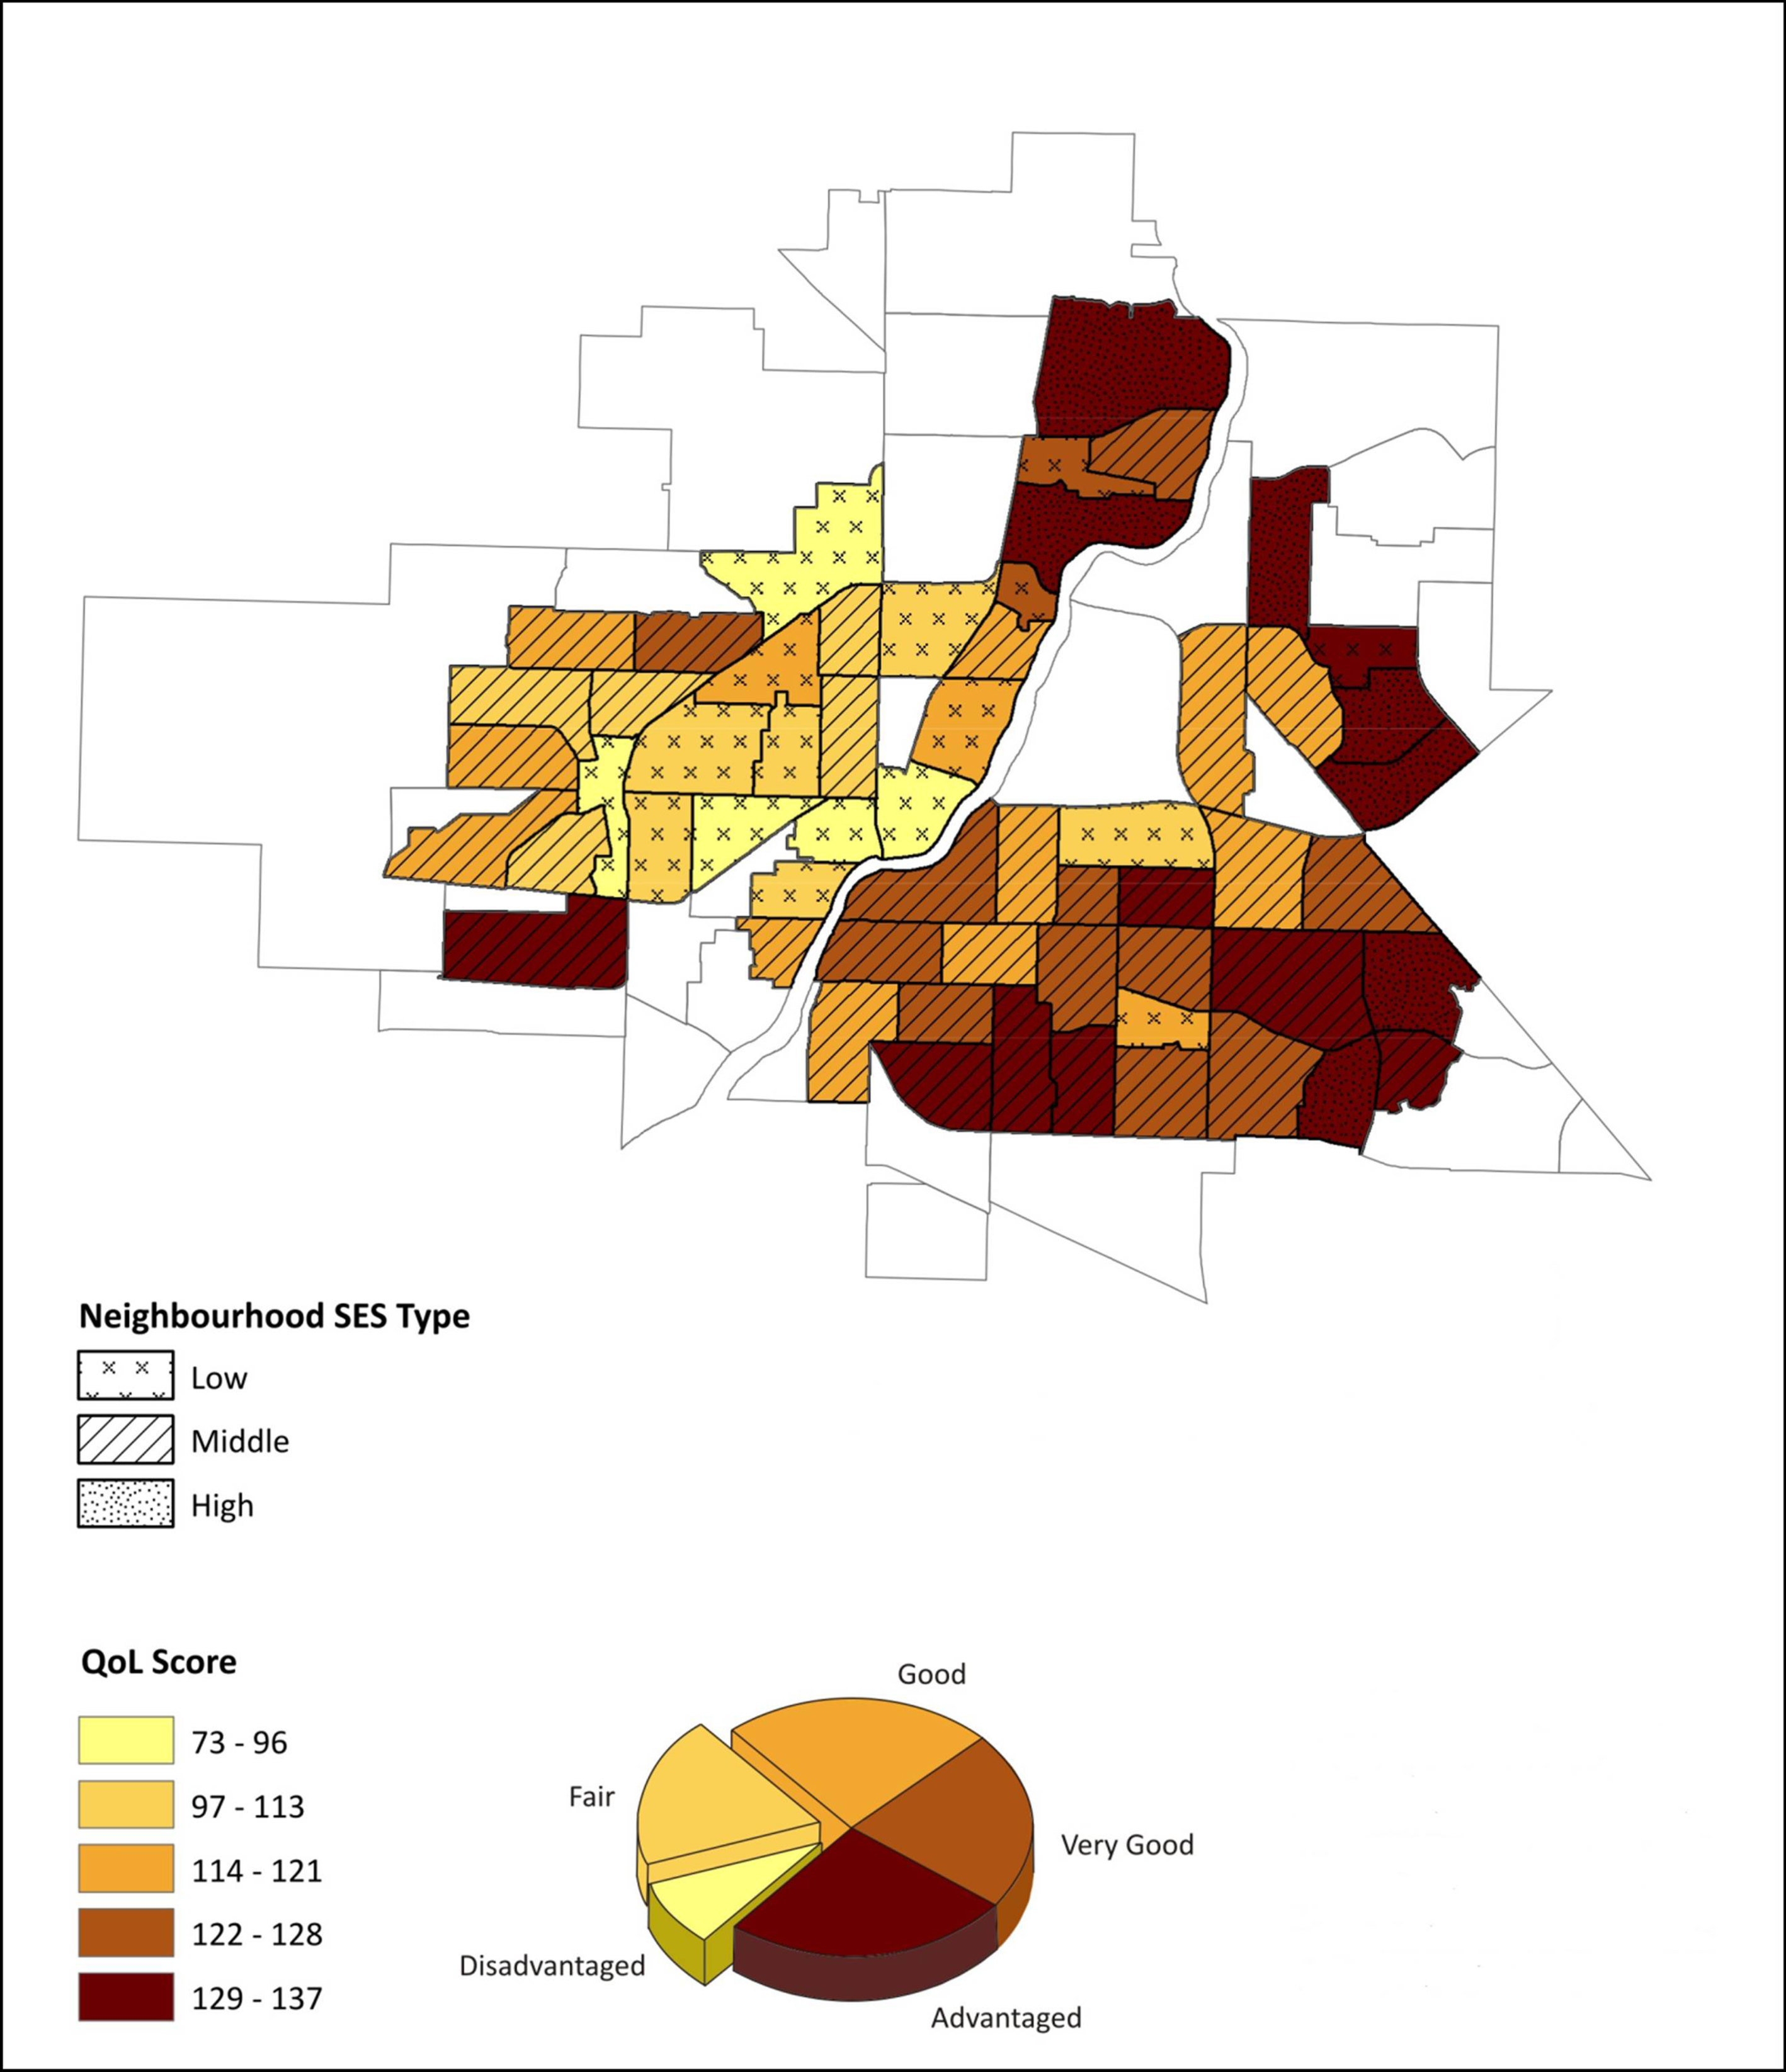
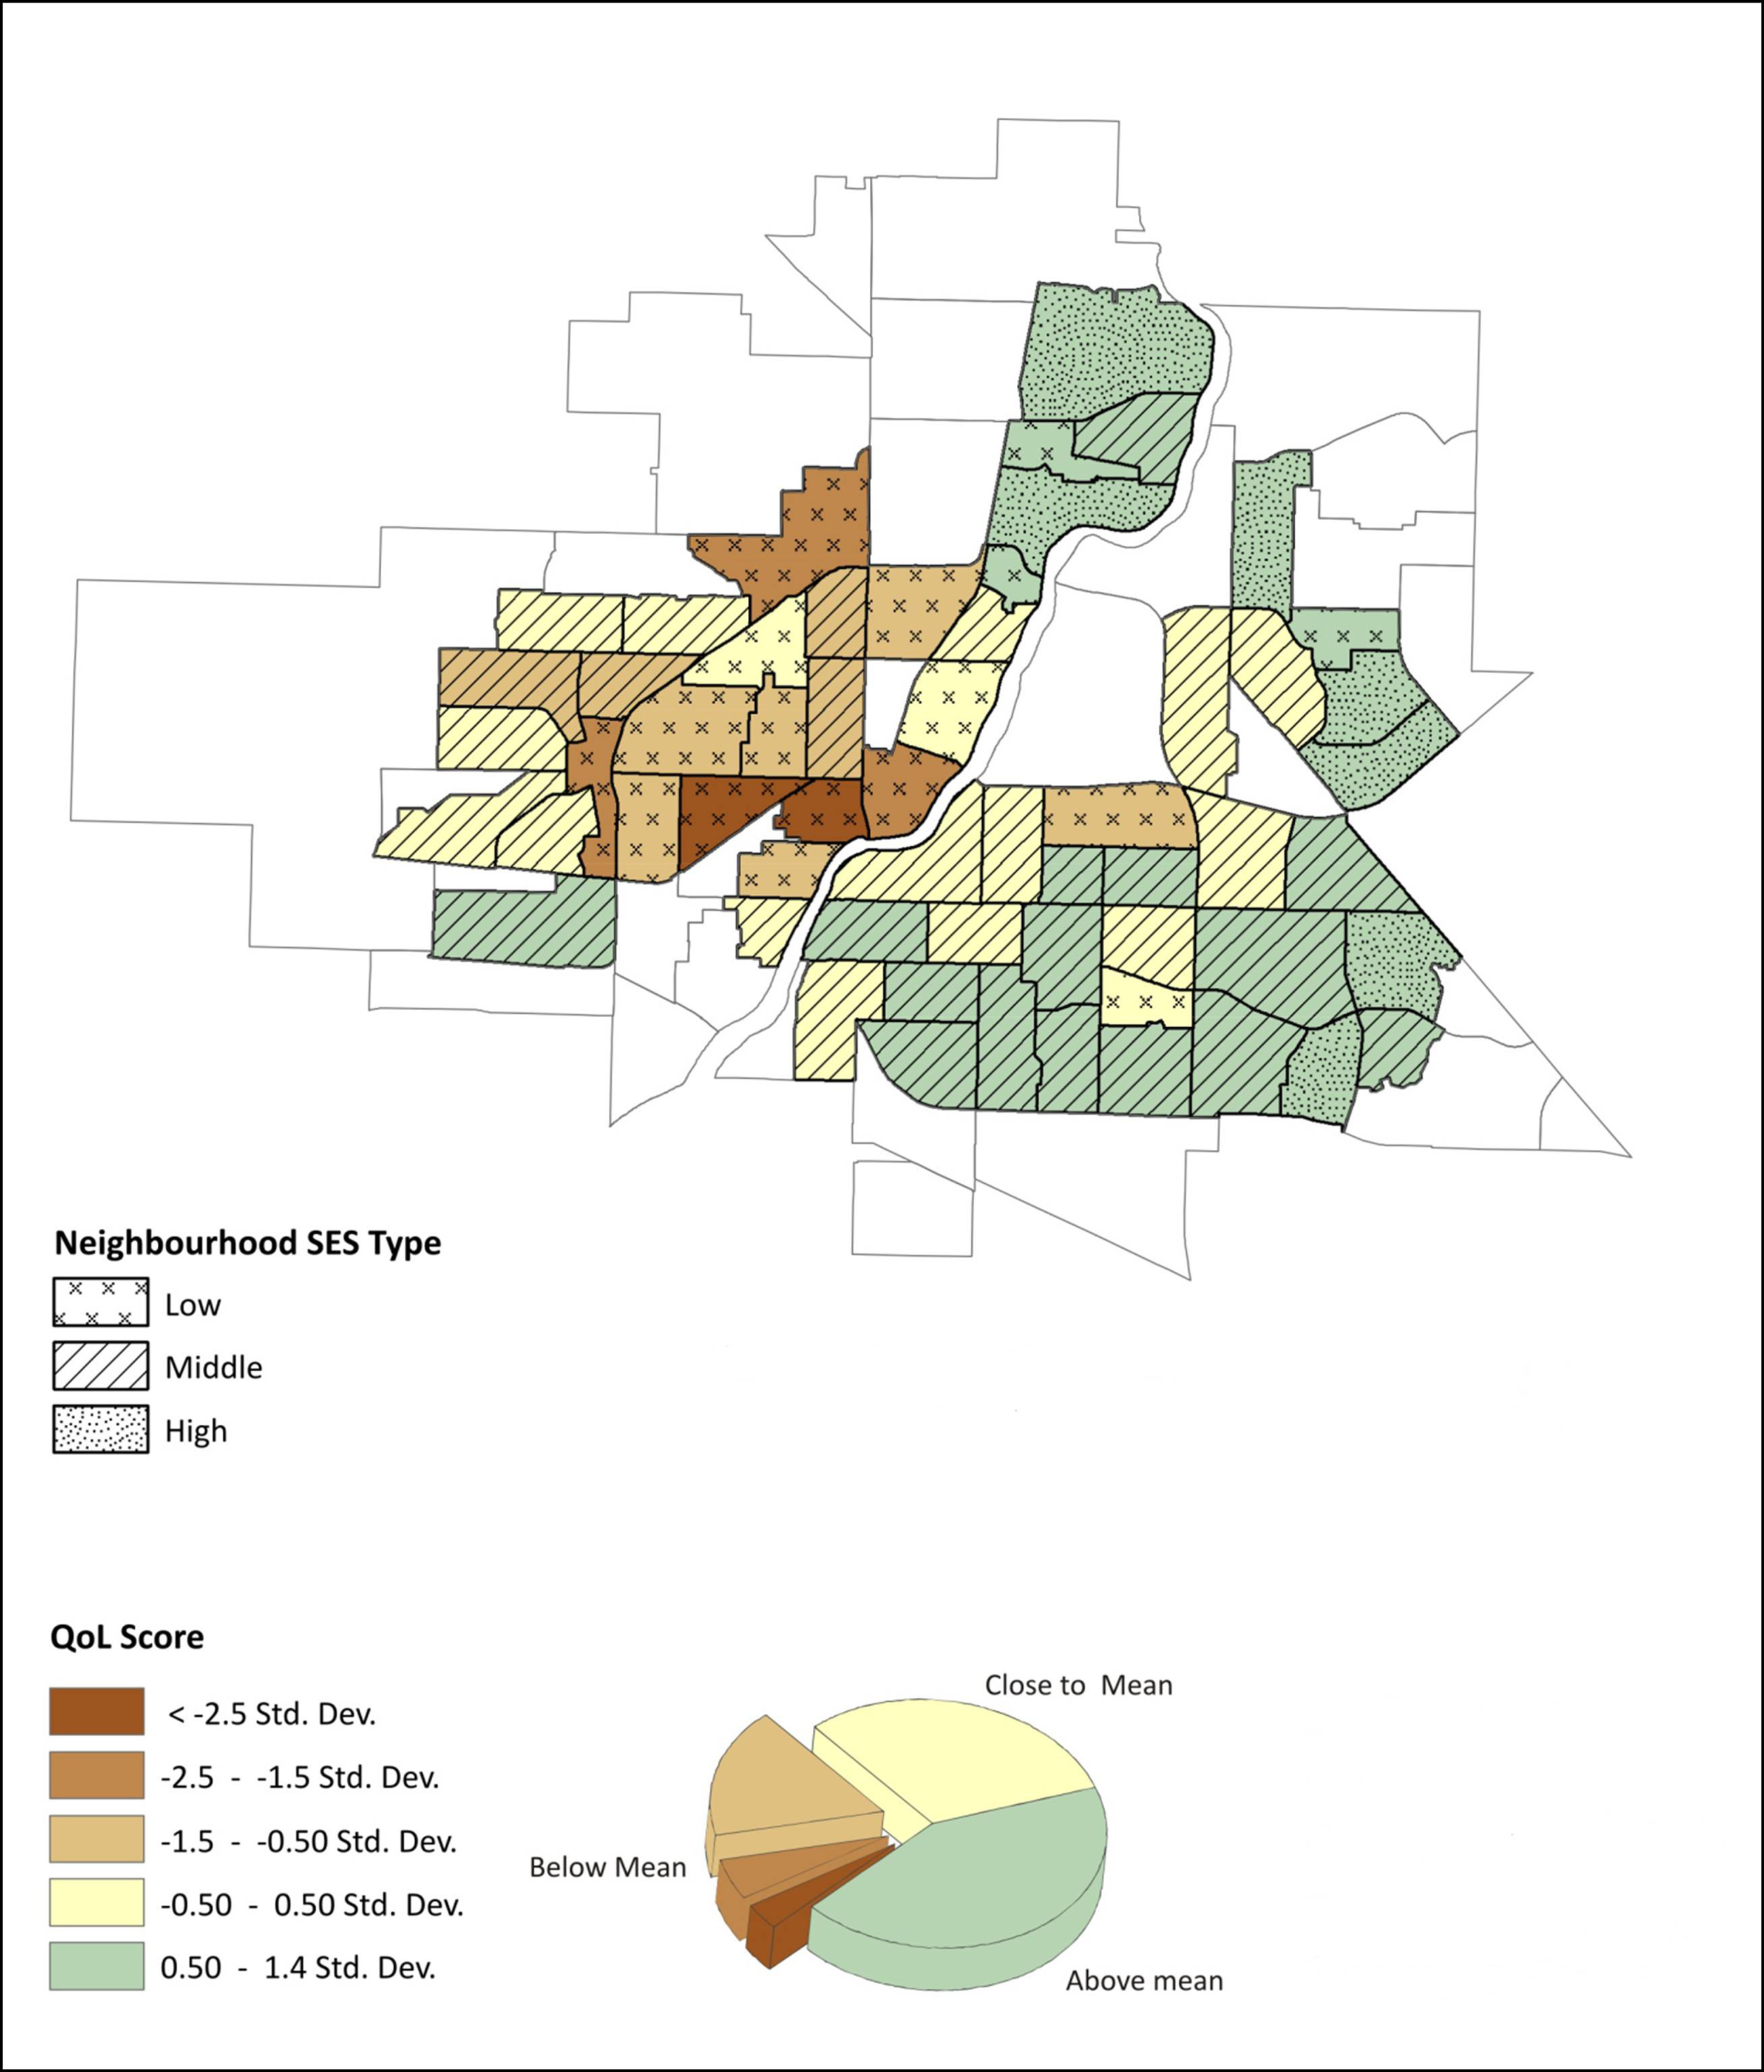
5.5. A Preliminary Case Study of the Proposed Model

To test the feasibility of the hierarchical indices system in quantifying the proposed USI model, a case study on Saskatoon Neighbourhood Quality of life index (or score) in 2007 was carried out and is shown here. This case study displays only partial results of an urban sustainability evaluation of Saskatoon based on the integrated USI model. To calculate all the USI indices for the entire hierarchical system is time-consuming due to the data collection (satellite imagery, census data, and historical maps), data processing, statistical and spatial analysis, so we could not provide a full set of quantified USI indices presently. The main purpose for this paper is to establish the conceptual integrated USI model as well as to prove the feasibility of quantifying this USI model by a hierarchical indices system. However, this expected full set of quantified indices will finally be derived to achieve the goal of monitoring and evaluating urban sustainability in our case study cities (e.g., Saskatoon).
Saskatoon (52.12°N, 106.67°W), located in the province of Saskatchewan in west-central Canada, is geographically situated in townships 36 and 37, ranging 4, 5 and 6 over 300 km north of the U.S. border. It is a medium sized prairie city with an extent of approximately 218 km2 formed during the Great Transitions of Canadian cities (1850–1945) [106,107]. Saskatoon is the commercial and educational center of Saskatchewan. It has become the fastest growing city in Canada due to its highest population growth rate driven by a dramatic increase in annual immigration [108]. Urban sustainability has been set as a goal for future development by the city council (City of Saskatoon, 2012). The total population within Saskatoon increased from less than 50,000 in the 1950s to more than 236,600 in the 2012. Concomitant with the rapid population growth is the dramatic urbanization processes (e.g., urban sprawl, land use change, etc.), which has posed great challenges on the city’s sustainable development (e.g., bare soil or green land is converted to urban areas every year). As of 2007 the City of Saskatoon consisted of 86 intra-city units 64 of which were residential neighbourhoods with the remaining 22 being used as industrial, management area, development area, and recreational park (Figure 5). Of the 64 residential neighbourhoods only 58 were included in the study due to the availability of the data for the remaining 6 neighbourhoods (Willowgrove, Blairmore Suburban Centre, Stonebridge, Hampton Village, Rosewood, and University Heights DA) in 2007 (Figure 6).
Research data including census data, subjective weights, and spatial data were acquired from secondary sources including the City of Saskatoon, Elections Saskatchewan, the Saskatoon Police Service, the Saskatoon Health Region, and the Community University Institute for Social Research (CUISR)’s report entitled “Tracking Quality of Life in Saskatoon: Summary of Research, 2007 Iteration”. This data was stored, manipulated, and analyzed with the use of a GIS in order to carry out index calculation and spatial analysis.
Figure 5. Study area: neighbourhoods in Saskatoon, Canada.
Sustainability 05 00524 g005
Figure 6. Study area: included and excluded neighbourhoods in Saskatoon, Canada.
Sustainability 05 00524 g006
The calculated results of the subjectively weighted QOL index for the 58 study neighbourhoods in Saskatoon are displayed in Table 1. Statistical results show that QOL score ranges from 73.24 in Forest Grove to 137.11 in University Heights SC with a mean score of 118.82. A negative skew value of -1.47 suggests that the majority of Saskatoon neighbourhoods have a QOL score above the mean. The kurtosis value of 2.37 indicates that a significant number of neighbourhoods are concentrated in a certain QOL index range (Figure 7).
Table 1. Saskatoon neighbourhood QOL index ( score) in 2007.
NeighbourhoodSubjectively Weighted QOL indexNeighbourhoodSubjectively Weighted QOL Score
Adelaide/Churchill132.31Lakeview126.58
Airport Business Area88.43Lakewood SC137.11
Arbor Creek130.56Lawson Heights126.64
Avalon130.06Lawson Heights SC125.79
Brevoort Park123.12Massey Place110.36
Briarwood130.50Mayfair105.27
Buena Vista126.01Meadowgreen107.57
Caswell Hill109.05Montgomery Place130.24
Central Business District92.29Mount Royal112.05
City Park120.27North Park121.32
College Park117.57Nutana124.03
College Park East126.57Nutana Park132.85
Confederation Park109.29Nutana SC117.72
Confederation SC95.73Pacific Heights116.35
Dundonald119.55Parkridge117.70
Eastview127.22Pleasant Hill81.27
Erindale129.45Queen Elizabeth128.21
Exhibition115.32Richmond Heights127.57
Fairhaven112.65River Heights130.47
Forest Grove121.40Riversdale73.24
Greystone Heights128.70Silverspring129.18
Grosvenor Park125.52Silverwood Heights129.41
Haultain120.72Sutherland117.61
Holiday Park115.64U of S Lands South MA111.55
Holliston126.59University Heights SC133.95
Hudson Bay Park119.48Varsity View119.26
Kelsey - Woodlawn100.55Westmount109.76
King George109.30Westview123.39
Lakeridge130.23Wildwood130.91
Figure 7. Histogram for Saskatoon neighbourhood QOL index in 2007.
Sustainability 05 00524 g007
To determine the accuracy of the subjectively weighted QOL index, Saskatoon neighbourhood QOL scores were classified using two classification schemes: natural break method (or Jenks method) and standard deviation method. The former scheme represents the most distinct groupings of QOL while the latter shows how much a neighbourhood’s QOL index deviates from the mean. Both classification results were then compared to the socio-economic status (SES) of the neighbourhoods as determined by CUISR. This was done to discern if higher QOL scores corresponded with High and Middle SES neighbourhoods and if lower QOL scores corresponded with the Low SES neighbourhoods. Results (Figure 8 and Figure 9) demonstrated that the majority of Low SES neighbourhoods corresponded with the neighbourhoods having the lowest QOL scores. In both schemes, 11 out of 17 Low SES neighbourhoods represented the lowest QOL scores. It was also found that all 7 High SES neighbourhoods corresponded with the group of highest QOL scores. An overwhelming majority of the Middle SES neighbourhoods were either classified as above the mean or close to the mean (30 out of 34) or as good, very good, and advantaged (29 out of 34). The map comparison led to the conclusion that the QOL gap described by CUISR is reflected in our subjectively weighted QOL index’s results.
Figure 8. Map of Natural Breaks Classification of Neighbourhood QOL in Saskatoon.
Sustainability 05 00524 g008
Figure 9. Map of Standard Deviation Classification of Neighbourhood QOL in Saskatoon.
Sustainability 05 00524 g009
The spatial pattern of Saskatoon neighbourhood QOL index was detected based on two cluster statistical analysis named Luc Anselin’s Local Indicators of Spatial Autocorrelation (LISA) and Getis-Ord Gi. The mapped results (Figure 10, Figure 11) show the clusters and outliers found to be significant at the 95% confidence interval. Both spatial conceptualizations in Figure 10 show a cluster of low values on the west side in the core neighbourhoods and a cluster of high values in the southeast corner of the city. The k-nearest conceptualization differs slightly and recognizes Montgomery Place as a feature with a high value surrounded by lower values. Nutana SC is also recognized as an outlier but is a low value surrounded by higher values. The spatial autocorrelation statistics calculated by Getis-Ord Gi* (Figure 11) strongly resemble the findings of LISA. Z score returned determines whether high or low values cluster together. The larger statistically significant positive Z score represents a more intense clustering of high values or hot spot; the smaller statistically significant negative Z score indicates a more intense clustering of low values or cold spot. Both spatial conceptualizations depict a cold spot in the core neighbourhoods of the west side. The same clustering of high values found by LISA is also reported in the southeast part of the study area. However this hot spot is more expansive than reported by LISA. Both local measures of spatial autocorrelation and both spatial conceptualizations reaffirmed one another’s findings.
Figure 10. Spatial detection of Saskatoon neighbourhood QOL index based on LISA results.
Sustainability 05 00524 g010
Like a significant amount of inner city neighbourhoods in cities across Canada and North America, neighbourhoods with lowest QOL scores are among the oldest areas of Saskatoon are the core areas where poverty flourishes. There is a disparity between these neighbourhoods and other parties of the city when it comes to things such as health and crime [109,110]. Neighbourhoods with high QOL scores clustered on the east side of the city further highlight this disparity. There is a perceived east-west divide that is common among Saskatoon residents and the authors, as residents of the city, are well aware of it. Clearly, this divide does exist in some capacity. On the other hand, not all neighbourhoods fit into this perception perfectly. Outliers included the neighbourhoods Montgomery Place and Nutana SC. Montgomery Place, although on the outskirts of the core neighbourhoods, was recognized as having significantly higher QOL than its surrounding neighbourhoods. It was developed in the mid1940s as a neighbourhood for returning WWII veterans and their families, more considered as a resort village than a neighbourhood due to an open park-like feeling. Nutana SC, which had a significantly lower QOL scores than its surrounding neighbourhoods, consists mainly of senior citizens and this may be in part why QOL is significantly lower here. Age was found to be a significant determinant when QOL was rated as lower [111].
As part of our research on urban sustainability evaluation based on the integrated USI model, the case study in this paper provides an example of QOL index calculation and spatial pattern detection. For other USI indices calculation, information extracted from satellite imagery and historical maps (e.g., urban land use change, urban sprawl, green space, etc.) are needed to be incorporated. In addition, to detect the urban sustainable progress between inter-generation, USI indices in different time periods are required to be compared; this could be conducted in GIS platform based on its spatial-temporal analysis functions.
Figure 11. Spatial detection of Saskatoon neighbourhood QOL index based on Getis-Ord Gi* results.
Sustainability 05 00524 g011

6. Discussion and Conclusions

The proposed integrated USI model has great potential in improving urban sustainability evaluation by overcoming the shortages found in most of the existing USI models. First, it is capable of assessing both inter-generational equity and intra-generational equity based on temporal and spatial analysis using advanced geomatic approaches. Also, it can provides a more comprehensive evaluation of possible domains relevant to urban sustainability, which is well suited for extracting the cause-effect relationships or statistical linkages among different domains. In addition, the hierarchical multiple indices system allows improved measurements of USIs as well as quantitative comparison between different indicators.
In spite of the advantages shown by this integrated USI model, it cannot still guarantee an absolutely precise evaluation of urban sustainability due to the unavoidable limitations. Urban sustainability is a very broad topic which involves a wide range of urban life aspects, such as biodiversity, energy use, water consumption, air pollution, noise level, transportation mode, mental health, etc. Different cities have diverse definitions or goals for urban sustainability concerning their own specific development status. Our proposed USI model covers the most fundamental domains of urban sustainability (social, economic, environmental, and human well-being). It is impossible to for this USI model to include all existing aspects of urban sustainability. However, it performs as a more open model where the integrity and comprehensiveness of the model can be strengthened by incorporating additional domains and/or indicators specific to different urban circumstances or development goals.
In summary, the integrated USI model development is considered a necessary first step towards an accurate evaluation of urban sustainability. It not only lays a theoretical basis for a comprehensive interpretation of urban sustainability, but also provides an open framework for future research to exploit multiple techniques and multiple data sources. This study also has practical values in urban planning, city development, public polices, and environmental impact assessment. The USI hierarchical system plays an important role in formulating a holistic or specific analysis of urban sustainability based on the multiple indices derived at different levels. For future application of this proposed model, it is vital to reach public audiences (e.g., policy makers, planners, engineers, and even individual residents) for sharing information to increase the awareness of urban sustainability as well as linking policy-making with public participation as well as academic communities. Since the advantages of geomatic techniques used in the quantification of USI model, visual simulations or demonstrations can be effective strategies for vividly demonstrating the dynamic change of urban sustainability progress to the public.

Acknowledgments

This research was supported by President SSHRC Fund, University of Saskatchewan, Canada. This research was also supported by Sustainable Cities International (SCI), Canada. The authors are grateful to the anonymous reviewers whose suggestions have been helpful in preparation of the manuscript. The authors also would like to acknowledge Jordon Steeg who helped to improve the English language of this manuscript.

Conflict of Interest

The authors declare no conflict of interest.

References and Notes

  1. UN. 2006. World Urbanization Prospects: the 2005 Revision Population Database. Available online: http://esa.un.org/unup/ (accessed on 15 June 2012).
  2. UNFP (United Nations Population Fund). State of world population 1999. United Nations Publications, New York. 1999. Available online: http://www.unfpa.org/swp/1999/contents.htm (accessed on 15 June 2012).
  3. Birch, E.L.; Wachter, S.M. Global Urbanization, Part 1. Twenty-First-Century Population Prospect: Emerging Needs; University of Pennsylvania Press: Philadelphia, PA, USA, 2011. [Google Scholar]
  4. McGranahan, G.; Marcotullio, P.J.; Bai, X.; Balk, D.; Braga, T.; Douglas, I.; Elmqvist, T.; Rees, W.; Satterthwaite, D.; Songsore, J.; et al. Urban Systems. Current State and Trends: Findings of the Condition and Trends Working Group. Ecosystems and Human Well-being; Island Press: Washington, DC, USA, 2005; pp. 795–825. [Google Scholar]
  5. Bruntland, G. Our Common Future: The World Commission on Environment and Development; Oxford University Press: New York, NY, USA, 1987. [Google Scholar]
  6. Nijkamp, P.; Perrels, A.H. Sustainable Cities in Europe, 1st ed; Earthscan: Sterling, London, UK, 2009. [Google Scholar]
  7. Sanders, J.C. Seattle and the Roots of Urban Sustainability: Inventing Ecotopia; University of Pittsburgh Press: Pittsburgh, PA, USA, 2010. [Google Scholar]
  8. Slavin, M.I. Sustainability in America's Cities: Creating the Green Metropolis; Island Press: Washington, DC, USA, 2011. [Google Scholar]
  9. Tamagawa, H. Sustainable Cities: Japanese Perspectives on Physical and Social Structures; United Nations University Press: Tokyo, Japan, 2006. [Google Scholar]
  10. Tsenkova, S. Urban Sustainability in Europe and North America: Challenges and Opportunities; University of Calgary: Calgary, AB, Canada, 2005. [Google Scholar]
  11. Newman, L. The virtuous cycle: incremental changes and a process-based sustainable development. Sustain. Dev. 2007, 15, 267–274. [Google Scholar]
  12. Mebratu, D. Sustainability and sustainable development: Historical and review. Environ. Impact. Assess. Rev. 1998, 18, 493–520. [Google Scholar]
  13. Maclaren, V.W. Developing Indicators of Urban Sustainability: A Focus on the Canadian Experience; ICURR Press: Toronto, Canada, 1996. [Google Scholar]
  14. Haughton, G. Environmental justice and the sustainable city. J. Plann. Educ. Res. 1999, 18, 233–243. [Google Scholar] [CrossRef]
  15. Alberti, M. Measuring urban sustainability. Environ. Impact Assess. Rev. 1996, 16, 381–424. [Google Scholar]
  16. British Columbia Commission on Resources and EnvironmentBritish Columbia Round Table on the Environment and the EconomyFraser Basin Management Board (Canada)State of Sustainability: Urban Sustainability and Containment; British Columbia Round Table on the Environment and the Economy: Victory, British Columbia, Canada, 1994.
  17. Næss, P. Urban planning and sustainable development. Eur. Plann. Stud. 2001, 9, 503–524. [Google Scholar]
  18. Hardoy, J.E.; Mitlin, D.; Satterwaite, D. Environmental Problems in Third World Cities; Earthscan: London, UK, 1992. [Google Scholar]
  19. Richardson, N.H. Land Use Planning and Sustainable Development in Canada; Canadian Environmental Advisory Council: Ottawa, Canada, 1989. [Google Scholar]
  20. Haughton, G.; Hunter, C. Sustainable Cities; Routledge: London, UK, 2003. [Google Scholar]
  21. Keirstead, J.; Leach, M. Bridging the gaps between theory and practice: A service niche approach to urban sustainability indicators. Sustain. Dev. 2008, 16, 329–340. [Google Scholar] [CrossRef]
  22. Huang, S.L.; Wong, J.H.; Chen, T. A framework of indicator system for measuring Taipei’s urban sustainability. Landsc. Urban. Plann. 1998, 42, 15–27. [Google Scholar] [CrossRef]
  23. Sustainable Seattle, Sustainable Seattle Indicators of Sustainable Community: A Report to Citizens on Long Term Trends in Their Community; Sustainable Seattle: Seattle, WA, USA, 1993.
  24. Local Government Management Board, Sustainability Indicators Research Project: Report of Phase 1, June 1994; Local Government Management Board: Luton, UK, 1994.
  25. Gosselin, P.; Belanger, D.; Bibeault, J.F.; Webster, A. Feasibility Study on the Development of Indicators for a Sustainability Society; Health and Welfare: Ottawa, Canada, 1991. [Google Scholar]
  26. Environment Canada, Environmental Indicator Selection Criteria; State of the Environment Directorate, Environment Canada: Ottawa, Canada, 1994.
  27. Maclaren, V.M. Urban sustainability reporting. J. Am. Plann. Assoc. 1996, 62, 184–202. [Google Scholar]
  28. Rossi, R.J.; Gilmartin, K.J. The Handbook of Social Indicators: Sources, Characteristics and Analysis; Graland STPM Press: New York, NY, USA, 1980. [Google Scholar]
  29. Carruthers, D.A. Urban Green Space Indicators Development; State of the Environment Reporting, Environment Canada: Ottawa, Canada, 1994. [Google Scholar]
  30. Regional Municipatiliy of Hamilton-Wentworth, Signposts on the Trail to Vision 2020: Sustainability Indicators for the Hamilton-Wentworth Region -Participants Workbook; Regional Municipality of Hamilton-Wentworth: Hamilton, Canada, 1995.
  31. Lee, Y.; Huang, C. Sustainability index for Taipei. Environ. Impact Assess Rev. 2007, 27, 505–521. [Google Scholar]
  32. London Sustainable Development Commission (LSDC). A sustainable development framework for London. Available online: http://www.london.gov.uk/mayor/sustainable-development/susdevcomm_framework.jsp (accessed on 10 May 2012).
  33. Cobb, C.W. Measuring tools and the QOL. Redefining Progress 2000, June, 1–31. [Google Scholar]
  34. Li, G.; Weng, Q. Measuring the QOL in city of Indianapolis by integration of remote sensing and census data. Int. J. Rem. Sens. 2007, 28, 249–267. [Google Scholar]
  35. Small, C. The Landsat ETM+ spectral mixing space. Rem. Sens. Environ. 2004, 93, 1–17. [Google Scholar]
  36. Jensen, R.; Gatrell, J.; Boulton, J.; Harper, B. Using remote sensing and geographic information systems to study urban QOL and urban forest amenities. Ecol. Soc. 2004, 9, 5. [Google Scholar]
  37. Kluwer Academic Publishers iu, W.; Gopal, S.; Woodcock, C. Spatial data mining for classification, visualization and interpretation with ARTMAP neural network. In Data Mining for Scientific and Engineering Applications; Grossman, R., Ed.; Kluwer Academic Publishers: Dordrecht, The Netherlands, 2001; pp. 205–222. [Google Scholar]
  38. Gatrell, J.D.; Jensen, R.R. Sociospatial applications of remote sensing in urban environments. Geography Compass 2008, 2, 728–743. [Google Scholar]
  39. Jensen, R.R.; Gatrell, J.D.; McLean, D.D. Geo-Spatial Technologies in Urban Environments; Springer: Berlin, Germany, 2004. [Google Scholar]
  40. Seto, K.C.; Woodcock, C.E.; Huang, X.; Lu, J.; Kaufmann, R.K. Monitoring land-use change in the Pearl River Delta using Landsat TM. Int. J. Rem. Sens. 2002, 23, 1985–2004. [Google Scholar]
  41. Organisation for Economic Cooperation and Development (OECD), Strategies for a Sustainable Pattern of Development of Urban Regions in Europe; Background study for the European Council’s 10th Conference for Ministers Responsible for Regional Planning (CEMAT): Oslo, Norway, 1994.
  42. United Nations’ Economic Commission for Europe (UN/ECE), Major Trends Characterizing Human Settlements Development in the ECE Region; United Nations: New York, NY, USA, 1998.
  43. Xiao, J.; Shen, Y.; Ge, J.; Tateishi, R.; Tang, C.; Liang, Y.; Huang, Z. Evaluating urban expansion and land use change in Shijiazhuang, China, by using GIS and remote sensing. Landsc. Urban Plann. 2006, 75, 69–80. [Google Scholar]
  44. Brennan, E.M. Population, Urbanization, Environment, and Security: A Summary of the Issues; Environmental Change & Security Protect Report; Woodrow Wilson International Center for Scholars: Washington, DC, USA, 1999; pp. 4–14. [Google Scholar]
  45. Tewolde, M.G.; Cabral, P. Urban sprawl analysis and modeling in Asmara, Eritrea. Remote Sensing 2011, 3, 2148–2165. [Google Scholar]
  46. Schmidt, C.W. The specter of sprawl. Environ. Health Perspect. 1998, 106, 274–279. [Google Scholar]
  47. Duun, H.P.; Lervåg, H.; Lie, M.; Løseth, O.E. Energy Economizing in Local Administration. Handbook for Municipalities and Electricity Boards; The Ministry of Oil and Energy: Oslo, Norway, 1998. [Google Scholar]
  48. Newman, P.; Kenworthy, J.R. Sustainability and Cities: Overcoming Automobile Dependence; Island Press: Washington, DC, USA, 1999. [Google Scholar]
  49. Orrskog, L. Planning for Sustainability in Swedish. PhD Thesis, Royal Institute of Technology, The Swedish Council for Building Research, Stockholm, Sweden, 1993. [Google Scholar]
  50. Jensen, J.R. Remote Sensing of the Environment: An Earth Resource Perspective, 2nd ed; Pearson Prentice Hall: Upper Saddle River, NJ, USA, 2007. [Google Scholar]
  51. Weng, Q. A remote sensing-GIS evaluation of urban expansion and its impact on surface temperature in the Zhujiang Delta, China. Int. J. Rem. Sens. 2001, 22, 1999–2014. [Google Scholar]
  52. Yeh, A.G.; Li, X. Measurement and monitoring of urban sprawl in a rapidly growing region using entropy. Photogramm. Eng. Rem. Sens. 2001, 67, 83–90. [Google Scholar]
  53. Leicester City Council, Indicators of Sustainable Development in Leicester: Progress and Trends; Leicester City Council: Leicester, UK, 1995.
  54. Murdie, R.A.; Rhyne, D.; Bates, J. Modeling QOL Indicators in Canada: A Feasibility Analysis; Canada Mortgage and Housing Corporation: Ottawa, Canada, 1992. [Google Scholar]
  55. Lundin, M.; Morrison, G.M. A life cycle assessment based procedure for development of environmental sustainability indicators for urban water systems. Urban water J. 2002, 4, 145–152. [Google Scholar]
  56. Metropolitan Toronto Planning Department, Towards a livable metropolis; Metropolitan Toronto Planning Department: Toronto, Canada, 1991.
  57. National Round Table on the Environment and the Economy, Toward Reporting Progress on Sustainable Development in Canada; Publisher: Ottawa, Canada, 1993.
  58. O’Neil, M.; Cardinal, L. Des indicators pour Evaluer les Projets Quebecois de Villes et Villages en Santé; University of Laval: Quebec, Canada, 1992. [Google Scholar]
  59. Li, G.; Weng, Q. Measuring the QOL in city of Indianapolis by integration of remote sensing and census data. Int. J. Rem. Sens. 2007, 28, 249–267. [Google Scholar]
  60. Lo, C.P.; Quattrochi, D.A. Land-Use and Land-Cover Change, Urban Heat Island Phenomenon, and Health Implications: A Remote Sensing Approach. Photogramm. Eng. Rem. Sens. 2003, 69, 1053–1063. [Google Scholar]
  61. Slonecker, E.T.; Jennings, D.B.; Garofalo, D. Remote sensing of impervious surface: a review. Rem. Sens. Rev. 2001, 20, 227–255. [Google Scholar]
  62. Yang, L.; Xian, G.; Klaver, J.M.; Deal, B. Urban land-cover change detection through subpixel imperviousness mapping. Photogramm. Eng. Rem. Sens. 2003, 69, 1003–1010. [Google Scholar]
  63. Phinn, S.; Stanford, M.; Scarth, P.; Murray, A.T.; Shyy, P.T. Monitoring the composition of urban environments based on the vegetation-impervious surface-soil (VIS) model by subpixel analysis techniques. Int. J. Rem. Sens. 2002, 23, 4131–4153. [Google Scholar]
  64. Changnon, S.A.; Kunkel, K.E.; Reinke, B.C. Impairs and responses to the 1995 heat wave: A call to action. Bull. Am. Meteorol. Soc. 1996, 77, 1497–1506. [Google Scholar]
  65. Rennings, K.; Hubert, W. Steps towards indicators of sustainable development: Linking economic and ecological concepts. Ecol. Econ. 1997, 20, 25–36. [Google Scholar]
  66. Schwab, W.A. The Sociology of Cities; Prentice Hall: Englewood Cliffs, NJ, USA, 1992. [Google Scholar]
  67. Cutter, S. Rating places: A geographer’s view on QOL. Association of American geographers resource publication series in geography: Washington, DC, USA, 1985. [Google Scholar]
  68. Myers, D. Community-relevant measurement of QOL: A focus on local trends. Urban Affairs Quarterly 1987, 23, 108–125. [Google Scholar]
  69. Kuz, T.J. QOL: An objective and subjective variable analysis. Reg. Stud. 1978, 12, 409–417. [Google Scholar]
  70. Miles, I. Social indicators for human development; St. Martin’s: New York, NY, USA, 1985. [Google Scholar]
  71. Andrews, F.M. Subjective Social Indicators,Objective Social Indicators and Social Accounting Systems; Juster, F.T., Land, K., Eds.; Social Accounting Systems: New York, NY, USA, 1981; pp. 377–419. [Google Scholar]
  72. Wish, N. Some issues about the quality of sunbelt/Frostbelt life. Am. J. Econ. Sociol. 1986, 45, 343–357. [Google Scholar]
  73. Weng, Q. Land use change analysis in the Zhujiang Delta of China using satellite remote sensing, GIS and stochastic modeling. J. Environ. Manag. 2002, 64, 273–284. [Google Scholar]
  74. Seto, K.C.; Kaufmann, R.K. Modeling the Drivers of Urban Land Use Change in the Pearl River Delta, China: Integrating Remote Sensing with Socioeconomic Data. Land Econ. 2003, 79, 106–121. [Google Scholar]
  75. Mohan, M. Geospatial Information for Urban Sprawl Planning and Policies Implementation in Developing Country's NCR Region: A Study of NOIDA City, India. In Addressing Issues of Urban Growth, FIG Congress 2010, Facing the Challenges—Building the Capacity, Sydney, Australia, 11-16 April 2010.
  76. Wilson, E.H.; Hurd, J.D.; Civco, D.L.; Prisloe, M.P.; Arnold, C. Development of a geospatial model to quantify, describe and map urban growth. Rem. Sens. Environ. 2003, 86, 275–285. [Google Scholar] [CrossRef]
  77. Ridd, M.K. Exploring a V-I-S (vegetation-impervious surface-soil) model for urban ecosystem analysis through remote sensing: comparative anatomy for cities. Int. J. Rem. Sens. 1995, 12, 2165–2185. [Google Scholar]
  78. Small, C. The Landsat ETM+ spectral mixing space. Rem. Sens. Environ. 2004, 93, 1–17. [Google Scholar]
  79. Phinn, S.; Stanford, M.; Scarth, P.; Murray, A.T.; Shyy, P.T. Monitoring the composition of urban environments based on the vegetation-impervious surface-soil (VIS) model by subpixel analysis techniques. Int. J. Rem. Sens. 2002, 23, 4131–4153. [Google Scholar] [CrossRef]
  80. Lo, C.P.; Faber, B.J. Integration of Landsat Thematic Mapper and Census Data for QOL Assessment. Rem. Sens. Environ. 1997, 62, 143–157. [Google Scholar] [CrossRef]
  81. Randall, J.E.; Morton, P.H. QOL in Saskatoon 1991 and 1996: A geographical perspective. Urban Geography 2003, 24, 691–722. [Google Scholar] [CrossRef]
  82. Jensen, R.; Gatrell, J.; Boulton, J.; Harper, B. Using remote sensing and geographic information systems to study urban QOL and urban forest amenities. Ecol Soc. 2004, 9, 5. [Google Scholar]
  83. Xian, G.; Crane, M.; McMahon, C. Quantifying multi-temporal urban development characteristics in Las Vegas from Landsat and ASTER Data. Photogramm. Eng. Rem. Sens. 2008, 74, 473–481. [Google Scholar]
  84. Liu, W.; Gopal, S.; Woodcock, C. Spatial Data Mining for Classification, Visualization and Interpretation with ARTMAP Neural Network. In Data Mining for Scientific and Engineering Applications; Grossman, R., Ed.; Kluwer Academic Publishers: Dordrecht, The Netherlands, 2001; pp. 205–222. [Google Scholar]
  85. Kwarteng, A.; Small, C. Remote Sensing of Urban Environmental Conditions. In Remote Sensing of Urban and Suburban Areas; Rashed, T., Jürgens, C., Eds.; Springer: New York, NY, USA, 2010; pp. 267–284. [Google Scholar]
  86. Price, J.C. Calibration of satellite radiometers and the comparison of vegetation indices. Rem. Sens. Environ. 1987, 21, 15–27. [Google Scholar]
  87. Nicole, J.; Lee, C.M. Urban vegetation monitoring in Hong Kong using high resolution multispectral images. Int. J. Rem. Sens. 2005, 26, 903–918. [Google Scholar]
  88. Small, C. Estimation of urban vegetation abundance by spectral mixture analysis. Int. J. Rem. Sens. 2001, 22, 1305–1334. [Google Scholar]
  89. Song, C. Spectral mixture analysis for subpixel vegetation fractions in the urban environment: How to incorporate endmember variability? Rem. Sens. Environ. 2005, 95, 248–263. [Google Scholar]
  90. Jackson, T.J. Computer Aided Techniques for Estimating the Percent of Impervious Area from Landsat Data. In Proceedings of Workshop on the Environmental Applications of Multispectral Imagery, American Society of Photogrammetry, Fort Belvoir, WV, USA, 11-13 November 1975; pp. 140–155.
  91. Plunk, D.E.; Morgan, K.; Newland, L. Mapping impervious cover using Landsat TM Data. J. Soil. Water Conservat. 1990, 45, 589–591. [Google Scholar]
  92. Morgan, K.M.; Newland, L.W.; Weber, E.; Busbey, A.B. Using Spot satellite data to map impervious cover for urban runoff predictions. Toxicol. Environ. Chem. 1993, 40, 11–16. [Google Scholar]
  93. Ji, M.H.; Jensen, J.R. Effectiveness of subpixel analysis in detecting and quantifying urban imperviousness from Landsat Thematic Mapper imagery. Geocarto Int. 1999, 14, 31–41. [Google Scholar]
  94. Lu, D.; Weng, Q. Spectral mixture analysis of the urban landscape in Indianapolis with landsat ETM+ Imagery. Photogramm. Eng. Rem. Sens. 2004, 70, 1053–1062. [Google Scholar]
  95. Xian, G. Assessing Urban Growth with Subpixel Impervious Surface Coverage. In Urban Remote Sensing; Weng, Q., Quattrochi, D.A., Eds.; CRC Press, Taylor & Francis Group: New York, NY, USA, 2007; pp. 179–199. [Google Scholar]
  96. Setiawan, H.; Mathieu, R.; Thompson-Fawcett, M. Assessing the applicability of the V–I–S model to map urban land use in the developing world: Case study of Yogyakarta, Indonesia. Comput. Environ. Urban Syst. 2006, 30, 503–522. [Google Scholar]
  97. Gao, B. NDWI-A normalized difference water index for remote sensing of vegetation liquid water from space. Rem. Sens. Environ. 1996, 58, 257–266. [Google Scholar]
  98. Rao, P.K. Remote sensing of urban “heat islands” from an environmental satellite. Bull. Am. Meteorol. Soc. 1972, 53, 647–648. [Google Scholar]
  99. Streutker, D.R. Satellite-measured growth of the urban heat island of Houston, Texas. Rem. Sens. Environ. 2003, 85, 282–289. [Google Scholar]
  100. Gallo, K.P.; Owen, T.W. Assessment of urban heat island: A multisensory perspective for the Dallas-Ft. Worth, USA region. Geocarto Int. 1998, 13, 35–41. [Google Scholar]
  101. Chen, X.; Zhao, H.; Li, P.; Yin, Z. Remote sensing image-based analysis of the relationship between urban heat island and land use/cover changes. Rem. Sens. Environ. 2006, 104, 133–146. [Google Scholar]
  102. Liu, B. QOL: Concept, Measure and Results. Am. J. Econ. Sociol. 1975, 34, 1–14. [Google Scholar]
  103. Diener, E.; Suh, E. Measuring QOL: Economic, Social, and Subjective Indicator. Soc. Indicat. Res. 1997, 40, 189–216. [Google Scholar]
  104. Lo, C.P. Application of Landsat TM data for QOL assessment in an urban environment. Comput. Environ. Urban Syst. 1997, 21, 259–276. [Google Scholar]
  105. Gatrell, J.D.; Jensen, R.R. Sociospatial applications of remote sensing in urban environments. Geography Compass 2008, 2, 728–743. [Google Scholar] [CrossRef]
  106. Neighbourhood profiles, 10th edition. 2010. Planning and Development branch. Department of Community Services, City of Saskatoon. Available online: http://www.saskatoon.ca/DEPARTMENTS/Community%20Services/PlanningDevelopment/FutureGrowth/DemographicAndHousingData/Pages/NeighbourhoodProfiles.aspx (accessed on 15 June 2012).
  107. Bunting, T.; Filion, P.; Walker, R. Canadian Cities in Transition; Chapter 2 Epochs of Canadian Urban Development; Oxford University Press: Toronto, Canada, 2010. [Google Scholar]
  108. Shannon Proudfoot. Saskatoon the Fastest-Growing City in Canada. National Post, 20 July. 2011. Available online: http://news.nationalpost.com/2011/07/20/saskatoon-the-fastest-growing-city-in-canada/ (accessed on 15 June 2012).
  109. Lemstra, M.; Neudorf, C. Health Disparity in Saskatoon: Analysis to Tntervention; Saskatoon Health Region: Saskatoon, Canada, 2008. [Google Scholar]
  110. Kitchen, P.; Williams, A.M. Quality of Life and Perceptions of Crime in Saskatoon Canada. Social Indicators Research. Available online: http://www.springerlink.com/content/60j1pm28g0372736/ (accessed on 15 June 2012).
  111. Williams, A.M. Achieving a Healthy Sustainable Community: Quality of Life in Saskatoon, Saskatchewan; Community-University Institute for Social Research: Saskatoon, Canada, 2001. [Google Scholar]

