3.1. Sealed Attics
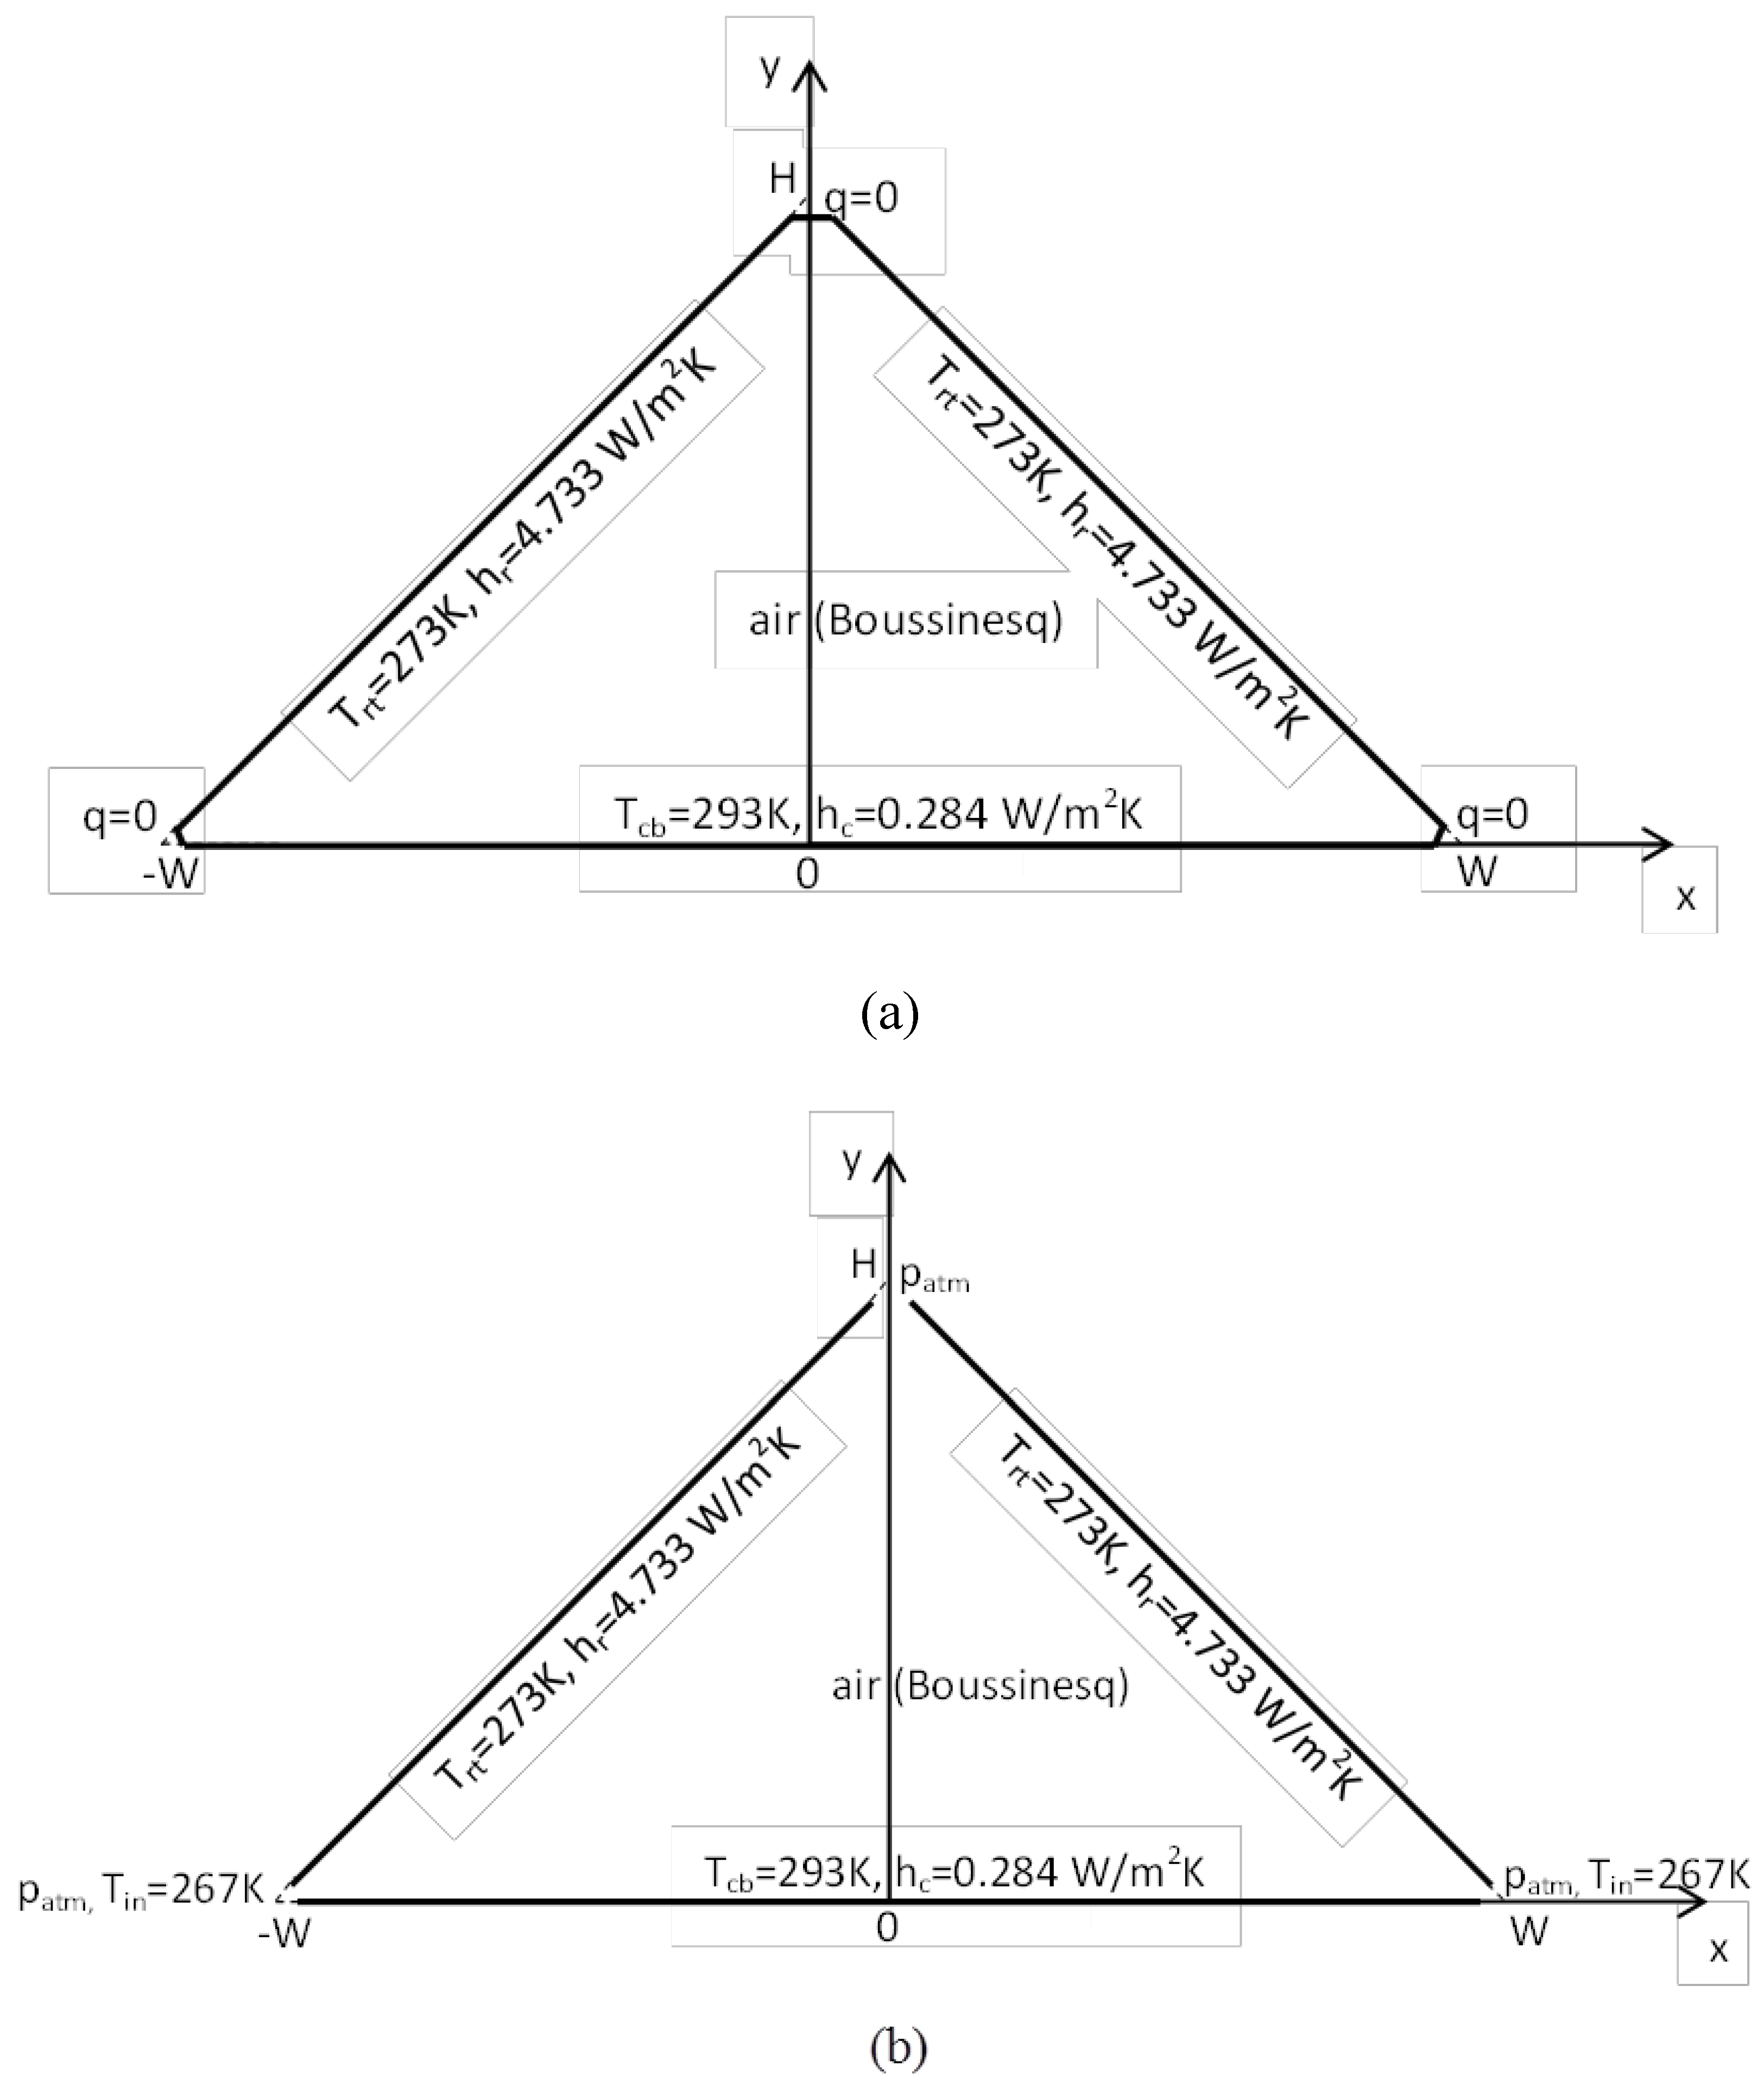
For sealed attics with different roof pitches and subject to the boundary conditions depicted in
Figure 1a, it turns out that all the calculations converge to steady solutions after ~3000 time steps.
The predicted steady streamlines and isotherms are shown in
Figure 2. Although the geometry and boundary conditions are symmetric about
x = 0, the predicted air flows in the sealed attics are asymmetric, independent of the roof pitch variation. The asymmetric flow pattern found here is consistent with the previous numerical studies (e.g., [
17,
18,
22]) and the experimental results of Holtzman
et al. [
10]. In this flow visualization experiment, smoke was slowly injected into an air-filled triangular enclosure, which was constructed of aluminum plates with milled passageways for circulating fluid to maintain isothermal surfaces and to impose a temperature difference between the base and upper walls. When the applied temperature difference was small, corresponding to low values of Grashof number, symmetric flow was observed in the isosceles triangle.
However, as the Grashof number was increased above a critical value, the flow was observed to undergo a supercritical pitchfork bifurcation, in which case one of two possible mirror-image asymmetric flows was obtained, since the symmetric flow was no longer physically stable. The existence of multiple solutions above the pitchfork bifurcation point (including both stable and unstable solutions) necessitates that particular care be exercised during numerical simulation, e.g., setting sufficient iterations to allow finite numerical perturbations to grow, so that the solution can deviate from an unstable symmetric result and eventually converge to one of the two stable asymmetric results.
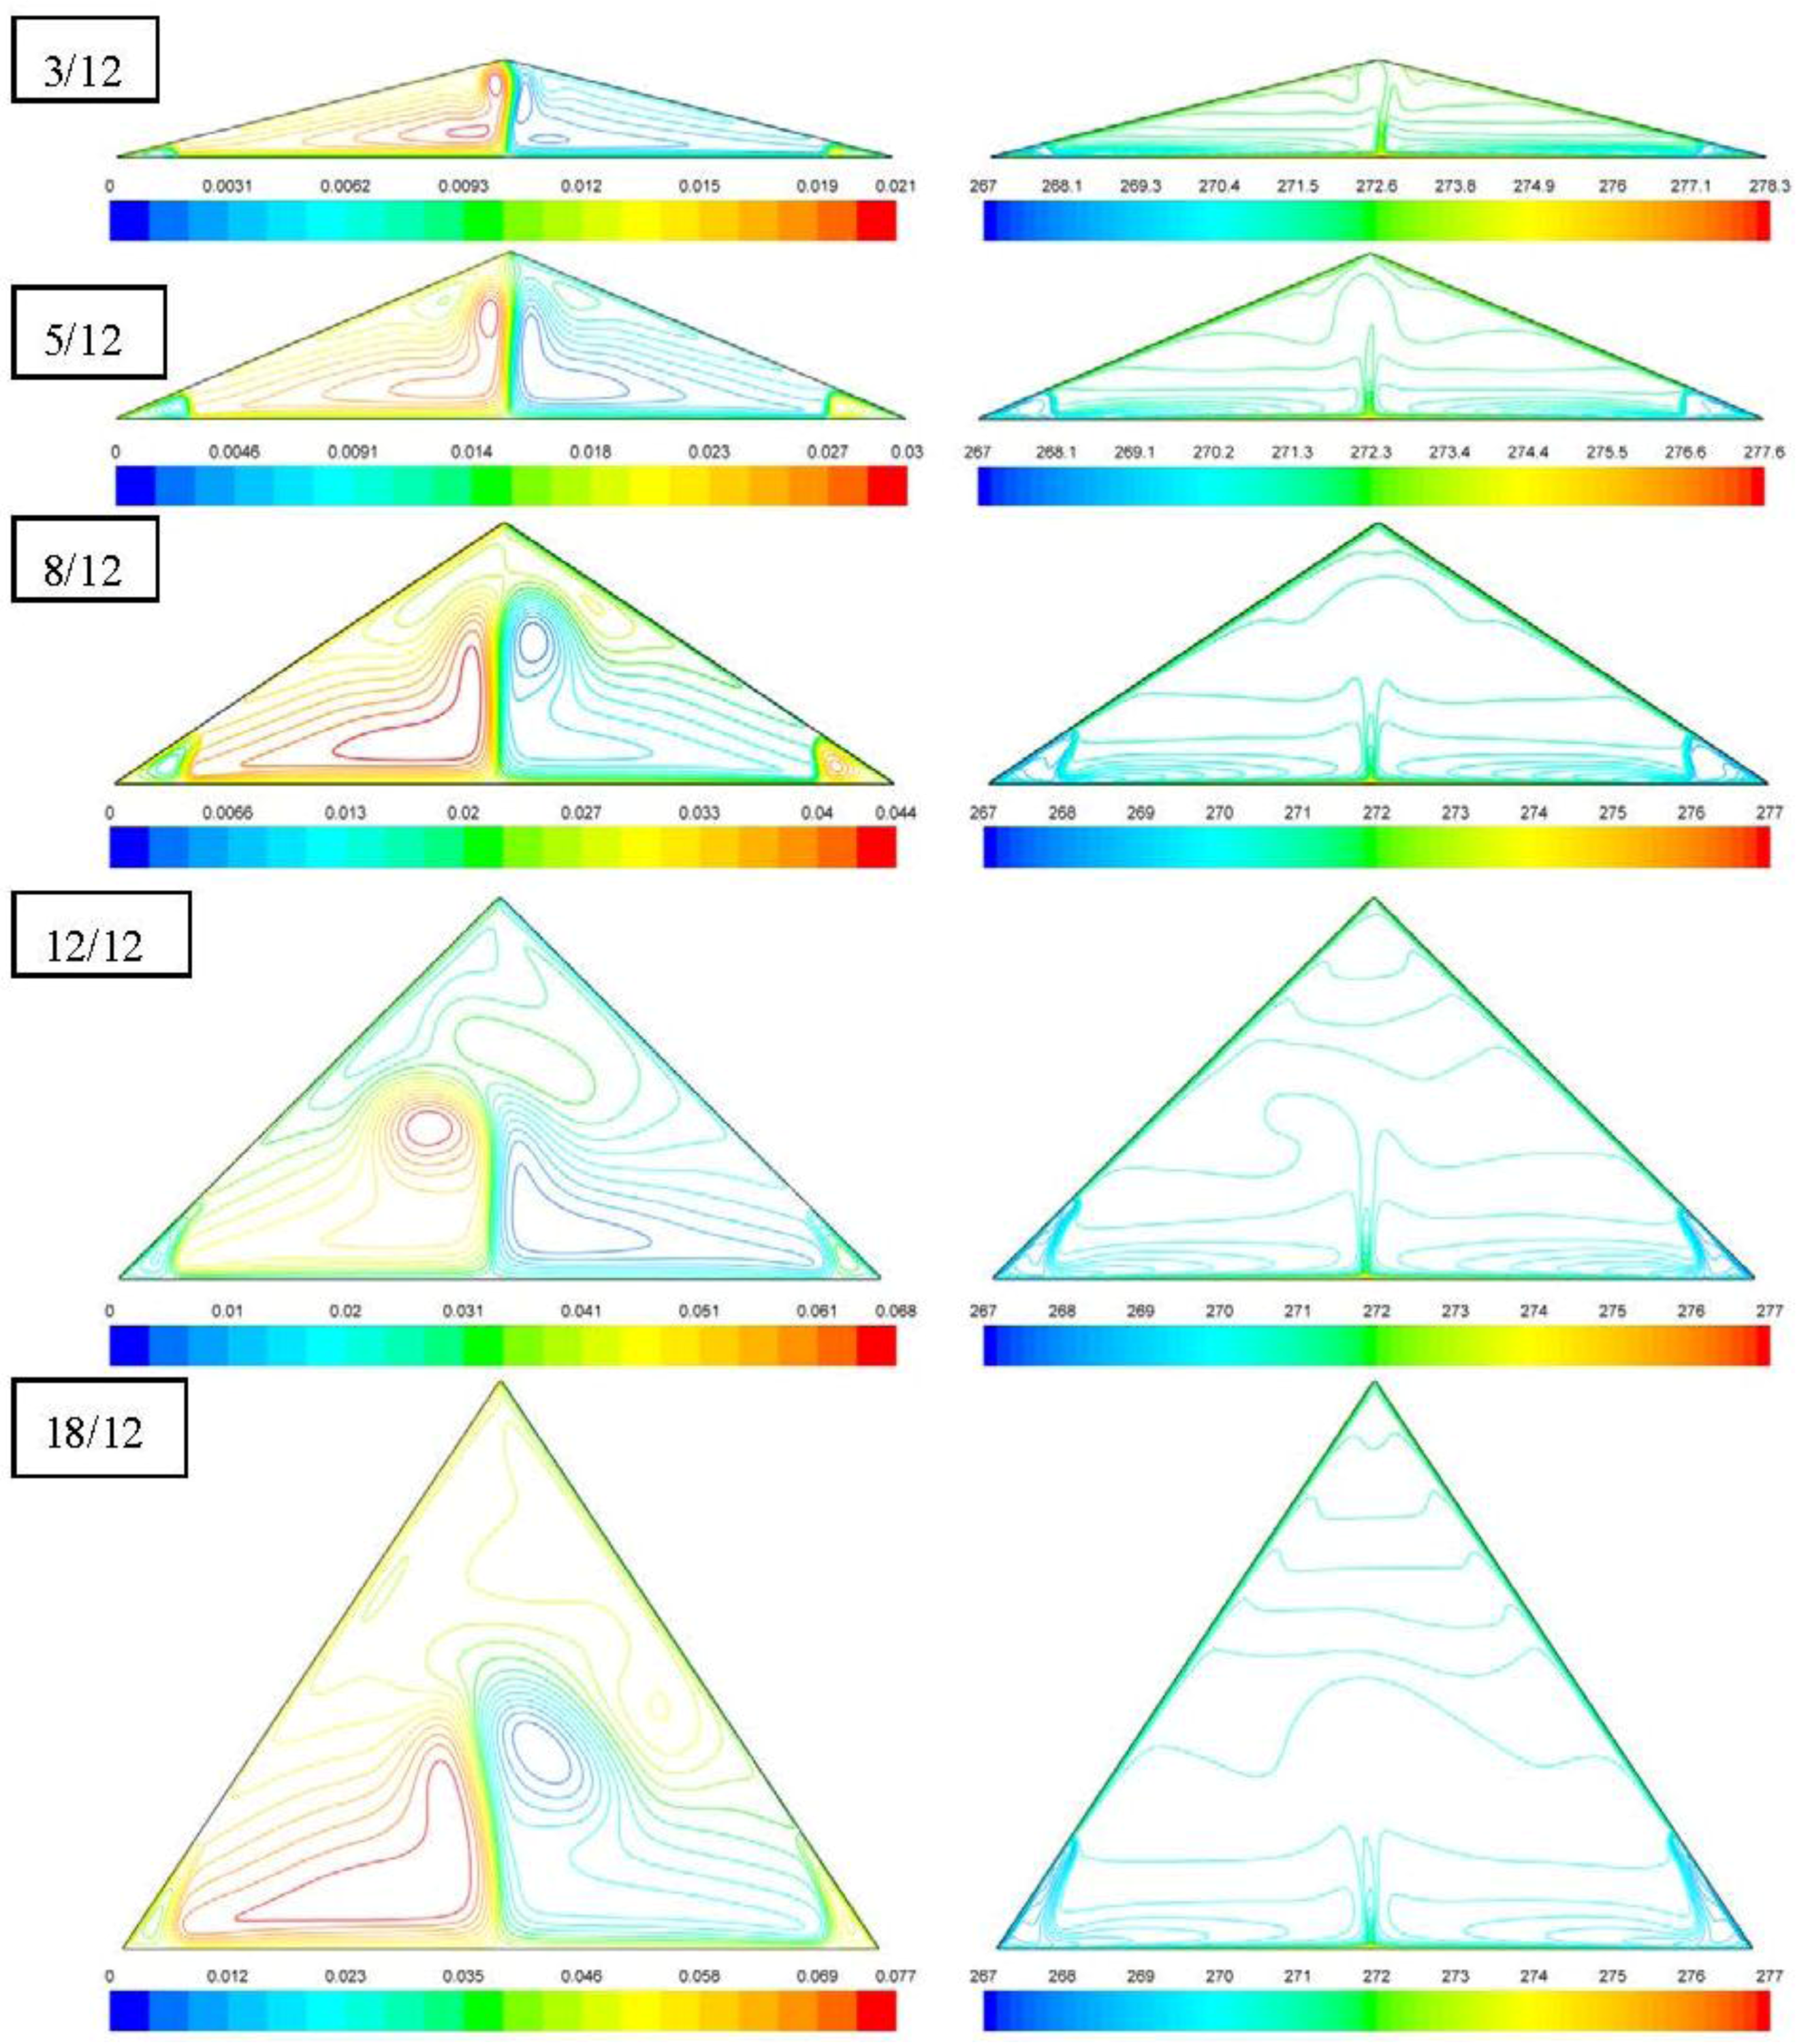
For all the roof pitches investigated, both the flow and temperature fields shown in
Figure 2 are dominated by multiple convection cells. Although the air flow in the biggest cell is always counterclockwise, while that in its neighboring small cells is always clockwise, the spatial distribution pattern of the convection cells constantly changes with the attic aspect ratio. It seems that the cells tend to line horizontally in the low pitched attics but sit one over another in the high pitched attics. Furthermore, the streamlines in
Figure 2 show that the intensities of the major vortices increase with the roof pitch and control the pattern change in isotherms. The observed increase of vortex intensity with roof pitch is a manifest of the controlling role of Rayleigh number, which is proportional to the cubic of attic height, on the intensity of natural convection in sealed attics. It can also be observed in
Figure 2 that for all the roof pitch cases, the predicted isotherms are tightly clustered along the ceiling and roof walls, manifesting the slenderness of the turbulence boundary layers, and elevated along a rising hot plume where the biggest convection cell meets its right-hand neighboring cell.
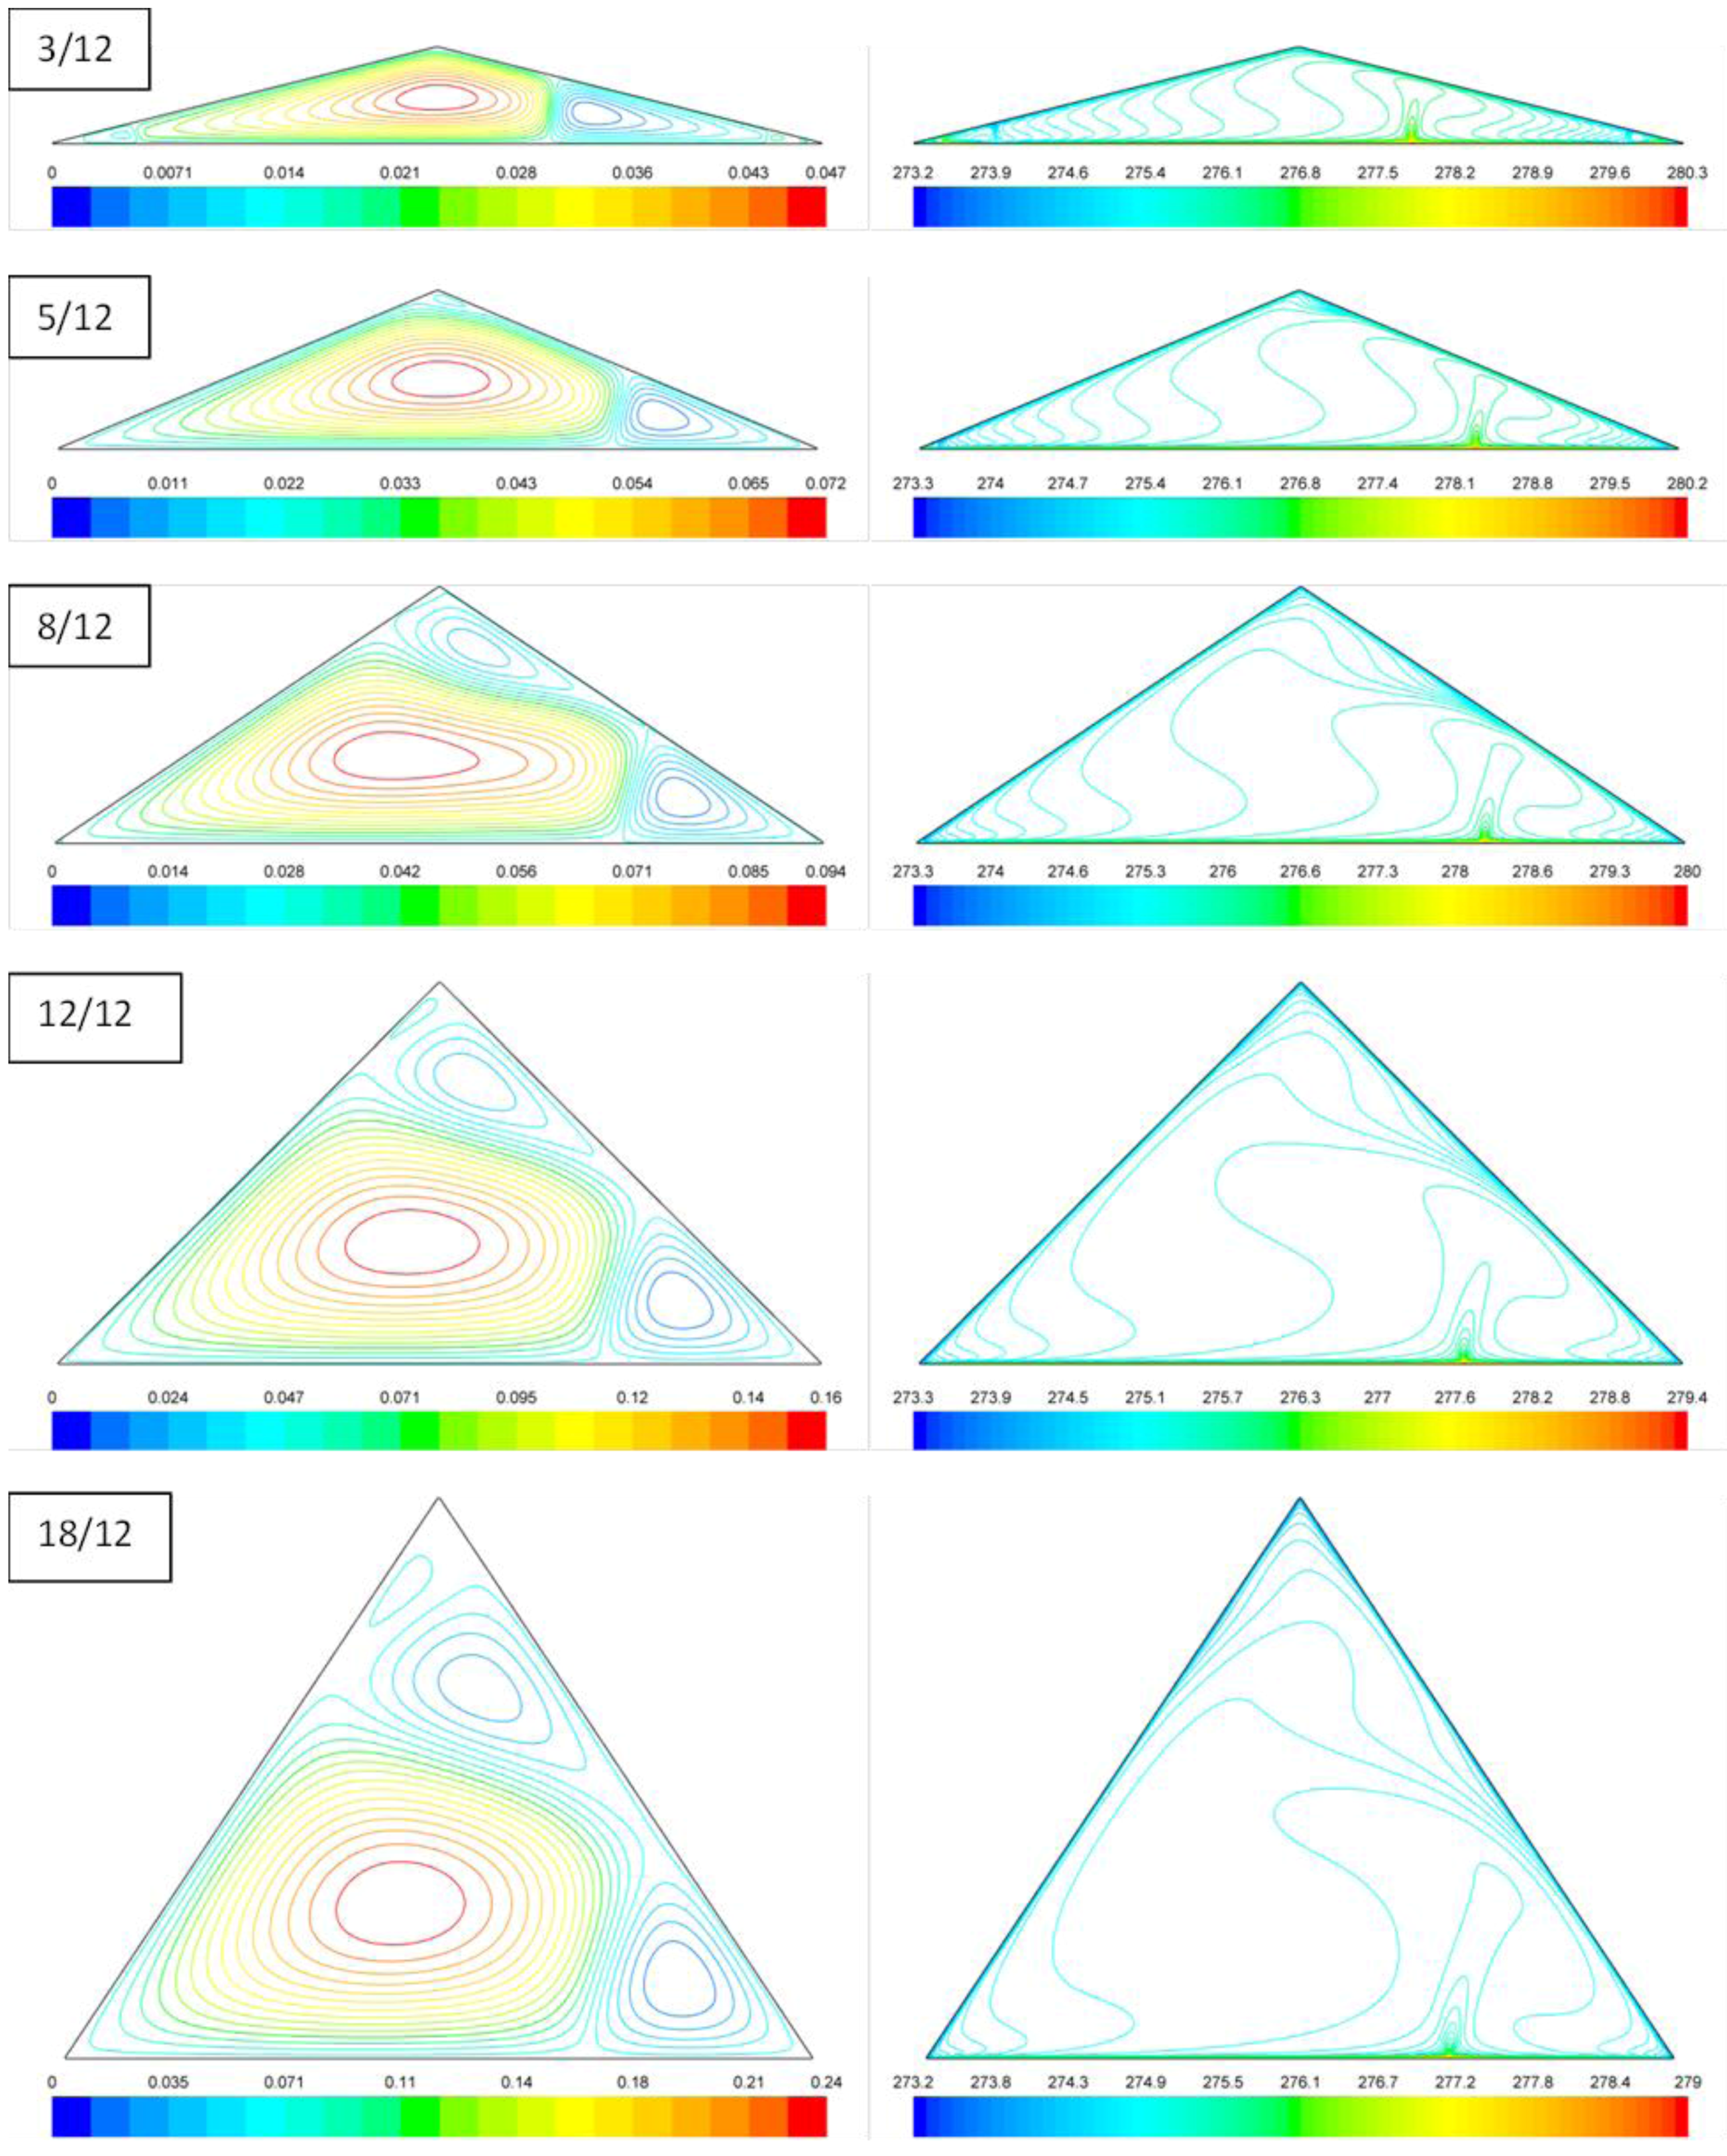
Figure 3 shows the predicted steady profiles of horizontal velocity and temperature along
x = 0. The air flow directions are clearly controlled by the convection cell distributions, and the peak air flow rates generally increase with the roof pitch, as a stronger turbulent natural convection occurs at a higher Rayleigh number associated with a higher pitch. On the other hand, the predicted air temperatures along
x = 0 are quite uniform within the height range of 0.05 <
y/
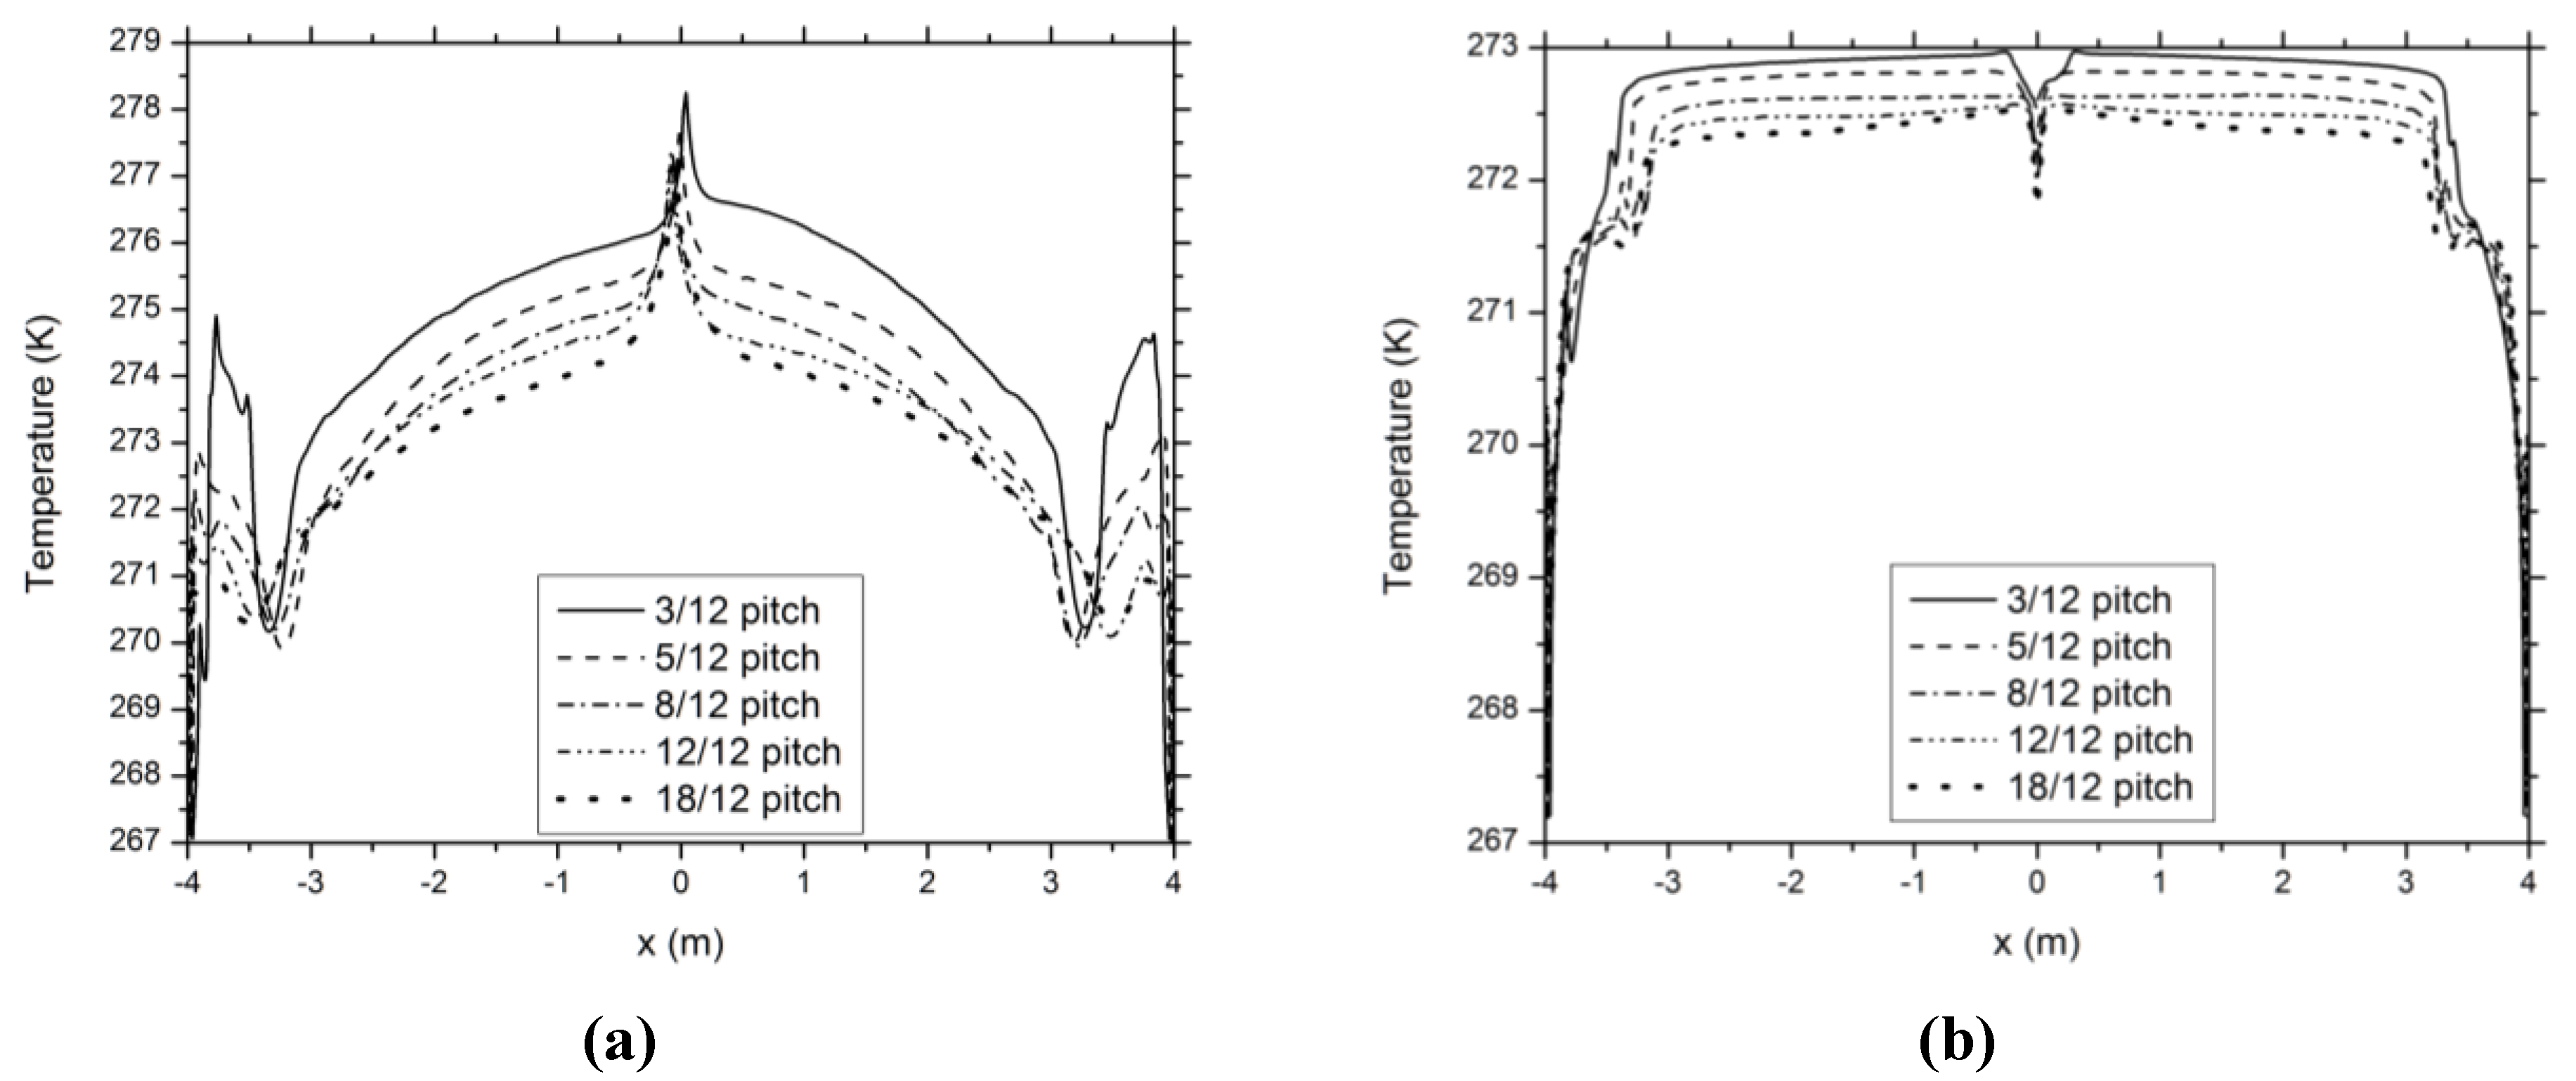
H < 0.9 (in contrast to the sharp variation within the near-wall boundary layers) and decrease with the increasing roof pitch. Such a dependence of attic air temperature on the roof pitch is also evident in
Figure 4, which shows the predicted steady temperature distributions at the ceiling-top and roof-bottom boundaries. The peaks and valleys of the curves in
Figure 4 clearly exhibit the control role of the convection cells on the temperature distributions. Furthermore, it can be observed that both the average ceiling-top (
Figure 4a) and roof-bottom (
Figure 4b) temperatures tend to decrease, as the roof pitch increases. The decrease of the average ceiling-top temperature with the increasing roof pitch shown in
Figure 4a is a consequence of that a stronger natural convection accompanying a higher roof pitch.
Figure 2.
Predicted (left) steady streamlines (in kg/m s) and (right) isotherms (in K) in sealed attics with roof pitches of 3/12, 5/12, 8/12, 12/12, and 18/12, respectively.
Figure 2.
Predicted (left) steady streamlines (in kg/m s) and (right) isotherms (in K) in sealed attics with roof pitches of 3/12, 5/12, 8/12, 12/12, and 18/12, respectively.
Figure 3.
Predicted steady profiles of (a) horizontal velocity and (b) temperature along the central vertical line x = 0 for sealed attics with different roof pitches.
Figure 3.
Predicted steady profiles of (a) horizontal velocity and (b) temperature along the central vertical line x = 0 for sealed attics with different roof pitches.
Figure 4.
Predicted steady temperatures at the ceiling (a) and roof (b) boundaries for sealed attics with different roof pitches.
Figure 4.
Predicted steady temperatures at the ceiling (a) and roof (b) boundaries for sealed attics with different roof pitches.
For the given ceiling-bottom temperature of 293 K, a decrease in the ceiling-top temperature indicates a greater temperature difference across the ceiling thickness and thus an increase in the attic heat loss, reflecting the enhanced heat transfer effect associated with a stronger natural convection. The decrease of the average roof-bottom temperature with the increasing roof pitch shown in
Figure 4b indicates that the heat flux across the roof boundary decreases as a result of reduced temperature difference across the roof thickness. However, this decrease in roof heat flux is over compensated by the increase of roof area with the roof pitch. The net effect of the reduced heat flux and increased heat transfer area for a higher roof pitch is an increase in roof heat loss that exactly matches the increase in ceiling heat loss, as the overall energy balance of the steady flow of attic air requires.
The results shown in
Figure 2,
Figure 3,
Figure 4 provide detailed information for the velocity and temperature distributions. Such information is critical for a better understanding of the fundamental mechanism of momentum and heat transport in the sealed attic spaces. However, for a practical engineering purpose, it is the overall energy performance of the attic spaces that is of the most importance to construction professionals and building owners. In the following, the obtained numerical results will be integrated and a new heat transfer correlation will be developed to best quantify the overall energy performance of the sealed attics.
The integrated heat transfer rates across the ceiling and roof boundaries are compared in
Table 1 for the different roof pitch cases. It is clear that the heat transfer rate across each boundary increases with the roof pitch. For all the cases, the total heat gain from the ceiling is equal to the total heat loss through the roofs (as a result of the overall energy balance for the modeled closed system), and reflects the energy consumption share of the attic space in the heating load of the building.
Table 1 suggests that gable-roof buildings with high pitched roofs will consume more energy for space heating, as compared with those with low pitched roofs. As the roof pitch increases from 3/12 to 5/12, 8/12, 12/12, and 18/12, the attic heating load is predicted to increase by 0.6%, 2.1%, 4.6%, 6.6%, respectively.
Table 1.
Predicted heat transfer through the ceiling and roof boundaries for sealed attics with different roof pitches.
Table 1.
Predicted heat transfer through the ceiling and roof boundaries for sealed attics with different roof pitches.
| Pitch | Heat Gain from Left Ceiling (W/m) | Heat Gain from Right Ceiling (W/m) | Heat Loss from Left Roof (W/m) | Heat Loss from Right Roof (W/m) | Qt (W/m) |
|---|
| 3/12 | 17.21 | 16.79 | 15.78 | 18.21 | 34.00 |
| 5/12 | 17.33 | 16.87 | 15.98 | 18.22 | 34.20 |
| 8/12 | 17.57 | 17.15 | 17.31 | 17.41 | 34.72 |
| 12/12 | 17.98 | 17.60 | 17.71 | 17.86 | 35.58 |
| 18/12 | 18.30 | 17.93 | 17.99 | 18.24 | 36.23 |
It is also clear from
Table 1 that regardless of the roof pitch, the heat gain from the right ceiling is less than that from the left ceiling, whereas the heat loss through the right roof is more than that through the left roof. This is mainly caused by the rising hot plume, as shown by the elevated isotherms in
Figure 2. The rising hot plume generates a hot spot at both the right ceiling and the right roof boundaries. However, the increased temperature within the ceiling hot spot corresponds to a reduced temperature difference across the ceiling thickness and thus results in less heat gain from the right ceiling, as compared to the left ceiling, whereas the elevated temperature within the roof hot spot involves an increased temperature difference across the roof thickness, resulting in a greater heat loss through the right roof.
A correlation for heat transfer dominated by natural convection is typically expressed as a relationship between Nusselt number (Nu) and Rayleigh number (Ra). In case of heat transfer in attic spaces, both the dimensionless numbers should be defined based on a representative constant temperature difference across the attic space,
Tct −
Trb. Although it is possible to obtain this temperature difference by subtracting a curve in
Figure 4a by the one corresponding to the same roof pitch in
Figure 4b and then taking average over the ceiling range, we prefer an alternative approach,
i.e., evaluating
Tct −
Trb by the classical method of thermal resistance analysis. An advantage of the thermal resistance approach is that the thermal resistance of attic air flow can be obtained as well, which itself is also of engineering significance.
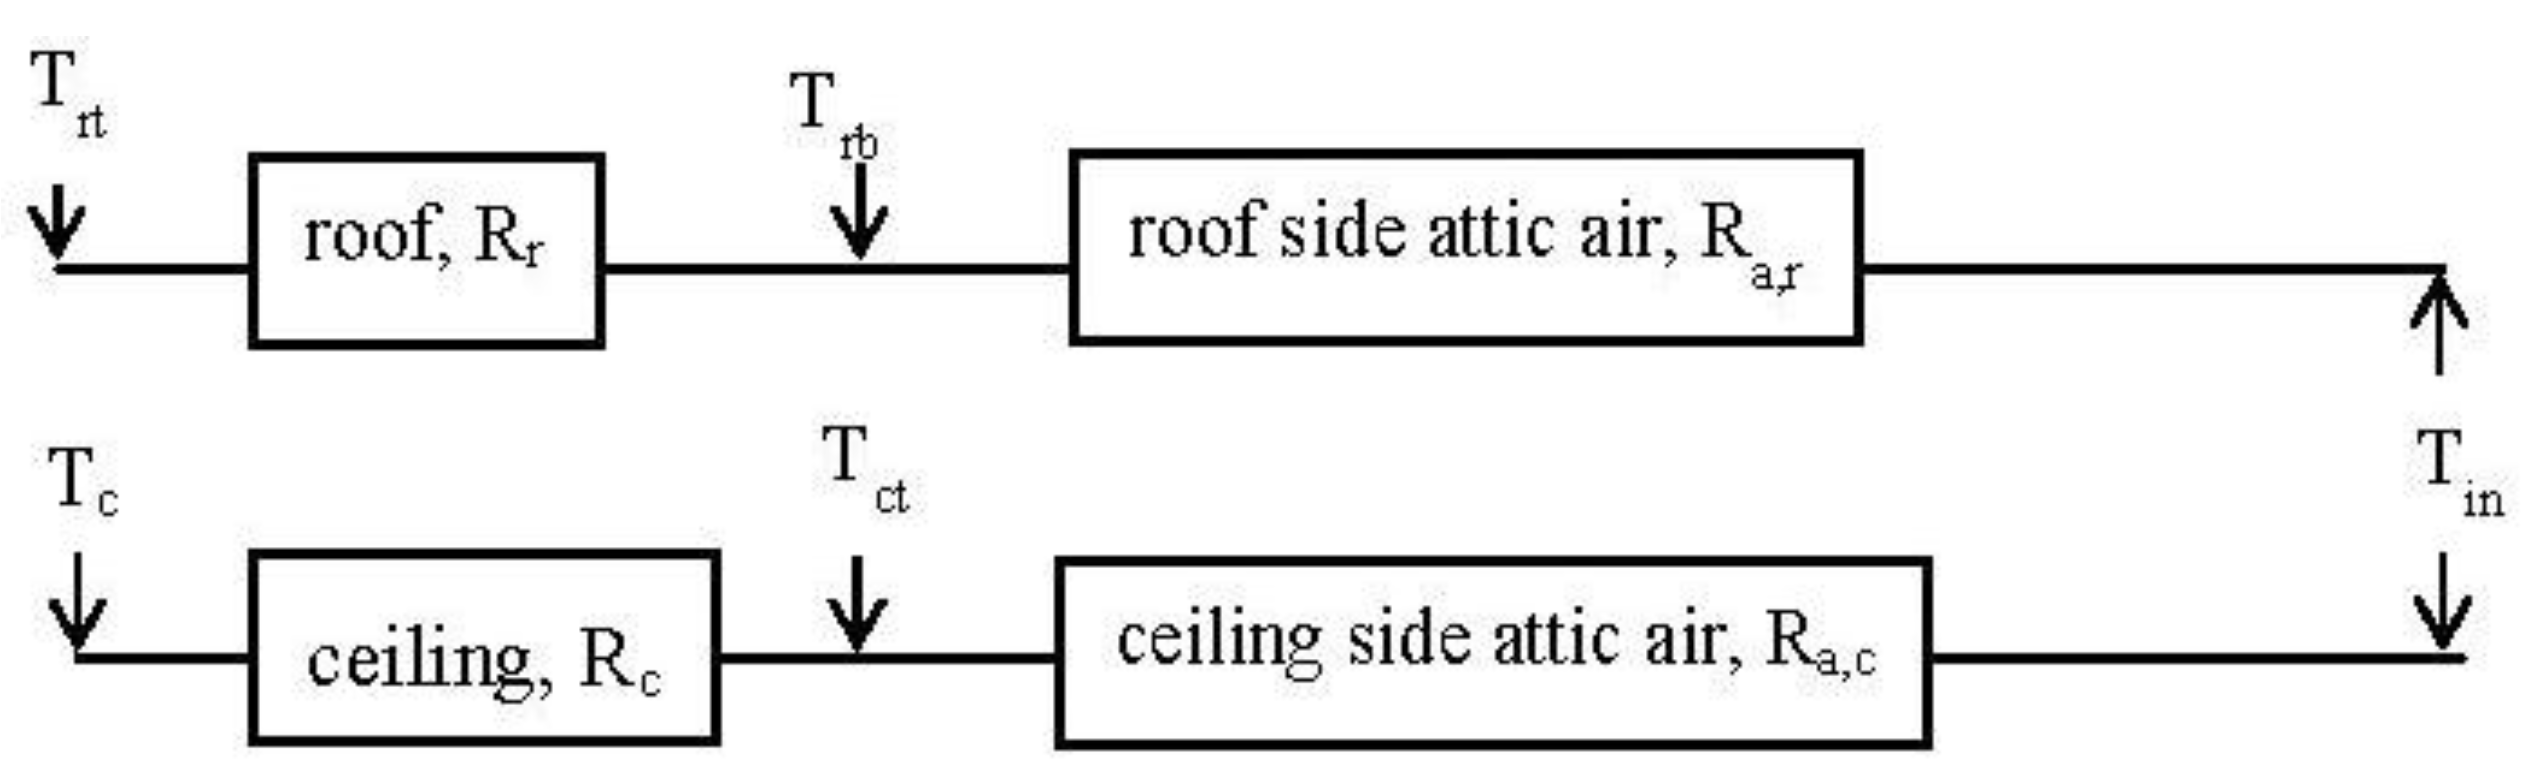
The thermal resistance diagram for the sealed attics, as shown in
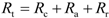
Figure 5, suggests that the total thermal resistance of the ceiling-air-roof system,
Rt, equals the sum of the thermal resistances of the sub-systems
and can be evaluated by
where
Qt is the total heat transfer rate, as listed in the last column of
Table 1. Since the ceiling and roof insulations are specified to be R-20 and R-1.2, respectively, Equations (15,16) can be used to obtain all the thermal resistances, and the obtained results are listed in
Table 2. It should be noted that the
Rr column in
Table 2 is obtained by scaling R-1.2 by the roof-ceiling area ratio, (
W2 +
H2)
1/2/
W, so that all the resistances are defined based on unit ceiling area.
Table 2 shows that the thermal resistance of the attic air is around R-5 level and decreases about 31% from the 3/12 pitched attic to the 18/12 pitched attic.
Figure 5.
Diagram of thermal resistance for sealed attics.
Figure 5.
Diagram of thermal resistance for sealed attics.
Table 2.
Thermal resistances, in R-value (R-1 = 0.17611 Km2/W), for sealed attics with different roof pitches.
Table 2.
Thermal resistances, in R-value (R-1 = 0.17611 Km2/W), for sealed attics with different roof pitches.
| Pitch | Rt (Total) | Rc (Ceiling) | Rr (Roof) | Ra (Air) |
|---|
| 3/12 | 26.721 | 20 | 1.164 | 5.556 |
| 5/12 | 26.565 | 20 | 1.108 | 5.457 |
| 8/12 | 26.167 | 20 | 0.998 | 5.179 |
| 12/12 | 25.535 | 20 | 0.849 | 4.686 |
| 18/12 | 25.077 | 20 | 0.666 | 4.411 |
In terms of the resistance diagram (
Figure 5) and the thermal resistances listed in
Table 2, the representative ceiling-top and roof-bottom temperatures are calculated and listed in
Table 3. A comparison between
Table 3 and
Figure 4 confirms that the temperatures obtained by the thermal resistance analysis are indeed good representatives of the data in
Figure 4. Accordingly, the Nusselt number and Rayleigh number can be evaluated for each case. The results are listed in
Table 3 and plotted in
Figure 6.
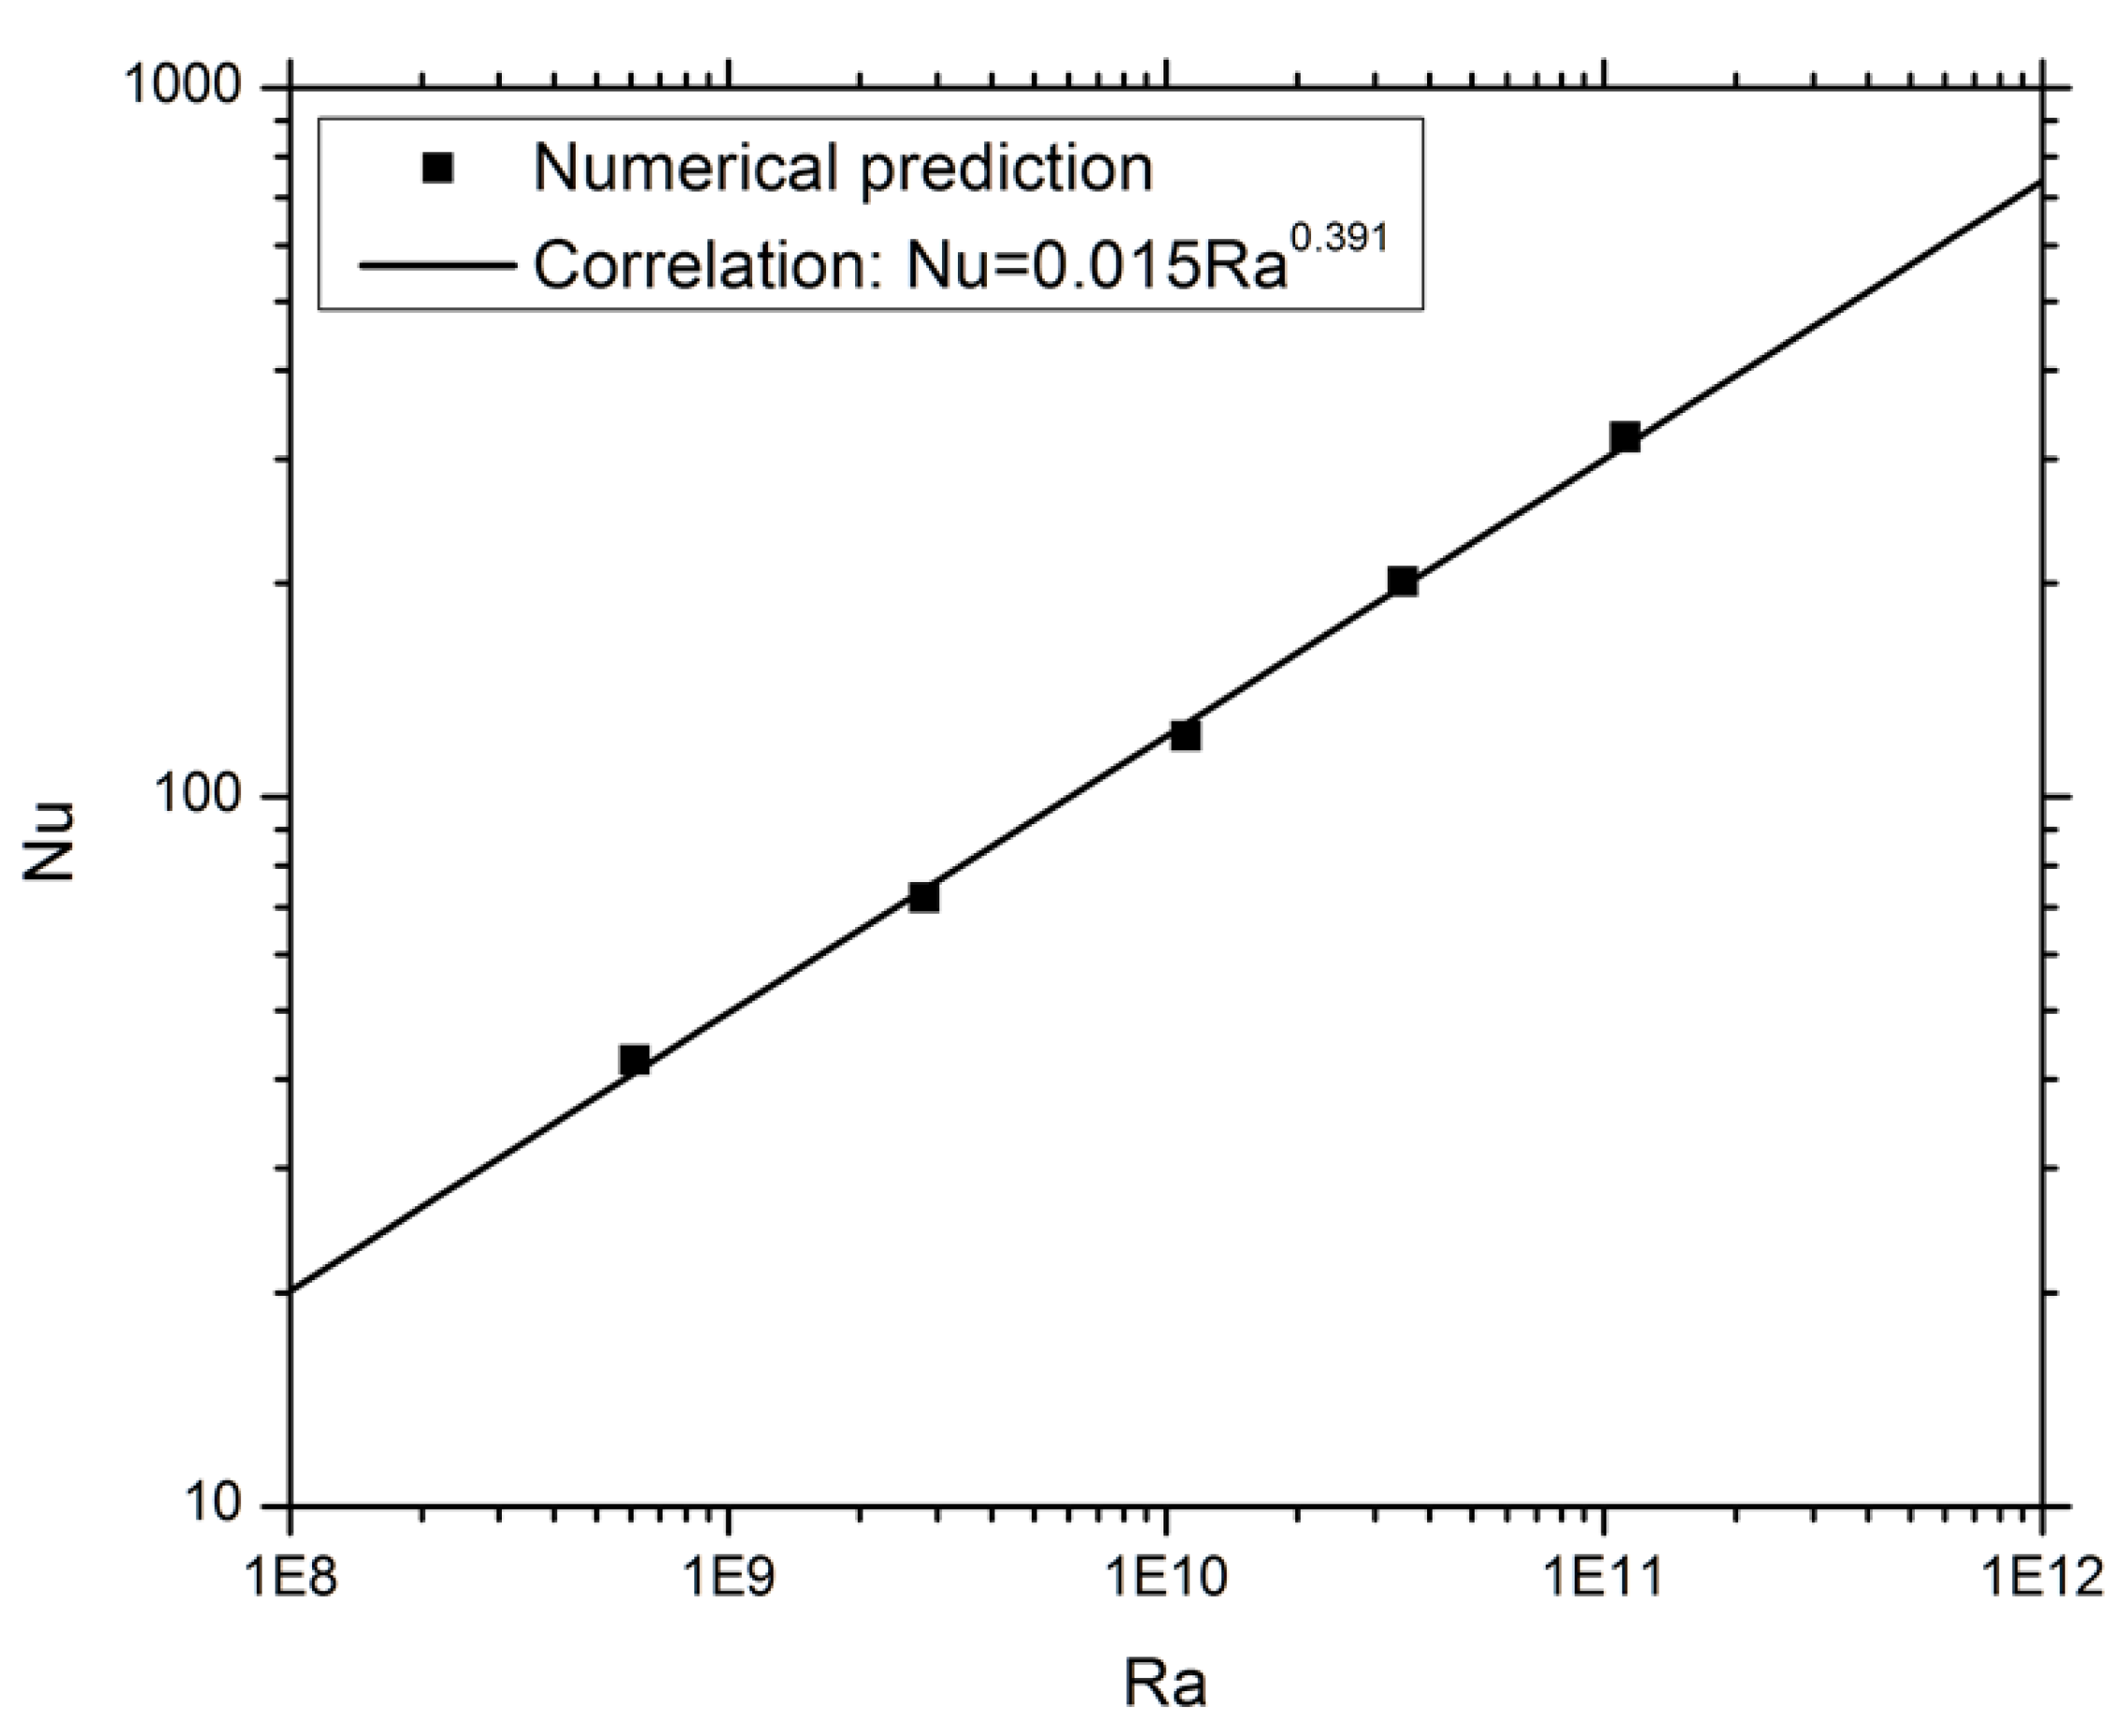
Figure 6 shows that the (Nu, Ra) data points are almost linearly distributed on a log-log plot, suggesting the following empirical correlation for heat transfer in sealed attics
More experimental or numerical data are needed to fully test the applicable domain of this correlation, including if it is approximately valid for situations beyond uniform thermal conditions, e.g., those with slight variations in roof-top and ceiling-bottom temperatures.
Table 3.
Representative ceiling-top and roof-bottom temperatures together with derived Nusselt and Rayleigh numbers for sealed attics with different roof pitches.
Table 3.
Representative ceiling-top and roof-bottom temperatures together with derived Nusselt and Rayleigh numbers for sealed attics with different roof pitches.
| Pitch | Tct (K) | Trb (K) | Nu =
HQt/2W(Tct − Trb)λ | Ra =
ρ2cpgβH3(Tct − Trb)/λµ |
|---|
| 3/12 | 278.03 | 273.87 | 42.57 | 6.14 × 10⁸ |
| 5/12 | 277.94 | 273.83 | 72.23 | 2.81 × 10⁹ |
| 8/12 | 277.71 | 273.76 | 122.08 | 1.11 × 10¹⁰ |
| 12/12 | 277.34 | 273.66 | 201.43 | 3.47 × 10¹⁰ |
| 18/12 | 277.05 | 273.53 | 321.64 | 1.12 × 10¹¹ |
Figure 6.
Correlation for heat transfer in sealed attics developed based on the numerical predictions.
Figure 6.
Correlation for heat transfer in sealed attics developed based on the numerical predictions.
3.2. Vented Attics
For vented attics with different roof pitches and subject to the boundary conditions depicted in
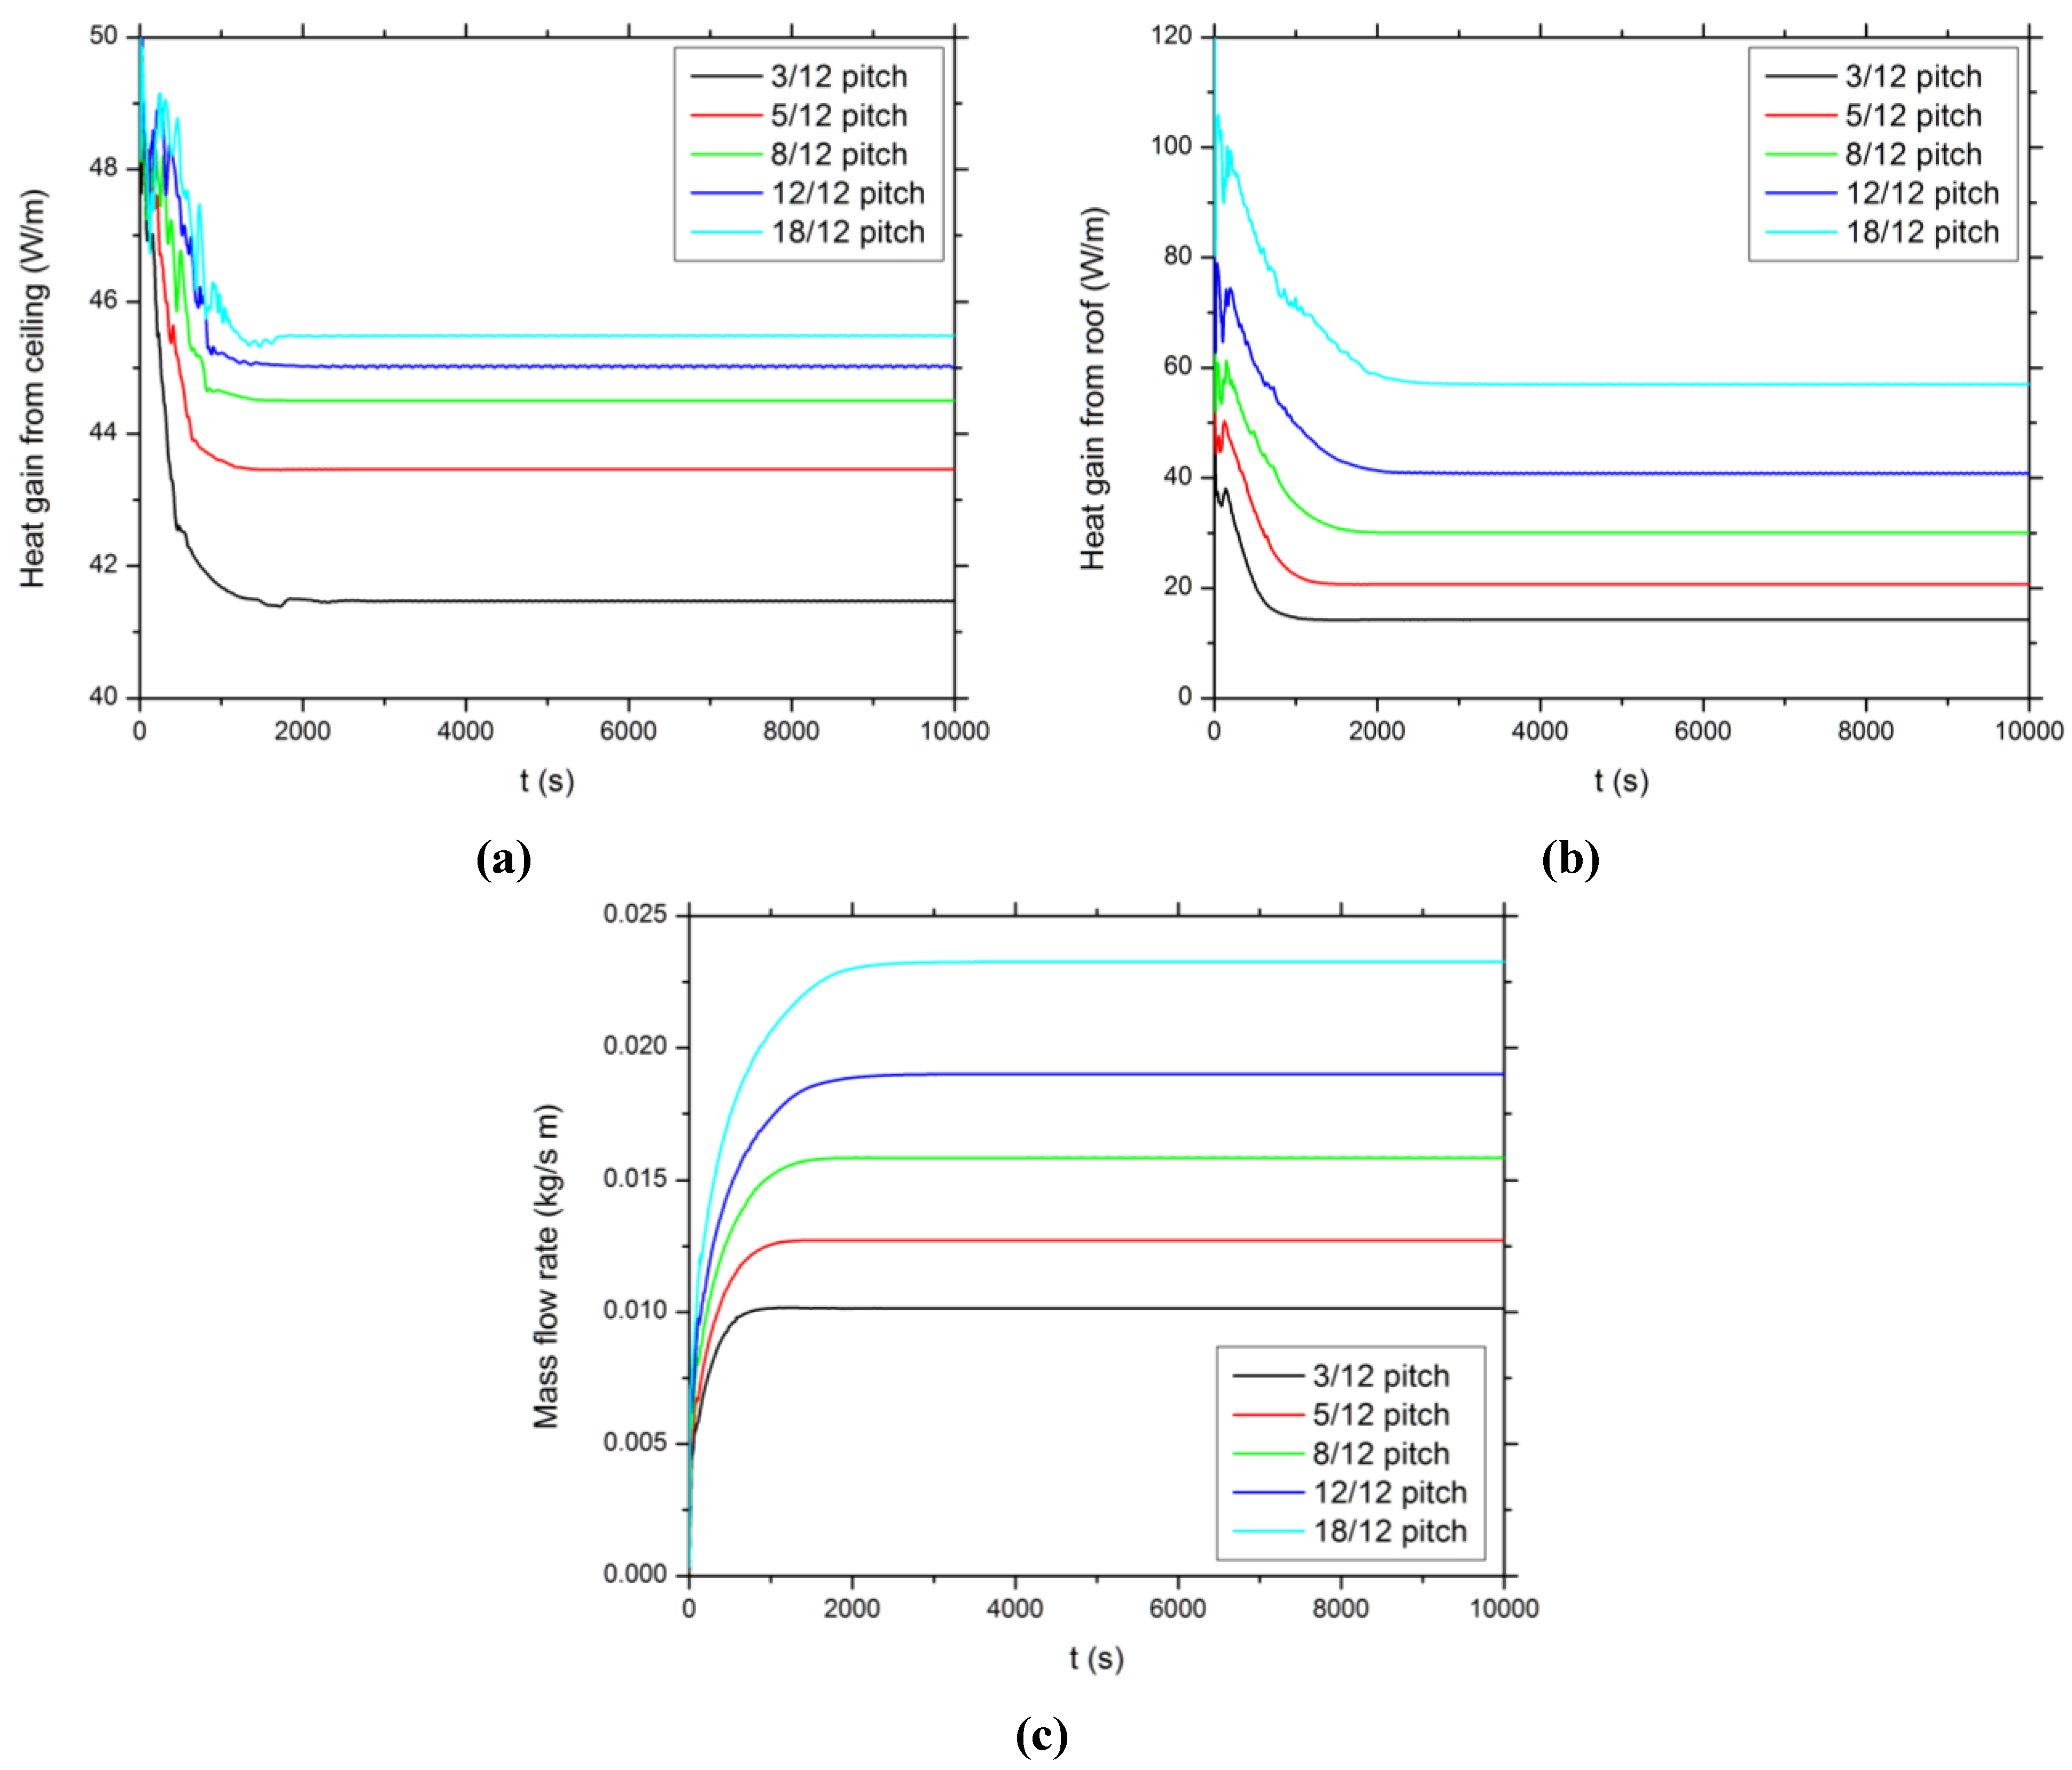
Figure 1b, the solutions converge after ~2500 time steps, as evident in
Figure 7 in terms of the temporal evolution of the heat gains from the ceiling and roof boundaries as well as that of the mass flow rate across the attic space. Similar to the sealed attic cases, the attic heating load, as represented by the heat gain from the ceiling boundary, increases with the roof pitch. As the roof pitch increases from 3/12 to 5/12, 8/12, 12/12, and 18/12, the attic heating load increases by 4.8%, 7.3%, 8.6%, and 10%, respectively. Compared with the sealed attics, the vented attics are predicted to require more heating. This is mainly a consequence of that an ambient air temperature (267 K) lower than the roof temperature (273 K) is specified. If the ambient air has a temperature higher than the roof temperature, the vented attics will require less heating than the sealed attics, as shown in [
22]. Another consequence of the ambient temperature lower than the roof temperature is that the ventilating air actually gains heat from the roofs, in contrast to the sealed attic cases, in which heat is transferred from attic air to the roofs.
Figure 7 also shows that both the heat gain from the roofs and the mass flow rate of the ventilating air increase with the roof pitch. As the roof pitch increases from 3/12 to 5/12, 8/12, 12/12, and 18/12, the mass flow rate of the ventilating air is predicted to increase by 23%, 53%, 83%, and 124%, respectively.
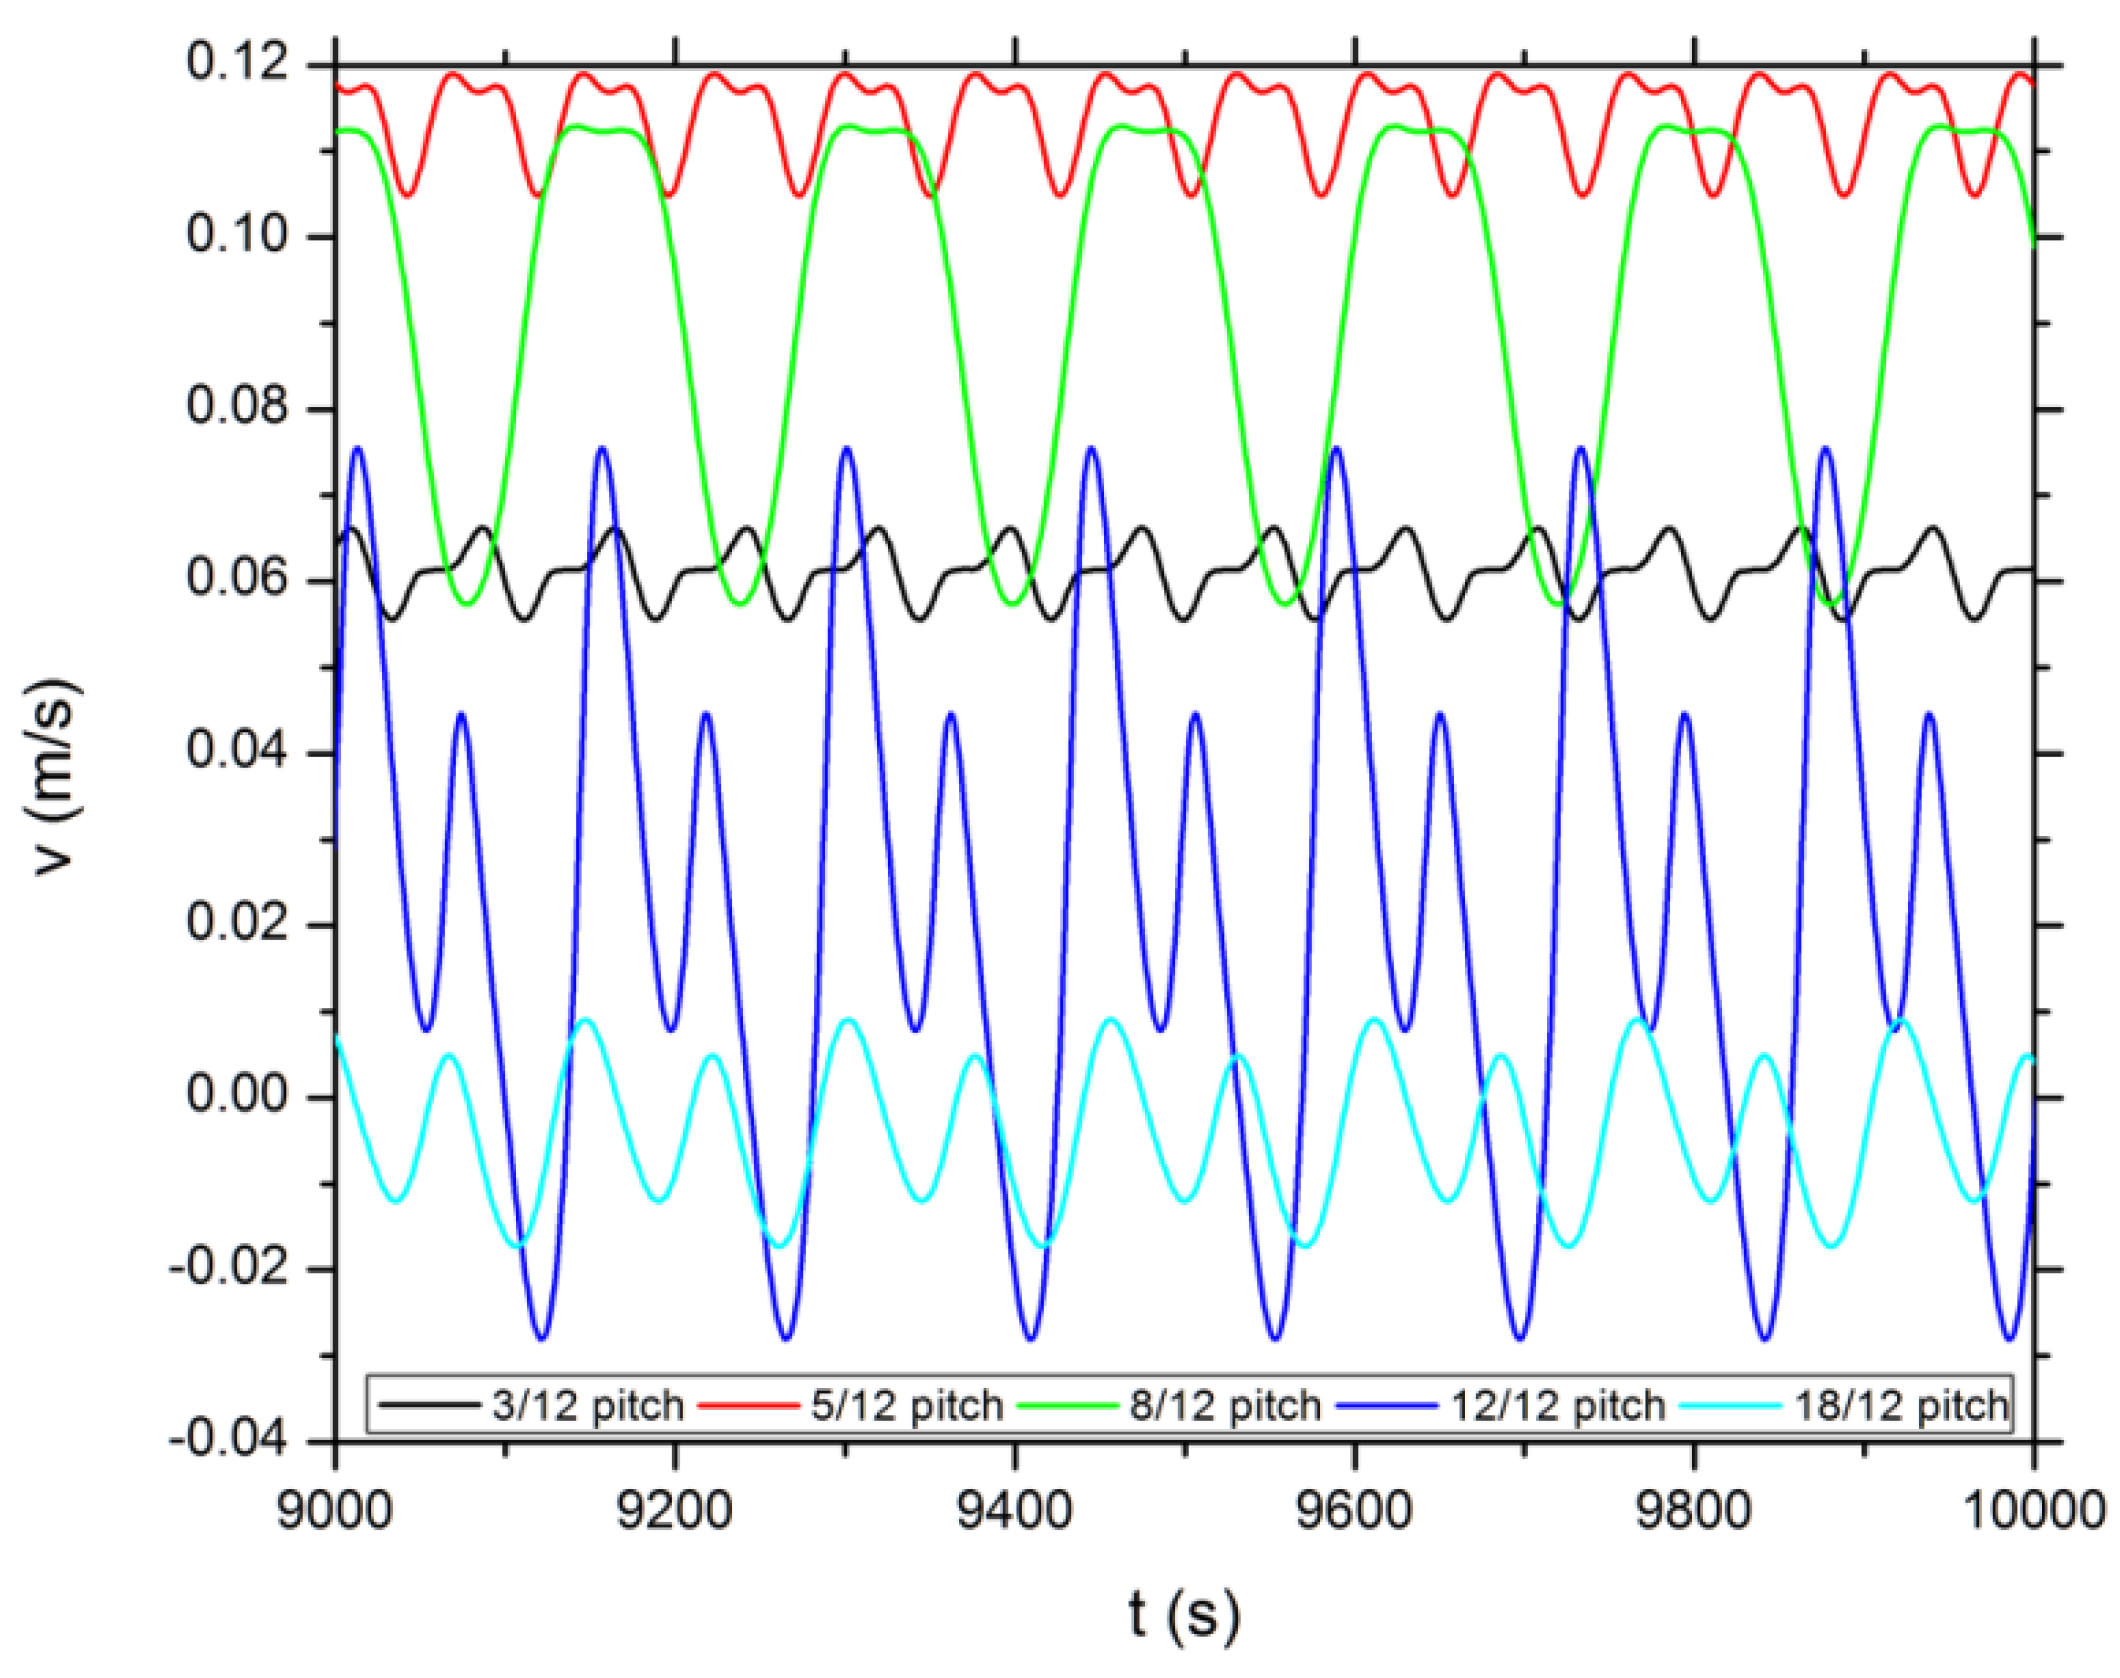
Different from the sealed attic cases in which the steady solutions are obtained, the converged solutions for the vented attics actually include periodical oscillation, which is reflected by the weak waves on some of the curves in
Figure 7, and is clearly shown in
Figure 8 by the temporal variation of the vertical velocity at the location of
x = 0 and
y =
H/2. To our knowledge, such periodical oscillation has never been reported for turbulent natural convection in triangles (either closed or open configurations), although similar oscillation was reported as a controversial issue by previous studies on turbulent natural convection in rectangular enclosures [
29,
30].
Figure 7.
Temporal evolution of (a) heat gain from the ceiling boundary; (b) heat gain from the roof boundaries; and (c) mass flow rate across the attic space for vented attics with different roof pitches.
Figure 7.
Temporal evolution of (a) heat gain from the ceiling boundary; (b) heat gain from the roof boundaries; and (c) mass flow rate across the attic space for vented attics with different roof pitches.
Figure 8.
Periodical oscillation in vertical velocity at the location of x = 0 and y = H/2 for vented attics with different roof pitches.
Figure 8.
Periodical oscillation in vertical velocity at the location of x = 0 and y = H/2 for vented attics with different roof pitches.
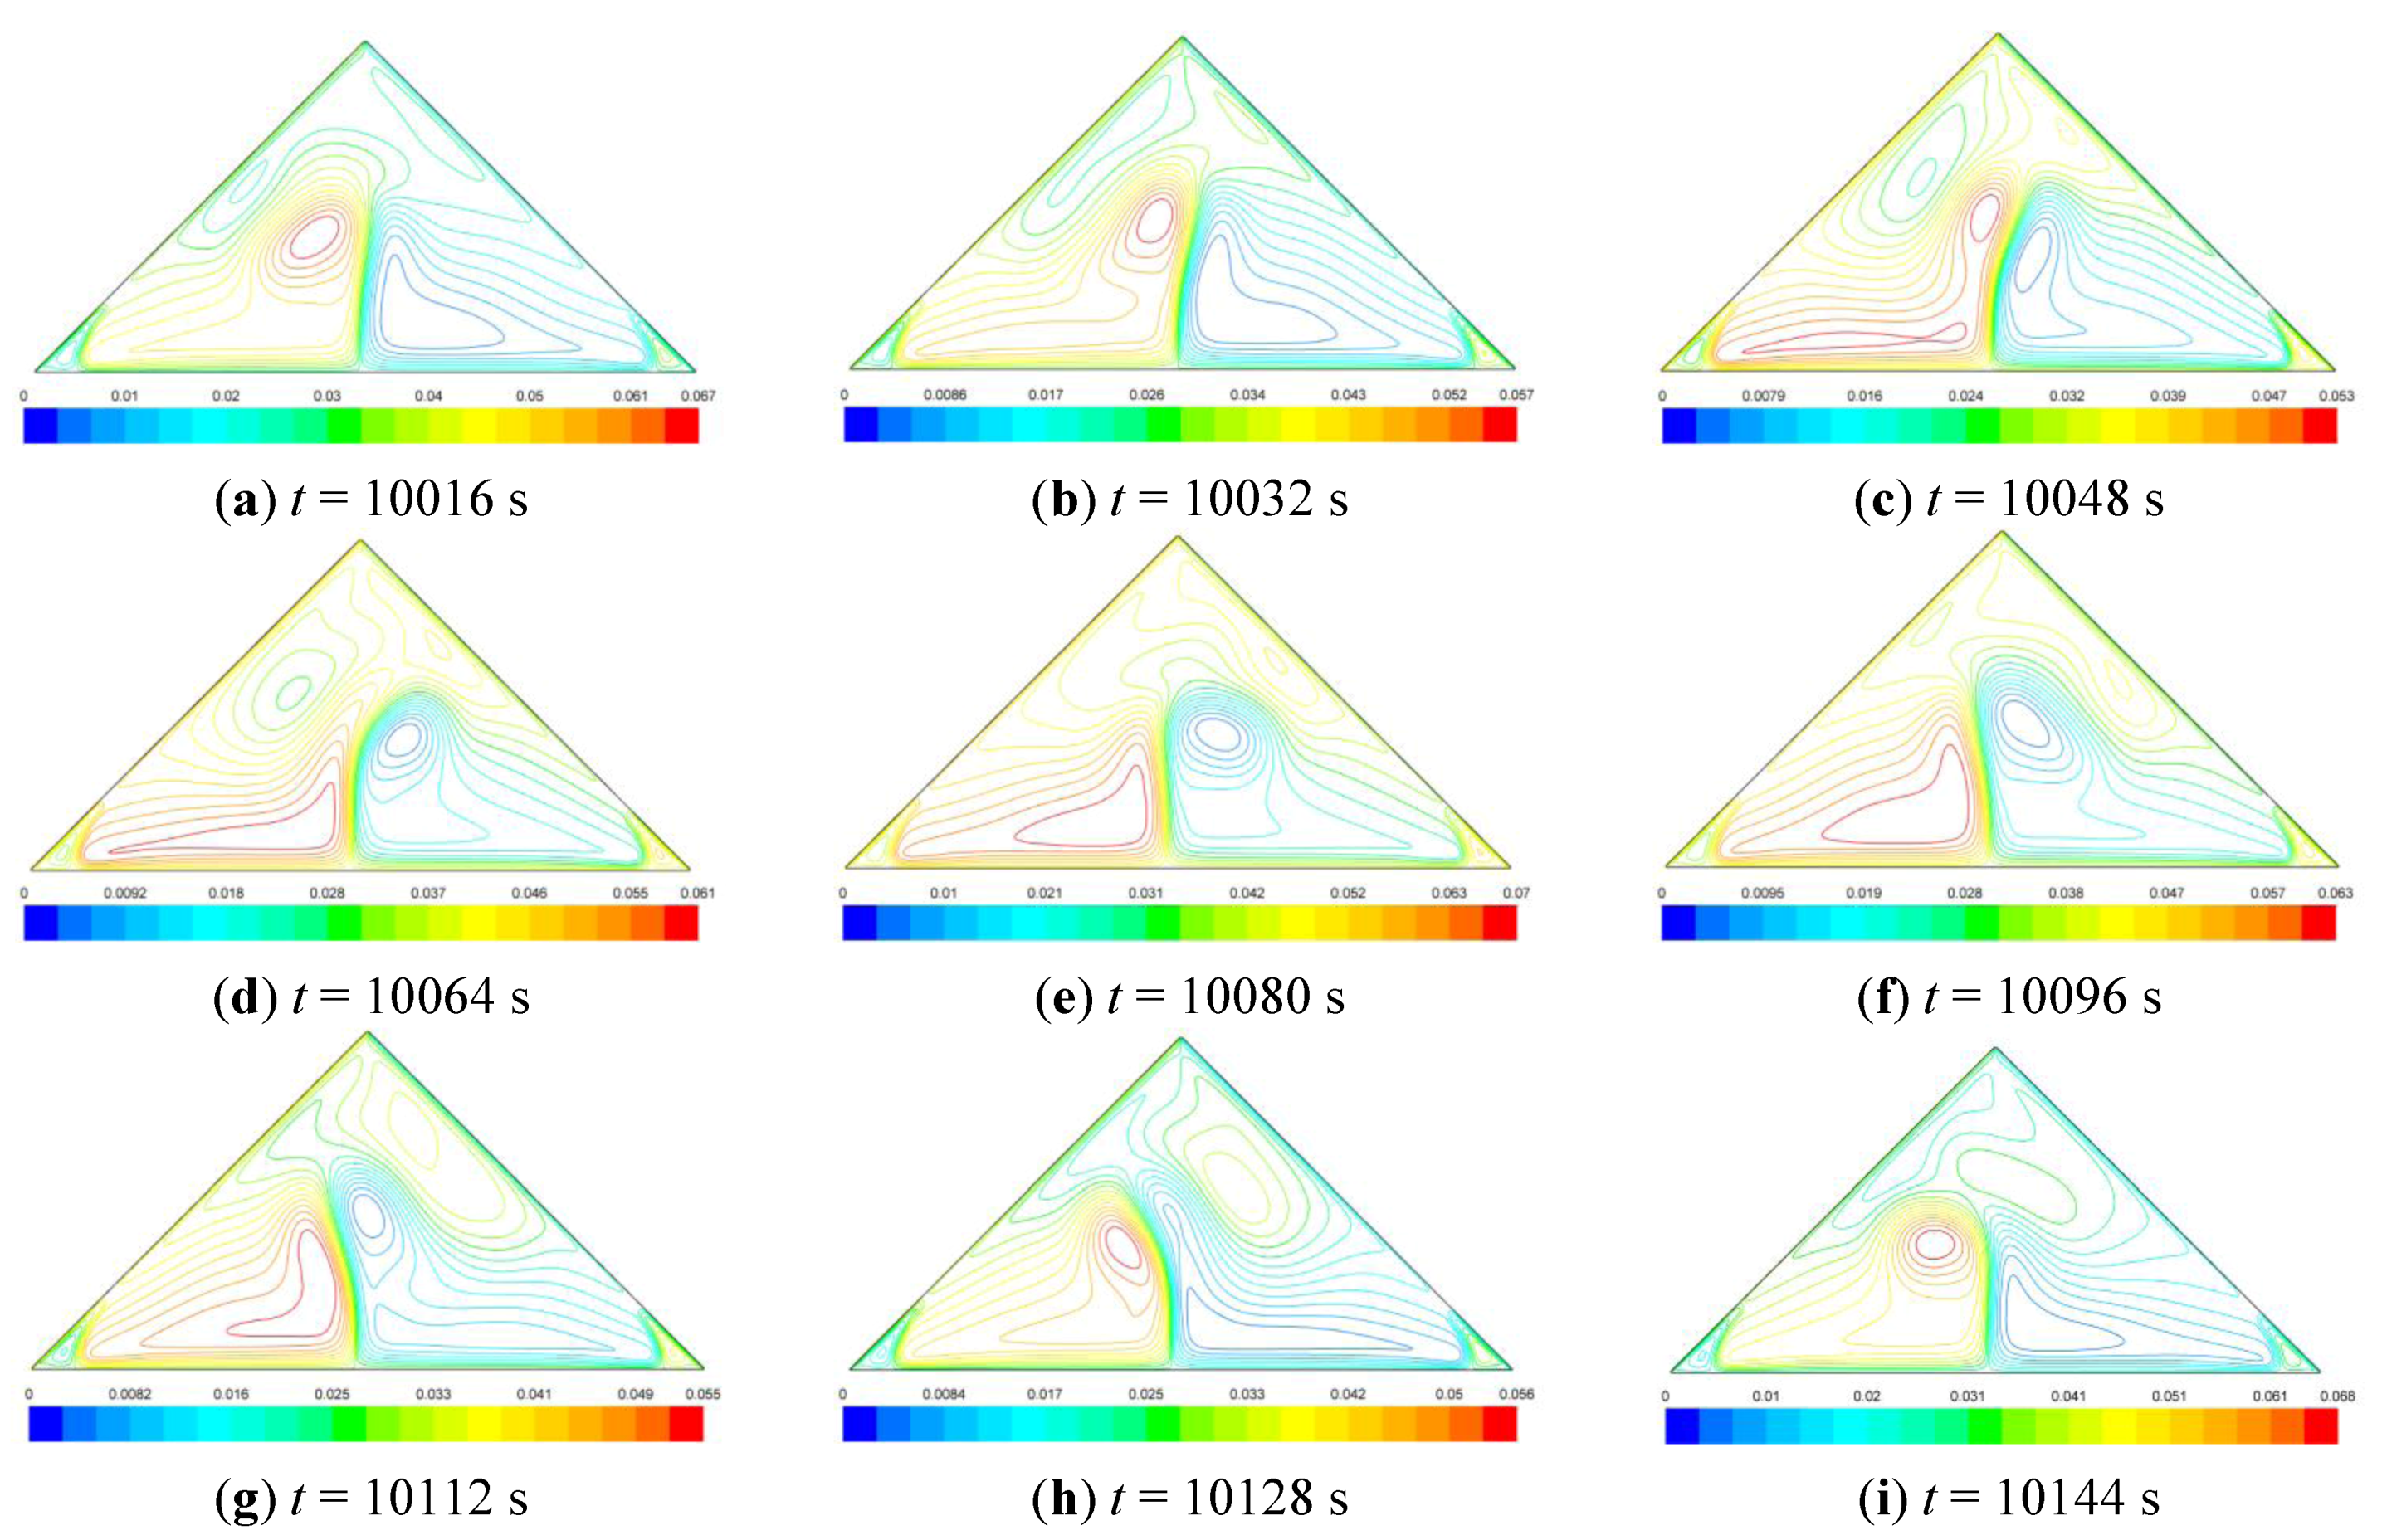
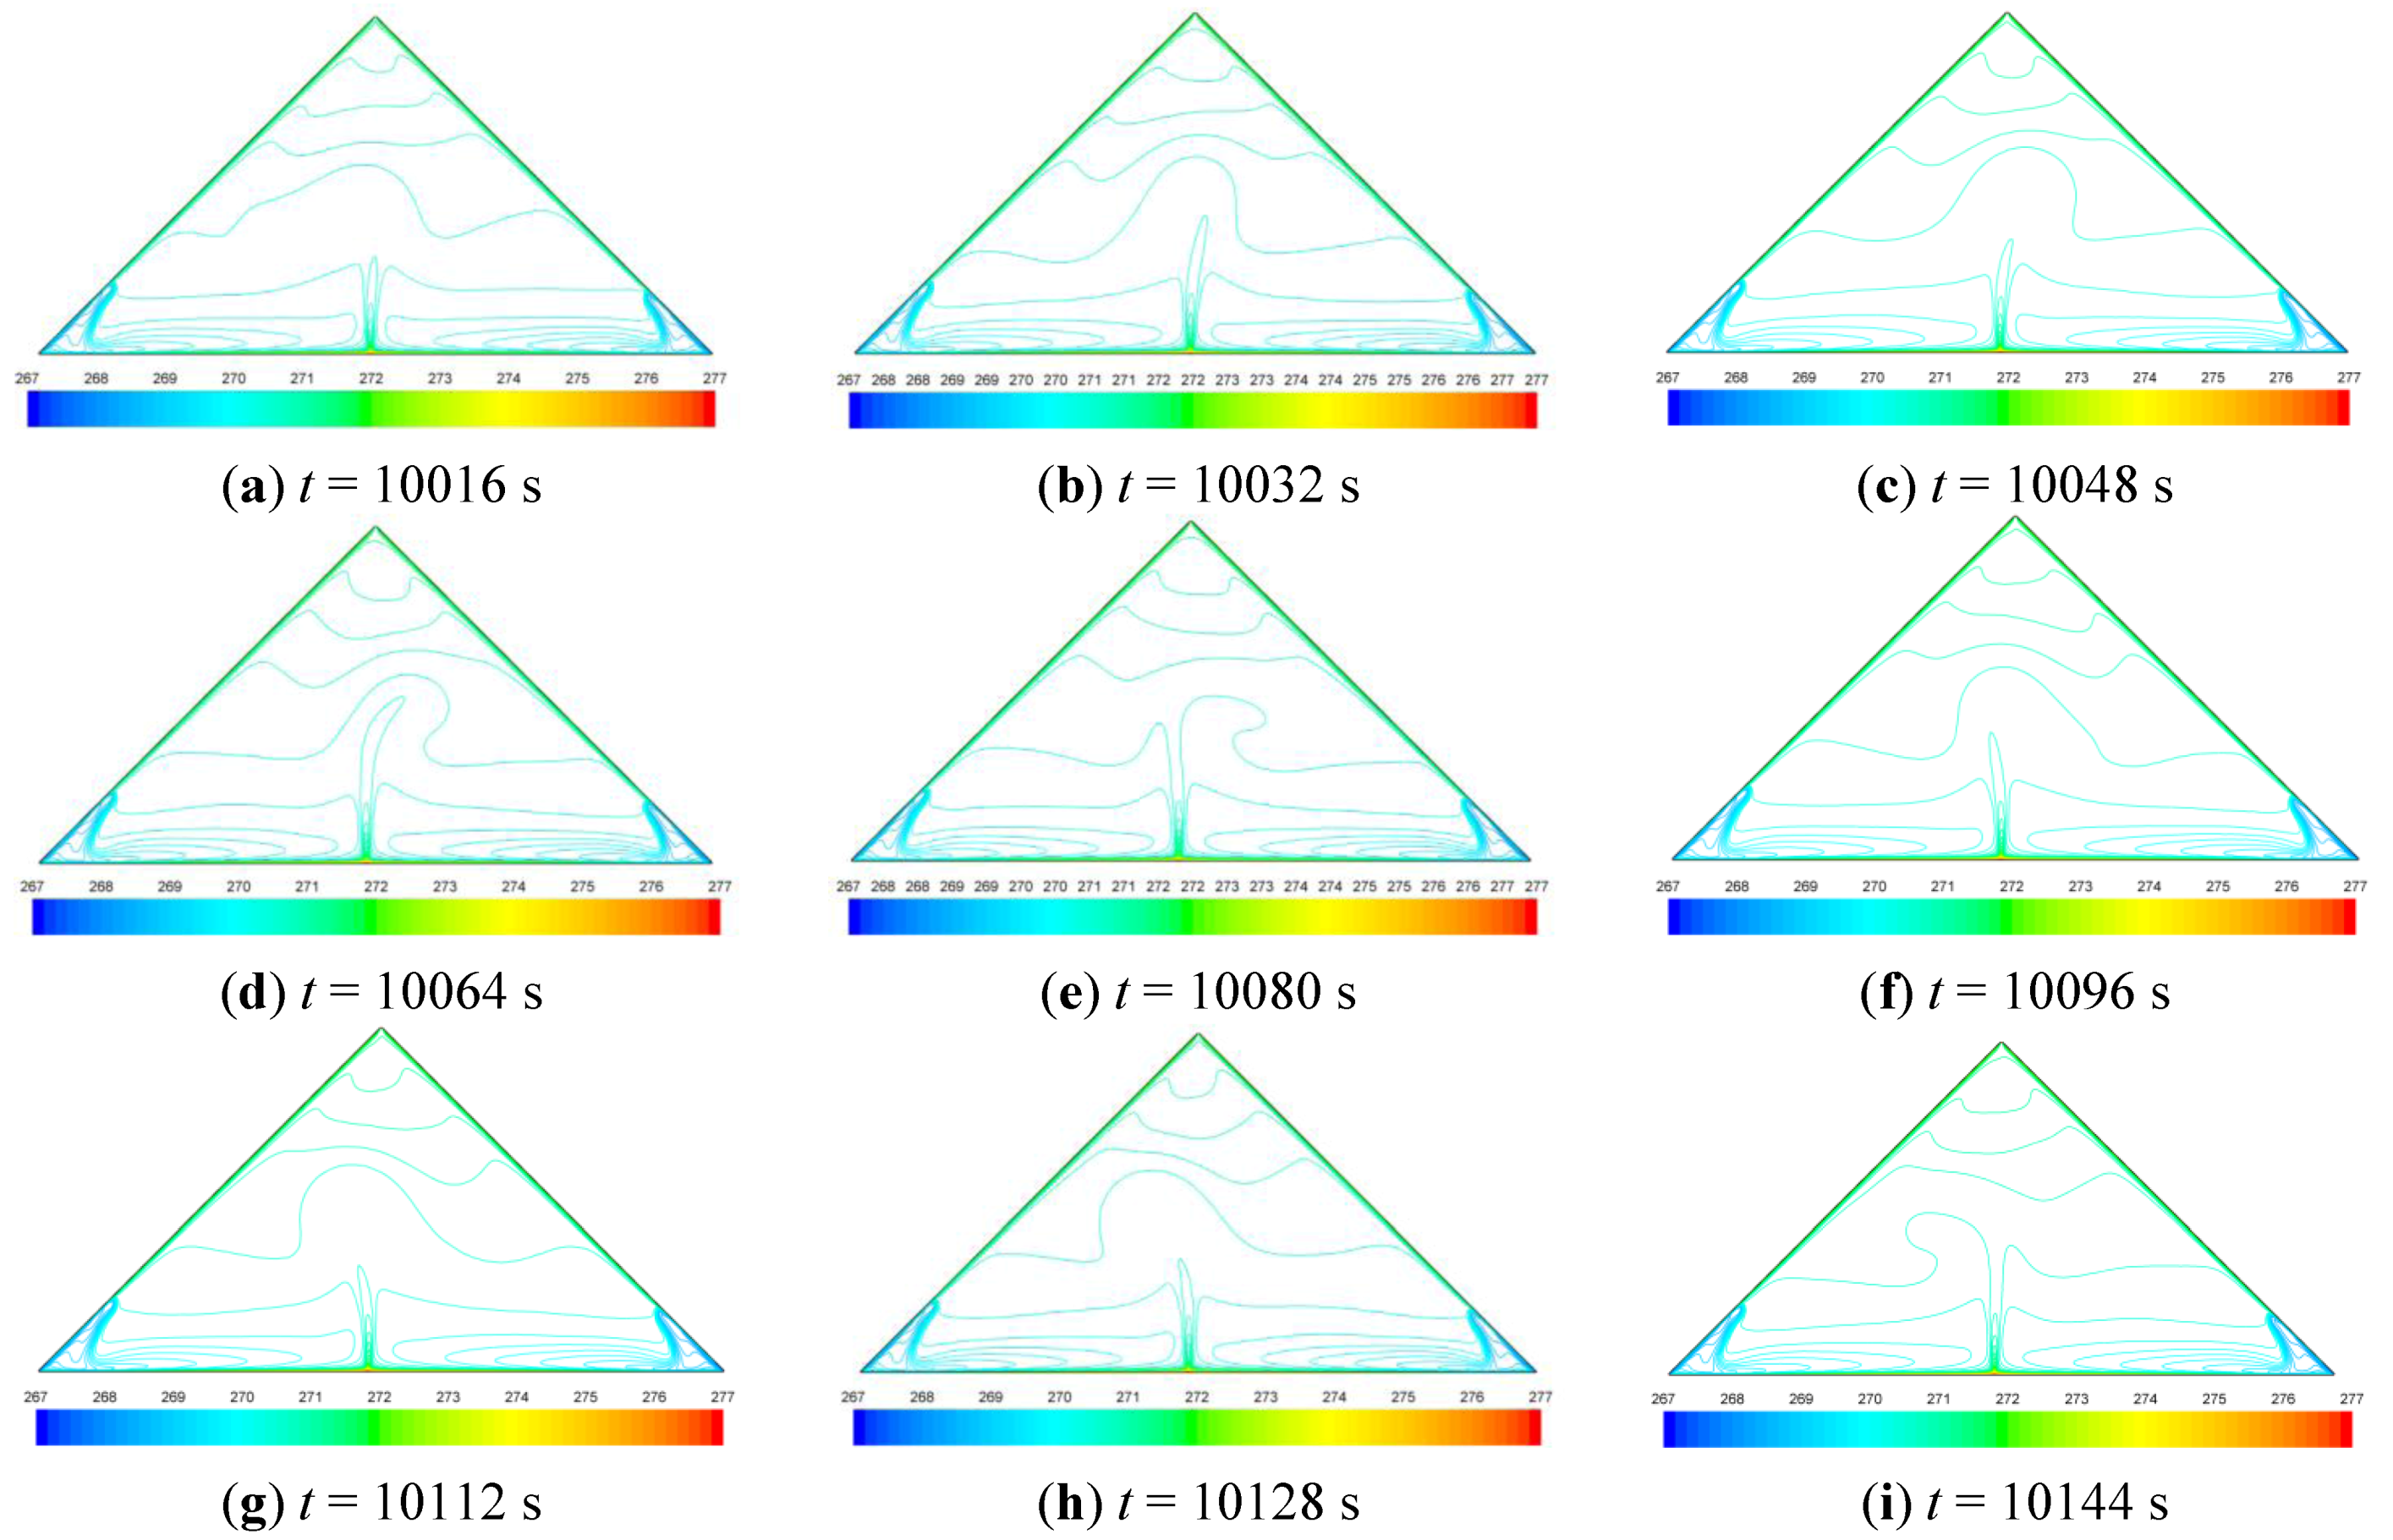
In order to clearly show a detailed picture of this periodical oscillation, snapshots of the velocity and temperature fields at selected instances within one oscillation cycle for the 12/12 pitch case are given in
Figure 9,
Figure 10, in terms of streamlines and isotherms, respectively. It can be observed from
Figure 9 that the oscillation is mainly confined in the core region and related to the periodical variation in vortex intensity of multiple convection cells. As the vortex intensity varies alternately, the spatial pattern of convection cells changes as well. In turn, the flow pattern change controls the variation in isotherm pattern, as shown in
Figure 10.
Although more theoretical and experimental studies are needed to determine the fundamental mechanism that generates this periodical oscillation, we consider such oscillation as physically meaningful phenomenon, instead of a reflection of numerical singularity, based on the following observations. Firstly, the periodical oscillation is independent of the selection of turbulence model. It is found that essentially the same periodical oscillation also appears in solutions based on the SST
k-
ω model [
33] for the same vented attic problems. Secondly, the oscillation does not decay with the flow time. It does not die out even after hundreds of thousands time steps. Thirdly, the oscillation occurs in all the vented attic cases but in none of the sealed attic cases. It suggests that the oscillation may be actuated by the additional degrees of freedom provided by the ventilating air. Finally, the period of the oscillation seems to be of physical significance. As shown in
Figure 8, the oscillations in the 3/12 and 5/12 attics have a period of around 75 s, while those in the 8/12, 12/12 and 18/12 attics have a period of around 150 s. Such a period double phenomenon may have a physical basis, e.g., the number of the oscillating convection cells in the high pitched attics is twice that in the lower pitched attics. Since the oscillation features captured in
Figure 9,
Figure 10 are hardly represented by the existing RANS turbulence models, a direct numerical simulation or large eddy simulation may be the best way to further investigate the nature of the periodical oscillation.
Figure 11 shows the distributions of streamlines and isotherms at t = 10,000 s for the vented attics with various roof pitches. Disregarding the influence of the periodical oscillation discussed above, the velocity and temperature fields for all the roof pitch cases are basically symmetric about x = 0, which is clearly different from the asymmetric fields in the sealed attics shown in
Figure 2. It is also clear from
Figure 11 that the temperature distribution in the upper portion is stratified, and the thermal stratified region grows remarkably with the attic height.
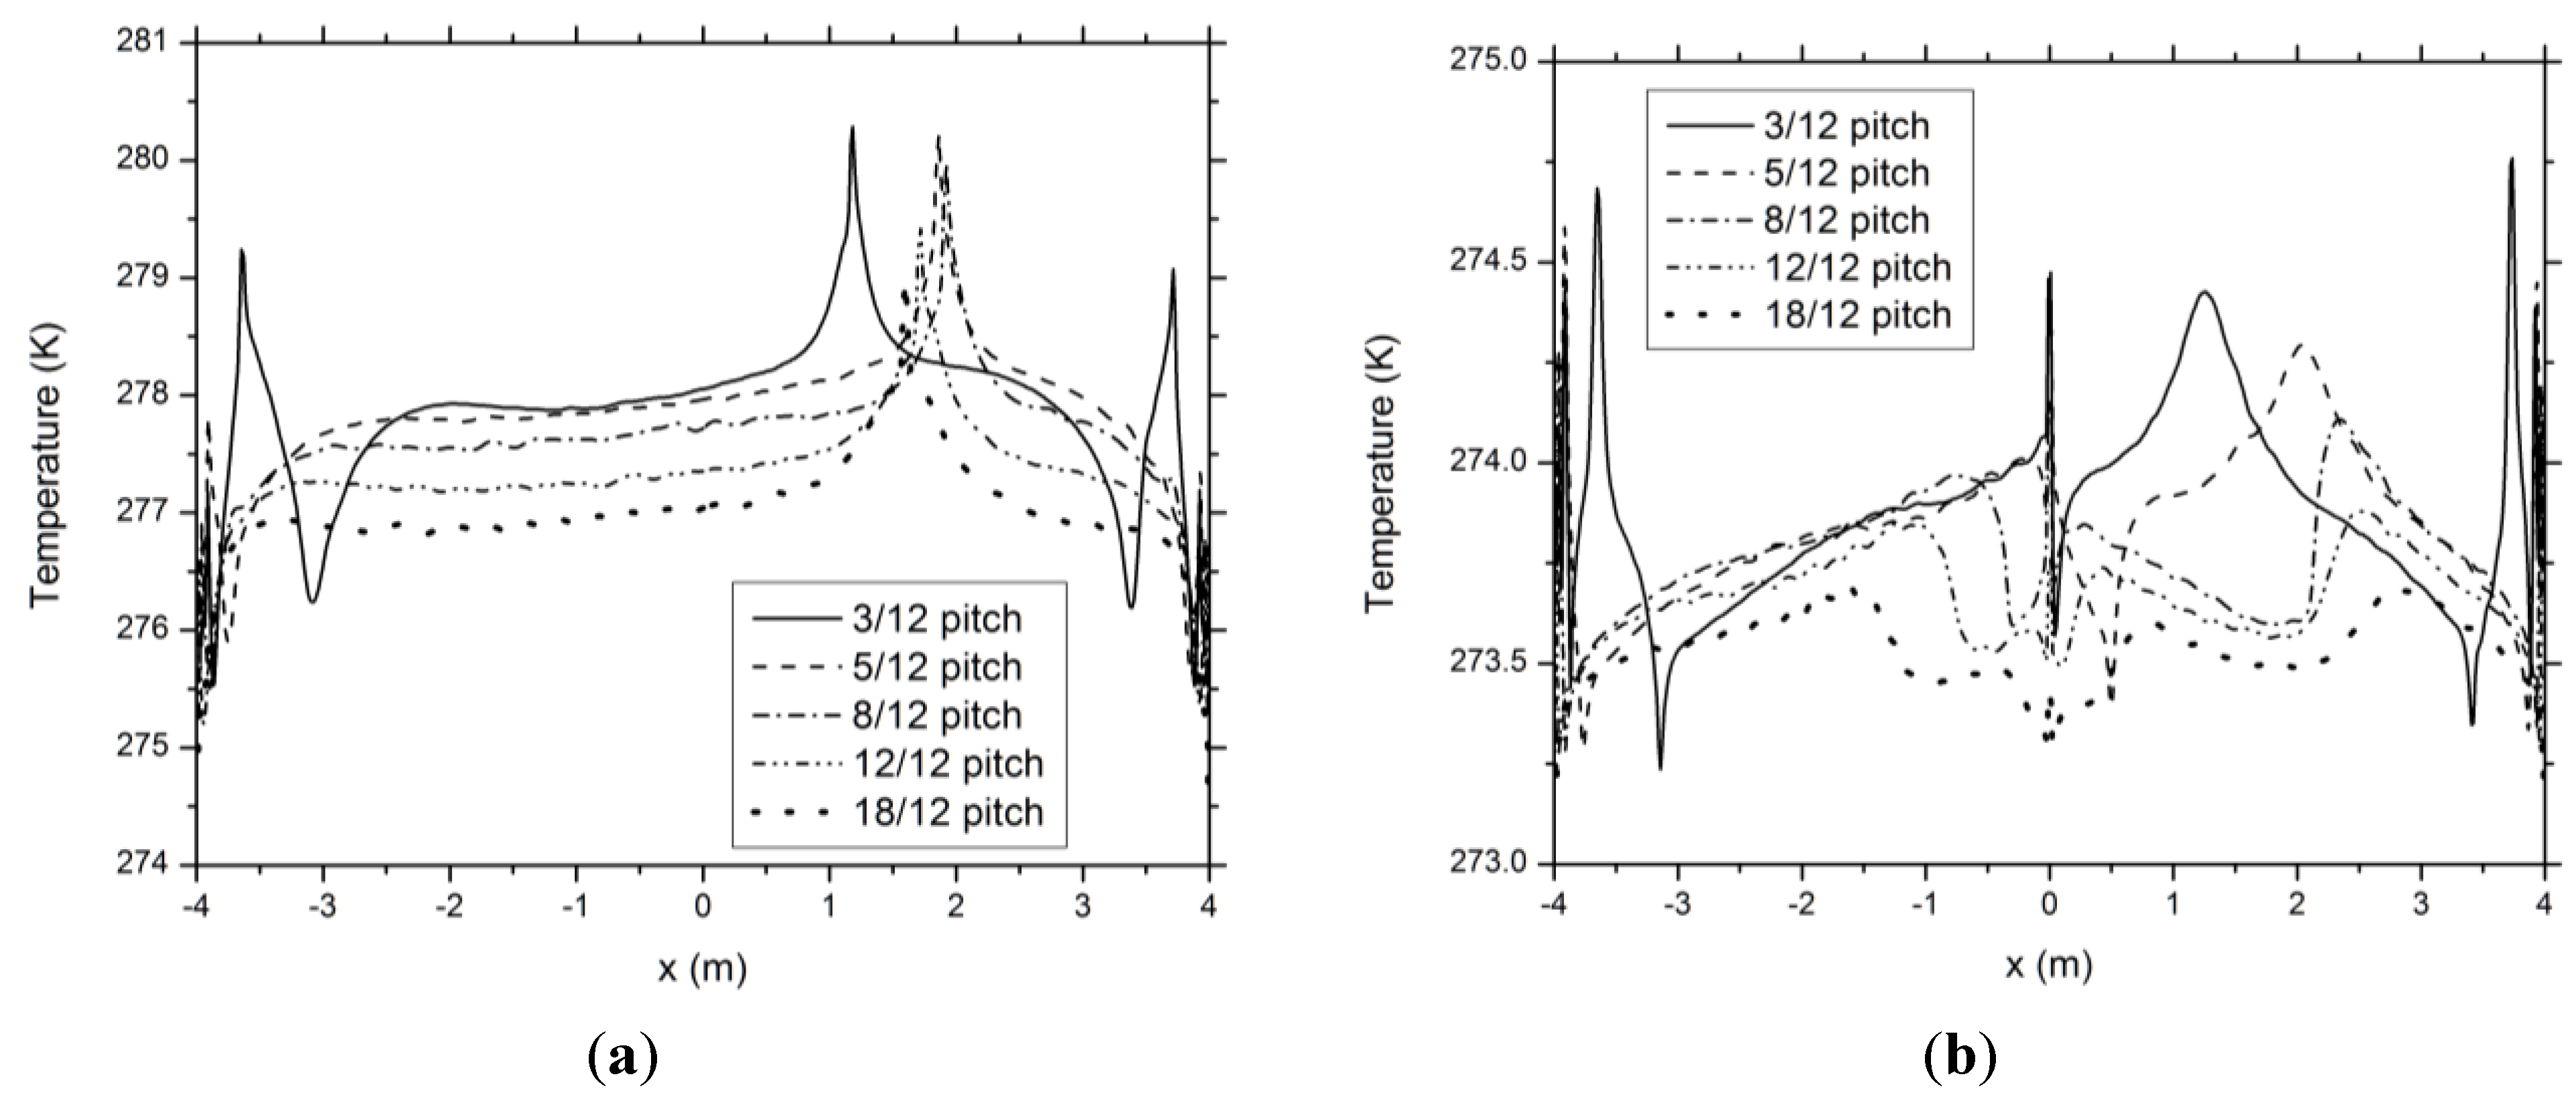
The predicted temperature distributions at the ceiling and roof boundaries at
t = 10,000 s for the vented attics with various roof pitches are shown in
Figure 12. The peaks and valleys of the curves are controlled by the convection cell distributions. For all the cases, the predicted boundary temperatures are essentially symmetric about
x = 0, and not affected by the periodical oscillation. This may be explained by the strongest viscous effects existing along the boundaries. Similar to the sealed attic cases, it can be observed in
Figure 12 that both the ceiling-top and roof-bottom temperatures tend to decrease with the roof pitch.
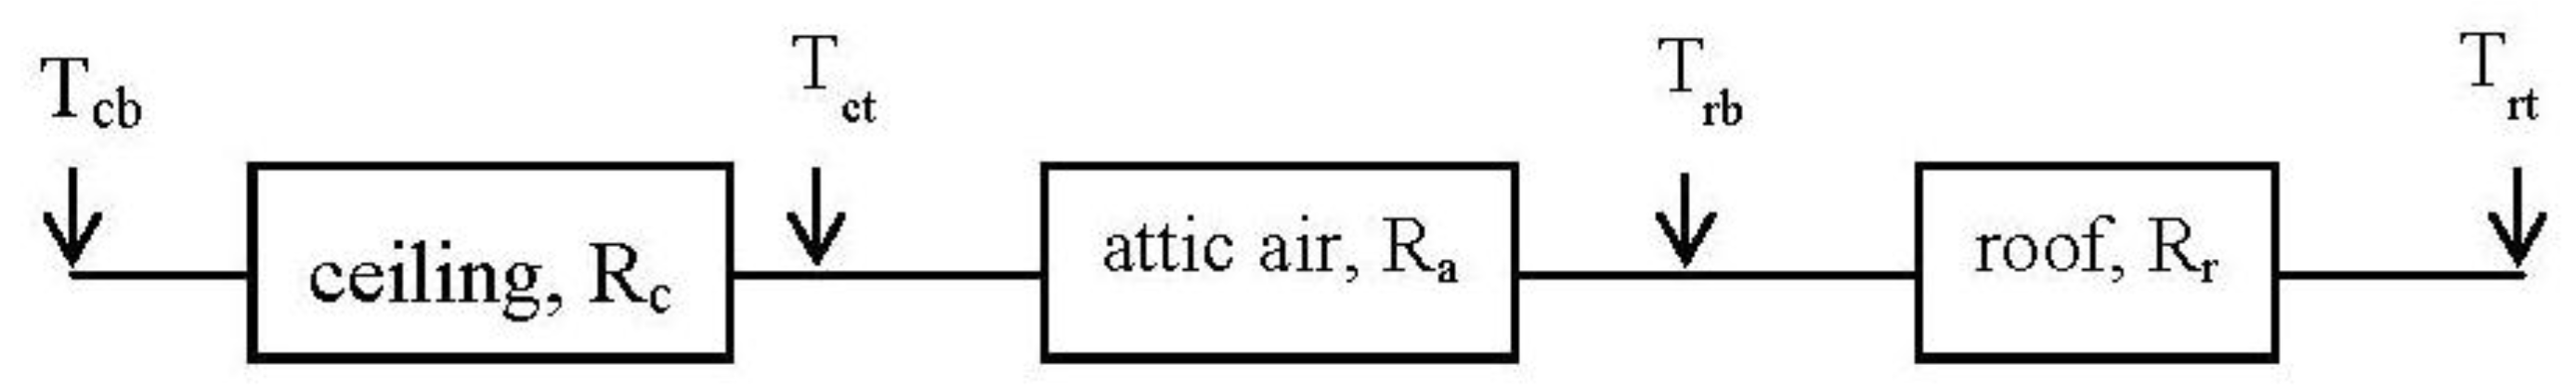
The overall thermal performance of the vented attics can be quantified based on a thermal resistance analysis, similar to the analysis for the sealed attics. The thermal resistance diagram for the vented attics is shown in
Figure 13. Different from the resistances in series shown in
Figure 5 for the sealed attics, the resistance diagram for the vented attics consists of two parallel branches, one for the ceiling side and the other for the roof side. Consequently, the resistances on each side are determined separately, based on the converged heat gains (
Figure 7) from the ceiling and roof boundaries, respectively. The obtained various resistances are listed in
Table 4, which shows that both the ceiling and roof side resistances decrease with the increase in roof pitch.
Figure 9.
Snapshots of predicted streamlines (in kg/m s) at various times in the vented attic with a 12/12 pitch.
Figure 9.
Snapshots of predicted streamlines (in kg/m s) at various times in the vented attic with a 12/12 pitch.
Figure 10.
Snapshots of predicted isotherms (in K) at various times in the vented attic with a 12/12 pitch.
Figure 10.
Snapshots of predicted isotherms (in K) at various times in the vented attic with a 12/12 pitch.
Figure 11.
Predicted (left) streamlines (in kg/m s) and (right) isotherms (in K) at t = 10,000 s in vented attics with roof pitches of 3/12, 5/12, 8/12, 12/12, and 18/12, respectively.
Figure 11.
Predicted (left) streamlines (in kg/m s) and (right) isotherms (in K) at t = 10,000 s in vented attics with roof pitches of 3/12, 5/12, 8/12, 12/12, and 18/12, respectively.
Figure 12.
Predicted temperatures at the ceiling (a) and roof (b) boundaries at t = 10,000 s in vented attics with different roof pitches.
Figure 12.
Predicted temperatures at the ceiling (a) and roof (b) boundaries at t = 10,000 s in vented attics with different roof pitches.
Figure 13.
Diagram of thermal resistance for vented attics.
Figure 13.
Diagram of thermal resistance for vented attics.
Table 4.
Thermal resistances, in R-value (R-1 = 0.17611 Km2/W), for vented attics with different roof pitches.
Table 4.
Thermal resistances, in R-value (R-1 = 0.17611 Km2/W), for vented attics with different roof pitches.
| Pitch | Rt,c (Ceiling-Side Total) | Ra,c (Ceiling-Side Air) | Rt,r (Roof-Side Total) | Ra,r (Roof-Side Air) |
|---|
| 3/12 | 28.480 | 8.480 | 19.127 | 17.963 |
| 5/12 | 27.176 | 7.176 | 13.148 | 12.040 |
| 8/12 | 26.541 | 6.541 | 9.070 | 8.072 |
| 12/12 | 26.229 | 6.229 | 6.693 | 5.844 |
| 18/12 | 25.964 | 5.964 | 4.784 | 4.118 |
In terms of the resistance diagram (
Figure 13) and the thermal resistances listed in
Table 4, the representative ceiling-top and roof-bottom temperatures are calculated and listed in
Table 5. A comparison between the temperatures listed in
Table 5 and the temperature curves in
Figure 12 confirms the effectiveness of the thermal resistance analysis in determining the representative boundary temperatures.
Table 5.
Representative ceiling-top and roof-bottom temperatures together with derived Nusselt and Rayleigh numbers for vented attics with different roof pitches.
Table 5.
Representative ceiling-top and roof-bottom temperatures together with derived Nusselt and Rayleigh numbers for vented attics with different roof pitches.
| Pitch | Tct (K) | Nu = HQc/2W(Tct− Tin)λ | Ra = ρ2cpgβH3(Tct− Tin)/λµ | Trb (K) | Nu = HQr/2W(Trb− Tin)λ | Ra =
ρ2cpgβH3(Trb − Tin)/λµ |
|---|
| 3/12 | 274.74 | 27.91 | 1.14 × 10⁹ | 272.63 | 13.18 | 8.29 × 10⁸ |
| 5/12 | 273.87 | 54.91 | 4.69 × 10⁹ | 272.49 | 32.78 | 3.75 × 10⁹ |
| 8/12 | 273.41 | 96.42 | 1.79 × 10¹⁰ | 272.34 | 78.16 | 1.49 × 10¹⁰ |
| 12/12 | 273.17 | 152.05 | 5.83 × 10¹⁰ | 272.24 | 162.05 | 4.95 × 10¹⁰ |
| 18/12 | 272.97 | 238.12 | 1.90 × 10¹¹ | 272.16 | 345.02 | 1.64 × 10¹¹ |
Accordingly defined Nusselt numbers and Rayleigh numbers for both the ceiling and roof sides are listed in
Table 5 as well.
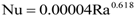
Figure 14 shows that the (Nu, Ra) data points for both the ceiling and roof sides are linearly distributed on a log-log plot, and the following empirical correlations are obtained by fitting the data points,
i.e.,
for the ceiling side air flow, and
for the roof side air flow. Both the correlations are expected to be valid for vented attics under conditions similar to those specified in this study. More experimental or numerical data are needed to test if these correlations can be generalized to cover a wider parameter range.
Figure 14.
Correlations for heat transfer on (a) the ceiling side and (b) the roof side within vented attics developed based on numerical predictions.
Figure 14.
Correlations for heat transfer on (a) the ceiling side and (b) the roof side within vented attics developed based on numerical predictions.


