2. Research Context
In the case of Indonesia, the urban vulnerability integration into the (risk based) spatial plan becomes critical due to strong political endorsement. The Indonesian government has strategically mainstreamed disaster risk reduction into a development agenda through Act Nr. 24/2007 on Disaster Management and Act Nr. 26/2007 on Spatial Plan. This national agenda entitles for local practice. In particular, the local government of the Bantul District has initiated the risk based spatial plan. However, previous research has indicated that the new local spatial plan has integrated less information about the vulnerability due to seismic hazard, and has presented more on hazard information [
5]. Therefore, in order to manifest the national agenda, many local areas in Indonesia strive hard to pursue the risk based spatial plan.
Some may raise the question why the (risk based) spatial plan entails urban vulnerability, while in many cases people doubt the efficacy of the (risk based) spatial plan
per se. This argument arises due to limitations of knowledge, technical ability, supporting resources and substantive empowerment, which of course have caused a shortcoming of risk assessment [
5]. This has challenged scholars to indicate which conceptual framework is feasible to explain the urban vulnerability concept in a spatial plan context. Another question is why the urban vulnerability terms are used. The answer is simply that they relate to urban form, pattern and structure, and also involve any objects that reside within urban areas, thus the urban terms become significant here.
The vulnerability concept is rooted deeply within each scientific domain. In the natural science domain, urban vulnerability is expressed strictly as an intrinsic part of a threatened system or the hazard impact
per se [
6,
7]. As the natural sciences express urban vulnerability as a quantifiable outcome of losses and damages, the social sciences expand the idea to qualify a process beyond the hazard itself to define an unfortunate condition a so-called vulnerability [
8,
9,
10,
11,
12,
13]. The cause of vulnerability is not merely dependant on the hazard occurrence, but it is also affected by social, political, economical and cultural attributes. In a different setting, the applied sciences notice a spatial-temporal function within the pattern of losses and damage and also within an unfortunate condition [
13,
14,
15,
16]. A seminal work in the applied sciences, which elaborates the spatial-temporal approach, is place-based vulnerability [
14]. The place-based vulnerability concept has argued that natural (physical-)social interplay within specified geographic and temporal boundaries constructs a certain degree of loss and damage with a certain degree of hazard severity, and it involves adverse reactions of social and natural systems [
14]. Thus, the urban vulnerability we discuss here encompasses a myriad of criteria within specified spatial boundaries,
i.e., physical, demographic, social-economic and build-up setting, hazard likelihood, loss/damage record
etc. Meanwhile, others have expressed vulnerability as the severity level of one being affected by a hazard and the fragility of an element at risk (
i.e., building, infrastructure) being exposed to it [
13]. Herein, the author reveals that within spatial-temporal boundaries there are various elements at risk, which indicate different response behaviors to disaster. Through there is a massive conceptual overview, research argues that the applied science domain has promoted a possible approach to urban vulnerability and risk-based spatial plan context.
Deriver from this conceptual basis, the urban vulnerability employed within this research is defined as the social and physical vulnerability distributed uniquely among temporal and spatial entities. It delineates the classic separation between social vulnerability assessment (representing a pre-existing condition of people per se which potentially experience losses during future hazard scenarios) and physical vulnerability assessment (representing a pre-existing condition of an urban settlement unit which potentially might be damaged during future hazard scenarios). In more detail, this research perceives urban vulnerability as an important urban indicator to predict pre-existing unfavorable conditions due to seismic hazards expressed on a scale from 0 (no loss/damage)–1 (lethal/full damage) within a specified time frame.
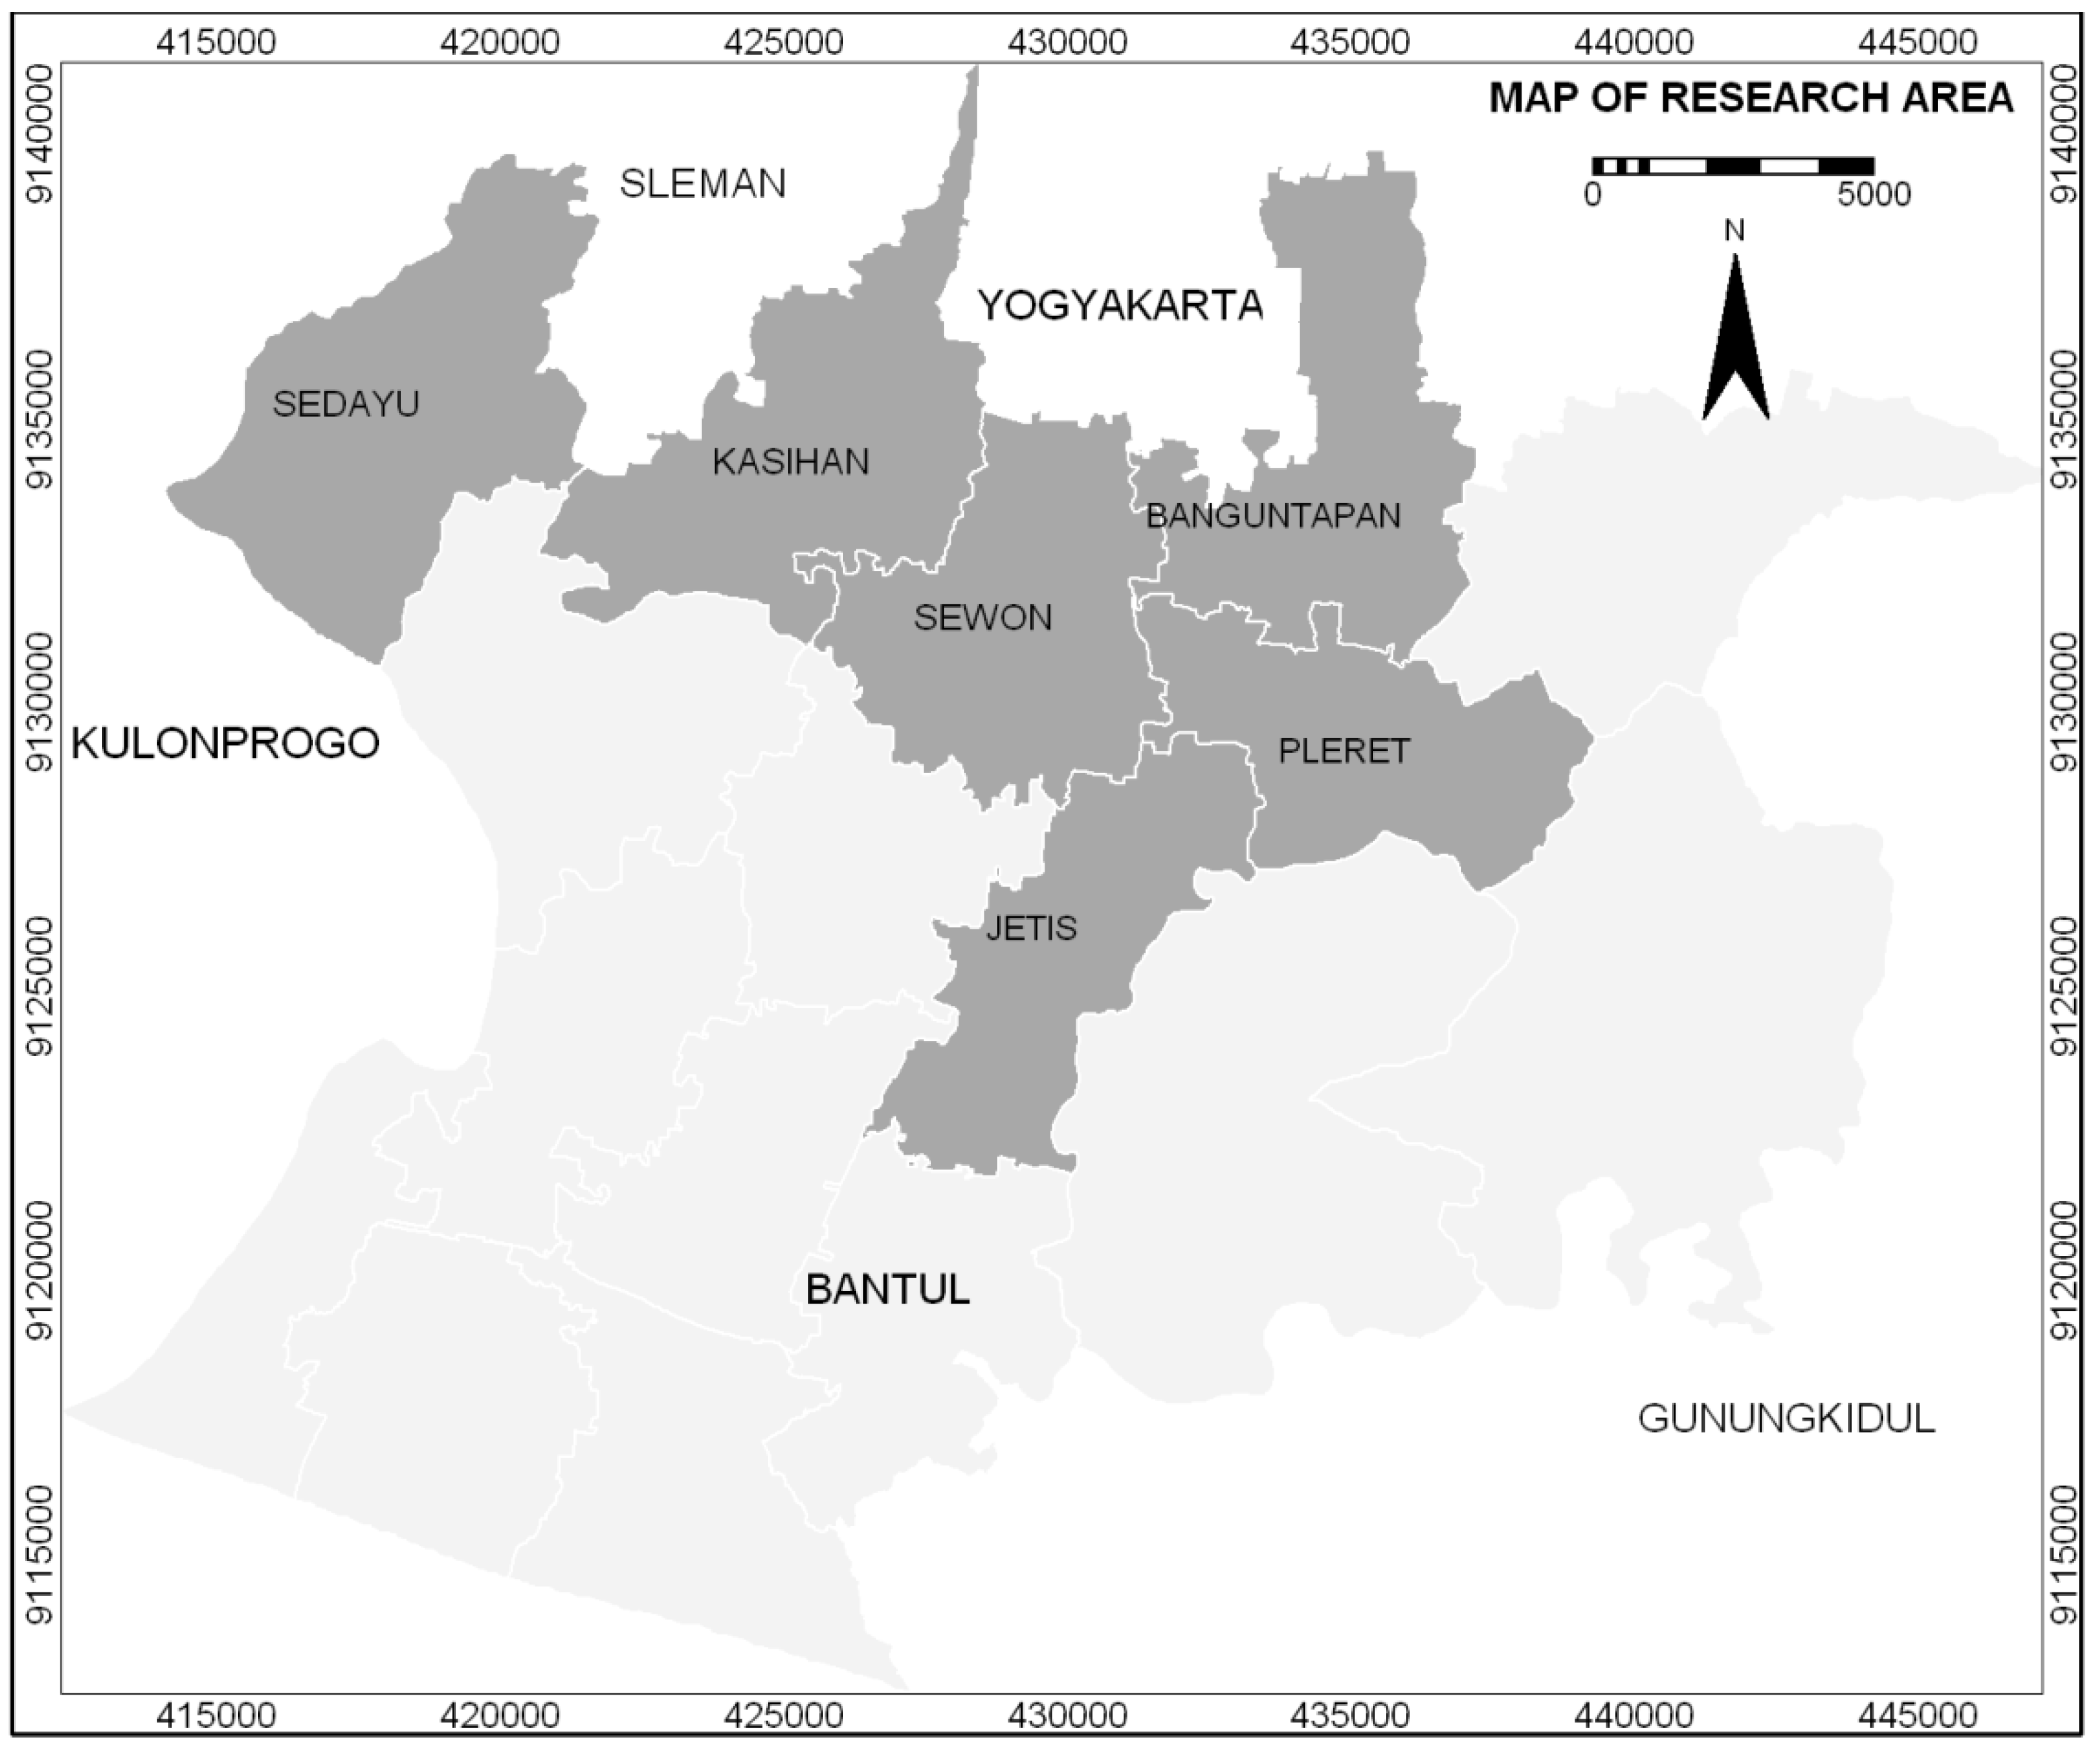
The research area addresses six sub-districts (Banguntapan, Kasihan, Sewon, Sedayu, Pleret and Jetis) in the Bantul District, D.I Yogyakarta Province—Java Island, Indonesia (see
Figure 1). These sub-districts are equipped with the so-called risk-based spatial plan, although they have very limited information about hazards. Overall, the research area has experienced three major environmental issues,
i.e., (1) diverse seismic intensity level; (2) rapid land conversion and (3) domination of a low-income group. Geologically, it is adjacent to an active subduction zone of south Java Island—a part of the Indo-Australian tectonic plate that has subducted beneath the Eurasian plate [
17]. It experienced a 6.2 Mw earthquakes on May 27, 2006, with the epicenter located near the active Opak fault line. The research area suffered 5700 deaths, economic losses up to 3.1 billion US$ and damage of nearly 80% of the total 508 km
2 area [
18]. Located in such a critical geologic setting regarding seismic hazards, Bantul District is expected to experience another earthquake of high intensity within the next 50 years. The area was home to more than 823,000 in 2004 and up to 954,000 people in 2010, while nearly 44% of total the inhabitants or 425,057 inhabitants live in the six sub-districts [
18,
19,
20]. The research area depicts sub urban setting and is dominated by low to medium income groups earning their living in the agriculture (42%) and non-agriculture sector (58%) [
19]. There has been a rapid land conversion in the research area since the early 2000s, which occurred to accommodate the rapid population growth and urbanization phenomena from neighboring the city—Yogyakarta City—and because of the economic transition from an agriculture-based economy to an industrial-based economy in Bantul Districts [
21]. The long-term development plan of Bantul District has enlisted areas prone to seismic hazards based on their physical aspect, however social, economic, and other potential vulnerability criteria have not yet been evaluated.
Suffice to say, the research area underlies a complex environmental burden either originating from the natural hazard potential and or from a high man-land relation potential. Given the extent of the problem, there are two important research questions: (1) How to assess urban vulnerability and (2) how to integrate it into a risk-based spatial plan.
Among the many analytical methods to assess urban vulnerability, this research selects Spatial Multi Criteria Evaluation (SMCE) for the following reasons. First, it offers a spatial analysis using a geographic information system (GIS) and multi criteria evaluation (MCE) to transform spatial and non-spatial data [
22]. Second, it allows diverse input criteria to explain unstructured future conditions based on mathematical logics using problem tree analysis, standardization, weighting scenarios and map generation to generate multiple scenarios [
23]. It is possible to work with multi-level input data,
i.e., administrative based and/or non-administrative based data, which in fact corresponds to real conditions in the research area since data are commonly available in multiple proxies. Additionally, it is able to generate multiple scenarios to accommodate future possibilities and it selects modest scenarios using decision-making tools for planning in praxis. Third, it is economically feasible to use and modest skills are required to run the program.
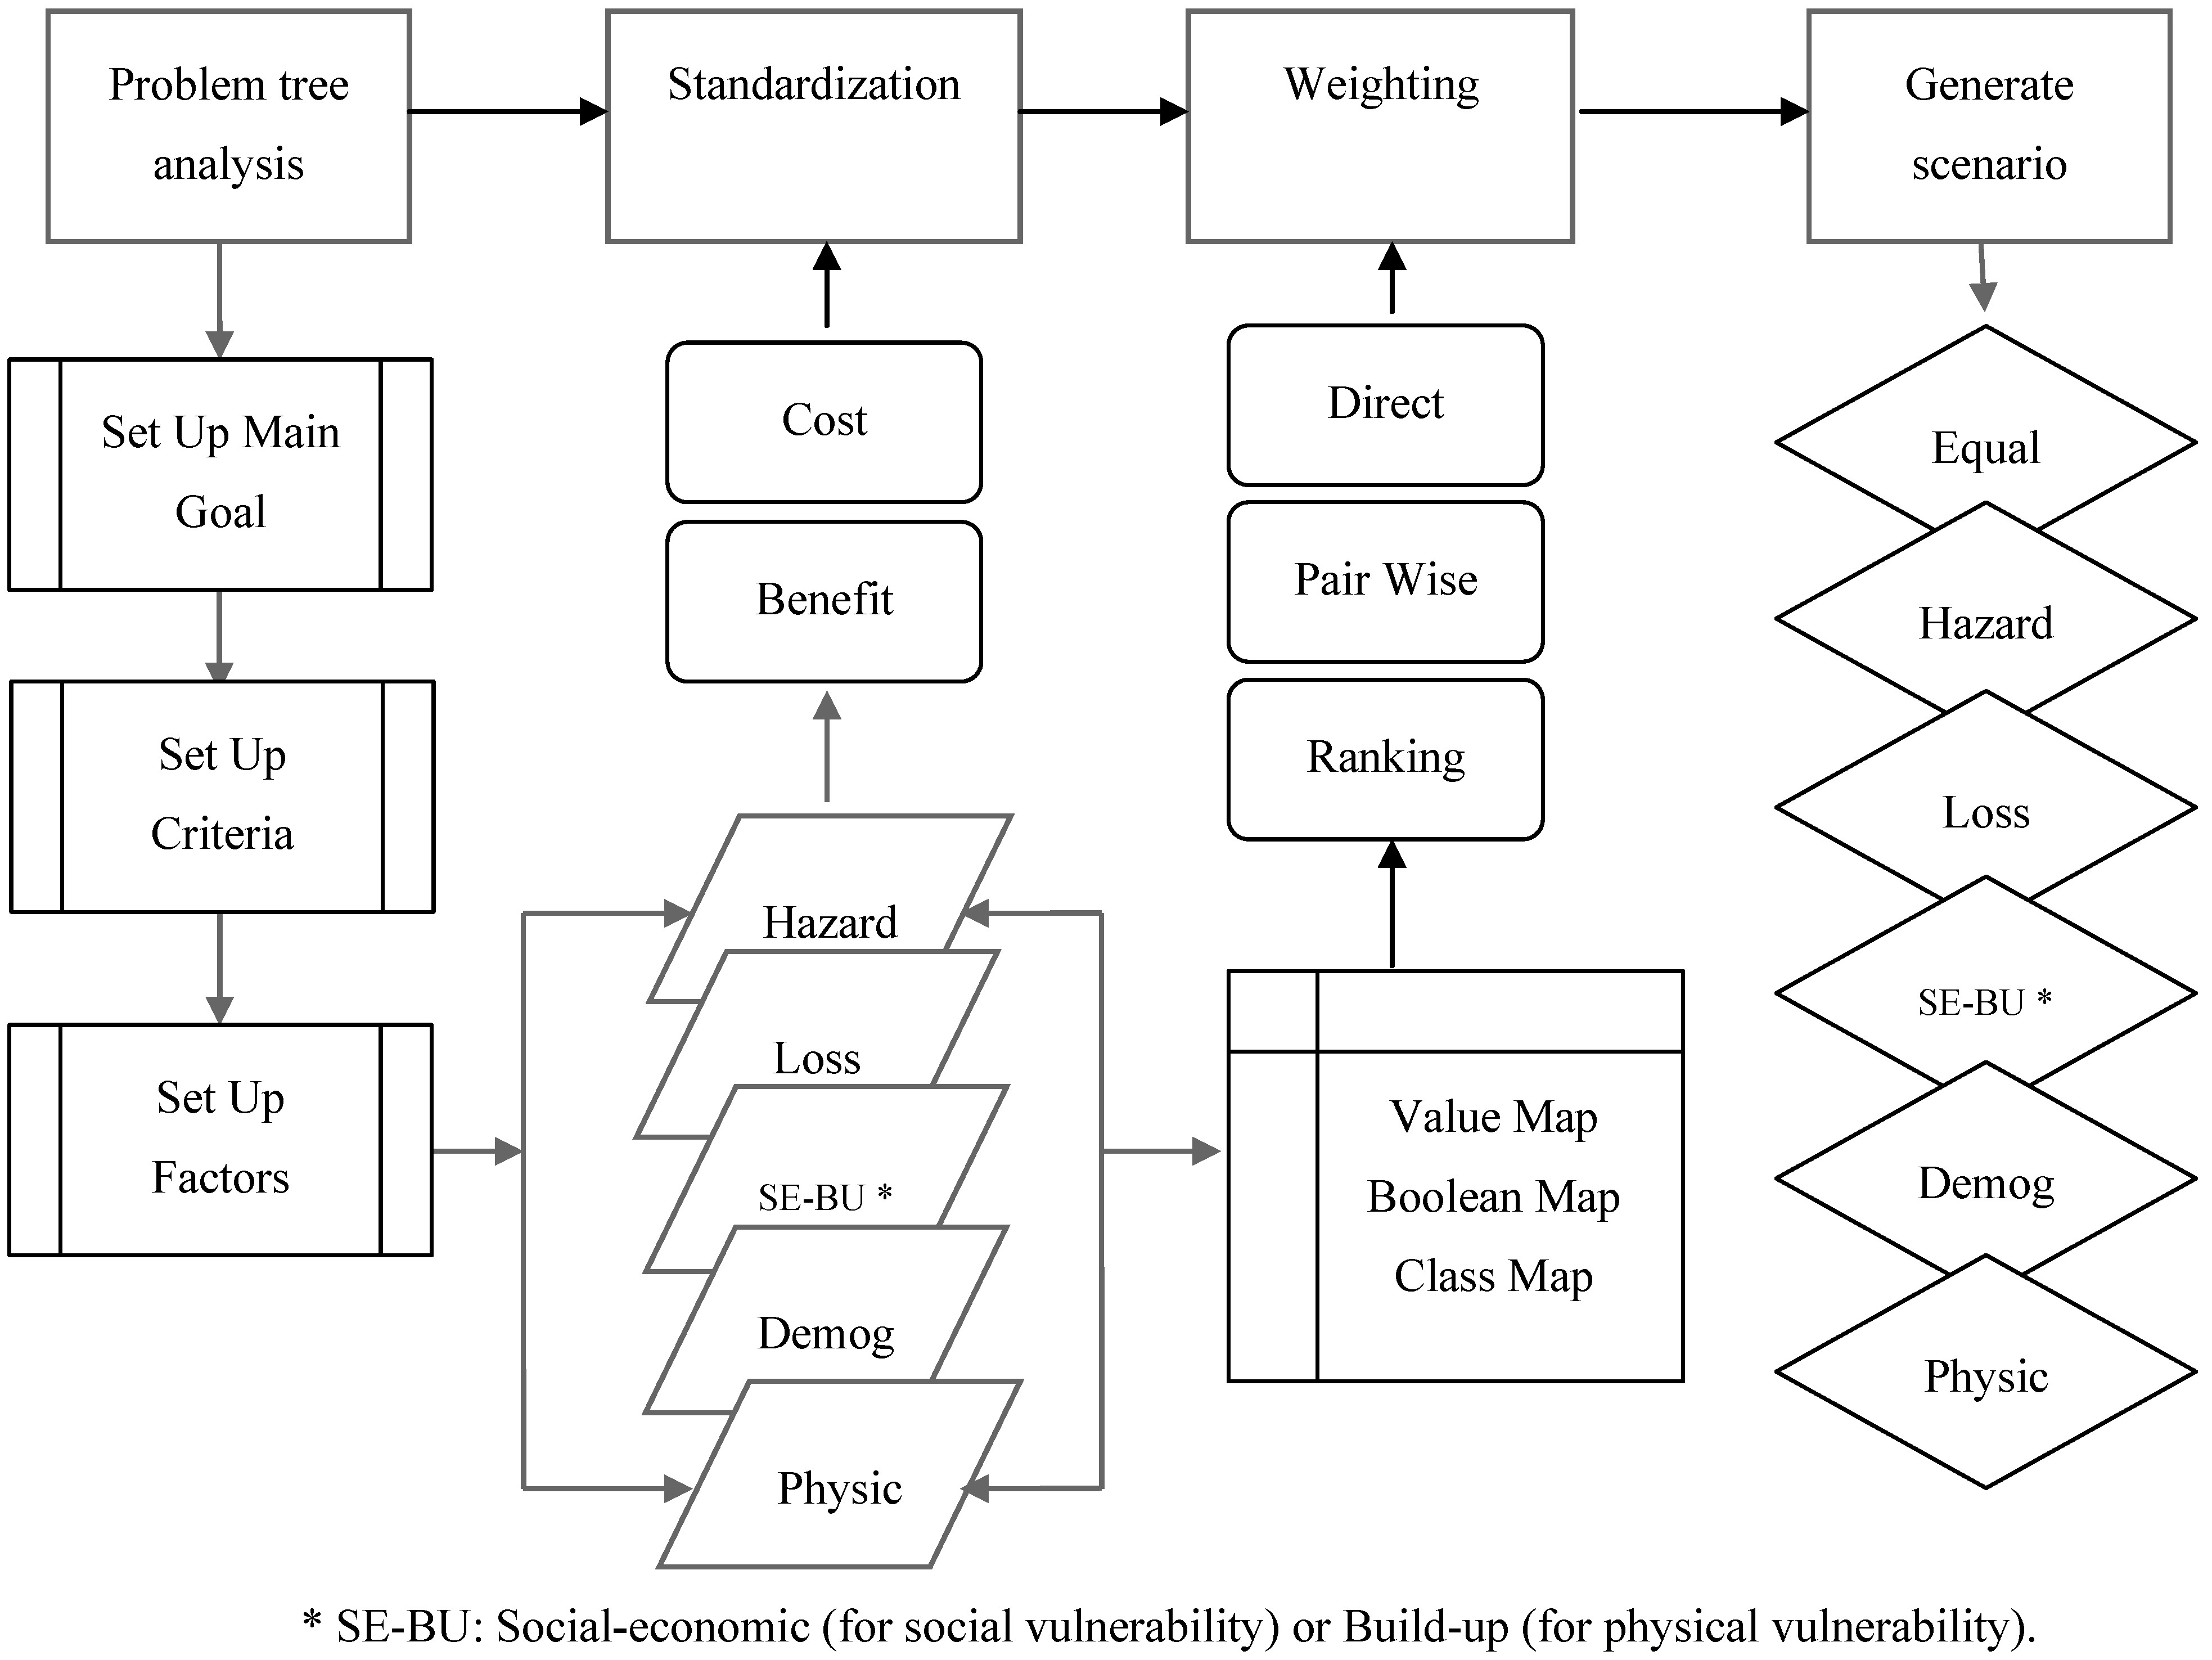
The following figure indicates the research flow using the SMCE procedure (see
Scheme 1). The problem tree analysis adopts multiple goals and multiple criteria to expose relationships among relevant criteria, which generally cluster into group factors or constraints [
24]. As it employs multiple criteria, each criterion holds a certain range scale value, which requires standardization. Standardization is a process to offer membership value based on the utility for each criterion using Boolean Logics and or Fuzzy Logics. Fuzzy Logic allows memberships of factors in a continuous scale from one (full membership or full utility) to zero (full non membership or zero utility) to the main goals. Boolean logics has introduced strict binary options as True or False, or values of 0 (excluded from preference) or 1 (contributing a high utility to the main goal) to express preferences [
23]. Furthermore, it should be noted that weighting is a process to assign relative importance to each criterion and to contribute its significance to multiple goals. In summary, this research selects this approach, since it accommodates a spatial approach, includes decision-making tools and employs mathematical logics, which are commonly adopted within spatial plans.
There are several criteria employed for urban vulnerability assessment (see
Table 1). In order to select criteria, the research re-routes earlier research and considers data availability in the research area. Hence, the research subjectively selects criteria based on data availability and validity. The SMCE-SV employs hazard, physical, demographic, social-economic, and loss criteria. Meanwhile, the SMCE-PV employs similar criteria except for social-economic criteria and includes build-up criteria. There are five factors to describe physical criteria, such as land use distribution, distance to stream, distance to fault structure, distance to road network and slope. For example, land use indicates developed areas, which in this case means that the more developed the area is, the more it contributes to SV or PV. Additionally, there are eight factors to describe demographic criteria: population density, agriculture density, number of elderly people, children, illiterate groups, highly educated groups, occupation during day-time, and occupation during night-time. These factors share similar logics, because a bigger population contributes more to vulnerability. The demographic criteria are commonly attached to social economic attributes, which in this research are denoted as household proxies. There are thirteen factors within social-economic criteria, such as household with clean water access, electricity access and communication access, number of poor households, households without savings, insurance and low-income groups, pension group, and labor group. It also includes household assets,
i.e. building, vehicle, cattle stock and productive land. Their social-economic attributes contribute more to vulnerability, as more assets refer to more properties to lose, while low-economic support and less access to basic services profoundly increase vulnerability. Critically, this research has added building footprint information based on the distribution and occupancy rate. In order to document previous trends, this research has added losses criteria, which describe damage-loss as partly immaterial loss partly damaged housing. Lastly, seismic zonation explains a hazard criterion, which holds a formidable role to delineate sensitive zones.
As noted earlier, this research set up weighting scenarios to generate multiple scenarios. Weighting scenarios within this research set in random-rank order weight using a direct method which assigns weight based on the importance of ranking of the qualitative assessment by the decision maker. The research expects to generate six scenarios for SV and PV,
i.e. a physical scenario, a demographic scenario, a social-economic scenario (for SV) and a build-up scenario (for PV), a loss scenario, a hazard scenario and an equal scenario (see
Table 2).
In detail, the physical scenario for example, assigns more weight to the physical criterion (0.40) and assigns the rest of the weight equally to the other criteria (0.15) since it expects a dynamic physical condition which contributes more to vulnerability than the other factors. As for the equal scenario, it regards equal change in each criterion, which equally contributes to vulnerability, thus it assigns equal weight.
Table 1.
Spatial multi criteria evaluations for social vulnerability (SMCE-SV) and for physical vulnerability (SMCE-PV) criteria.
Table 1.
Spatial multi criteria evaluations for social vulnerability (SMCE-SV) and for physical vulnerability (SMCE-PV) criteria.
| No | Criteria | Factor | Description | Data source |
|---|
| 1 | Physical | Land use, | Built up areas (+) | Secondary data from Regional Planning Board [21] |
| (For SMCE-SV and SMCE-PV) | Faults, | Distance to fault lines (+) |
| | Road network, | Distance to road network (+) |
| | Stream network, | Distance to river (+) |
| | Slope | Mountainous area (+) |
| 2 | Demographic | Population density, Population by education, by age, by income, by occupation | High density (+) | Secondary data from Statistical Bureau [18] Primary data |
| (For SMCE-SV and SMCE-PV) | Low education (+) |
| | Elderly (+),children (+) |
| 3 | Socio-economic (For SMCE-SV) | Asset, access, economic background,
etc. | Low economic assets (+) | Secondary data from Statistical Bureau [18] Primary data |
| Low wages (+) |
| 4 | Built-up | Distribution of building, | High value (+) | Primary data |
| (For SMCE-PV) | Building type*, | Poor structure (+) | Satellite image interpretation * Fieldwork observation |
| | Building structure*; | Permanent type (+) | |
| | Building occupants* | High occupancy (+) | |
| 5 | Losses | Material loss ratio, immaterial loss ratio | High ratio (+) | Primary data [21] |
| (For SMCE-SV and SMCE-PV) |
| 6 | Hazard | Distribution, Magnitude, Frequency, Intensity | High frequency, high magnitude, high intensity, wider distribution (+) | Secondary data from Geological Agency [21] |
| (For SMCE-SV and SMCE-PV) |
Table 2.
Weighting Scenarios.
Table 2.
Weighting Scenarios.
| Scenarios | Physical Factors | Demographic Factors | Socio-Econ./Build-Up Factors | Affected Loss Factors | Hazard Factors |
|---|
| Physical | 0.40 | 0.15 | 0.15 | 0.15 | 0.15 |
| Demographic | 0.15 | 0.40 | 0.15 | 0.15 | 0.15 |
| Social-Economic/Build-Up | 0.15 | 0.15 | 0.40 | 0.15 | 0.15 |
| Losses | 0.15 | 0.15 | 0.15 | 0.40 | 0.15 |
| Hazard | 0.15 | 0.15 | 0.15 | 0.15 | 0.40 |
| Equal | 0.20 | 0.20 | 0.20 | 0.20 | 0.20 |
3. Results and Discussion
The research has generated six deterministic social vulnerability scenarios for the research area. It has set vulnerability indices in five categories: not vulnerable (0), marginally vulnerable (0.01–0.25), moderately vulnerable (0.26–0.50), highly vulnerable (0.51–0.75) and very highly vulnerable (0.76–1.00) (see
Table 3).
Table 3.
Vulnerability Classification.
Table 3.
Vulnerability Classification.
| No | Upper Bound | Class Name | Code |
|---|
| 1 | 0 | Not vulnerable | NV |
| 2 | 0.25 | Marginally vulnerable | MV |
| 3 | 0.50 | Moderately vulnerable | ModV |
| 4 | 0.75 | Highly vulnerable | HV |
| 5 | 1 | Very highly vulnerable | VV |
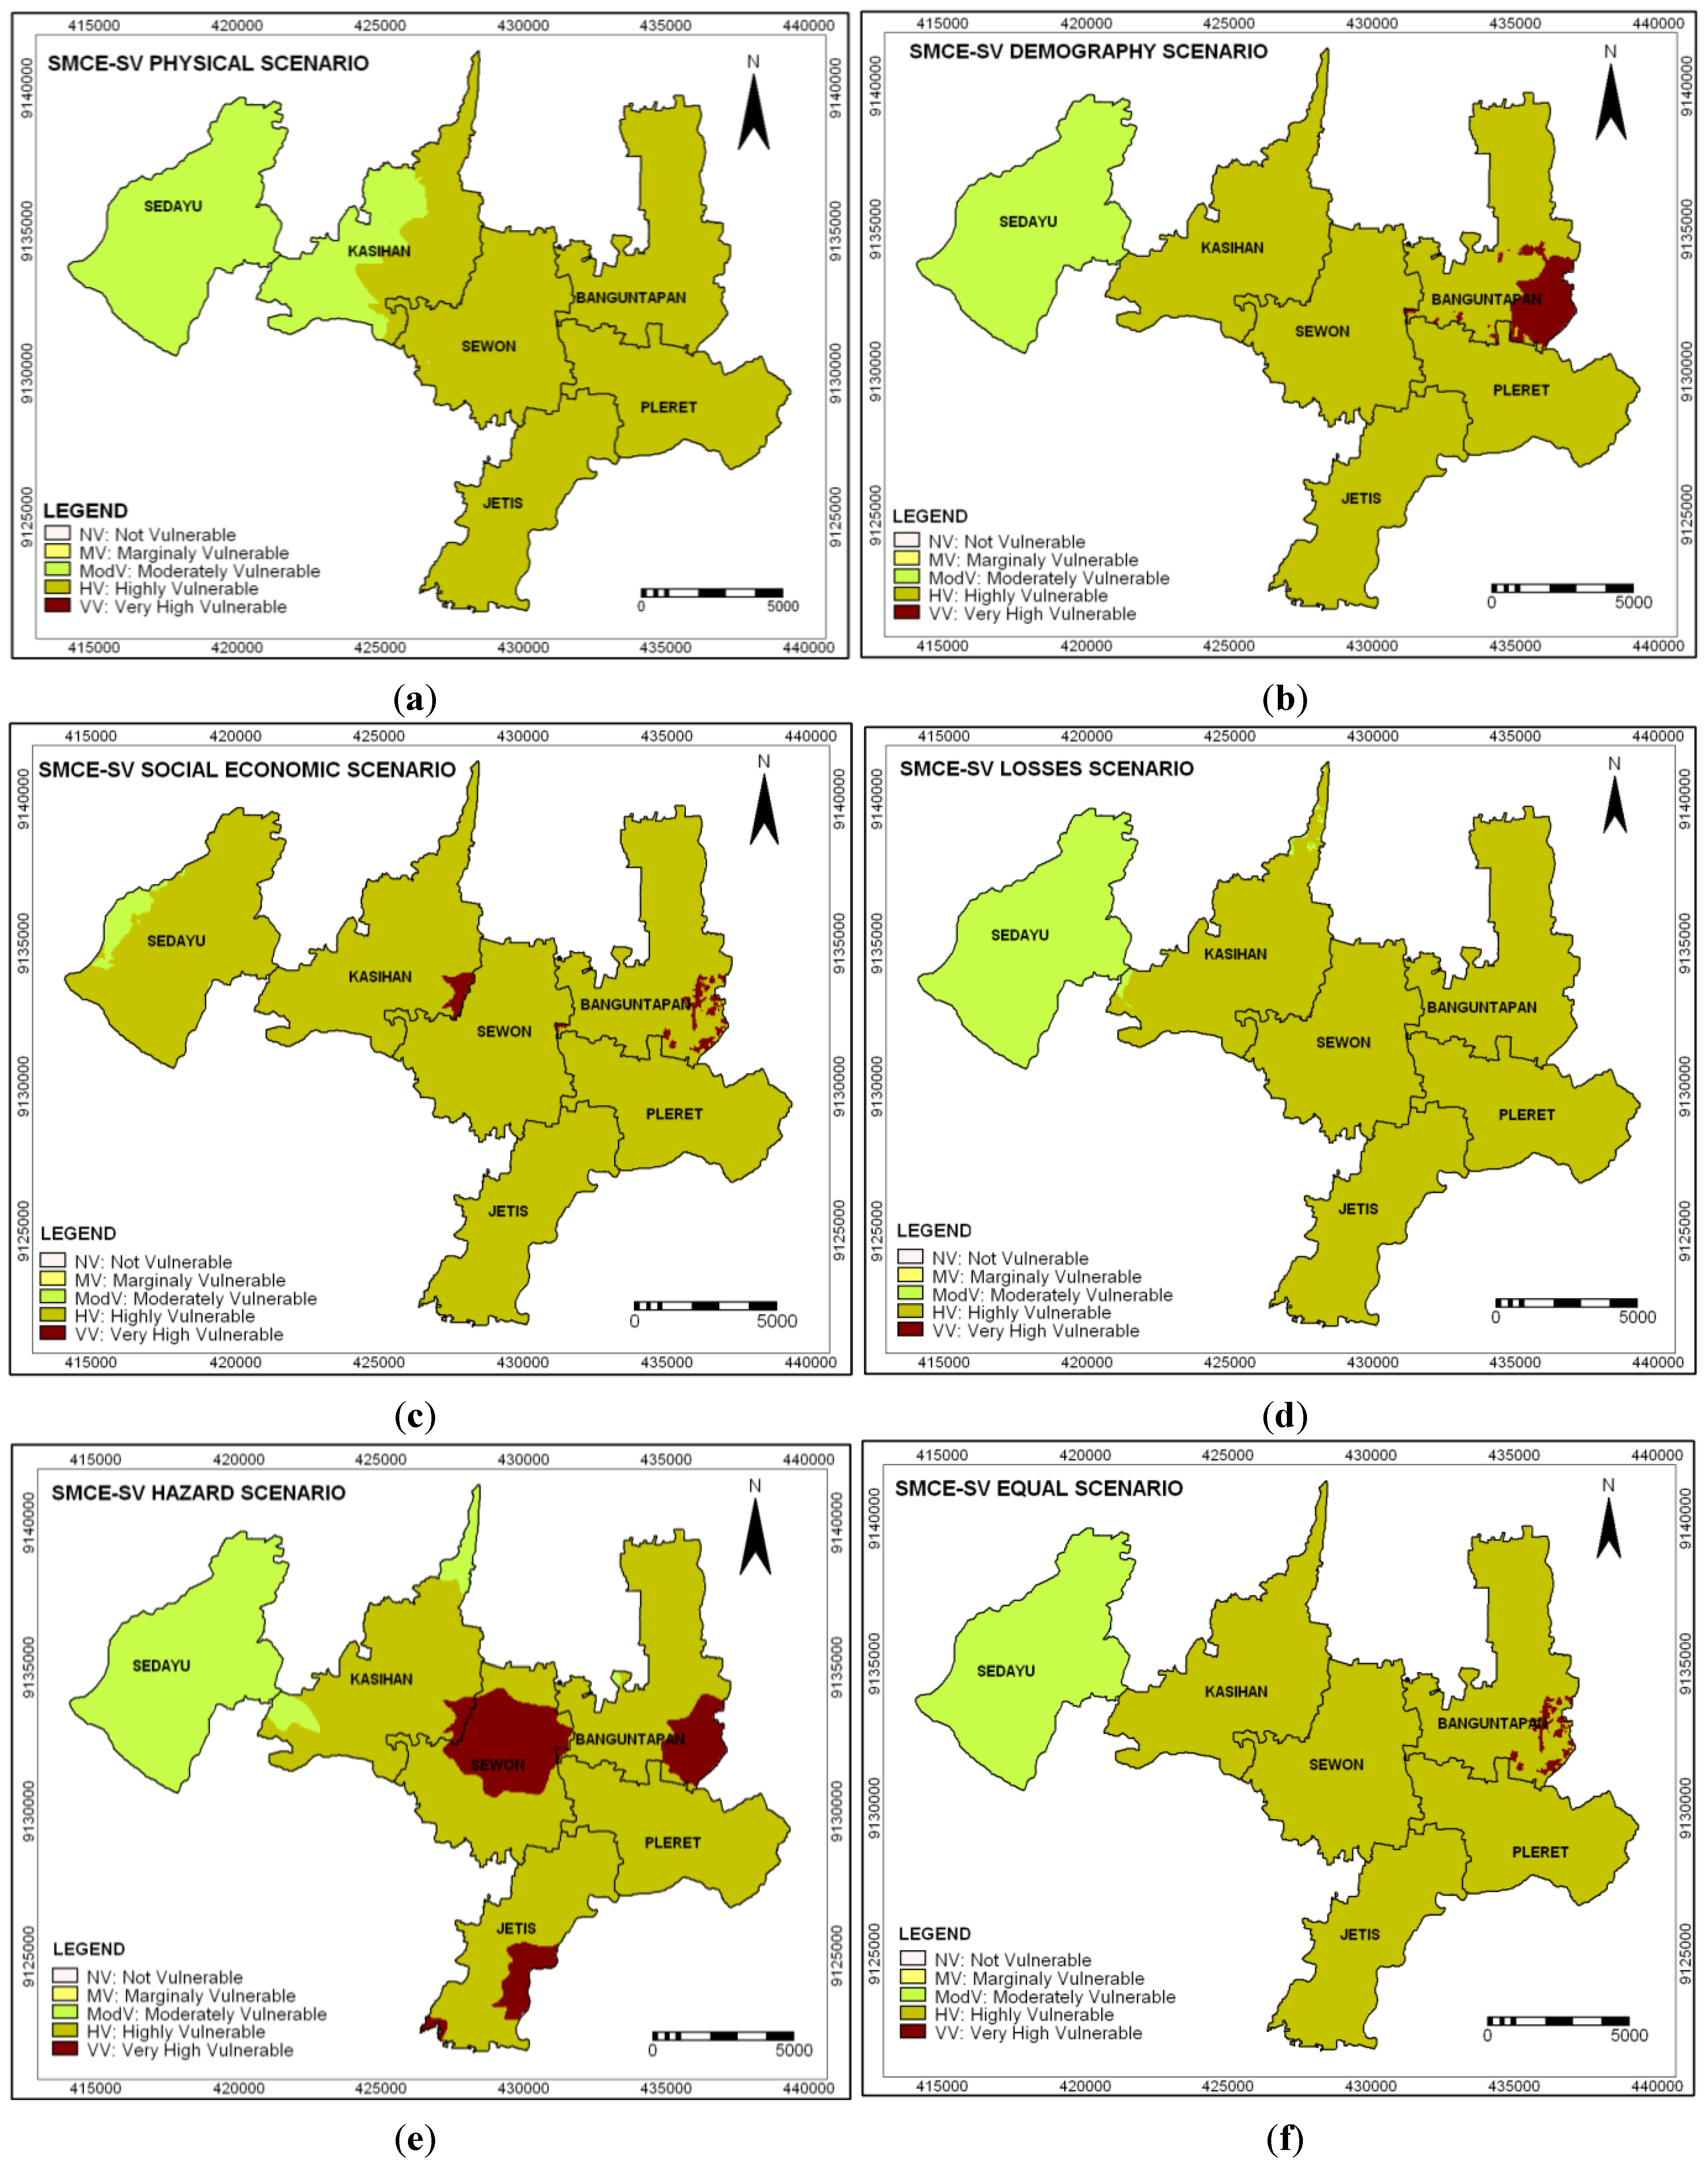
The social vulnerability scenarios pertain with the condition: If the research area is likely to experience seismic activity originating from active faults or nearby active fault structures, a magnitude of >5 S.R, an attenuation of <0.15 g, a recurrence period between 2009–2059 and an exposure to major perturbation to the physical/demographic/social-economic/losses/hazard criteria is expected, thus the spatial patterns of social vulnerability are depicted in the following figures (see
Figure 2a–f).
The social vulnerability scenarios appear robust. These present subdistricts Sewon and Banguntapan as having a very high socially vulnerable area (red zone), while subdistricts Kasihan, Jetis, Pleret and Sedayu are less vulnerable on the scale (dark green and light green zone). The social vulnerability indices range from 0.51 to 0.79. The most sensitive criteria are demographic and social economic setting since they contribute more to the vulnerability indices. This information is given prior to the decision-making input into the spatial pattern analysis for the district scale (1:50,000). Theoretically, these socially vulnerable areas are designated as protected areas with a specific activity and land use direction.
There are six generated scenarios for the SMCE-SV. The physical scenario aims to show the contribution of physical criteria to vulnerability (see
Figure 2a). The idea is to introduce the spatial pattern of social vulnerability if the physical criteria (land use, transportation network, fault structure, rivers, and slopes) experience dynamic changes for many possible reasons,
i.e., spatial structure plan. The perturbation discussed here highlights land use and transport network, since these are sensitive to any change due to spatial structure plan. Meanwhile, the fault structure, river and slopes are not subject to direct perturbation, but these criteria potentially respond to any dynamic change within their surroundings. If there is a significant perturbation of these physical criteria, vulnerability rises and thus household proxies resided in Banguntapan, Sewon, Jetis, Pleret and partly Kasihan are classified as vulnerable. Meanwhile, the household proxies residing in Kasihan and Sedayu classify as moderately vulnerable. This scenario is considerably important since the latest spatial plan has designated Banguntapan, Sewon, Kasihan and Sedayu as small towns, which potentially may develop into urban agglomeration centers together with the neighboring city of Yogyakarta. This would lead to more physical perturbation, which might impinge future development.
Figure 2.
(a) SMCE-SV physical scenario; (b) demographic scenario; (c) social economic scenario; (d) losses scenario; (e) hazard scenario; and (f) equal scenario.
Figure 2.
(a) SMCE-SV physical scenario; (b) demographic scenario; (c) social economic scenario; (d) losses scenario; (e) hazard scenario; and (f) equal scenario.
Second, the demographic scenario aims to expose the contribution of demographic figures to vulnerability (see
Figure 2b). The research area has experienced a rapid onset of demographic figure-population growth of less than 2% per year [
19]. However, it is possible to experience more rapid demographic variation in the up-coming years due to local migration, since some vulnerable areas,
i.e., Banguntapan, Sewon and Kasihan are direct peripheral areas with the potential for rapid demographic spillover from neighboring the city Yogyakarta. According to the spatial pattern plan of 2010–2029, these areas are designated settlement areas together with Pleret [
24]. Given the future settlement allocation, these peripheral areas are subjected to more demographic accumulation in the up-coming years following rapid habitation. The demographic scenario has generated similar results as the physical scenario, where household proxies residing in Banguntapan, Sewon, Jetis, Pleret and partly Kasihan have more vulnerability than those residing in Sedayu.
Third, the social-economic scenario aims to expose the contribution of the social economic condition to social vulnerability (see
Figure 2c). In general, the Bantul District has dominated by its agriculture setting, while recently, the manufacturing industry has been taking over progressively. Arguably, the economic behaviors in the research area have changed rapidly over the decades, which has triggered a transition of lifestyle and potentially affected changes in the future. This scenario has classified 97.70% of the total research area as a high vulnerable area. It also reveals that some areas are moderately vulnerable (0.96%) and some other areas are very highly vulnerable areas (1.93%). The socio-economic scenario has shown that Kasihan and Sewon are very highly vulnerable areas (darker red zone), and Sedayu is a moderately vulnerable area (light green zone). As affirmed earlier, Banguntapan, Sewon, Jetis and Pleret are considered highly vulnerable areas (green zone).
Fourth, the losses scenario aims to expose the contribution of losses criteria towards social vulnerability (see
Figure 2d). Previous damage and loss patterns perpetuate the distribution of elements at risk due to seismic hazards. Arguably, these elements at risk are likely to respond in a similar way once hazards with similar likelihoods strike. Thus, if the research areas experience rapid urbanization, which indirectly increases population growth, economic growth and development activities, the distribution of elements at risk will increase and induce more vulnerability. Notably, the scenario has presented similar results as the physical and demographic scenarios of Banguntapan, Jetis, Pleret, Sewon and some of Kasihan show that they are high vulnerable areas, and Sedayu is a moderately vulnerable area.
Fifth, the hazard scenario aims to expose the contribution of hazard scenarios to vulnerability (see
Figure 2e). It becomes critical since it is subject to change. This research employs a hazard map from the Geologic Agency—a deterministic hazard scenario with a 50-year recurrence period—with slight changes (generalization using the krigging method) since it does not cover all of the research area. This research selects the hazard map from legal authorities since it contains valid information and conceives legal consequences. The hazard scenario has estimated 11.39% of the total area as highly vulnerable, which is concentrated in Sewon, Banguntapan and Jetis.
Lastly, the equal scenario aims to elaborate the contribution of all criteria to vulnerability. If the Bantul District continuously controls land use change, manages urbanization, and or conducts preparedness to protect communal or household assets, it will promote equal scenario. The equal scenario gives all variables the same weight, which means it gives equal opportunity to any change caused by different variables. Arguably, the equal scenario occurs if the research area is likely to experience a steady growth in demographics, physical and social economic background. Similar to physical and demographic scenarios, this scenario spots Kasihan, Sewon, Banguntapan, Jetis and Pleret as vulnerable areas and leaves Sedayu as a moderately vulnerable area. Meanwhile some areas in Banguntapan are considered as highly vulnerable area.
This research also generated six deterministic physical vulnerability scenarios for the subdistrict Sewon. The smaller observation unit for the SMCE-PV is due to the limitation of building stock inventory. It is derived from the interpretation of high-resolution satellite images, which are apparently too excessive for the research area. Hence this research selects detailed observations for the most socially vulnerable areas of the subdistrict Sewon.
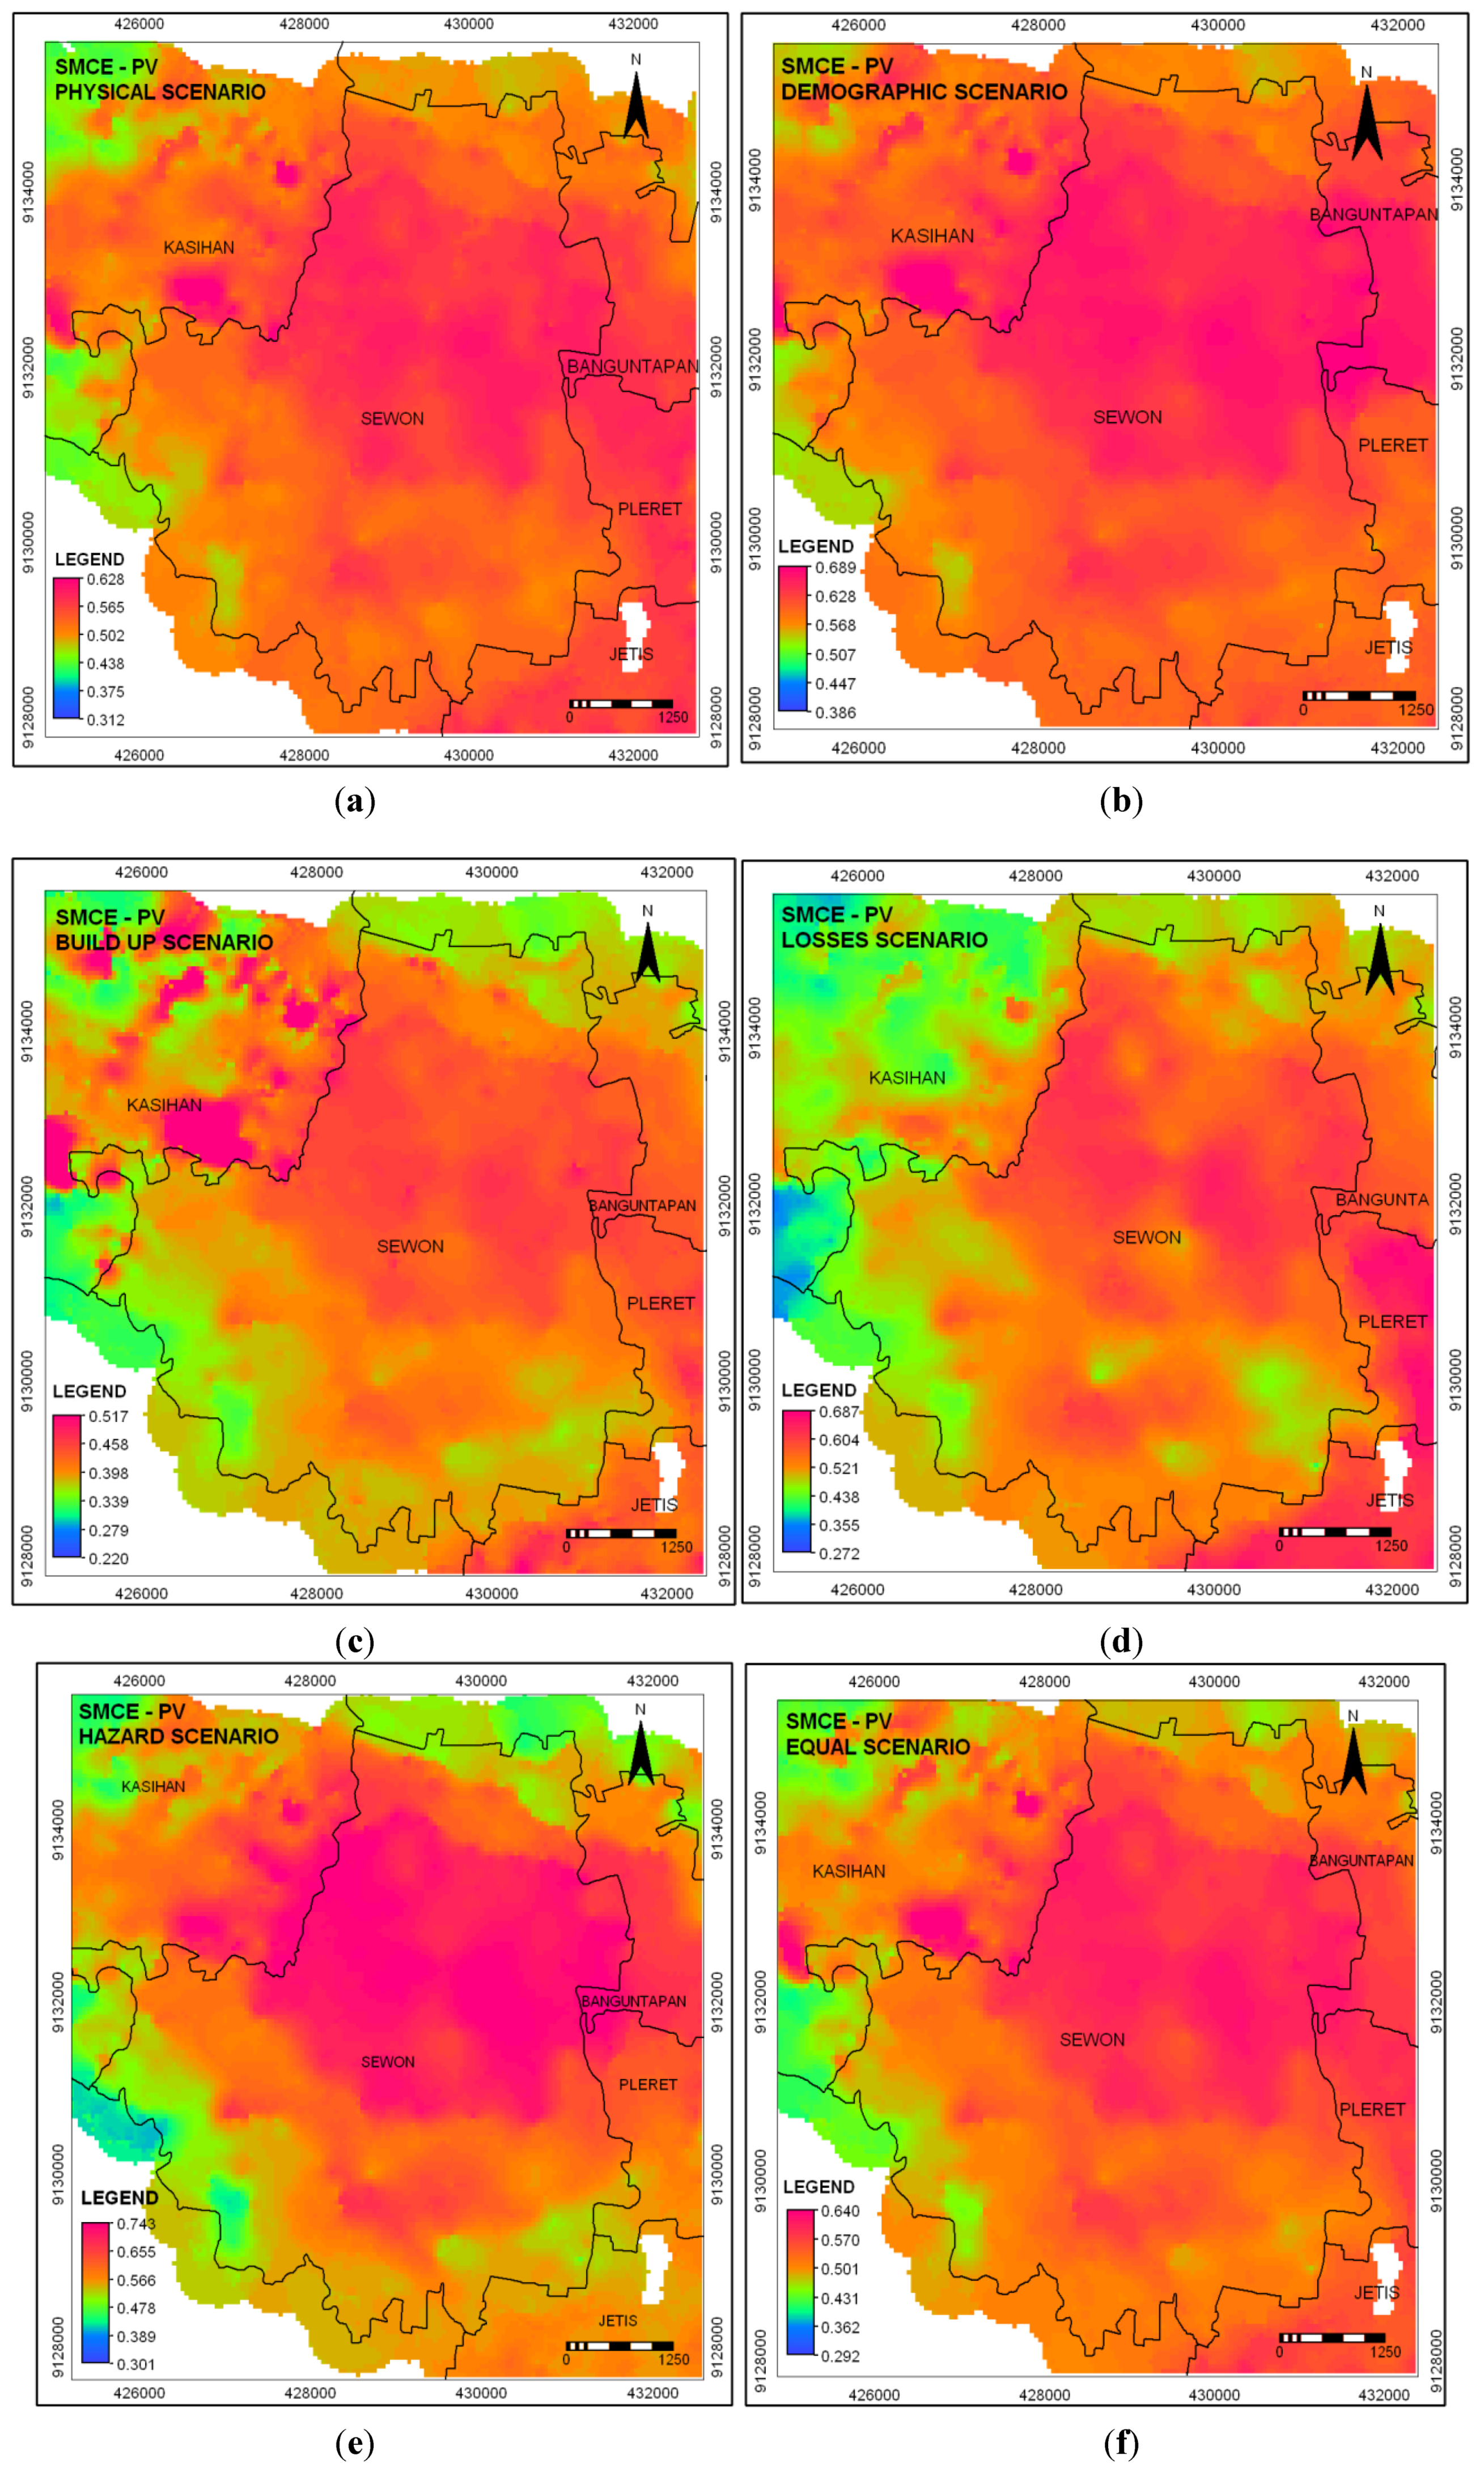
This research has revealed that the areas are exposed to social and physical vulnerability in very a unique pattern. These scenarios still come with this condition: If the research area is likely to experience seismic activity originating from Opak Fault or nearby active faults, with a magnitude of >5 S.R, an attenuation of <0.15, an occurrence period between 2009–2059 and an exposure to major perturbations of the physical/demographic/build-up/losses/hazard characteristics, then the likelihood of physical vulnerability is spatially discerned as follows (see
Figure 3a–f). The physical vulnerability indices range from 0.220 to 0.743, which directly sets the Sewon subdistrict into three vulnerable zones: highly vulnerable (red zone), moderately vulnerable (yellowish red) and marginally vulnerable (green zone). This means that the settlement units residing within this area are subjected to a certain level of physical vulnerability.
Derived from the six generated scenarios, they appear robust. This indicates that the center of subdistrict Sewon suffers from a very high physical vulnerability compared to the surrounding areas. The most sensitive criterion to generate a discerned spatial pattern of the physical vulnerability is the hazard criterion, since it gives high vulnerability indices. Despite such a dynamic physical vulnerability setting, the regional spatial plan has allocated Sewon as a settlement, services and wet agriculture area. The physical vulnerability information is critical for sustainable spatial structure analysis, especially on a subdistrict scale. Theoretically, these physically vulnerable areas should be allocated as specific land use directions with a detailed building codes regulation.
Figure 3.
(a) SMCE-PV physical scenario; (b) demographic scenario; (c) build-up scenario; (d) losses scenario; (e) hazard scenario; and (f) equal scenario.
Figure 3.
(a) SMCE-PV physical scenario; (b) demographic scenario; (c) build-up scenario; (d) losses scenario; (e) hazard scenario; and (f) equal scenario.
4. Conclusions
This research has revealed two important findings. First, SMCE-SV and SMCE-PV can assess urban vulnerability from a multi-scale observation and it is best to work in a spatial manner. Second, integrating the urban vulnerability assessment into the risk-based spatial plan requires strategic, technical, substantive and procedural dimensions.
These two empirical exercises—SMCE-SV and SMCE-PV—likely integrate spatial patterns and spatial structures at different levels of the risk-based spatial plan. However, there are limitations to integrating the urban vulnerability information into the risk-based spatial plan. First, social vulnerability serves a more flexible scope of integration compared to physical vulnerability. Social vulnerability promotes a much more flexible scale of observation, i.e. a macro scale (regional or local spatial pattern) ranging from a 1:250,000–1:50,000 scale. The availability of supporting data proxies makes it possible for the social vulnerability to produce a flexible scale of observation. Meanwhile, the physical vulnerability assessment promotes a less flexible scale of observation, which is more accurate for micro scale observations (sub-district spatial structure) ranging from a 1:50,000–1:5,000 scale. Social vulnerability represents household proxies, while physical vulnerability represents settlement proxies, which are quite difficult datasets to obtain. Clearly, data availability for household proxies is excessive therefore it is possible to conduct social vulnerability for rather macro scale of observation. Meanwhile, availability data for settlement proxies is unfortunately difficult to obtain, thus it is quite difficult to generate macro scenarios for physical vulnerability. Second, the social vulnerability assessment has fallen into ecological fallacies—a typical error which occurs when scenarios developed from large data proxies to represent each entities, while the physical vulnerability has systemic fallacies—a typical error from input, analysis and data management. Thus, the future challenge is to create a social vulnerability assessment for detailed spatial units to reduce unambiguous interpretation and to employ valid and accurate data to decrease systemic error.
The first research finding corresponds to the second research finding. The two exercises have indicated that the integration process of the vulnerability assessment into the risk-based spatial plan entails a technical and a substantive element. Despite strong the political will at the national level, the integration process in the regional and local settings will not take place without adequate technical and substantive support. As noted earlier, the Indonesian government has initiated strategic integration through manifestation of Act Nr. 24/2007 on Disaster Management and Act Nr. 26/2007 on Spatial Plan. The regional (provincial) government of D.I. Yogyakarta has translated the national mandate by integrating hazard maps into the spatial plan as an exclusive protected area. However, the local setting of Bantul District poses difficulties to translate the national and regional mandate into praxis. Thus, it also entails a procedural element to support the integration process.
In summary, this research argues that the urban vulnerability information is critical input to the risk-based spatial plan. This research strictly conducts the urban vulnerability assessment in regards to seismic hazards, which of course do not complete a risk-based spatial plan input. The ideal input for a risk-based spatial plan would be urban vulnerability towards multi-hazards. The future challenge of research is to assess the urban vulnerability towards multi-hazard scenarios. Once again, the manifestation of safer and sustainable development is attainable through the integration of social vulnerability into local spatial plans, or on a detailed level. Or, by integration of the physical vulnerability information into detailed sub-district spatial plans. The integration itself is an incessant process, which includes four important elements i.e., strategic, technical, substantive and procedural elements. The strategic initiatives are generally addressed at a national level, while technical, substantive and procedural elements are generally accommodated at the regional or local level.


