Developing an Ecosystem Services Online Decision Support Tool to Assess the Impacts of Climate Change and Urban Growth in the Santa Cruz Watershed; Where We Live, Work, and Play

 ,
,
Abstract
:1. Introduction
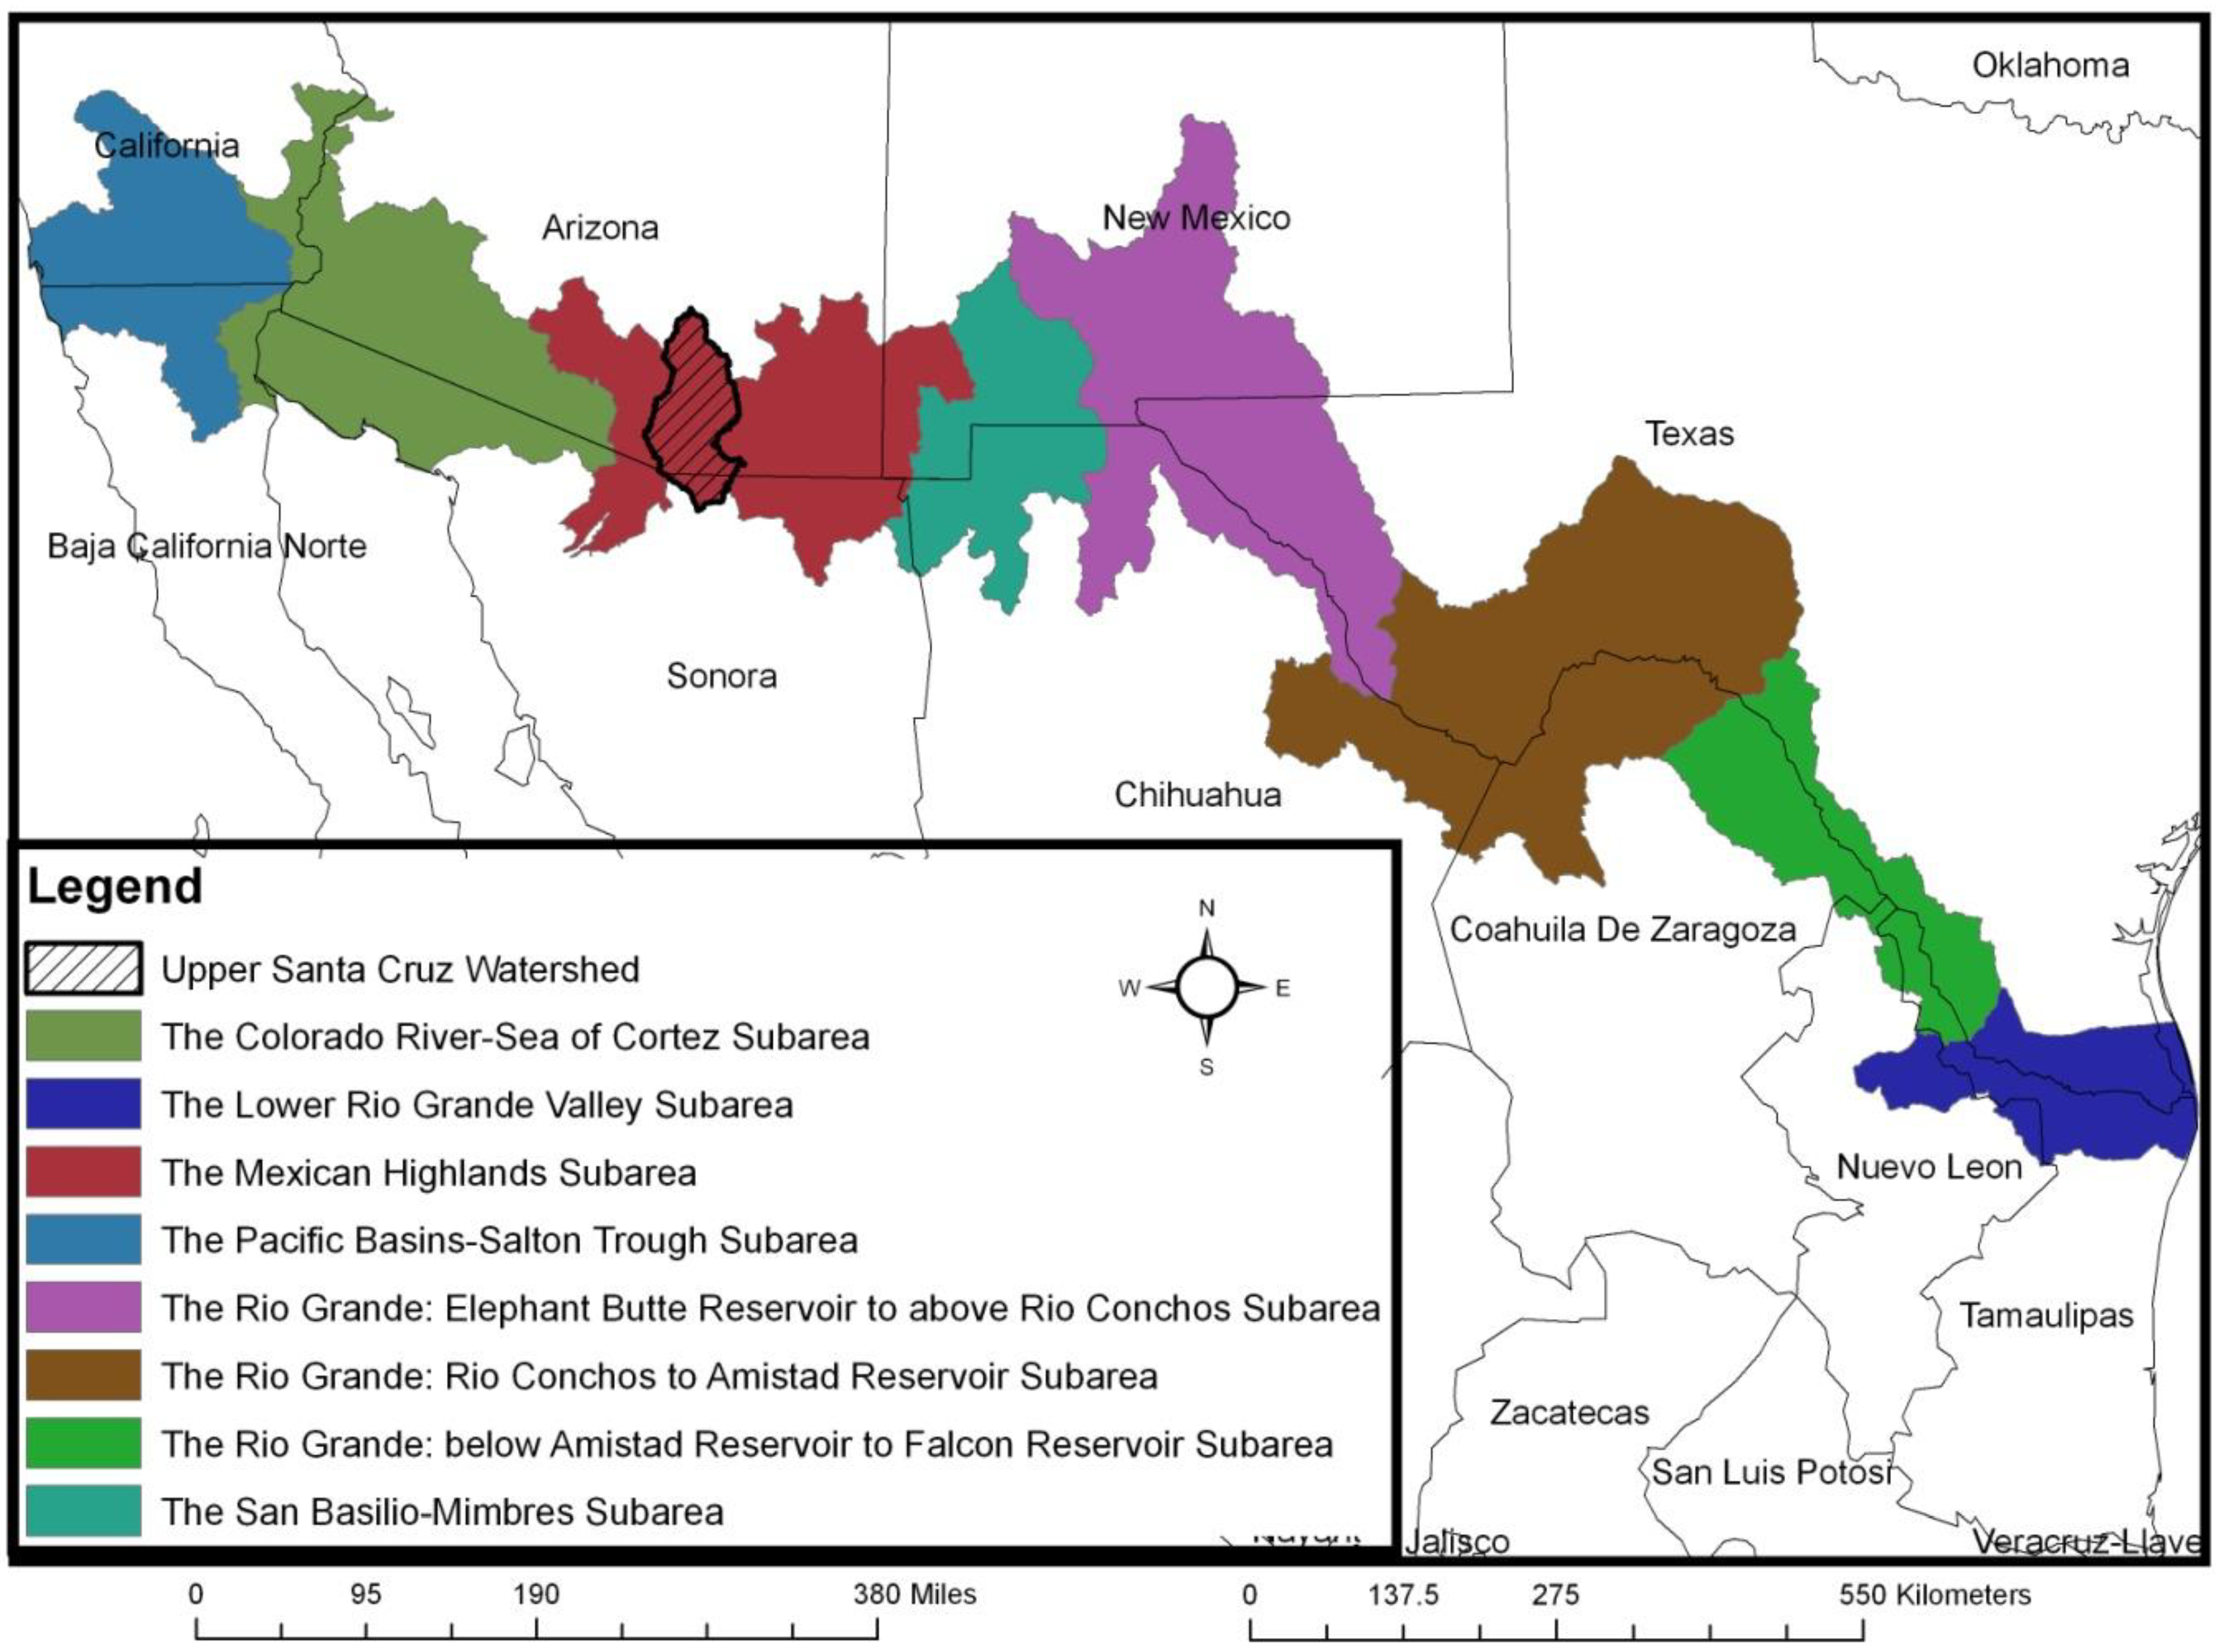
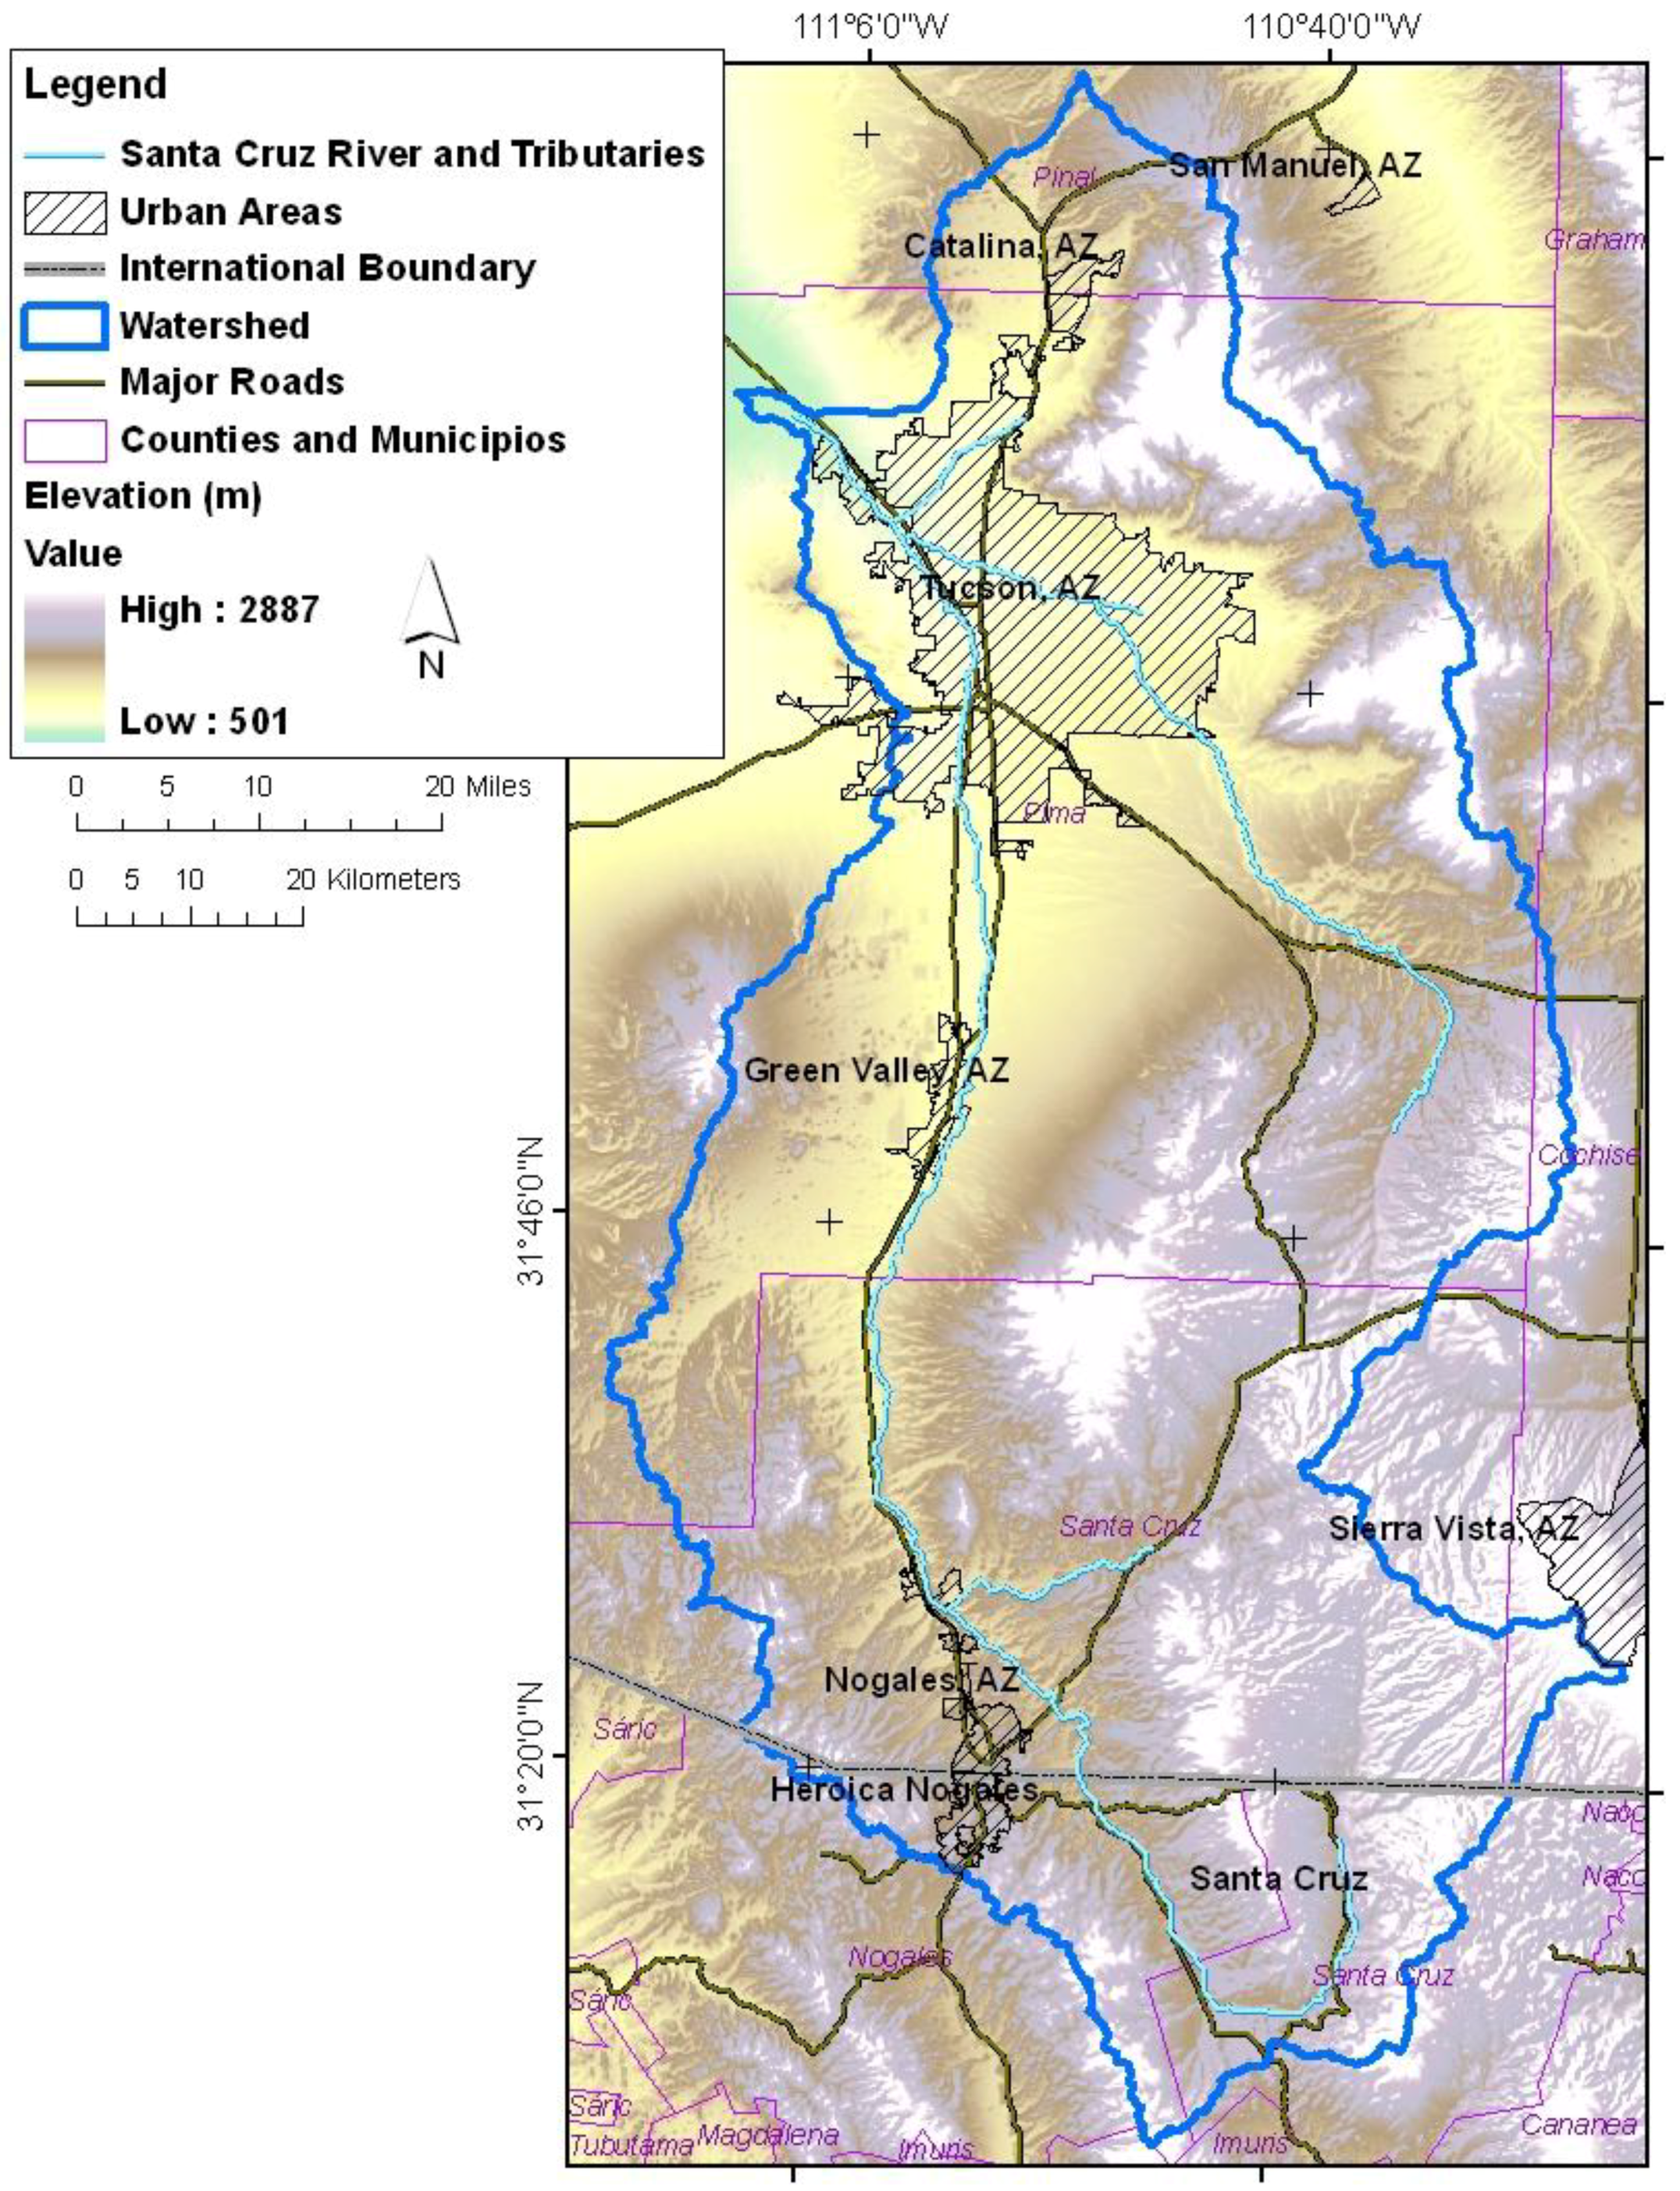
2. Study Area
3. Santa Cruz Watershed Ecosystem Portfolio Model (SCWEPM)
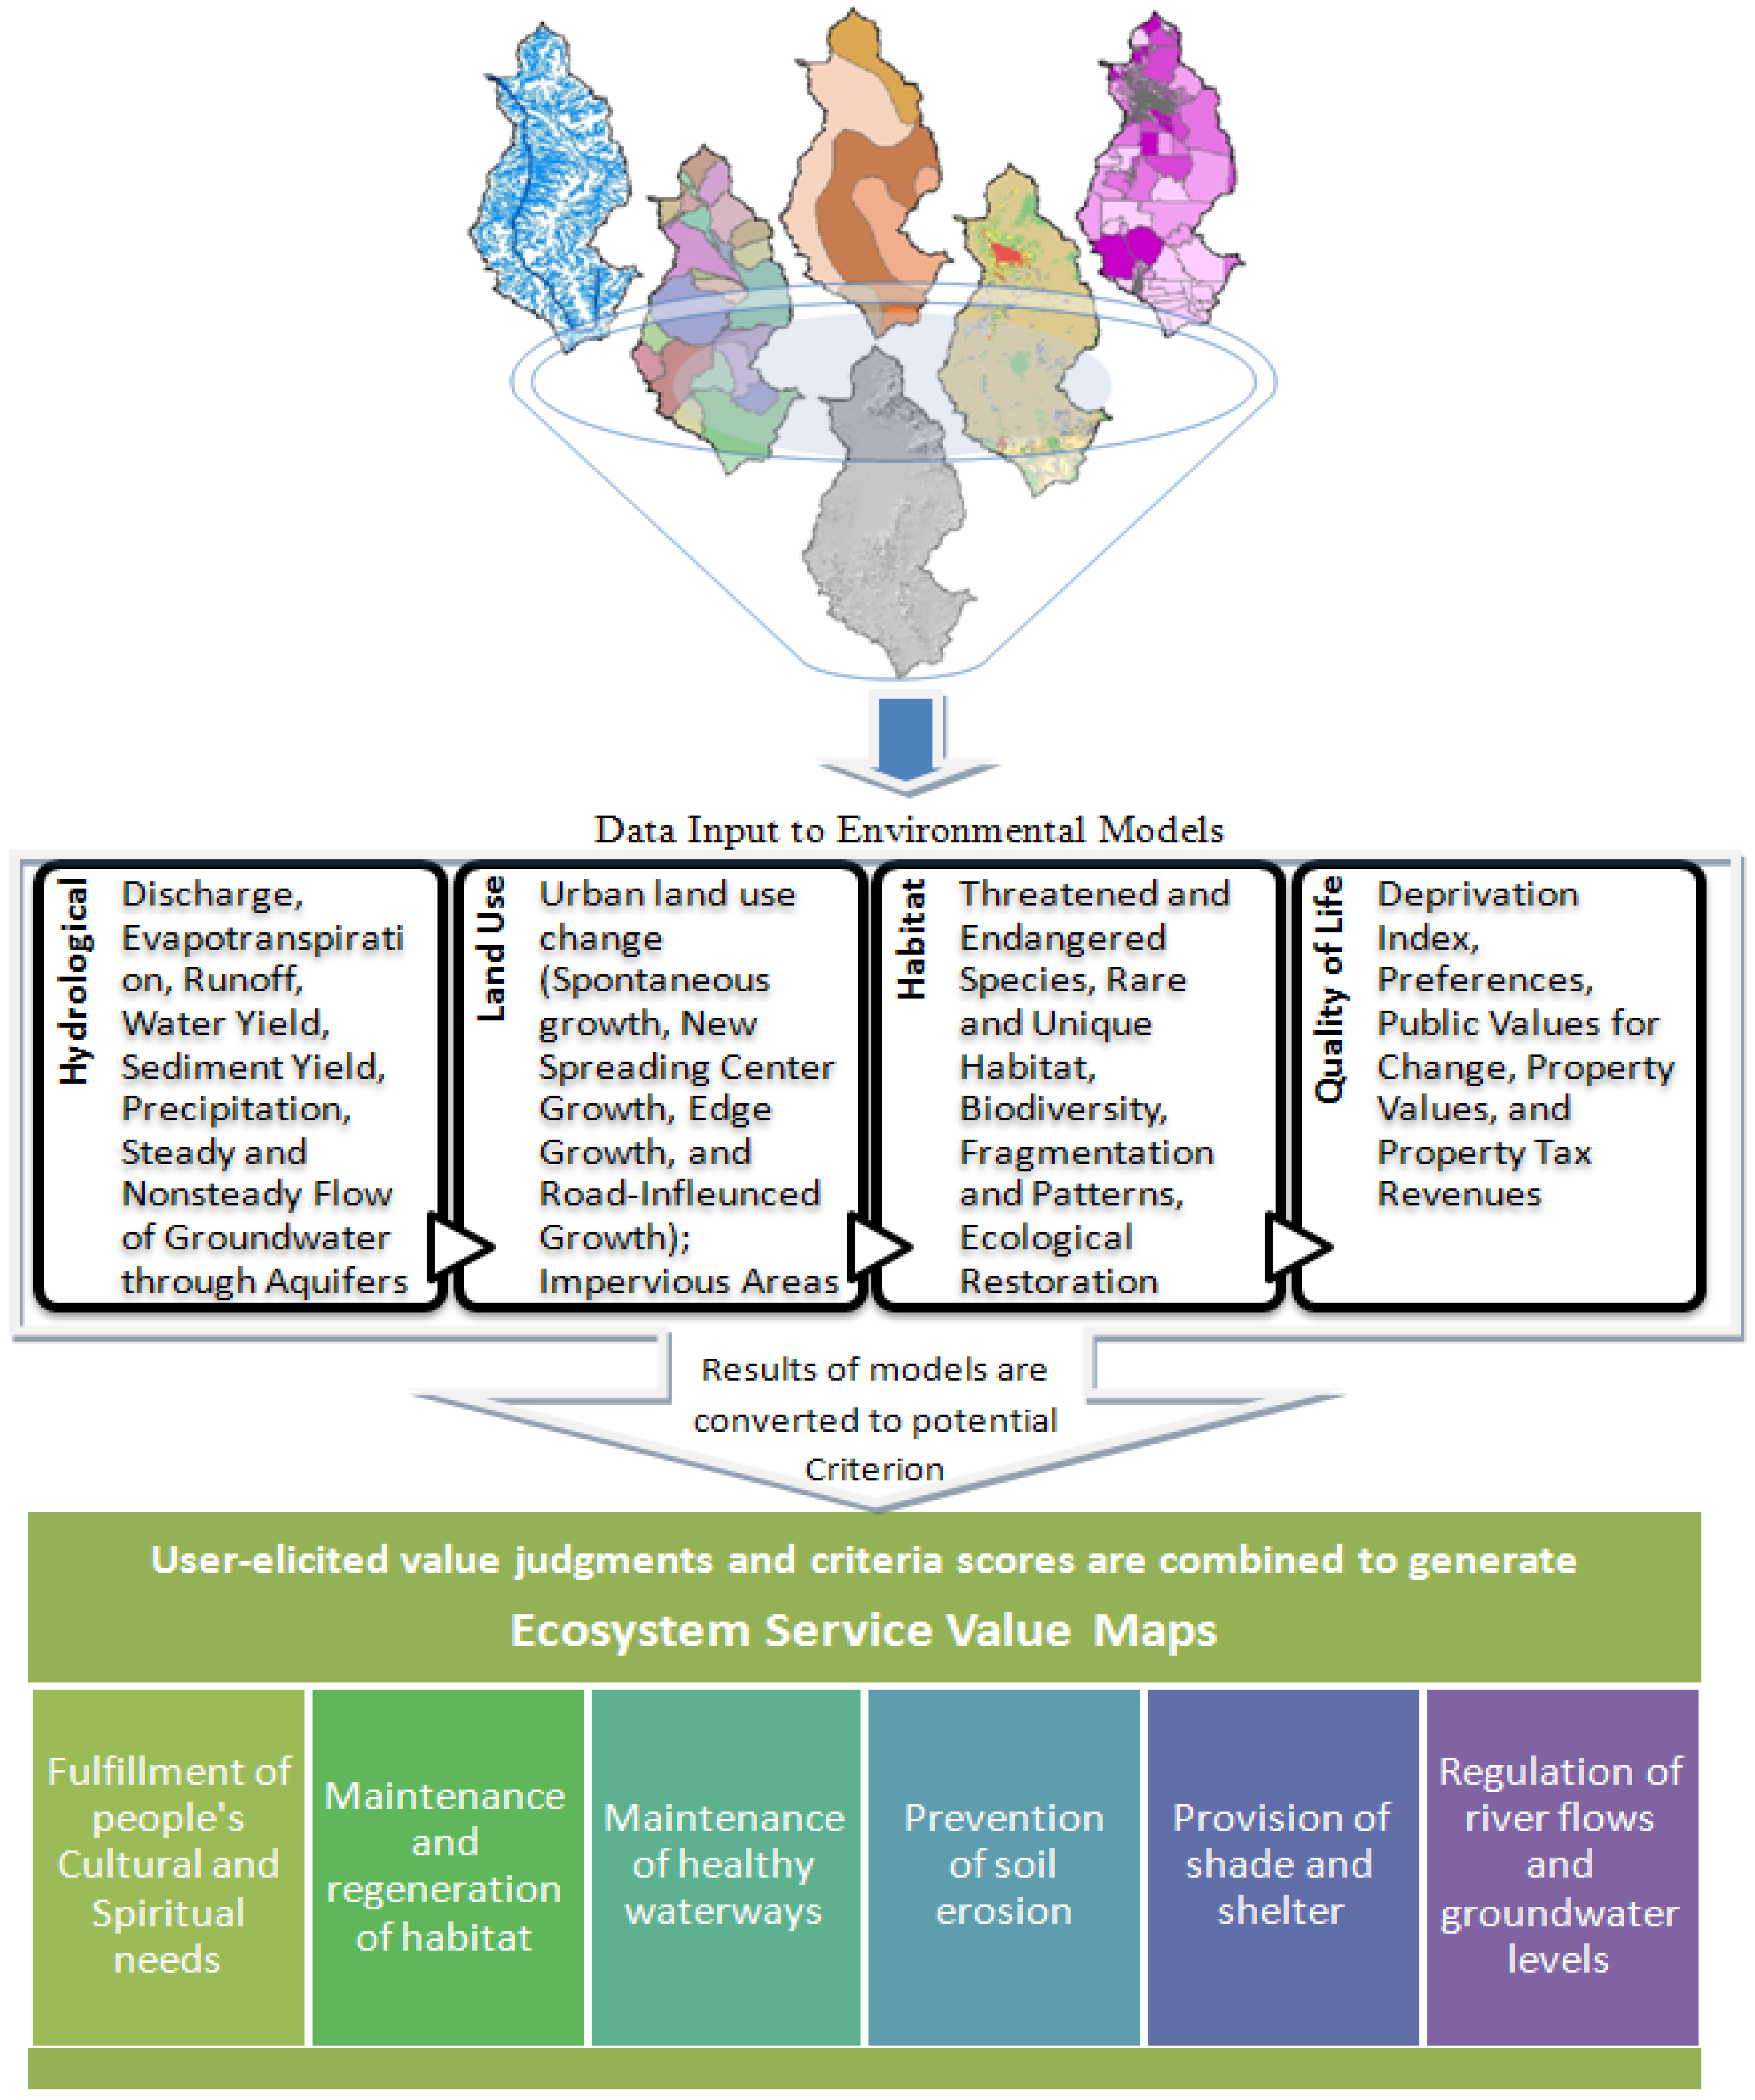
4. Ecosystem Services, Alternative Future Scenarios, and Human Well-Being
4.1. Ecosystem Services
4.1.1. Water provisioning

4.1.2. Habitat provisioning

| Birds | |
|---|---|
| Summer Tanager | Piranga rubra |
| Yellow Warbler | Dendroica petechia |
| Yellow-breasted Chat | Icteria virens |
| Gray Hawks | Asturina nitida |
| Yellow-billed Cuckoo | Coccyzus americanus |
| Lucy’s Warbler | Vermivora luciae |
| Bell’s Vireo | Vireo bellii |
| Abert’s Towhee Northern | Pipilo aberti |
| Beardless-Tyrannulet | Camptostoma imberbe |
| Varied Bunting | Passerina versicolor |
| Rufous-winged Sparrow | Aimophila carpalis |
| Lazuli Buntings | Passerina cyanea |
| Indigo Buntings | Passerina amoena |
| Tropical Kingbird. | Tyrannus melancholicus |
4.1.3. Cultural resources provisioning
4.2. Alternative Scenarios
4.2.1. Urban growth scenarios
4.2.2. Climate change scenarios

4.3. Linkages with Human Well-Being
4.3.1. Human health
4.3.2. Environmental justice
4.3.3. Quality of life
5. Approach

6. Conclusions
Acknowledgements
References and Notes
- Anderson, M.T.; Woosley, L.H. Water Availability for the Western United States—Key Scientific Challenges; U.S. Geological Survey Circular 1261; USGS: Reston, VA, USA, 2005.
- Barnett, T.; Malone, R.; Pennell, W.; Stammer, D.; Semtner, B.; Washington, W. The effects of climate change on water resources in the west: Introduction and overview. Climatic Change 2004, 62, 1–11. [Google Scholar]
- de Groot, R.S.; Anlkemade, R.L.; Braat, L.; Hein, L.; Willemen, L. Challenges in integrating the concept of ecosystem services and values in landscape planning, management and decision making. Ecol. Complex. 2009. [Google Scholar] [CrossRef]
- Wainger, L.A.; King, D.M.; Mack, R.N.; Price, E.P.; Maslin, T. Can the concept of ecosystem services be practically applied to improve natural resource management decisions? Ecol. Econ. 2010, 69, 978–987. [Google Scholar] [CrossRef]
- Wainger, L.A.; Price, E.W. Evaluating quality of life, economic vulnerabilities and drivers of ecosystem change. Environ. Monit. Assess. 2004, 94, 69–84. [Google Scholar] [CrossRef] [PubMed]
- Fisher, B.; Turner, R.K.; Morling, P. Defining and classifying ecosystem services for decision making. Ecol. Econ. 2009, 68, 643–653. [Google Scholar] [CrossRef]
- Woodard, D.; Durall, R. United States-Mexico Border Area, as Delineated by a Shared Water Resources Perspective; U.S. Department of the Interior, Field Coordinating Committee: Washington, DC, USA, 1996; Fact Sheet 1.
- Shamir, E.; Meko, D.M.; Graham, N.E.; Georgakakos, K.P. Hydrologic model framework for water resources planning in the Santa Cruz River, Southern Arizona. J. Am. Water Resour. Assoc. 2007, 43, 1155–1170. [Google Scholar] [CrossRef]
- Scott, C.A.; Varady, R.G.; Browning-Aiken, A.; Sprouse, T.W. Linking water and energy along the Arizona-Sonora Border. Southwest Hydrol. 2007, 6, 26–31. [Google Scholar]
- Norman, L.M.; Hirsch, D.D.; Ward, A.W. Monitoring, modeling, and forecasting change within the Arizona-Sonora transboundary watersheds. In Proceedings of a USGS Workshop on Facing Tomorrow’s Challenges along the U.S.-Mexico Border; Tucson, AZ, USA, 2 April 2008, Geological Survey Circular 1322; USGS: Reston, VA, USA, 2008. Available online: http://pubs.usgs.gov/circ/1322/ (accessed on 6 July 2010). [Google Scholar]
- Ingram, H.; Varady, R.G. Empowering grassroots linkages. Arid Land. 1996. Available online: http://ag.arizona.edu/OALS/ALN/aln39/ing%26var.html (accessed on 6 July 2010).
- Norman, L.M. United States-Mexican border watershed assessment: Modeling nonpoint source pollution in Ambos Nogales. J. Borderl. Stud. 2007, 22, 20. [Google Scholar] [CrossRef]
- Morehouse, B.J.; Ferguson, D.B.; Owen, G.; Browning-Aiken, A.; Wong-Gonzalez, P.; Pineda, N.; Varady, R. Science and socio-ecological resilience: Examples from the Arizona-Sonora Border. Environ. Sci. Policy 2008, 11, 272–284. [Google Scholar] [CrossRef]
- Norman, L. Urbanization and environmental degradation in Arizona Colonias. In The Colonias Reader; Esparza, A.X., Czneriak, R., Donelson, A.J., Eds.; University of Arizona Press: Tucson, AZ, USA, 2010; in press. [Google Scholar]
- López-Hoffman, L.; Varady, R.G.; Flessa, K.W.; Balvanera, P. Ecosystem services across borders: A framework for transboundary conservation policy. Front. Ecol. Environ. 2010, 8, 84–91. [Google Scholar] [CrossRef]
- Labiosa, W.B.; Bernknopf, R.; Hearn, P.; Hogan, D.; Strong, D.; Pearlstine, L.; Mathie, A.M.; Wein, A.M.; Gillen, K.; Wachter, S. The South Florida Ecosystem Portfolio Model—A Map-Based Multicriteria Ecological, Economic, and Community Land-Use Planning Tool; U.S. Geological Survey Scientific Investigations Report 2009–5181; USGS: Reston, VA, USA, 2009.
- Hassan, R.M.; Scholes, R.; Ash, N. Ecosystems and human well-being—Current state and trends—Findings of the condition and trends working group of the millennium ecosystem assessment. In The Millennium Ecosystem Assessment Series; Island Press: Washington, DC, USA, 2005; Volume 1. [Google Scholar]
- Brody, S.D. Ecosystem Planning in Florida—Solving Regional Problems through Local Decision-Making; Ashgate: Burlington, VT, USA, 2008. [Google Scholar]
- Peck, S. Planning for Biodiversity—Issues and Examples; Island Press: Washington, DC, USA, 1998. [Google Scholar]
- Marsh, L.L.; Lallas, P.L. Focused, special-area conservation planning—An approach to reconciling development and environmental protection, in collaborative planning for wetlands and wildlife. In Issues and Examples; Porter, D.R., Salvesen, D.A., Eds.; Island Press: Washington, DC, USA, 1995; pp. 7–34. [Google Scholar]
- CITYgreen . Available online: http://www.americanforests.org/productsandpubs/citygreen/ (accessed on 6 July 2010).
- Johnson, P.; Lachman, B. Rapid Scan of Decision Support System Tools for Land-Use Related Decision Making; NatureServe: Arlington, VA, USA, 2001, unpublished. Available online: http://www.ncseonline.org/NCSSF/DSS/Documents/NatureServe/SmartPlace.doc (accessed on 6 July 2010).
- Ecosystem-Based Management Tools Database. Available online: http://www.smartgrowthtools.org/ebmtools/index.php (accessed on 6 July 2010).
- Natural Capital Project Toolbox . Available online: http://www.naturalcapitalproject.org/toolbox.html (accessed on 6 July 2010).
- ARIES . Available online: http://esd.uvm.edu/home/introduction.html (accessed on 6 July 2010).
- Multi-scale Integrated Models of Ecosystem Services (MIMES) . Available online: http://www.uvm.edu/giee/mimes/ (accessed on 6 July 2010).
- Muradian, R.; Kumar, P. Payment for ES and valuation—Challenges and research gaps. In Payment for ES; Kumar, P., Muradian, R., Eds.; Oxford University Press: New Delhi, India, 2009; pp. 1–16. [Google Scholar]
- Wilson, M.A.; Howarth, R.B. Discourse-based valuation of ES—Establishing fair outcomes through group deliberation. Ecol. Econ. 2002, 41, 431–443. [Google Scholar] [CrossRef]
- Millennium Ecosystem Assessment. Ecosystems and Human Well-being: Desertification Synthesis; World Resources Institute: Washington, DC, USA, 2005. [Google Scholar]
- Azar, C.; Holmberg, J.; Lindgren, K. Methodological and ideological options; socio-ecological indicators for sustainability. Ecol. Econ. 1996, 18, 89–112. [Google Scholar] [CrossRef]
- Uhlman, K.; Guertin, D.P.; Levick, L.R.; Sprouse, T.; Westfall, E.; Holmgren, C.; Fisher, A. NEMO Watershed-Based Plan, Santa Cruz Watershed; University of Arizona: Tucson, AZ, USA, 2008. [Google Scholar]
- Erwin, G. Groundwater Flow Model of the Santa Cruz Active Management Area Microbasins International Boundary to Nogales International Wastewater Treatment Plant Santa Cruz County, Arizona; Arizona Department of Water Resources Modeling Report No. 15; Arizona Department of Water Resources: Phoenix, AZ, USA, 2007.
- Third Management Plan for the Santa Cruz Active Management Area, 2000–2010; Arizona Department of Water Resources: Phoenix, AZ, USA, 2000.
- Leenhouts, J.M.; Stromberg, J.C.; Scott, R.L. Hydrologic Requirements of and Consumptive Ground-Water Use by Riparian Vegetation along the San Pedro River, Arizona; U.S. Geological Survey Scientific Investigations Report 2005–5163; U.S. Geological Survey: Reston, VA, USA, 2006.
- Zaimes, G.; Maloney, M.L.; Rupprecht, C. Riparian areas of Arizona: Climate driven ecosystem changes, in recharge. Recharge 2007, 2, 3–7. [Google Scholar]
- Bagstad, K.J.; Stromberg, J.C.; Lite, S.J. Response of herbaceous riparian plants to rain and flooding on the San Pedro River, Arizona, USA. Wetlands 2005, 25, 210–223. [Google Scholar] [CrossRef]
- Nelson, K. Groundwater Flow Model of The Santa Cruz Active Management Area along the Effluent-Dominated Santa Cruz River Santa Cruz and Pima Counties, Arizona; Arizona Department of Water Resources Modeling Report No. 14; Arizona Department of Water Resources: Phoenix, AZ, USA, 2007.
- Central Arizona Project Homepage. http://www.cap-az.com/operations/allocations/(accessed on 20 September 2009).
- Peach, J.; Williams, J. Population Dynamics of the U.S.-Mexican Border Region. SCERP Monograph; SCERP/SDSU Press: San Diego, CA, USA, 2003, unpublished. Available online: http://www.scerp.org/population.htm (accessed on 6 July 2010).
- Scott, C.A.; Megdal, S.; Oroz, L.A.; Callegary, J.; Vandervoet, P. Assessment of united States–México transboundary aquifers facing climate change and growth in urban water demand. Climate Res. 2010. submitted. [Google Scholar]
- Stromberg, J.C. Fremont cottonwood-goodding willow riparian forests: A review of their ecology, threats, and recovery potential. J. Ariz.-Nev. Acad. Sci. 1993, 26, 97–110. [Google Scholar]
- Scott, M.L.; Shafroth, P.B.; Auble, G.T. Responses of riparian cottonwoods to alluvial water table declines. Environ. Manage. 1999, 23, 347–358. [Google Scholar] [CrossRef]
- Patten, D.T.; Marler, R.J.; Stromberg, J.C. Assessment of the Role of Effluent-Dominated Rivers in Supporting Riparian Functions; Arizona Water Protection Fund Final Report #95–010WP; Arizona State University: Tempe, AZ, USA, 1998. [Google Scholar]
- Marler, R.J.; Stromberg, J.C.; Patten, D.T. Growth response of Populus fremontii, Salix gooddingii, and Tamarix ramosissima seedlings under different nitrogen and phosphorus concentrations. J. Arid Environ. 2001, 49, 133–146. [Google Scholar] [CrossRef]
- Brooks, B.W.; Riley, T.M.; Taylor, R.D. Water quality of effluent-dominated ecosystems: Ecotoxicological, hydrological, and management considerations. Hydrobiologia 2006, 556, 365–379. [Google Scholar] [CrossRef]
- Treese, S.; Meixner, T.; Hogan, J.F. Clogging of an effluent dominated semiarid river: A conceptual model of stream-aquifer interactions. JAWRA 2009, 45, 1047–1062. [Google Scholar]
- City of Tucson. Available online: http://www.ci.tucson.az.us/agdocs/20081014/oct14-08-564a.pdf (accessed on 6 July 2010).
- City of Portland Bureau of Planning and Sustainability. Rainwater Harvesting. Available online: http://www.portlandonline.com/bps/index.cfm?c=ecbbd&a=bbehfa (accessed on 6 July 2010).
- Fontaine, J.J.; van Riper, C., III. A Neotropical Migrant Bird’S Dilemma—Where to Stop for a Good Meal; U.S. Geological Survey Factsheet 2009. Available online: http://pubs.usgs.gov/fs/2009/30xx/ (accessed on 6 July 2010).
- King, K.A.; Zaun, B.J.; Velasco, A.L. Contaminants as a Limiting Factor of Fish and Wildlife Populations in the Santa Cruz River, Arizona; U.S. Fish and Wildlife Service, Region 2 Contaminants Program; U.S. Fish and Wildlife Service: Phoenix, AZ, USA, 1999.
- Norman, L.M.; Guertin, D.P.; Feller, M. A coupled-model approach to reduce nonpoint source pollution resulting from predicted urban growth: A case study in the ambos nogales watershed. J. Urban Geogr. 2008, 29, 496–516. [Google Scholar] [CrossRef]
- Norman, L.M.; Feller, M.; Guertin, D.P. Forecasts of Cross-border Urban Growth Using the SLEUTH Model; Ambos Nogales Watershed, United States-Mexican Border. Comput. Environ. Urban Syst. 2009, 33, 150–159. [Google Scholar] [CrossRef]
- Brown, C. Binational Watershed Councils as Instruments for Conflict Resolution in the Upper Santa Cruz Watershed; Udall Center Publications: Tucson, AZ, USA, 2002. [Google Scholar]
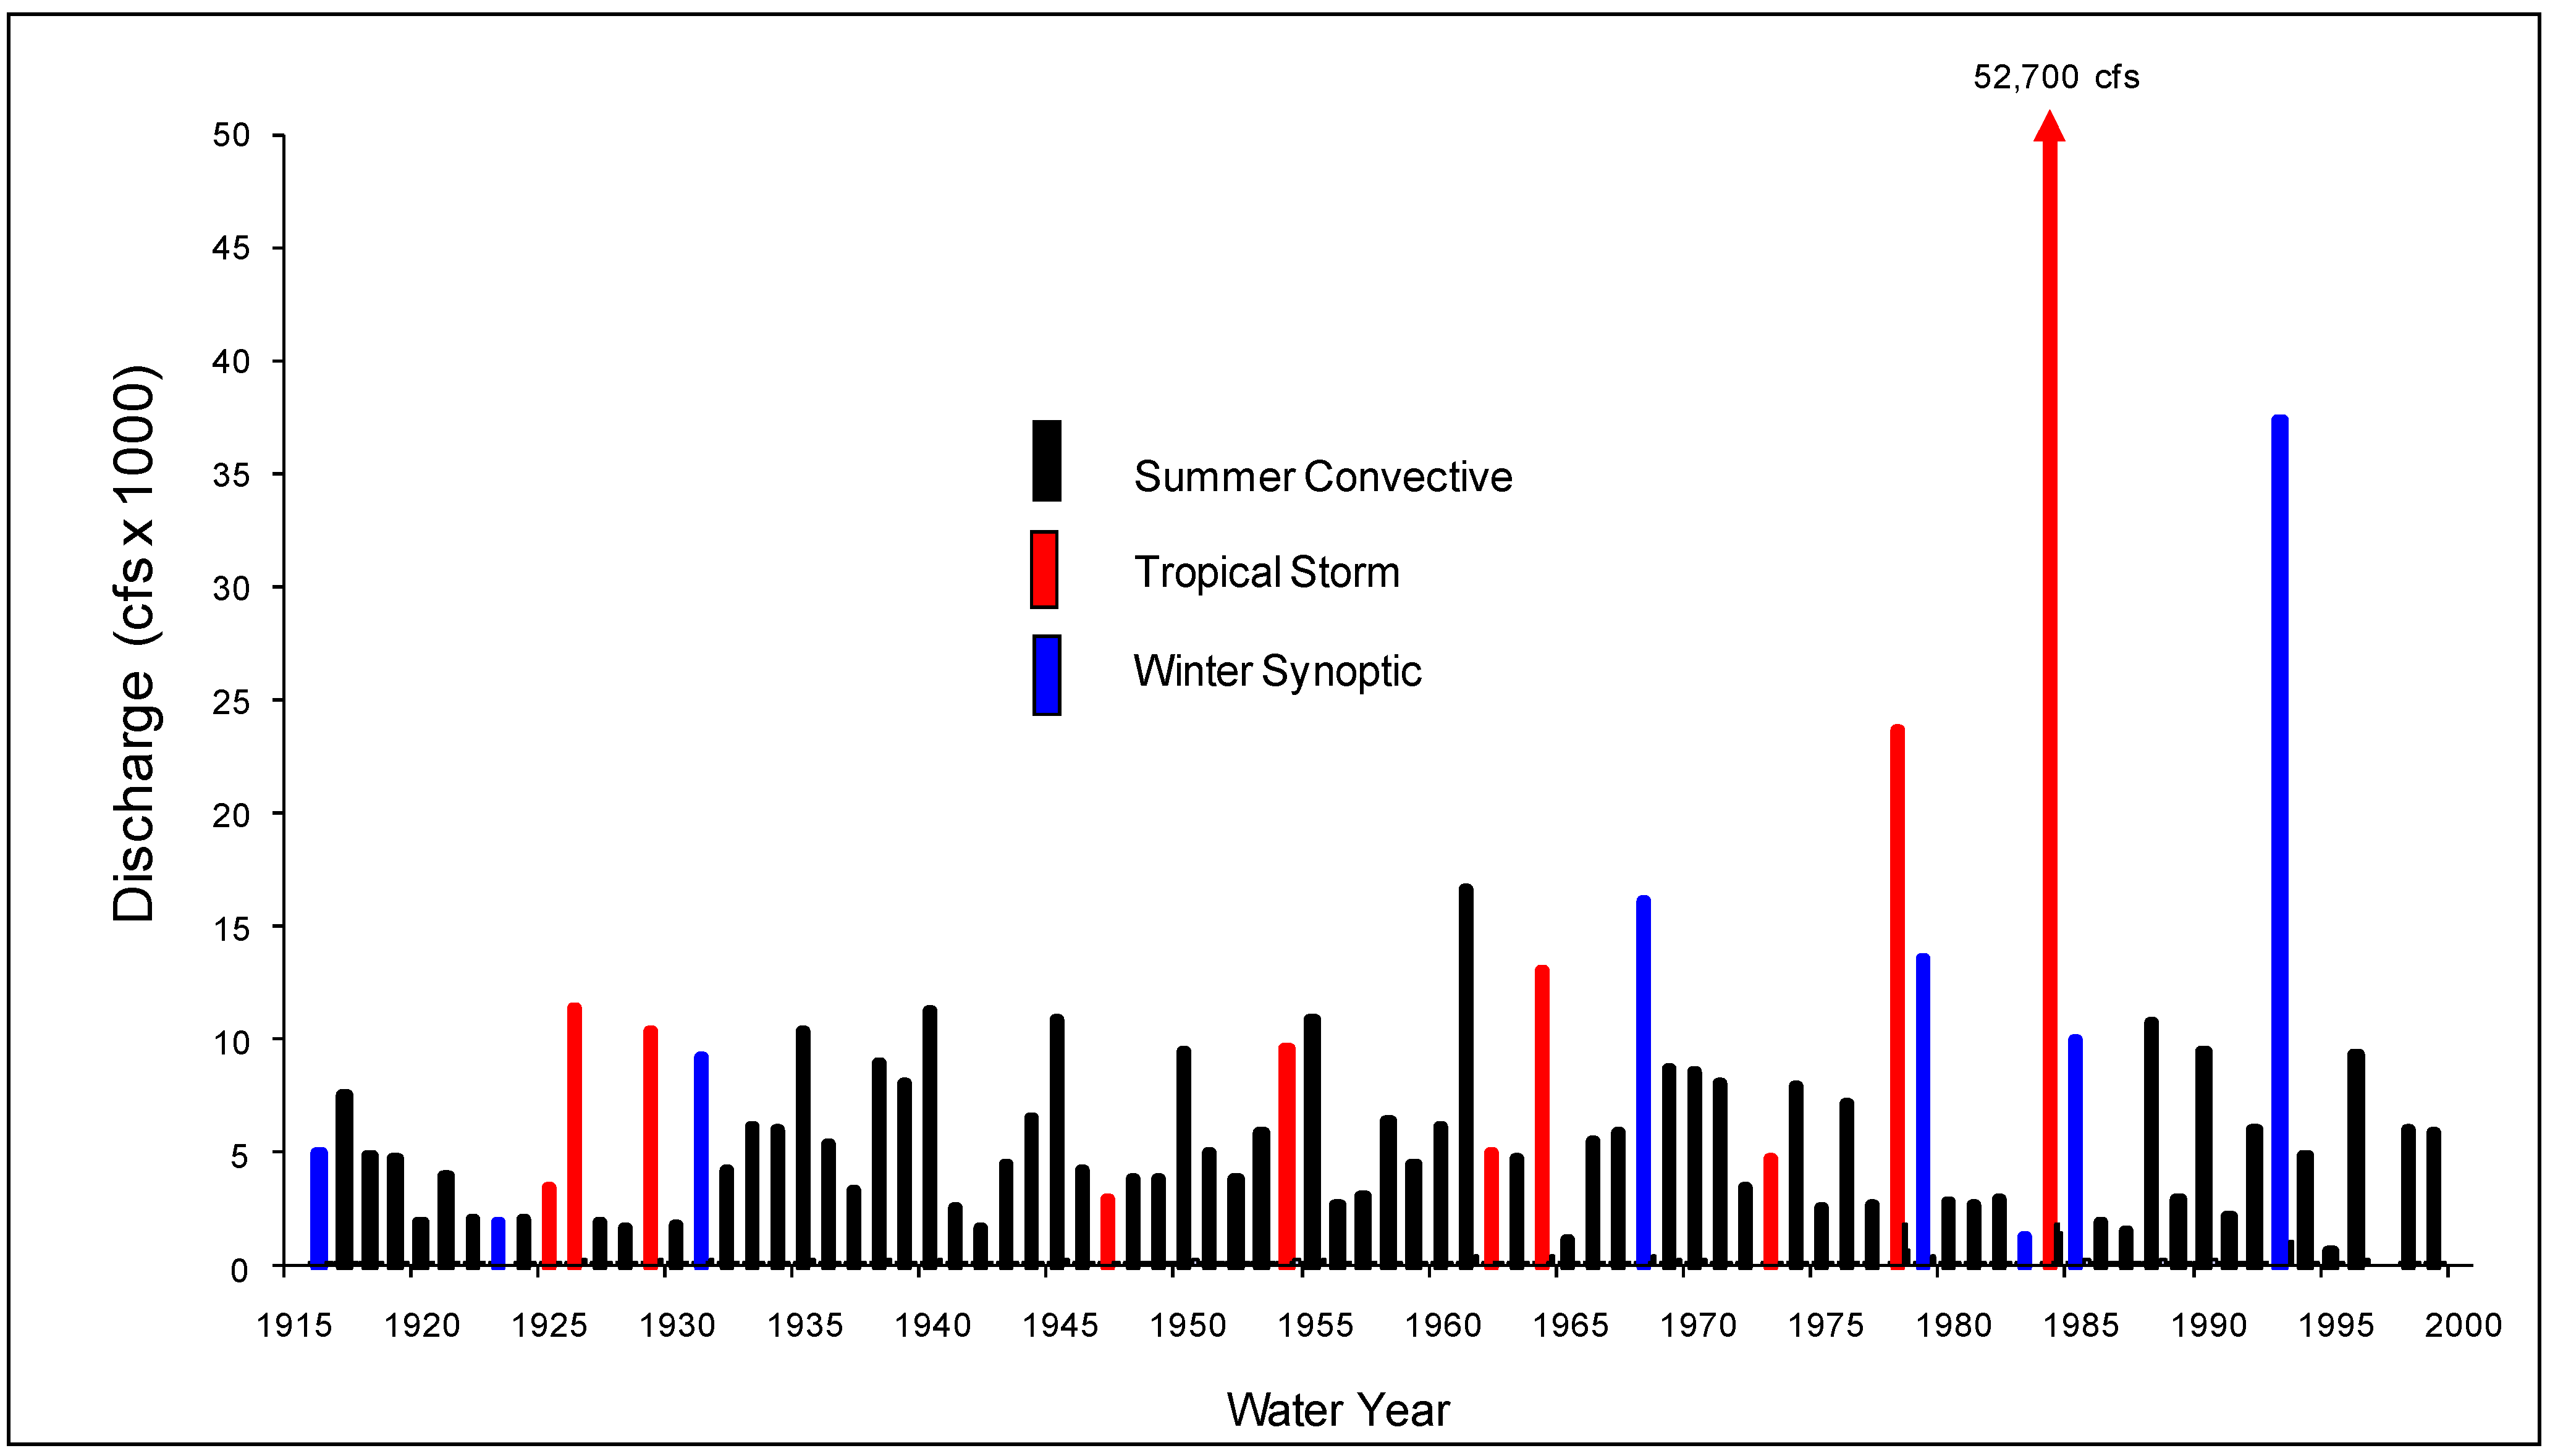
- Smith, W. The Effects of Eastern North Pacific Tropical Cyclones on the Southwestern United States; NOAA Technical Memorandum NWS-WR-197; National Weather: Tucson, AZ, USA, 1986.
- Hirschboeck, K.K. Climate and Floods. National Water Summary 1988–1989—Hydrologic Events and Floods and Droughts; U.S. Geological Survey Water Supply Paper 2375; USGS: Reston, VA, USA, 1991; pp. 67–88.
- McDonald, J.E. Variability of Precipitation in an Arid Region: A Survey of Characteristics for Arizona; Technical Reports on the Meteorology and Climatology of Arid Regions No. 1; Institute of Atmospheric Physics, University of Arizona: Tucson, AZ, USA, 1956. [Google Scholar]
- Hirschboeck, K.K. Respecting the Drainage Divide; Water Resources Update #126. UCOWR: Carbondale, IL, USA, 2003. Available online: http://www.ucowr.siu.edu/updates/126/index.html (accessed on 6 July 2010).
- Hirschboeck, K.K. Flood hydroclimatology. In Flood Geomorphology; Baker, V.R., Kochel, R.C., Patton, P.C., Eds.; John Wiley & Sons: New York, NY, USA, 1988; pp. 27–49. [Google Scholar]
- Webb, R.H.; Betancourt, J.L. Climatic Variability and Flood Frequency of the Santa Cruz River, Pima County, Arizona; U.S. Geological Survey Open-File Report 90–553; U.S. Geological Survey: Denver, CO, USA, 1990.
- Serrat-Capdevila, A.; Valdes, J.B.; Gonxalez; Baird, K.; Mata, L.J.; Maddock, T. Modeling climate change impacts—And uncertainty—On the hydrology of a riparian system: The San Pedro basin (Arizona/Sonora). J. Hydrol. 2007, 347, 48–66. [Google Scholar] [CrossRef]
- The Border Environmental Health Initiative: Investigation of the Transboundary Upper Santa Cruz Basin . Available online: http://borderhealth.cr.usgs.gov/PDFs/WR-website.pdf (accessed on 6 July 2010).
- Patz, J.A.; Balbus, J.M. Methods for assessing public health vulnerability to climate change. Climate Res. 1996, 6, 113–125. [Google Scholar] [CrossRef]
- Liverman, D.; Merideth, R.; Holdsworth, A.; Cervera, L.; Lara, F. An Assessment of the Water Resources in the San Pedro River and SCR Basins, Arizona and Sonora; A Report to the Commission on Environmental Cooperation, Montreal, Quebec; Latin American Area Center and Udall Center for Studies in Public Policy, the University of Arizona: Tucson, AZ, USA, 1997. [Google Scholar]
- Donelson, A.J. Social Networks, Poverty and Development: An Analysis of Capacity Building in Arizona and New Mexico Colonias. Ph.D. Thesis, Department of Geography and Regional Development, University of Arizona, Tucson, AZ, USA, 2005. [Google Scholar]
- U.S. Department of Housing and Urban Development. Delivering Results to Colonias and Farmworkers, 2005. Available online: http://www.HUD.gov (accessed on 6 July 2010).
- Norman, L.M.; Parcher, J.W.; Lam, A.H. Monitoring Colonias along the U.S.-Mexico Border; U.S. Geological Survey Fact Sheet 2004–3070; USGS: Reston, VA, USA, 2004. Available online: http://erg.usgs.gov/isb/pubs/factsheets/fs307004.html (accessed on 6 July 2010).
- Herzog, L. Where North Meets South: Cities, Space and Politics on the U.S. Mexico Border; Center for Mexican-American Studies: Austin, TX, USA, 1990. [Google Scholar]
- Norman, L.M.; Donelson, A.; Pfeifer, E.; Lam, A.H. Colonia Development and Land Use Change in Ambos Nogales, United States-Mexican Border; U.S. Geological Survey Open File Report 2006–1112; USGS: Reston, VA, USA, 2006. Available online: http://pubs.usgs.gov/of/2006/1112 (accessed on 6 July 2010).
- Presidential Documents. In Federal Register; 1994; 59, No. 32. Available online: http://www.dotcr.ost.dot.gov/documents/ycr/eo12898.pdf (accessed on 6 July 2010).
- Real People, Real Environments, and Realistic Economics. Available online: http://www.e3network.org (accessed on 6 July 2010).
- Moda, M.A. A Critical Review of Current EJ Research: Where Do We Go from Here. Master Thesis; Clark University: Worcester, MA, USA, 2007. submitted. Available online: https://www.clarku.edu/departments/idce/docs/Moda_2007.pdf (accessed on 6 July 2010).
- U.S. Environmental Protection Agency. Region 9: Water Program, Watershed Priorities. Available online: http://www.epa.gov/region09/water/watershed/santacruz.html (accessed on 6 July 2010).
- Arnold, J.; Williams, A.; Srinivasan, R.; King, B.; Griggs, A. SWAT, Soil and Water Assessment Tool; USDA-ARS: Temple, TX, USA, 1994. [Google Scholar]
- USGS. Digital Animal-Habitat models for the Southwestern United States, Version 1.0.; National Gap Analysis Program; Center for Applied Spatial Ecology, New Mexico Cooperative Fish and Wildlife Research Unit, New Mexico State University: Las Cruces, NM, 2007. [Google Scholar]
- Esparza, A.; Waldorf, B.; Chavez, J. Localized effects of globalization: The case of Ciudad Juárez, Chihuahua, Mexico. Urban Geogr. 2004, 25, 120–138. [Google Scholar] [CrossRef]
- Lara-Valencia, F.; Declet-Barreto, J.; Keys, E. Spatial equity and transportation hazard along cross-border trade corridors: The case of Ambos Nogales. J. Borderl. Stud. 2008, 23, 1–18. [Google Scholar] [CrossRef]
- Bark-Hodgins, R.H.; Colby, B.G. An Economic Assessment of the Sonoran Desert Conservation Plan. Natur. Resour. J. 2006, 46, 709–725. [Google Scholar]
- Bark-Hodgins, R.; Osgood, D.; Colby, B. Remotely sensed proxies for environmental amenities in hedonic analysis: What does green mean? In Environmental Valuation: Intraregional and Interregional Perspectives; Carruthers, J.I., Mundy, B., Eds.; Ashgate: Surrey, UK, 2008. [Google Scholar]
- Bourne, K.L. The Effect of the Santa Cruz Riparian Corridor on Single Family Home Prices Using the Hedonic Pricing Method. Master Thesis, The University of Arizona, Tucson, AZ, USA, 2007. [Google Scholar]
© 2010 by the authors; licensee MDPI, Basel, Switzerland. This article is an Open Access article distributed under the terms and conditions of the Creative Commons Attribution license (http://creativecommons.org/licenses/by/3.0/).
Share and Cite
Norman, L.; Tallent-Halsell, N.; Labiosa, W.; Weber, M.; McCoy, A.; Hirschboeck, K.; Callegary, J.; Van Riper, C., III; Gray, F. Developing an Ecosystem Services Online Decision Support Tool to Assess the Impacts of Climate Change and Urban Growth in the Santa Cruz Watershed; Where We Live, Work, and Play. Sustainability 2010, 2, 2044-2069. https://doi.org/10.3390/su2072044
Norman L, Tallent-Halsell N, Labiosa W, Weber M, McCoy A, Hirschboeck K, Callegary J, Van Riper C III, Gray F. Developing an Ecosystem Services Online Decision Support Tool to Assess the Impacts of Climate Change and Urban Growth in the Santa Cruz Watershed; Where We Live, Work, and Play. Sustainability. 2010; 2(7):2044-2069. https://doi.org/10.3390/su2072044
Chicago/Turabian StyleNorman, Laura, Nita Tallent-Halsell, William Labiosa, Matt Weber, Amy McCoy, Katie Hirschboeck, James Callegary, Charles Van Riper, III, and Floyd Gray. 2010. "Developing an Ecosystem Services Online Decision Support Tool to Assess the Impacts of Climate Change and Urban Growth in the Santa Cruz Watershed; Where We Live, Work, and Play" Sustainability 2, no. 7: 2044-2069. https://doi.org/10.3390/su2072044
APA StyleNorman, L., Tallent-Halsell, N., Labiosa, W., Weber, M., McCoy, A., Hirschboeck, K., Callegary, J., Van Riper, C., III, & Gray, F. (2010). Developing an Ecosystem Services Online Decision Support Tool to Assess the Impacts of Climate Change and Urban Growth in the Santa Cruz Watershed; Where We Live, Work, and Play. Sustainability, 2(7), 2044-2069. https://doi.org/10.3390/su2072044