Article

Shrub Encroachment Shapes Soil Nutrient Concentration, Stoichiometry and Carbon Storage in an Abandoned Subalpine Grassland

1
Guizhou Institution of Prataculture, Guizhou Academy of Agricultural Sciences, Guiyang 550006, China
2
College of Animal Science, Guizhou University, Guiyang 550006, China
*
Author to whom correspondence should be addressed.
These authors contributed equally to this work.
Sustainability 2019, 11(6), 1732; https://doi.org/10.3390/su11061732
Submission received: 11 February 2019 / Revised: 4 March 2019 / Accepted: 19 March 2019 / Published: 22 March 2019
(This article belongs to the Section Sustainable Agriculture)

Abstract

:
Soil nutrient stoichiometry plays a substantial role in terrestrial carbon and nutrient cycling. However, the changes in soil nutrient stoichiometry with shrub encroachment (SE) remain poorly understood, especially in subalpine areas. We examined the changes in soil nutrient concentration, nutrient stoichiometry, and organic carbon (OC) storage (at a depth of 0–5, 5–10 and 10–20 cm) in three successional shrub encroachment stages (early, mid and late) in an abandoned subalpine Eulalia pallens (Hackel) Kuntze grassland. An ANOVA showed that SE did not produce serious soil acidification, but significantly increased the soil OC and total phosphorous (TP) concentration, and improved the stoichiometry ratio of soil OC to total nitrogen (OC:TN) in all layers. OC storage tended to increase with SE. SE thus did not indicate degradation of the grassland. A redundancy analysis (RDA) and partial RDA revealed that the shrub relative cover and soil water content were the most important factors affecting the soil nutrient concentration, that the soil available phosphorous (AP), nitrogen, potassium, calcium (ACa), and magnesium concentration and shrub relative cover were the most important factors influencing soil nutrient stoichiometry ratios, and that soil OC:TN, TN:TP, OC:TN:TP, and AP:ACa ratios, bulk density, and pH were the most important factors influencing soil OC storage over SE. Our study provides insights into SE in grassland areas, and potentially provides a useful reference for ongoing grassland conservation and restoration in subalpine regions.

1. Introduction

Shifts from grassland to shrubland, the thicketization of grassland, or the encroachment of woody plants into grassland—a phenomenon known as shrub encroachment (SE)—occur all over the world [1,2,3,4,5,6] and have taken place during the last century [3,4,5,7,8], and even in the past two centuries [9,10]. This global encroachment at the expense of grasses in rangeland is forecast to increase over the coming century [11]. In many parts of the world, woody plant abundance (cover and biomass) has multiplied in the past 50–100 years [12]. It poses a serious threat to the food security [13,14,15] and biodiversity [16,17,18] in rangeland areas, which cover more than 30% of the terrestrial land area [19], yield over 30% of the terrestrial annual net primary productivity [20], and support 30% of the total human population, as well as most livestock [12]. SE, therefore, is one of the most striking land cover changes in rangeland areas around the globe [13,21].
Understanding the consequences of SE is important [5]. However, little attention has been paid to the effects of local species encroachment on soil properties [22]. Previous extensive research efforts have found that SE into rangeland is often irreversible [4,23], and commonly alters the soil, but the existing results have not been consistent. For example, studies that found a decreasing effect of SE on soil nutrient levels [24,25,26,27] and carbon (C) sequestration [24,25,26,27] can be contrasted with others that found an increasing effect of SE on soil nutrient levels [2,10,26,28,29,30] and C sequestration [2,4,26,28,31,32,33]. A negligible effect of SE, with it causing few or no changes [3,19], has also been found. Although other studies have tried to uncover a more universal pattern [3,4,8], it has been difficult to predict the local effects of SE on the basis of these previous inconsistent findings. The vast majority of the previous efforts on SE have targeted arid [3,11,23], semi-arid [3,12,34,35,36] and mesic areas [19,37], such as savanna [6,12,38,39,40], steppe [9,41] and prairie [37,42], and a study on global grassland revealed that soil properties seem to be the primary dependent variables in response to the extent of these changes [43]. What remains to be investigated is how soil nutrient changes occur via SE under subtropical, monsoon, humid, and subalpine conditions.
Soil nutrient stoichiometry (SNS) makes a substantial contribution to terrestrial biogeochemical cycling [44]. Its changes over time could lead to potential changes in species composition and nutrient cycles. SNS is impacted by succession [45,46,47], vegetation changes [48,49,50], and environmental factors [48,51,52]. A study in wetlands found that the impacts of environmental factors on SNS might be greater than that of the fertile island effects on a larger scale [52]. However, studies on the factors shaping SNS are still limited, and the regular mechanism remains unclear [52]. In particular, whether and how SE shapes SNS is largely still unknown [50,53].
The effects of SE on soil nutrient concentration and stoichiometry in natural, abandoned subalpine Eulalia pallens (Hackel) Kuntze (E. pallens or Baijiangan in Chinese) grassland have not yet been explored. Subalpine belts are considered to be plant biodiversity hotspots [54], and up to 8491 vascular plant species were recorded on the Guizhou plateau [55]. E. pallens is an endemic species which is only distributed in Guizhou, Yunnan, Sichuan and Guangxi in China, and in a small part of India [56]. SE in these areas may threaten their habitats. Understanding and evaluating the consequences of SE on soil nutrient concentration and stoichiometry in this subalpine E. pallens grassland will be key to improving our knowledge, protecting species diversity, and developing good land management and policies for improving soil fertility and C sequestration. Research into soil nutrient concentration and stoichiometry in these special areas is needed.
We analysed the soil nutrient concentration and stoichiometry with SE, and explored what factors and to what extent the factors impact on soil nutrient concentration, stoichiometry, and C storage (CS), in order to address these three questions: (1) Does SE increase soil nutrient concentration, stoichiometry, and CS? (2) How does SE influence SNS? (3) What are the implications of changed soil nutrient concentration, stoichiometry, and CS caused by SE in this special area?

2. Methods

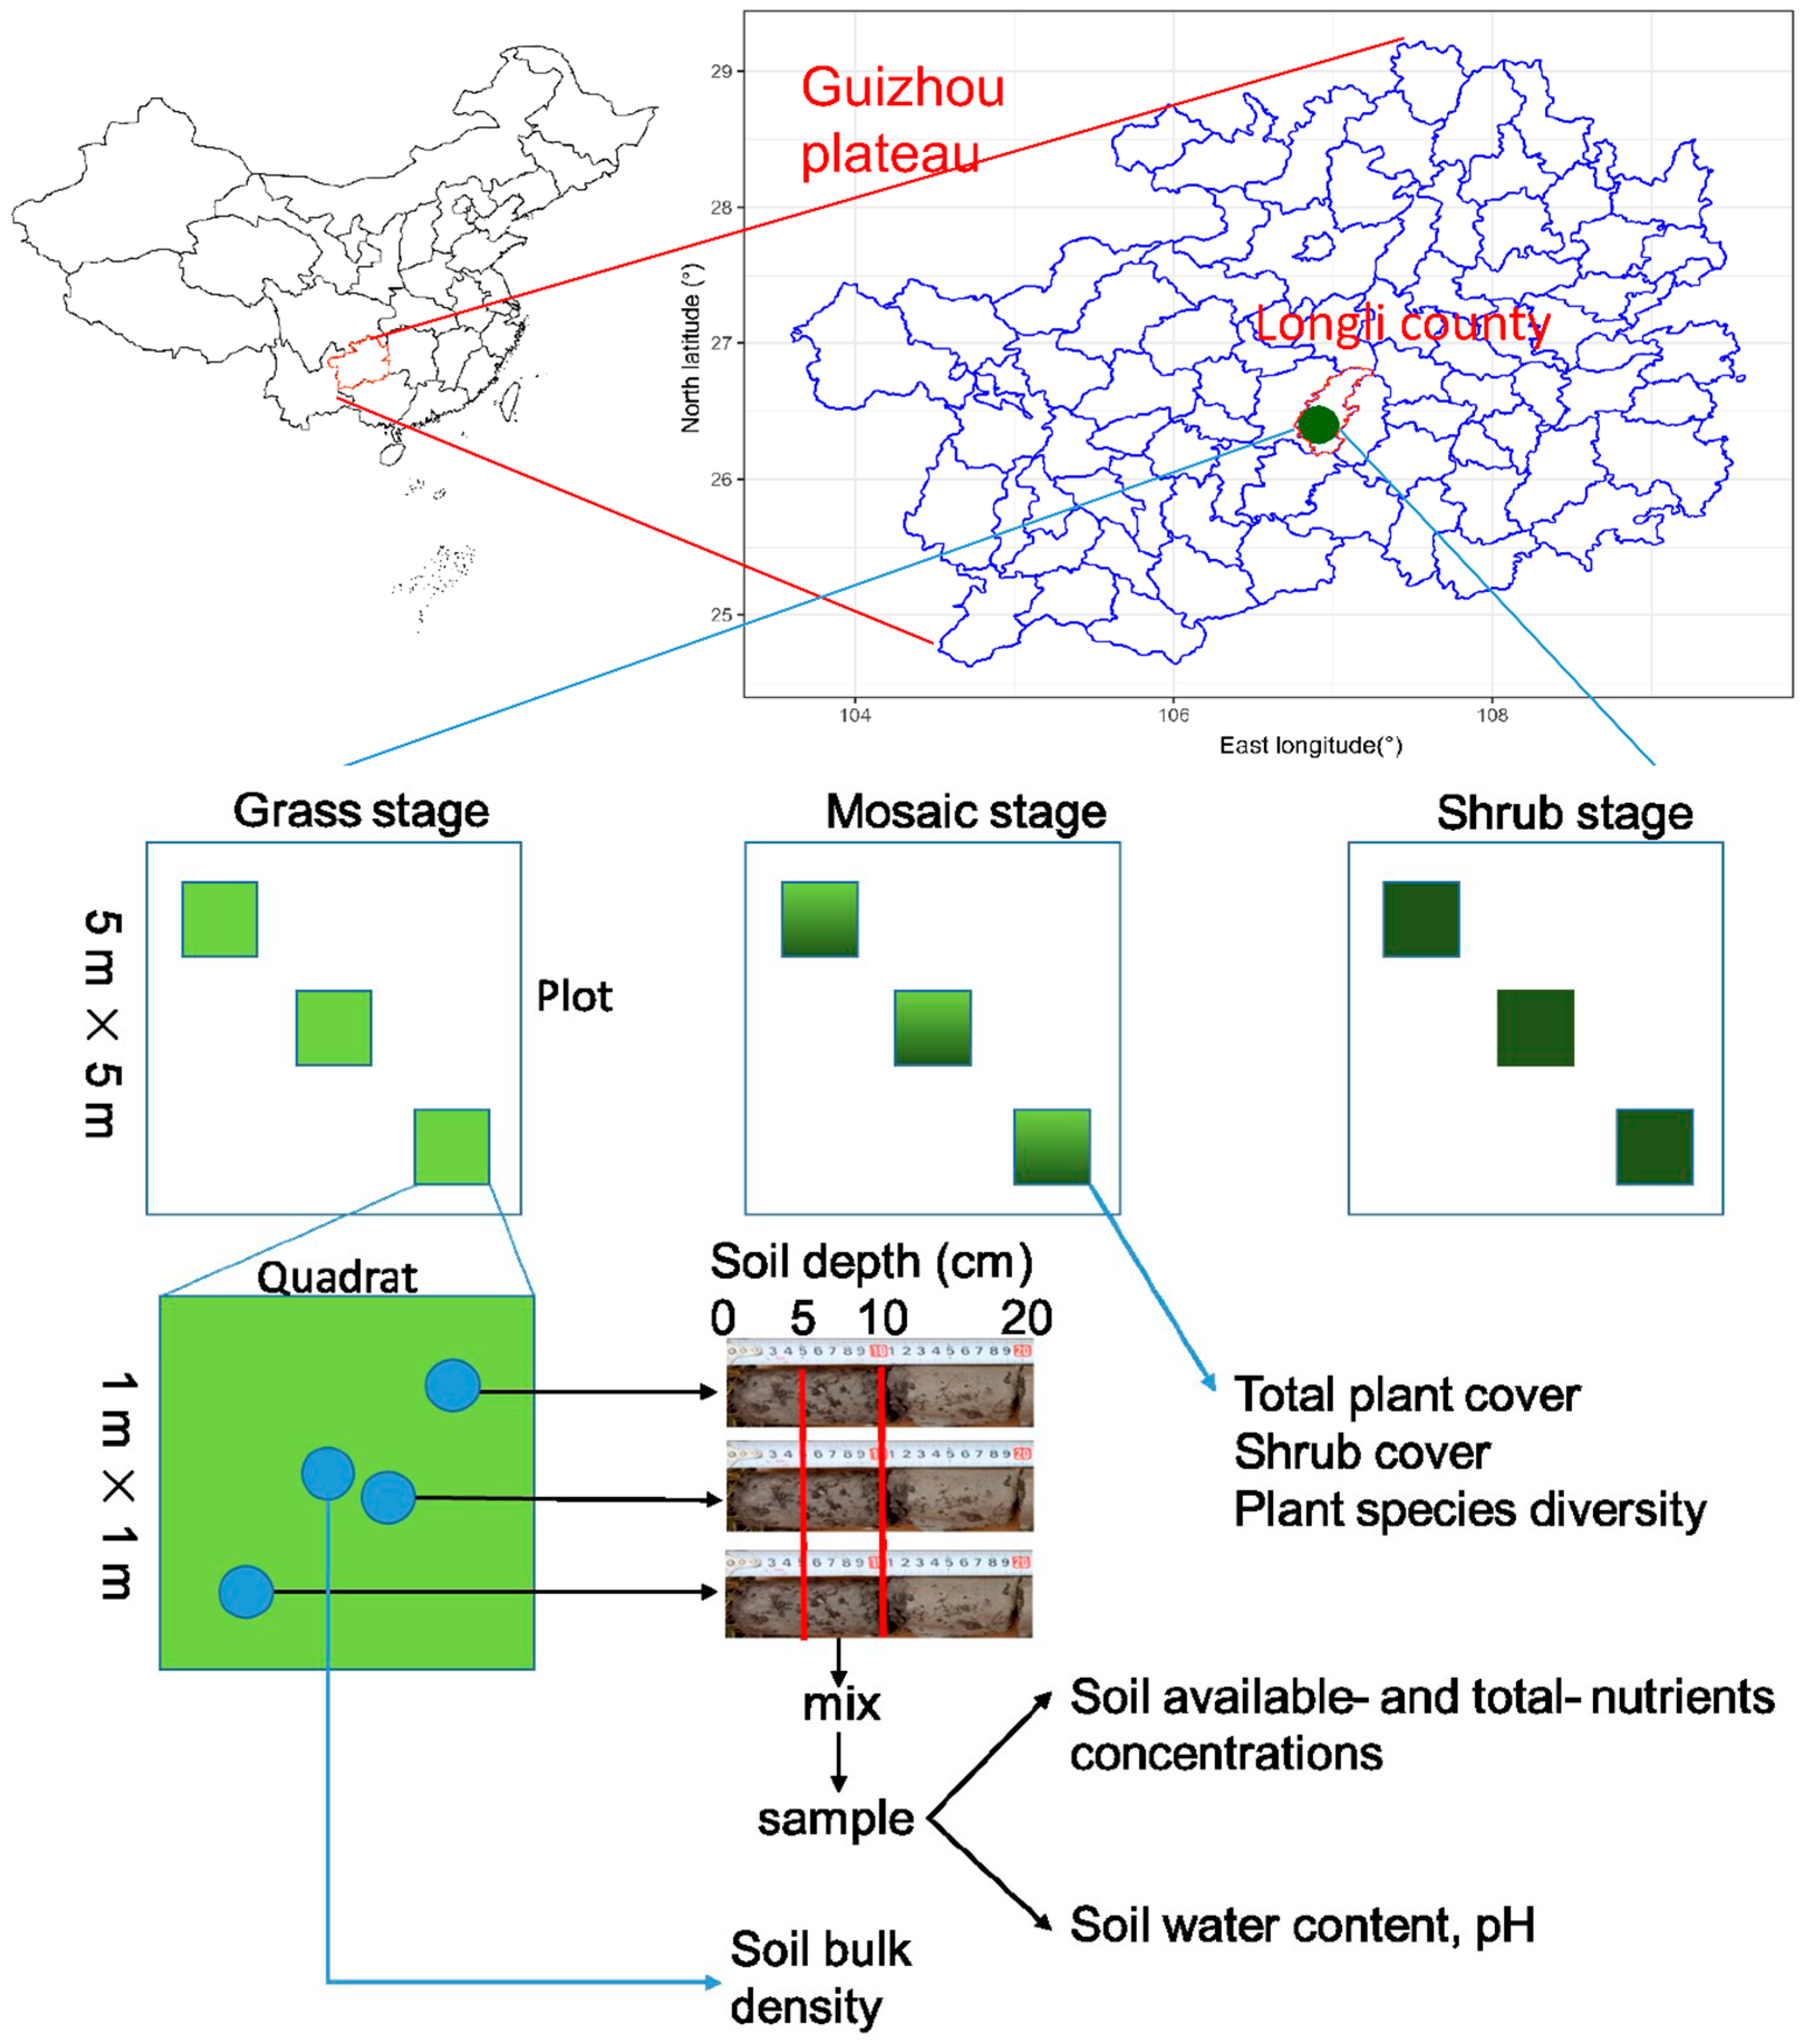
2.1. Site Description

Samples were collected in a natural subalpine E. pallens grassland ecosystem, a 6000 ha reserve (1500–1700 m above sea level) in Longli county on the Guizhou plateau, southwest China (Figure 1). This is a northern subtropical monsoon humid region with an annual average air temperature of 14.7 °C (−3 to 35 °C) and 1160 mm of annual precipitation (1090–1180 mm, mainly falling from April to October).

2.2. Plant Quadrat Survey, Soil Sampling, and Determination

The “space-for-time” substitution technique is useful for studying the long-term ecological succession and soil development over time [44,57]. The method used in this study was recommended by Walker et al. [57], and was used for studying SE or successional changes in soil stoichiometry [44]. Based on the process of local SE succession and the ecological characteristics of native species, we carefully selected the typical dominant community plots that represented the SE successional stages: the grass stage, mosaic stage, and shrub stage, on the abandoned, natural E. pallens grassland. In a plot (5 m × 5 m) (Figure 1), we classified plants into the two plant functional types (shrub vs. herbaceous and grasses) according to the growth form of the plants. The total plant cover and shrub cover were visually estimated and expressed as percentages [58], and the shrub relative cover was obtained via dividing the shrub cover by the total plant cover. The plant species richness per quadrat (the number of species) was recorded in the three quadrats (1 m × 1 m) we selected randomly in the corresponding plot, and expressed as the plant species diversity. The plant species richness per plot is the total number of species in three quadrats in the plot. Table 1 shows that SE succession in this grassland is characterised by shifts in plant functional types, shrub relative cover, and plant species richness per quadrat. Specifically, at the early stages of SE, grass species (e.g., E. pallens) dominated; at the mid stages, shrubs (e.g., Vaccinium fragile Franch.) increased and grasses (e.g., E. pallens) decreased, and at the late stages, shrubs (e.g., Vaccinium fragile Franch.) became dominant. The different plots used in this study occur in a relatively narrow geographical range, with almost the same topography. The soil is yellow earths (Chinese Soil Taxonomy, 1998) or Haplic Alisols (FAO/UNESCO taxonomy, 1988). No permits were required for the described study.
As the soil depth is universally shallow (20–50 cm to bedrock on the hilltop plateau), along with enhanced topsoil nutrients [59] and the recent finding that the main effects of SE would be to increase topsoil organic C [43], we thus collected soil samples from the topsoil [58]. Early in October 2017, in the quadrats (1 m × 1 m) mentioned above (Figure 1), we collected three replicate soil cores (0–20 cm) in each quadrat after clearing the litter [26], then pooled and homogenised the three cores for each soil layer (0–5 cm, 5–10 cm, and 10–20 cm). This resulted in one mixed soil sample for each replicate after the removal of large items of organic material and stone by hand. One subsample was immediately transported to Nanjing Zoobio Biotechnology Ltd. to determine the concentration of soil organic carbon (OC), soil total nitrogen (TN), available nitrogen (AN), soil total phosphorus (TP), available phosphorus (AP), available potassium (AK), available calcium (ACa), and available magnesium (AMg). The remaining subsamples were used for determining the soil pH and water content (WC). The soil bulk density (BD) was measured using the cutting ring method (50 mm diameter, 50 mm height). The WC was determined by oven-drying samples to a constant mass at 105 °C; the pH was measured using a pH meter after shaking a soil-water (1:2.5 w/v) suspension for 30 min. The above soil variables were determined in the lab of Guizhou Institution of Prataculture, and the following soil variables were determined in Nanjing Zoobio Biotechnology Ltd., according to Bao [60]. The soil samples were air-dried and ground (<2 mm) prior to the determination of the available and total nutrients. OC was determined using an elemental analyzer (Elementar total organic carbon/total nitrogen analyzer, Germany); TN was determined through sulfuric acid digestion and using an FOSS automatic nitrogen determination apparatus; AN was analyzed by the alkali diffusion method; TP was determined by NaOH digestion followed by ammonium-molybdate colorimetry (T181 XinShiJi ultraviolet spectrophotometer, China); AP was extracted using the NaHCO3-ultraviolet spectrometer subsystem (T181 XinShiJi ultraviolet spectrophotometer, China); AK was extracted with ammonium acetate; and finally ACa and AMg were determined using a soil:water (1:5) mixture by an Atomic Absorption Spectrophotometer.

2.3. Data Analyses

OC and TN were expressed as g·kg−1; TP, AN, AP, AK, ACa and AMg as mg·kg−1; WC was expressed as a decimal; BD as g·cm−3; the soil stoichiometry as molar ratios (i.e., the ratio of OC to TN as OC:TN); and the C storage (CS) was calculated for the 0–5 cm, 5–10 cm, 10–20 cm, and 0–20 cm layers according to the following formula [61], and expressed as kg·m−2:
C S = i = 1 n I i × B i × O C i
where n is the number of soil layers, I i is the interval of the soil layer (cm) of i , B i is the soil bulk density (g·cm−3) of the soil layer of i , and O C i is the soil OC concentration (g·kg−1) at the soil layer of i .
Data were log10 transformed to fulfil normality and homogeneity of variance if needed [2,44,58,62]. At a given soil layer, the differences in soil environment, nutrient concentration, CS, and stoichiometry among the SE stages were tested using a one-way ANOVA with Duncan’s post-hoc tests in IBM SPSS Statistics version 25.0 (IBM Corp., Armonk, NY, USA), and the figures were plotted in Microsoft Office Excel 2003 (Microsoft Corp., Washington, DC, USA). The interaction effects between SE and the soil layer on the soil environment, nutrition concentration, CS, and stoichiometry were derived from a two-way ANOVA, and the ηp2 (partial eta-squared) statistic in the two-way ANOVA was used to determine the relative importance of each factor or interaction [28,63] in IBM SPSS Statistics version 25.0. A higher ηp2 represents a greater importance. A Mantel test based on Euclidean distance was used to test the relationships of the soil nutrient concentration and CS or soil stoichiometry with the plant and soil factors, and the significance of the relationships. A redundancy analysis (RDA) was used to show the relationships of soil nutrient concentration and CS or soil stoichiometry with the plant and soil factors. A partial RDA was used to partition the variation in soil nutrient concentration and CS or soil stoichiometry. The variables in RDA or partial RDA were tested by the variance inflation factor test. The variables that had a variance inflation factor (VIF) ≥ 10.0 were commonly considered to have collinearity and were removed. The linear model was used in the regression analysis for revealing plant factors affecting the soil OC concentration and CS.
All data were collated in Excel 2003, and data transformation, regression analysis, RDA, and partial RDA were conducted in R version 3.4.4 (R Development Core Team, 2018).

3. Results

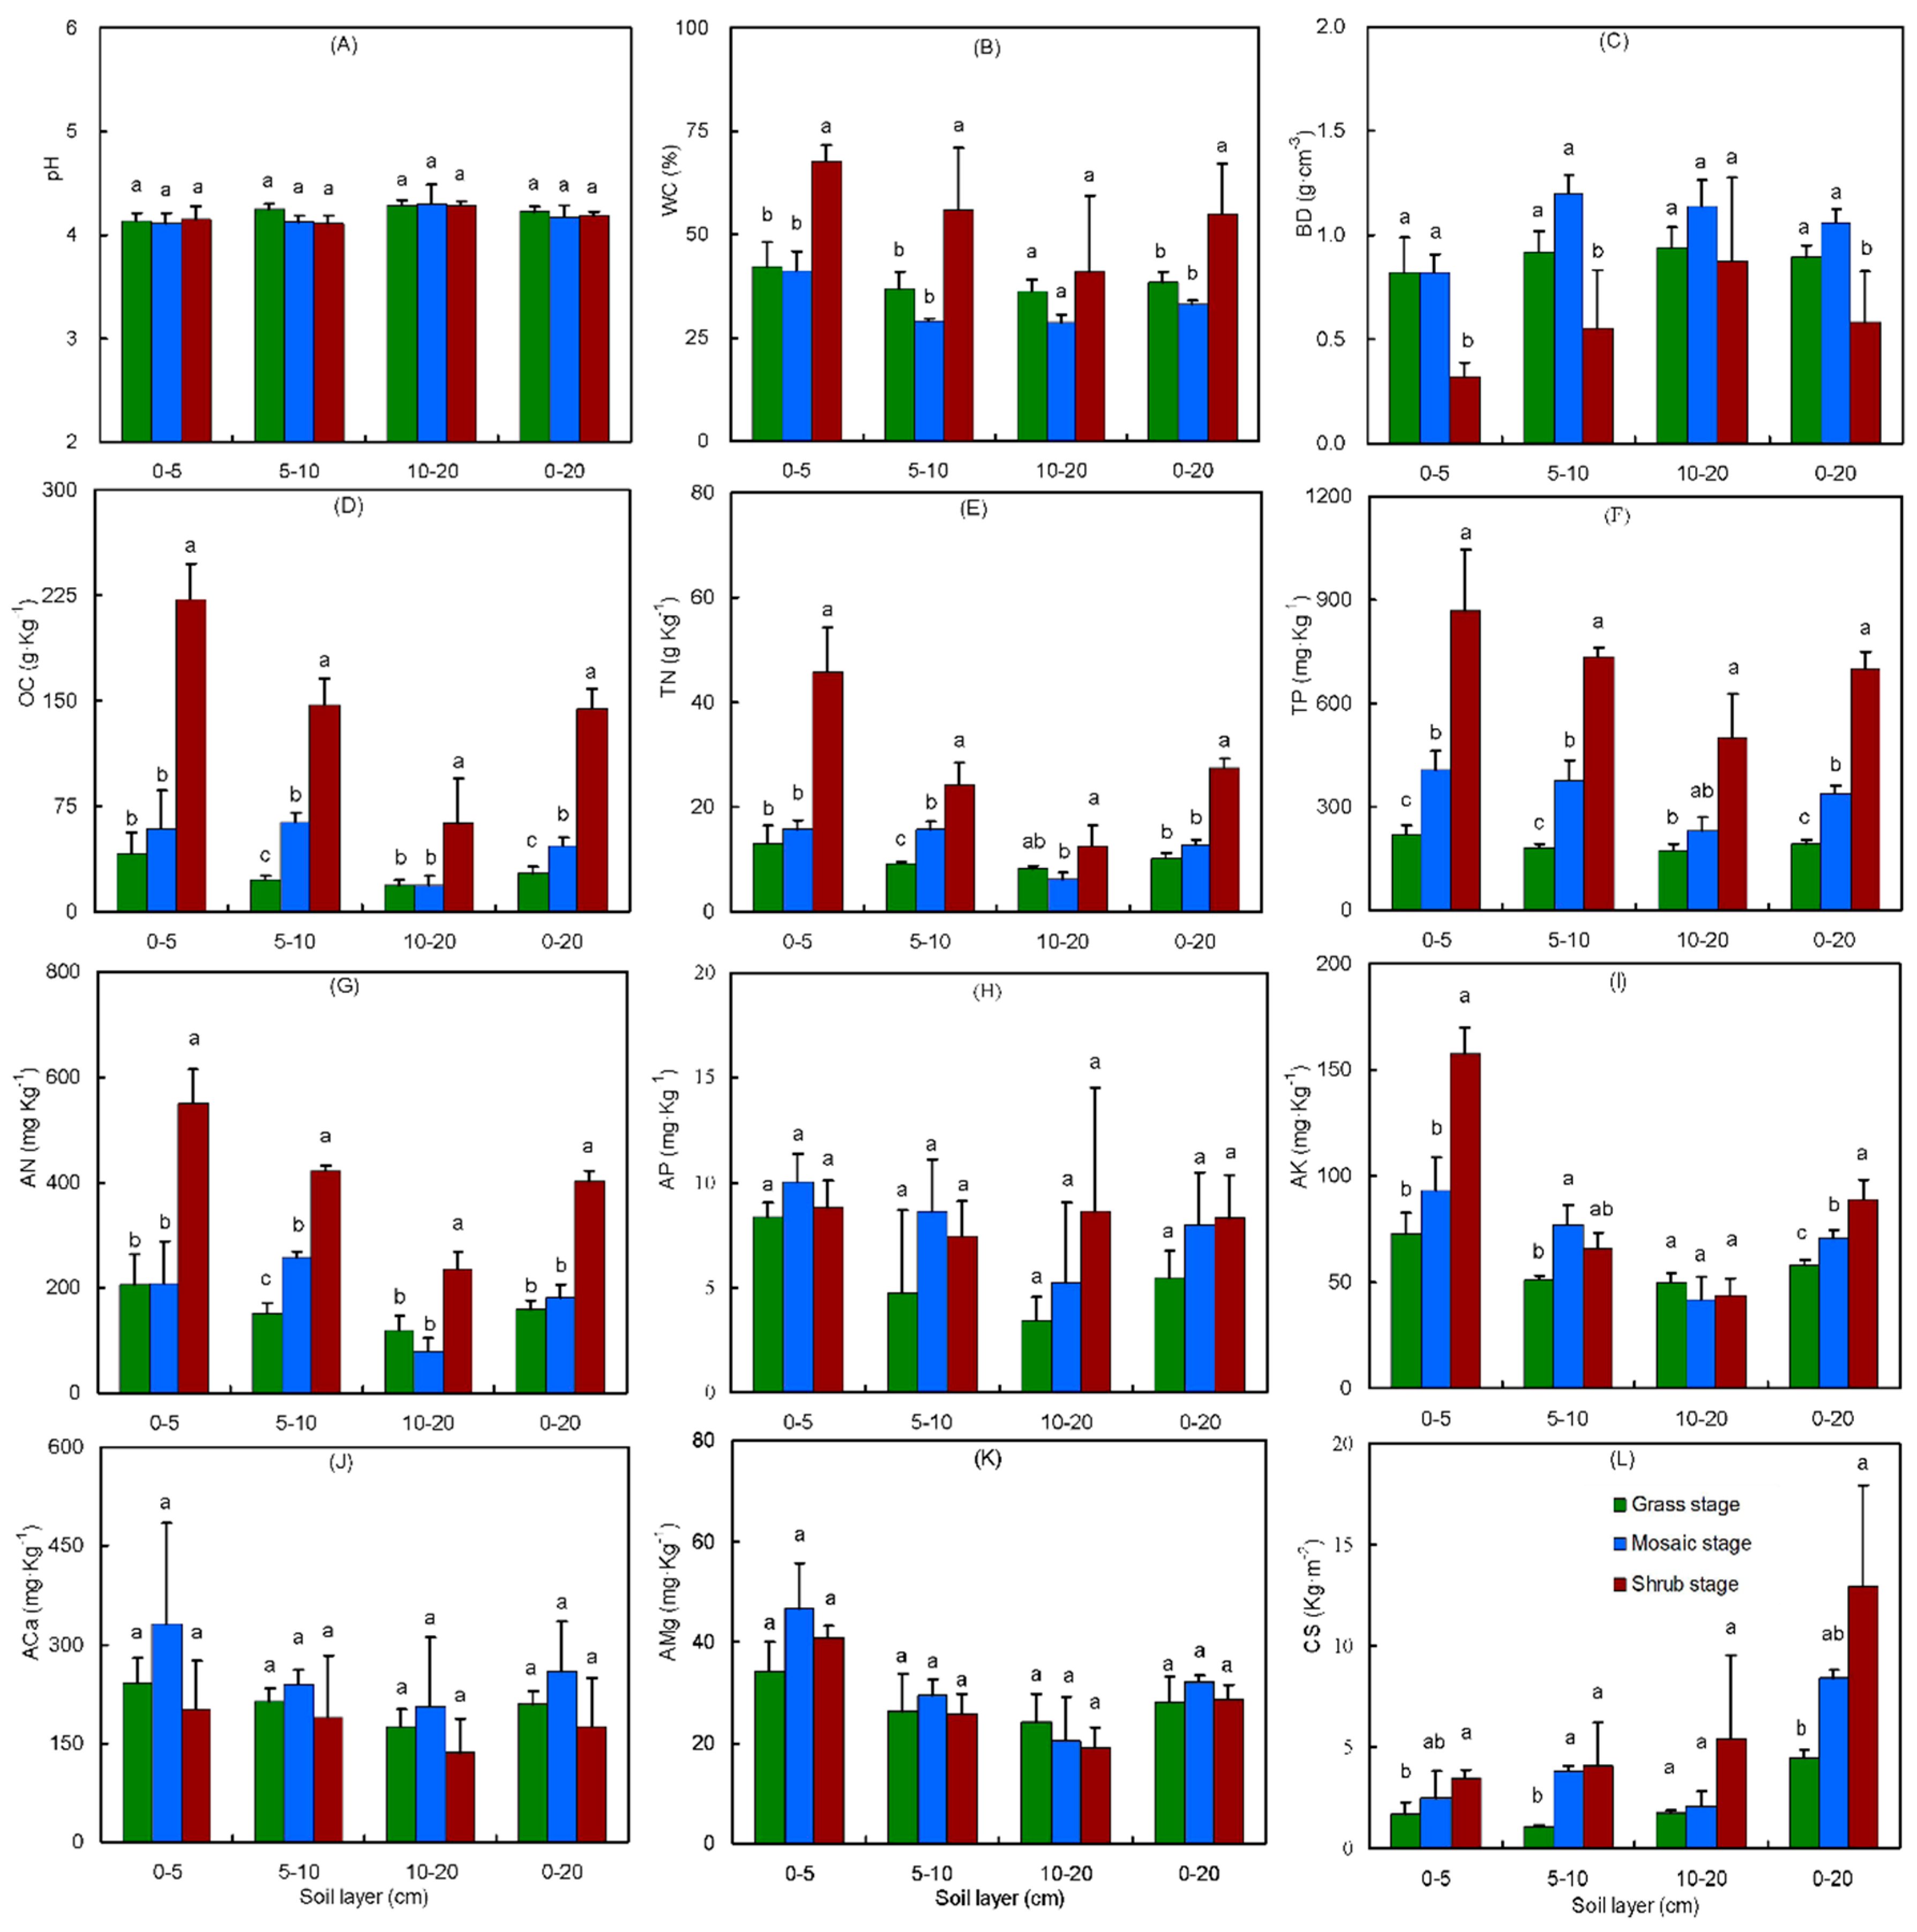
3.1. Shrub Encroachment Shaped the Soil Environment, Nutrient Concentration, and Carbon Storage

A one-way ANOVA for the soil environment, nutrient concentration, and the CS in the various SE stages is shown in Figure 2. The soil pH, ranging from 4.05 to 4.51, did not vary significantly with SE in all soil layers (p > 0.05) (Figure 2A). This indicated that SE did not produce serious soil acidification. The maximum soil WC (54.96%) and the minimum soil BD (0.58 g·cm−3) were observed in all soil layers of the shrub stage (Figure 2B,C). The soil OC, TN and AN concentration in the 0–5, 5–10, and 0–20 cm soil layers improved with SE (Figure 2D,E,G), and the soil TP concentration in all soil layers improved with SE (Figure 2F). The soil AK concentration in the 0–5 and 0–20 cm soil layer improved with SE (Figure 2I). The soil ACa and AMg concentrations did not vary significantly with SE (Figure 2J,K) (p > 0.05).
A two-way ANOVA (Table S1) showed that SE significantly impacted the BD, WC, and soil nutrition concentration (p < 0.05) except for AP, ACa and AMg, while the soil layer significantly impacted the soil pH, BD, WC and nutrient concentration (p < 0.05), except for AP and ACa. Significant interactions between SE and the soil layer were also found in the soil OC, TN, TP, AN and AK concentrations (p < 0.05). The soil CS improved with increasing soil layers, and improved with SE in all soil layers, and the soil CS in the 0–5, 5–10 and 0–20 cm soil layers was significantly higher in the shrub stage than in the grass stage (p < 0.05) (Figure 2L). The two-way ANOVA analysis (Table S1) showed that SE significantly impacted the CS (p < 0.05), but the soil layer and interaction had no significant impact (p < 0.05), indicating that SE is the main factor shaping the soil CS.
The ηp2 in the partial eta-squared statistic can determine the relative importance of SE, the soil layer, and their interaction, and a higher ηp2 value represents a greater importance. The ηp2 statistic is shown in Table S1. For the soil OC, TN, TP, and AN concentration, the relative importance of factors followed the decreasing order of SE > soil layer > their interaction, indicating that SE is the main factor shaping the soil OC, TN, TP, and AN concentration. For the soil AK concentration, the decreasing order is: soil layer > their interaction > SE (Table S1), indicating that the soil layer, rather than SE, is the main factor shaping the soil AK concentration.

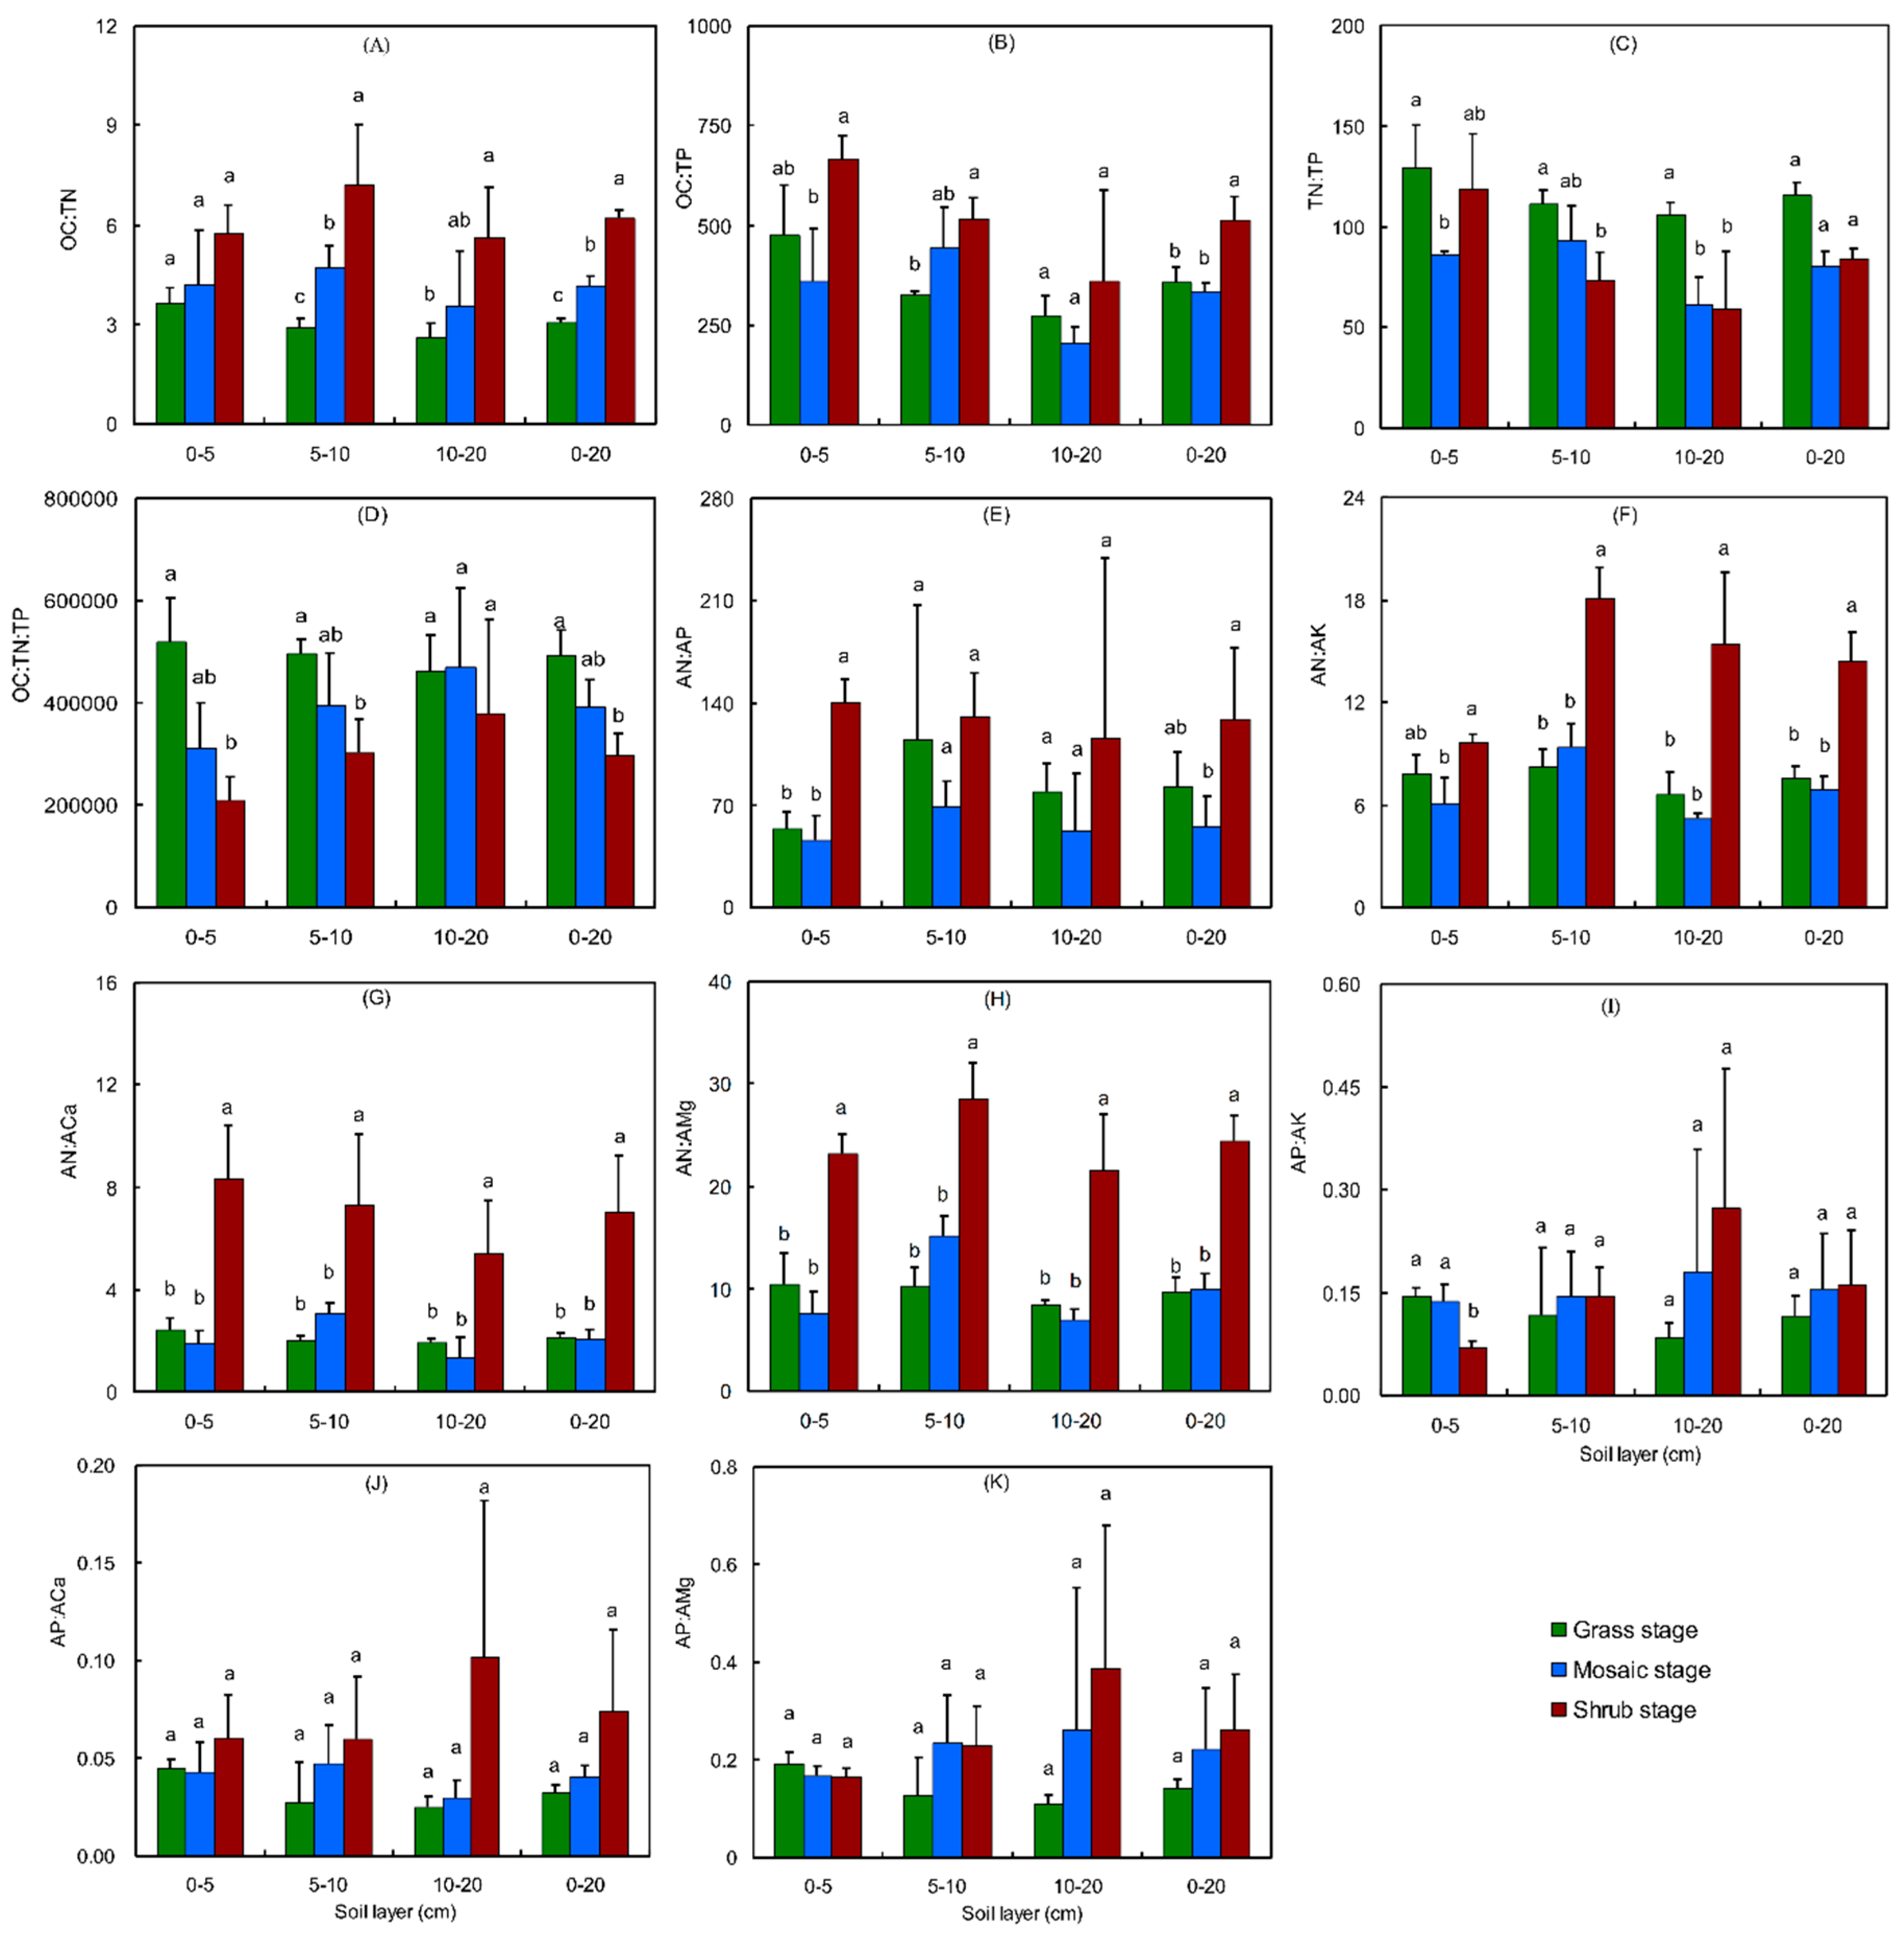
3.2. Shrub Encroachment Changed Soil Nutrient Stoichiometry

A one-way ANOVA for SNS among the SE stages is shown in Figure 3. The SNS ratios changed with SE, but only the OC:TN ratio improved with SE in all soil layers (Figure 3A). The TN:TP ratio was higher in all soil layers of the grass stage (Figure 3C), and the OC:TN:TP ratio was lower in the shrub stage in all soil layers (Figure 3D). However, the ratios of OC:TN, OC:TP, AN:AP, AN:AK, AN:ACa, AN:AMg, and AP:ACa in all soil layers were higher in the shrub stage (Figure 3A,B,E–H).
The two-way ANOVA analysis (Table S1) showed that SE significantly impacted SNS (p < 0.05), except for the AP:AK and AP:AMg ratios. However, the soil layer significantly impacted the OC:TP, TN:TP, AN:AK and AN:AMg ratios (Table S1). Their significant interactions were also found only in the AN:AK ratio (p < 0.05). For the AN:AK ratio, the relative importance of factors followed the decreasing order of SE > soil layer > their interaction (Table S1), indicating SE was the main factor shaping the AN:AK ratio.

3.3. The Influence of Plant and Soil Factors on Soil Nutrients, Stoichiometry, and Carbon Storage

Plant and soil factors influenced the characteristics of the soil nutrient concentration, stoichiometry, and carbon storage. A redundancy analysis (RDA) was used to examine the effects of the plant and soil factors on soil nutrients, stoichiometry, and carbon storage, and a partial RDA was used to quantify the effect size of the plant and soil factors. In the biplots of the RDA (Figure 4), the dot represents a soil sample; dots with the same colour represent the same SE stage. To readily observe whether soil samples in the SE stage were separated, the confidence intervals (90%) are shown for each stage by using an ellipse.
For the RDA model of the soil nutrient concentration, the Monte Carlo permutation test showed that this model was highly significant (p < 0.001) and explained 66.37% of the total variation, indicating that the five plant factors (shrub relative cover and plant diversity) and soil environmental factors (pH, WC, and BD) had a significant impact on the soil nutrient concentration (Mantel test r = 0.47, p < 0.001). Specifically, the first axis of the RDA was significant (Monte Carlo permutation test, p < 0.001), accounting for 60.76% of the total variation (Figure 4A). From the biplot of the RDA (Figure 4A), obvious differences were observed in the soil nutrient concentration under different shrub encroachment stages along the first axis. A forward selection of the five factors in the RDA ordinations showed that two factors, the shrub relative cover and soil WC, were significantly related to spatial variations in the soil nutrient concentration (Monte Carlo permutation test, p < 0.05). The test of the variance inflation factors found that the variance inflation factor (VIF) of these two significant factors were all far lower than 10. Following the forward selection, a partial RDA was used to disentangle the effect of each individual significant factor. Here, the effect is the portion of variation that is solely explained by one individual significant factor, with all the others used as covariables [64]. The result of the partial RDA for the soil nutrient concentration showed that the shrub relative cover and soil WC explained 45.44% and 9.82% of the total variation, respectively. The pie chart (Figure 4B) showed that the shrub relative cover and soil WC were thus identified as the most important factors affecting the soil nutrient concentration.
For the RDA model of the SNS ratios, the Monte Carlo permutation test showed that this model was highly significant (p < 0.001) and explained 86.70% of the total variation, indicating that all plant factors, soil environmental factors, and soil nutrient concentration factors had a significant impact on the SNS ratios (Mantel test r = 0.48, p < 0.001). Specifically, the first two axes of the RDA accounted for 70.66% of the total variation, and the first axis and the second axis were both significant (Monte Carlo permutation test, p < 0.001), accounting for 45.12% and 25.54% of the total variation, respectively (Figure 4C). From the biplot of the RDA (Figure 4C), obvious differences were observed in the SNS ratios between the shrub stage and the grass and mosaic stages along the first axis. A forward selection of the 13 factors in the RDA ordinations showed that nine factors, including the shrub relative cover and soil AP, AN, AK, ACa and AMg concentrations were significantly related to spatial variations in the SNS ratios (Monte Carlo permutation test, p < 0.01). The test of the variance inflation factors found that the soil OC, TN and TP concentrations, whose variance inflation factors (VIFs) were all higher than 10, should be removed. Finally, six significant factors were obtained. The results of the partial RDA for the SNS ratios showed that the soil AP, AN, shrub relative cover, and AK, ACa and AMg concentration explained 22.68%, 10.01%, 6.75%, 4.45%, 3.50%, 2.95%, and 36.36% of the total variation, respectively (Figure 4D). The soil AP concentration was thus identified as the most important factor influencing the SNS ratios.
For the RDA model of soil carbon storage, the test of the variance inflation factors found that one plant factor (shrub relative cover), one soil environmental factor (WC), six soil nutrient concentration factors (OC, TN, TP, AN, AP, and AK), and five stoichiometry ratios factors (OC:TP, AN:ACa, AN:AMg, AP:AK, and AP:AMg), whose variance inflation factors (VIF) were all higher than 10, should be removed. The RDA model was highly significant (Monte Carlo permutation test, p < 0.001) and explained 85.09% of the total variation, indicating that one plant factor (plant species diversity), two soil environmental factors (pH and BD), two soil nutrient concentration factors (ACa and AMg), and six stoichiometry ratio (OC:TN, TN:TP, OC:TN:TP, AN:AP, AN:AK, and AP:ACa) factors had a significant impact on the soil carbon storage (Mantel test r = 0.30, p < 0.01). A forward selection in the RDA ordinations showed that six factors, including the soil BD, pH, and the ratios of OC:TN, TN:TP, OC:TN:TP, and AP:ACa, were significantly related to spatial variations in the soil carbon storage (Monte Carlo permutation test, p < 0.05). The results of the partial RDA for the soil carbon storage showed that the soil BD, pH, and the ratios of OC:TN, TN:TP, OC:TN:TP, and AP:ACa explained 26.66%, 2.97%, 35.72%, 6.08%, 10.22%, and 6.12% of the total variation, respectively (Figure 4E). The soil OC:TN ratio and BD were thus identified as the first two important factors influencing the soil carbon storage.

4. Discussion

4.1. Responses of Soil Nutrients, Carbon Storage, and Stoichiometry to Shrub Encroachment

The conversion of grassland from grass to shrub dominance has numerous ecological consequences [4]. What is most obvious is that the plant functional types change from grasses to shrubs. Many studies have found that shrub encroachment increases soil OC [2,3,4,8,43,46,64,65,66,67], TN [2,29,46,67], TP [2,29], AN [68], AP [2,29], AK [29], and CS [2]. Our results (Figure 2D,F,L) supported these findings.
SE has a strong positive effect on soil WC (Figure 2B) and nutrients (Figure 2D,F,L) [68], especially on TP (Figure 2F). Since phosphorus (P) is the limiting element in the soil of subtropical China [69], we questioned the source of soil TP. We speculated that the increase of soil TP might originate from (1) the reduced leaching [70] and runoff [71,72], and (2) the enhanced soil retention ability with SE. Our data showed that SE converted more P into non-available P (Figure S1). AP included all water-soluble P and was easier to lose via leaching and runoff in a high-rainfall area, thus the higher percentage of non-available P with SE enhanced the soil P retention.
Jobbágy et al. [73] found that a shift in plant functional types (from grass to shrubs) significantly changed the vertical distribution of the soil OC. Our data also found that interactions between SE and the soil layer had a significant impact on soil nutrients (Table S1). A higher proportion of soil CS was stored in deeper layers with SE (Figure S2). Hence, these significant interactions appear to highlight the role of plant functional types.

4.2. SE in the Study Area May Not Indicate Land Degradation

In the past, natural SE was commonly considered to indicate the degradation of grassland [3,23,74], perhaps due to a reduction in the main ecosystem service—the livestock production provided by grassland, induced by SE [13,39], and the loss of plant species diversity [5,18]. However, recent global meta-analyses have highlighted that the commonly established link between SE and degradation is not universal [3,74]. Shrub establishment may even be an important step in the reversal of desertification processes in the Mediterranean region [74] and semi-arid sandy land [34]. Our data suggested that in the abandoned natural E. pallens grassland we were studying, soil resources (soil nutrients and water) and soil CS were improved by SE (Figure 2B,D,F,L). Moreover, taking the obviously increased above-ground biomass C [75] and decreased soil CO2 flux [19] into account, SE appears to result in a net ecosystem C gain [19] in the absence of any disturbance [8]. Therefore, SE in the abandoned natural E. pallens grassland may not indicate land degradation in terms of soil nutrition and CS. We cannot simply regard SE as evidence of land degradation.

4.3. The Main Factors Controlling Soil Nutrients Over Shrub Encroachment

Both biotic and abiotic factors are commonly invoked to explain changes in soil nutrients over shrub encroachment. Numerous studies have concluded that shrubs produced the effects of a fertile island [1,52,76], and that increased soil resources (soil moisture (Figure 2B) and nutrient content (Figure 2D,F,L), and increased organics [1,30,34,68,74]) are all associated with the presence of shrubs [1] instead of grass. Soil nutrients are enriched with shrubs via positive feedback in ‘islands of fertility’[22]. Additionally, shifts from grasses to shrubs alter the root depth. Grasses probably gain nutrients mainly from the surface soil layers, but shrubs may acquire some P from deeper soil layers [2], thus changing the soil nutrients. Shrubs improve the local micro-climate, reduce the wind velocity, retain dust and sand, increase the soil litter biomass and soil moisture, improve the soil texture, and help retain nutrients available to vascular plants [77]. Recent studies have reported that soil nutrient concentrations are also usually related to shrub size, cover, and age [2,22,78], with large shrubs and cover enriching soil nutrients. Soil total C, N, P and available P are correlated positively with shrub cover [2]. In our study, shrub relative cover and soil WC were the first two important factors affecting the soil nutrient concentrations (Figure 4C). The soil OC, AN, and TP concentrations increased with the shrub relative cover, and the soil OC, TN and AN concentration increased with the soil WC, while the soil TN, AP, AK, AMg and ACa concentrations decreased with the shrub relative cover, and the soil TP, AP, AK, AMg and ACa concentrations decreased with the soil WC (Figure 4B).

4.4. The Main Factors Changing Soil Nutrient Stoichiometry Over Shrub Encroachment

Although previous studies have found that the soil nutrient content can be affected by SE [3], whether SNS is affected by SE remains unclear [53]. Previous studies focused on restoration have found that the soil C:P and N:P ratios increased with the restoration age [46]. Additionally, the C:P and the C:N ratios in the soil increased along the succession [47]. Our data showed that SE produced different divergences in nutrient stoichiometry ratios (Figure 4B).
Previous studies have also found that fertile islands have a significant influence on SNS ratios [52,53]. Our study found that soil available N, P, K, Ca and Mg, rather than the total N and P concentrations, were the most important factors influencing SNS ratios.
The recent study clearly suggests that the effect of shrub islands on soil C:N:P stoichiometric ratios was dependent on shrub species and size [53]. The increase in the stoichiometric ratio followed an identical pattern among the shrub species as the shrub size increased. There were always higher soil C:P and N:P ratios beneath a special shrub species than under the other shrub species with the same plant size. Our study showed that an increasing shrub relative cover could increase SNS ratios, except for the OC:TN:TP and TN:TP ratios, and decrease the OC:TN:TP and TN:TP ratios.

4.5. The Main Factors Controlling Soil Carbon Storage over Shrub Encroachment

We grouped the underlying mechanisms of SE control over the soil carbon storage into four pathways that can operate simultaneously:
(a)
Recent studies from both the laboratory and field indicated that nutrients or inorganic nutrients are a hidden cost for sequestering soil C [79,80,81], underscoring the constraining role of nutrients [82,83,84,85], especially available nutrients [79,81,84,86,87] in carbon gains in the soil [81,82,84,88], plants [83,89], regional [84,89], and global levels [82]. Our data found that N was not limited [90] in this land, as the OC:TN ratio in the grass (3.3), mosaic (4.5), and shrub (6.5) stage soils were lower than the value of 11.8 in global grassland soils [90]. However, the OC:TP ratio in the grass (400.7), mosaic (402.6), and shrub (592.3) stage soils were higher than the value of 64.3 in global grassland soils [90], indicating a P limitation in our study land. The soil OC concentration and CS increased with SE and was apparently not limited by the shortage of P, perhaps because a higher proportion of P was stored in the deeper layer (Figure S3), so the P limitation was reduced in the deeper soil layers (Figure 3B). This benefited shrubs, which have deeper roots. Furthermore, SE enhanced the proportion distribution pattern of the P storage (Figure S3). Therefore, SE could reduce nutrient limitation and promote soil carbon sequestration [2].
(b)
The traits of encroaching plants determine the functional outcome of encroachment [3]. Changes in soil C cycles might be impacted by vegetation types via differences in litter or root quality [91] and productivity. On the one hand, about 70% of the net primary productivity (NPP) of the natural ecosystem returns to the soil through litter [64], and SE increased the NPP [19], as a result of which the litter productivity increased. On the other hand, the accumulation of OC increased with the decrease in the C/N ratio of the litter [92], and shrub litter had a lower C/N ratio than grass [64,93]. The litter traits of shrubs were thus more conducive to the accumulation of soil OC than of that of grass.
(c)
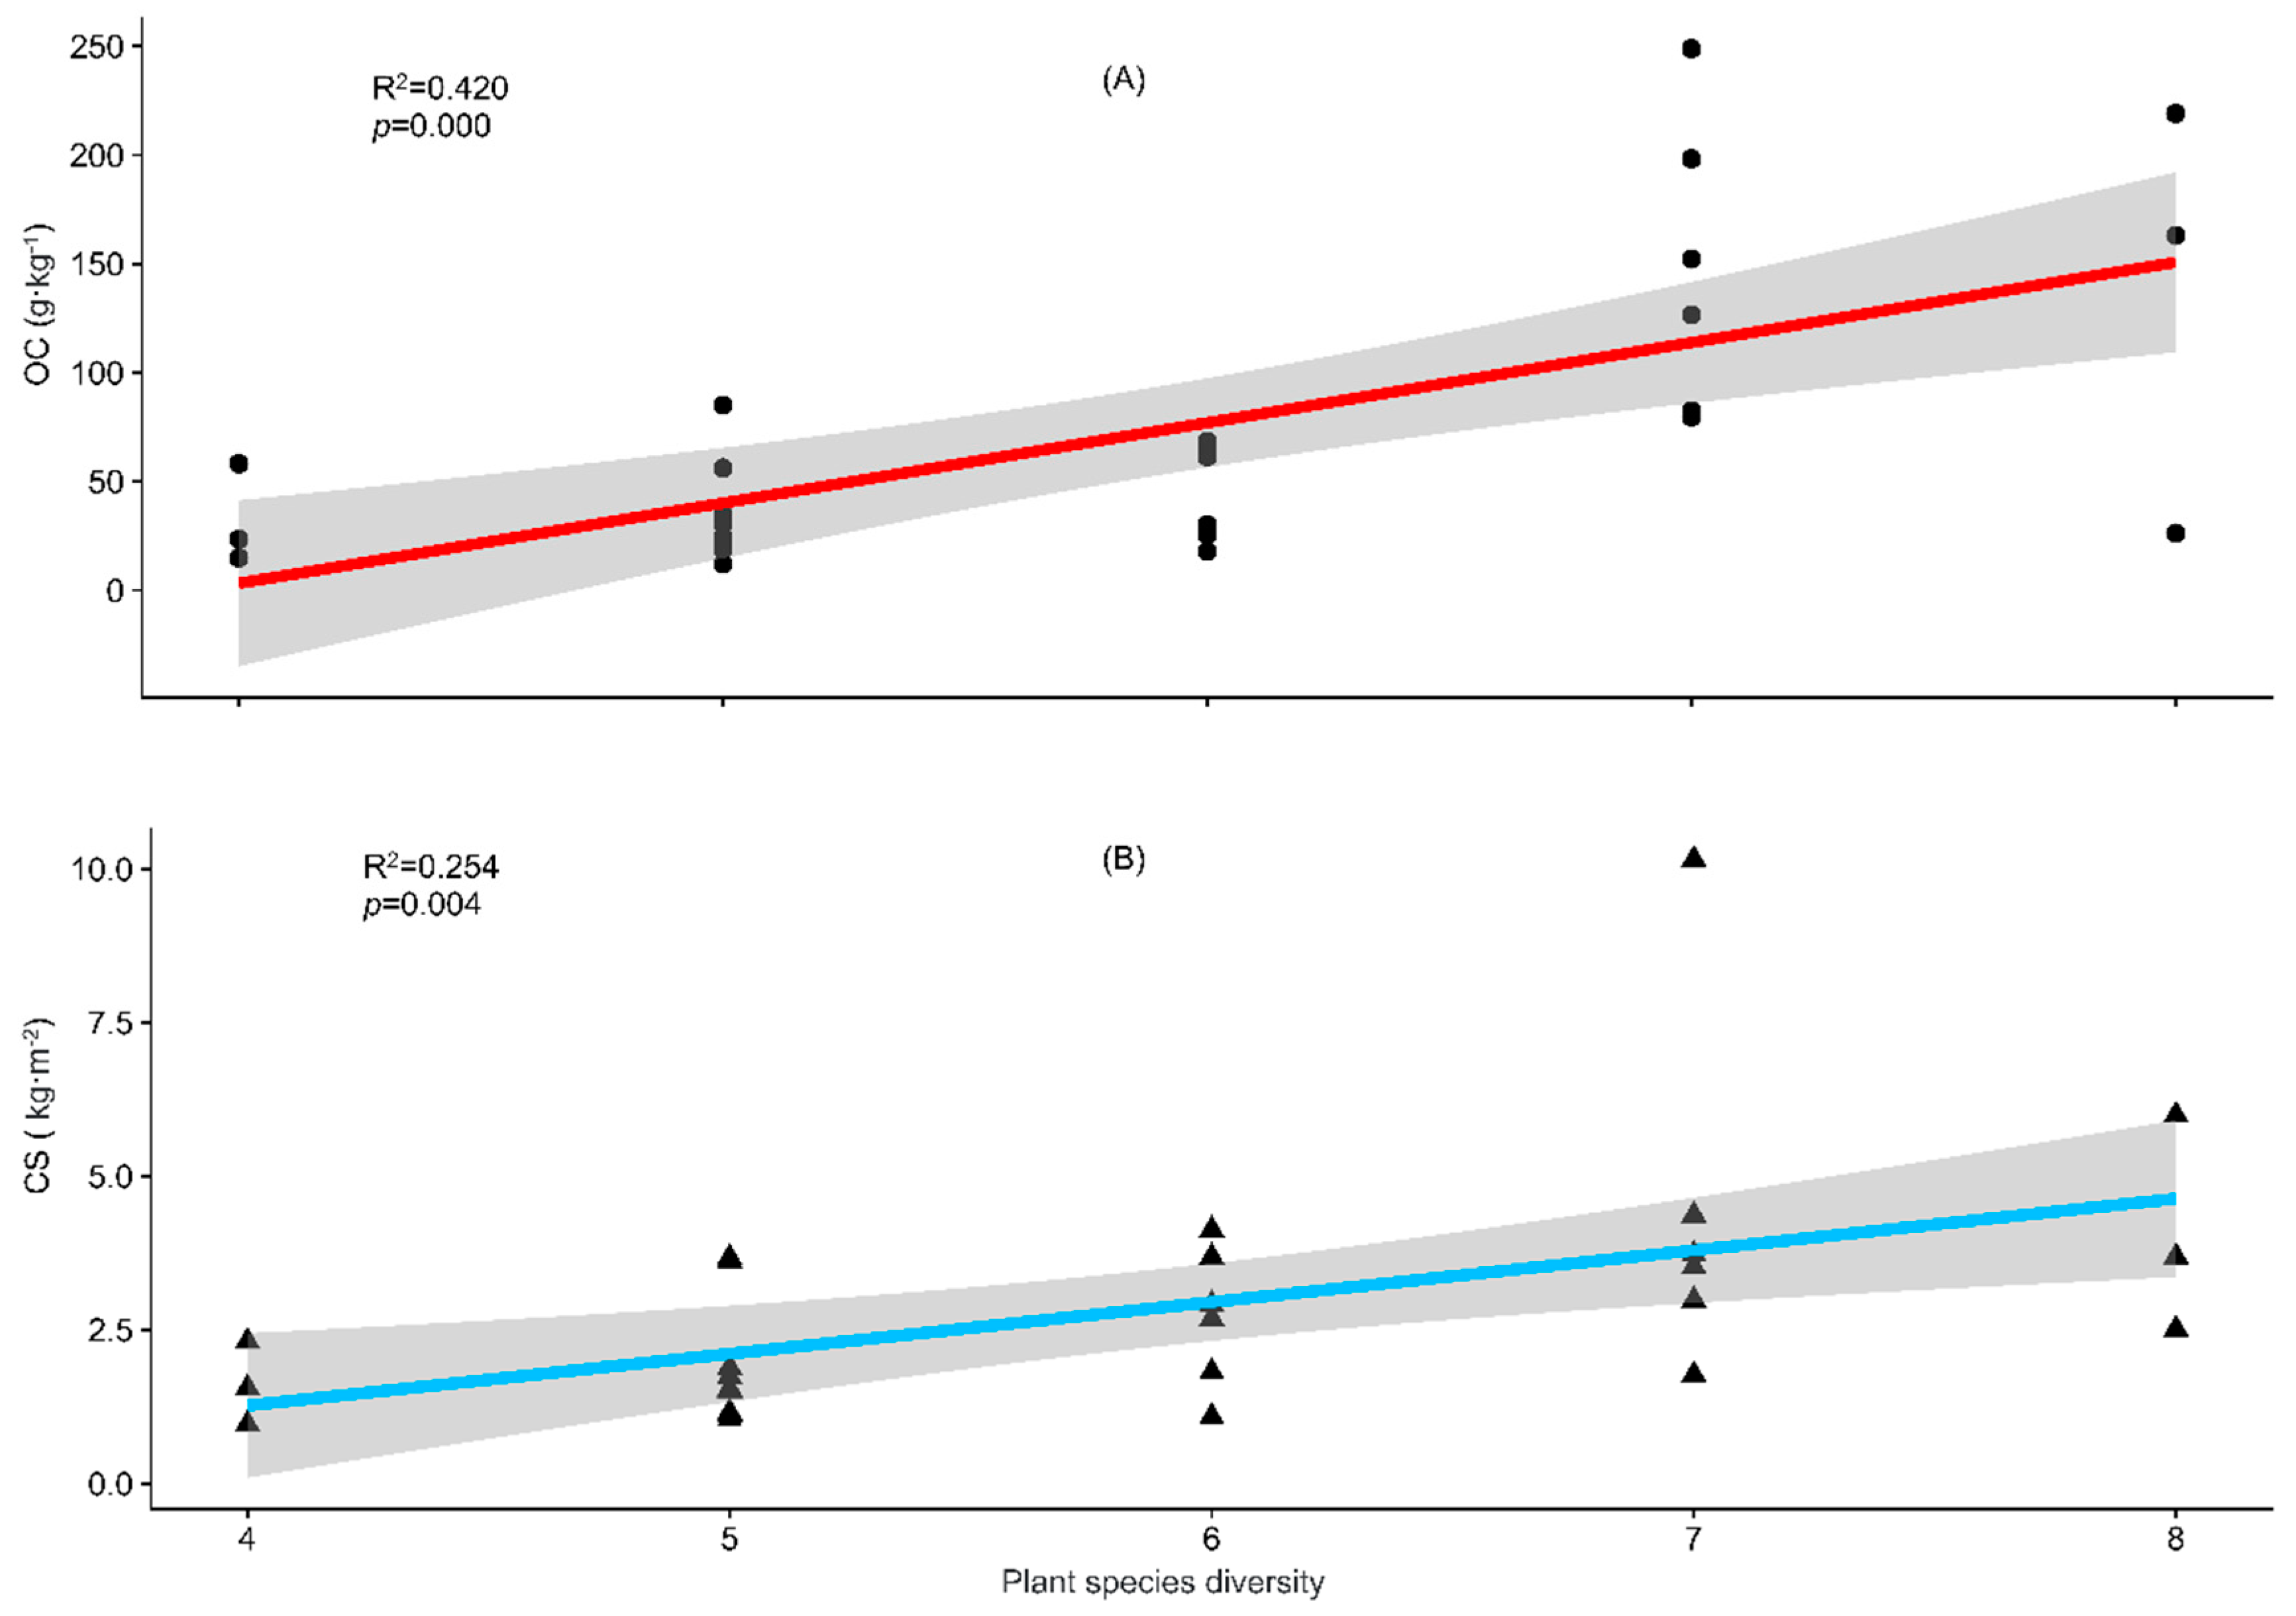
Recent studies have found that a higher plant diversity leads to a greater soil CS [94,95]. Our regression analysis showed that the increasing plant species diversity significantly increased the soil OC concentration and CS (Figure 5), so our results supported this pathway only in terms of the plant species diversity.
(d)
Here, for the first time, we integrated the plant factors, soil environment factors, and soil nutrition factors and stoichiometry ratios in order to explore the driving factors of soil carbon storage over shrub encroachment. Our RDA model showed that the soil stoichiometry ratios (OC:TN, TN:TP, OC:TN:TP, AP:ACa) and soil environment factors (BD and pH) explained 87.78% of the total variation of the soil carbon storage (Figure 4E). The plant factors, especially the plant species diversity, and the soil nutrition factors were not as important as we expected. Instead, the soil stoichiometry ratios and soil environment factors were the first two important factors that influenced the soil carbon storage. Our results supported a new pathway of SE control over soil carbon storage.

5. Conclusions

It is critical to analyse soil nutrients and stoichiometry with plant encroachment in specific ecosystems. This study demonstrated the mainly positive effect of SE on the soil nutrient concentration, and the complex effect on soil stoichiometry, in abandoned natural E. pallens grassland. The results showed that SE did not produce serious soil acidification, but significantly changed the soil environment and nutrient concentration. SE significantly improved soil OC and TP concentrations in all layers, changed soil stoichiometry, and in particular improved the stoichiometry ratio of soil OC:TN in all layers. OC storage tended to increase with SE. The shrub relative cover and soil WC explained 55.26% of the total variation of the soil nutrient concentration. The soil available nutrient concentration (AP, AN, AK, ACa and AMg concentration) and shrub relative cover explained 79.10% of the total variation of the soil stoichiometry ratios. The soil stoichiometry ratios (OC:TN, TN:TP, OC:TN:TP and AP:ACa) and soil environment factors (BD and pH) explained 87.78% of the total variation of the soil carbon storage. Our study provides insights to support an improved understanding of SE in grassland from the perspectives of soil nutrition and stoichiometry, and suggests that SE does not indicate the degradation of grassland. In terms of increasing the soil nutrient concentration and CS, the shrub relative cover and soil WC were the most important factors affecting the soil nutrient concentration and soil available nutrient concentration (AP, AN, AK, ACa and AMg concentration), and the shrub relative cover was the most important factor influencing the SNS ratios. The soil stoichiometry ratios (OC:TN, TN:TP, OC:TN:TP and AP:ACa) and soil environment factors (BD and pH) were the first two important factors influencing the soil carbon storage.

Supplementary Materials

The following are available online at https://www.mdpi.com/2071-1050/11/6/1732/s1. Table S1. Interactions and significance effects of shrub encroachment (SE) and soil layers on soil nutrition, C storage, and stoichiometry. Figure S1. Proportion of soil available and total nutrients with different shrub encroachment (SE) stages. Figure S2. Proportional distribution of soil organic carbon storage (CS) at the soil layers (0–5 and 5–20 cm) with shrub encroachment. Figure S3. Proportional distribution of soil total phosphorus (TP) storage at the soil layers (0–5 and 5–20 cm) with shrub encroachment.

Author Contributions

All the authors contributed to this manuscript. Conceptualization, P.W.; Methodology, P.W.; Funding Acquisition, P.W.; Project administration, P.W., W.Z., L.D.; Investigation, P.W., L.D., W.Z., Y.Z., S.L., X.W., X.C., Y.J.Z. and F.Y.; Formal Analysis, L.D.; Writing-Original Draft Preparation, L.D.; Writing-Review & Editing, P.W., L.D., W.Z., Y.Z., S.L., X.W., X.C., Y.J.Z. and F.Y.; Visualization, L.D.; Supervision, P.W.

Funding

This research was funded by the China National Natural Science Foundation (31602005), Key project of Guizhou Province Natural Science Foundation (Foundation of Guizhou Science [2018]1419), Youth Fund of Guizhou Academy of Agricultural Sciences (Qiannongkeyuanqingnianjijin[2018]12), and Science and Technology Innovation Talent Team Construction Project (Guizhou Kehe Platform Talents [2016]5617).

Acknowledgments

We thank Elaine Monaghan, BSc (Econ), from Liwen Bianji, Edanz Editing China, for editing the English text of a draft of this manuscript. We also thank any reviewer and editor for substantially improving this manuscript.

Conflicts of Interest

The authors declare no conflicts of interest.

References

  1. Saixiyala; Yang, D.; Zhang, S.; Liu, G.; Yang, X.; Huang, Z.; Ye, X. Facilitation by a Spiny Shrub on a Rhizomatous Clonal Herbaceous in Thicketization-Grassland in Northern China: Increased Soil Resources or Shelter from Herbivores. Front. Plant Sci. 2017, 8, 809. [Google Scholar] [CrossRef] [PubMed]
  2. Blaser, W.J.; Shanungu, G.K.; Edwards, P.J.; Olde Venterink, H. Woody encroachment reduces nutrient limitation and promotes soil carbon sequestration. Ecol. Evol. 2014, 4, 1423–1438. [Google Scholar] [CrossRef] [PubMed] [Green Version]
  3. Eldridge, D.J.; Bowker, M.A.; Maestre, F.T.; Roger, E.; Reynolds, J.F.; Whitford, W.G. Impacts of shrub encroachment on ecosystem structure and functioning: Towards a global synthesis. Ecol. Lett. 2011, 14, 709–722. [Google Scholar] [CrossRef] [PubMed]
  4. Du, B.M.; Ji, H.W.; Peng, C.; Liu, X.J.; Liu, C.J. Altitudinal patterns of leaf stoichiometry and nutrient resorption in Quercus variabilis in the Baotianman Mountains, China. Plant Soil 2016, 413, 193–202. [Google Scholar] [CrossRef]
  5. Ratajczak, Z.; Nippert, J.B.; Collins, S.L. Woody encroachment decreases diversity across North American grasslands and savannas. Ecology 2012, 93, 697–703. [Google Scholar] [CrossRef] [PubMed] [Green Version]
  6. Stevens, N.; Lehmann, C.E.; Murphy, B.P.; Durigan, G. Savanna woody encroachment is widespread across three continents. Glob. Chang. Biol. 2017, 23, 235–244. [Google Scholar] [CrossRef]
  7. Wigley, B.J.; Bond, W.J.; Hoffman, M.T. Thicket expansion in a South African savanna under divergent land use: Local vs. global drivers? Glob. Chang. Biol. 2010, 16, 964–976. [Google Scholar] [CrossRef]
  8. Barger, N.N.; Archer, S.R.; Campbell, J.L.; Huang, C.-Y.; Morton, J.A.; Knapp, A.K. Woody plant proliferation in North American drylands: A synthesis of impacts on ecosystem carbon balance. J. Geophys. Res. 2011, 116. [Google Scholar] [CrossRef]
  9. Morgan, J.A.; Milchunas, D.G.; LeCain, D.R.; West, M.; Mosier, A.R. Carbon dioxide enrichment alters plant community structure and accelerates shrub growth in the shortgrass steppe. Proc. Natl. Acad. Sci. USA 2007, 104, 14724–14729. [Google Scholar] [CrossRef] [Green Version]
  10. Throop, H.L.; Lajtha, K.; Kramer, M. Density fractionation and 13C reveal changes in soil carbon following woody encroachment in a desert ecosystem. Biogeochemistry 2013, 112, 409–422. [Google Scholar] [CrossRef]
  11. Soliveres, S.; Maestre, F.T.; Eldridge, D.J.; Delgado-Baquerizo, M.; Quero, J.L.; Bowker, M.A.; Gallardo, A. Plant diversity and ecosystem multifunctionality peak at intermediate levels of woody cover in global drylands. Glob. Ecol. Biogeogr. A J. Macroecol. 2014, 23, 1408–1416. [Google Scholar] [CrossRef] [PubMed] [Green Version]
  12. Kulmatiski, A.; Beard, K.H. Woody plant encroachment facilitated by increased precipitation intensity. Nat. Clim. Chang. 2013, 3, 833–837. [Google Scholar] [CrossRef]
  13. Anadon, J.D.; Sala, O.E.; Turner, B.L., II; Bennett, E.M. Effect of woody-plant encroachment on livestock production in North and South America. Proc. Natl. Acad. Sci. USA 2014, 111, 12948–12953. [Google Scholar] [CrossRef] [PubMed] [Green Version]
  14. Dalle, G.; Maass, B.L.; Isselstein, J. Encroachment of woody plants and its impact on pastoral livestock production in the Borana lowlands, southern Oromia, Ethiopia. Afr. J. Ecol. 2006, 44, 237–246. [Google Scholar] [CrossRef]
  15. Blaum, N.; Rossmanith, E.; Popp, A.; Jeltsch, F. Shrub encroachment affects mammalian carnivore abundance and species richness in semiarid rangelands. Acta Oecol. 2007, 31, 86–92. [Google Scholar] [CrossRef]
  16. Brandt, J.S.; Haynes, M.A.; Kuemmerle, T.; Waller, D.M.; Radeloff, V.C. Regime shift on the roof of the world: Alpine meadows converting to shrublands in the southern Himalayas. Biol. Conserv. 2013, 158, 116–127. [Google Scholar] [CrossRef]
  17. Koch, B.; Edwards, P.J.; Blanckenhorn, W.U.; Walter, T.; Hofer, G. Shrub encroachment affects the diversity of plants, butterflies, and grasshoppers on two swiss subalpine pastures. Arct. Antarct. Alp. Res. 2015, 47, 345–357. [Google Scholar] [CrossRef]
  18. Hector, A.; Báez, S.; Collins, S.L. Shrub invasion decreases diversity and alters community stability in Northern Chihuahuan Desert plant communities. PLoS ONE 2008, 3, e2332. [Google Scholar]
  19. Lett, M.S.; Knapp, A.K.; Briggs, J.M.; Blair, J.M. Influence of shrub encroachment on aboveground net primary productivity and carbon and nitrogen pools in a mesic grassland. Can. J. Bot. 2004, 82, 1363–1370. [Google Scholar] [CrossRef]
  20. Grace, J.; Jose, J.S.; Meir, P.; Miranda, H.S.; Montes, R.A. Productivity and carbon fluxes of tropical savannas. J. Biogeogr. 2006, 33, 387–400. [Google Scholar] [CrossRef]
  21. Du Toit, J.; Kock, R.; Deutsch, J. Wild Rangelands: Conserving Wildlife WhileMaintaining Livestock in Semi-Arid Ecosystems; Blackwell Publishing Ltd.: Oxford, UK, 2010. [Google Scholar]
  22. Ward, D.; Trinogga, J.; Wiegand, K.; Du Toit, J.; Okubamichael, D.; Reinsch, S.; Schleicher, J. Large shrubs increase soil nutrients in a semi-arid savanna. Geoderma 2018, 310, 153–162. [Google Scholar] [CrossRef]
  23. Ridolfi, L.; Laio, F.; D’Odorico, P. Fertility Island Formation and Evolution in Dryland Ecosystems. Ecol. Soc. 2008, 13, 5. [Google Scholar] [CrossRef]
  24. Guidi, C.; Vesterdal, L.; Gianelle, D.; Rodeghiero, M. Changes in soil organic carbon and nitrogen following forest expansion on grassland in the Southern Alps. For. Ecol. Manag. 2014, 328, 103–116. [Google Scholar] [CrossRef]
  25. Qiu, L.; Wei, X.; Zhang, X.; Cheng, J.; Gale, W.; Guo, C.; Long, T. Soil organic carbon losses due to land use change in a semiarid grassland. Plant Soil 2012, 355, 299–309. [Google Scholar] [CrossRef]
  26. Alberti, G.; Leronni, V.; Piazzi, M.; Petrella, F.; Mairota, P.; Peressotti, A.; Piussi, P.; Valentini, R.; Gristina, L.; La Mantia, T.; et al. Impact of woody encroachment on soil organic carbon and nitrogen in abandoned agricultural lands along a rainfall gradient in Italy. Reg. Environ. Chang. 2011, 11, 917–924. [Google Scholar] [CrossRef] [Green Version]
  27. Jackson, R.B.; Banner, J.L.; Jobbágy, E.G.; Pockman, W.T.; Wall, D.H. Ecosystem carbon loss with woody plant invasion of grasslands. Nature 2002, 418, 623–626. [Google Scholar] [CrossRef]
  28. Gómez-Rey, M.X.; Madeira, M.; Gonzalez-Prieto, S.J.; Coutinho, J. Soil C and N dynamics in a Mediterranean oak woodland with shrub encroachment. Plant Soil 2013, 371, 339–354. [Google Scholar] [CrossRef] [Green Version]
  29. Hagos, M.G.; Smit, G.N. Soil enrichment by Acacia mellifera subsp. detinens on nutrient poor sandy soil in a semi-arid southern African savanna. J. Arid Environ. 2005, 61, 47–59. [Google Scholar] [CrossRef]
  30. Dong, X.W.; Zhang, X.K.; Bao, X.L.; Wang, J.K. Spatial distribution of soil nutrients after the establishment of sand-fixing shrubs on sand dune. Plant Soil Environ. 2009, 55, 288–294. [Google Scholar] [CrossRef] [Green Version]
  31. Throop, H.L.; Archer, S.R. Shrub (Prosopis velutina) encroachment in a semidesert grassland: Spatial-temporal changes in soil organic carbon and nitrogen pools. Glob. Chang. Biol. 2008, 14, 2420–2431. [Google Scholar] [CrossRef]
  32. Mills, A.; Fey, M. Transformation of thicket to savanna reduces soil quality in the Eastern Cape, South Africa. Plant Soil 2004, 265, 153–163. [Google Scholar] [CrossRef]
  33. McKinley, D.C.; Blair, J.M. Woody Plant Encroachment by Juniperus virginiana in a Mesic Native Grassland Promotes Rapid Carbon and Nitrogen Accrual. Ecosystems 2008, 11, 454–468. [Google Scholar] [CrossRef]
  34. Su, Y.Z.; Zhao, H.L.; Li, Y.L.; Cui, J.Y. Influencing Mechanisms of Several Shrubs on Soil Chemical Properties in Semiarid Horqin Sandy Land, China. Arid Land Res. Manag. 2004, 18, 251–263. [Google Scholar] [CrossRef]
  35. Zhao, H.-L.; Zhou, R.-L.; Su, Y.-Z.; Zhang, H.; Zhao, L.-Y.; Drake, S. Shrub facilitation of desert land restoration in the Horqin Sand Land of Inner Mongolia. Ecol. Eng. 2007, 31, 1–8. [Google Scholar] [CrossRef]
  36. Gazol, A.; Tamme, R.; Takkis, K.; Kasari, L.; Saar, L.; Helm, A.; Pärtel, M. Landscape- and small-scale determinants of grassland species diversity: Direct and indirect influences. Ecography 2012, 35, 944–951. [Google Scholar] [CrossRef]
  37. Briggs, J.M.; Knapp, A.K.; Blair, J.M.; Heisler, J.L.; Hoch, G.A.; Lett, M.S.; Mccarron, J.K. An ecosystem in transition: Causes and consequences of the conversion of mesic grassland to shrubland. Bioscience 2005, 55, 243–254. [Google Scholar] [CrossRef]
  38. Buitenwerf, R.; Bond, W.J.; Stevens, N.; Trollope, W.S.W. Increased tree densities in South African savannas: >50 years of data suggests CO2 as a driver. Glob. Chang. Biol. 2012, 18, 675–684. [Google Scholar] [CrossRef]
  39. Cabral, A.C.; Miguel, J.M.; Rescia, A.J.; Schmitz, M.F.; Pineda, F.D. Shrub encroachment in argentinean savannas. J. Veg. Sci. 2010, 14, 145–152. [Google Scholar] [CrossRef]
  40. Asner, G.P.; Mosier, A.R. Effects of Woody Vegetation Encroachment on Soil Nitrogen Oxide Emissions in a Temperate Savanna. Ecol. Appl. 2003, 13, 897–910. [Google Scholar]
  41. Chen, L.; Li, H.; Zhang, P.; Zhao, X.; Zhou, L.; Liu, T.; Hu, H.; Bai, Y.; Shen, H.; Fang, J. Climate and native grassland vegetation as drivers of the community structures of shrub-encroached grasslands in Inner Mongolia, China. Landsc. Ecol. 2014, 30, 1627–1641. [Google Scholar] [CrossRef]
  42. Lett, M.S.; Knapp, K.A. Consequences of Shrub Expansion in Mesic Grassland: Resource Alterations and Graminoid Responses. J. Veg. Sci. 2003, 14, 487–496. [Google Scholar] [CrossRef]
  43. Li, H.; Shen, H.; Chen, L.; Liu, T.; Hu, H.; Zhao, X.; Zhou, L.; Zhang, P.; Fang, J. Effects of shrub encroachment on soil organic carbon in global grasslands. Sci. Rep. 2016, 6, 28974. [Google Scholar] [CrossRef] [Green Version]
  44. Jiao, F.; Wen, Z.M.; An, S.S.; Yuan, Z. Successional changes in soil stoichiometry after land abandonment in Loess Plateau, China. Ecol. Eng. 2013, 58, 249–254. [Google Scholar] [CrossRef]
  45. Zhang, W.; Zhao, J.; Pan, F.; Li, D.; Chen, H.; Wang, K. Changes in nitrogen and phosphorus limitation during secondary succession in a karst region in southwest china. Plant Soil 2015, 391, 77–91. [Google Scholar] [CrossRef]
  46. Zeng, Q.; Liu, Y.; Fang, Y.; Ma, R.; Lal, R.; An, S.; Huang, Y. Impact of vegetation restoration on plants and soil C:N:P stoichiometry on the Yunwu Mountain Reserve of China. Ecol. Eng. 2017, 109, 92–100. [Google Scholar] [CrossRef]
  47. Urbina, I.; Grau, O.; Sardans, J.; Ninot, J.; Penuelas, J. Plant-soil stoichiometric changes along the succession from subalpine grasslands to shrublands in the Pyrenees. Geophys. Res. Abstr. 2018, 20, 19126. [Google Scholar]
  48. Bui, E.N.; Henderson, B.L. C:N:P stoichiometry in Australian soils with respect to vegetation and environmental factors. Plant Soil 2013, 373, 553–568. [Google Scholar] [CrossRef]
  49. Hu, C.; Li, F.; Xie, Y.H.; Deng, Z.M.; Chen, X.S. Soil carbon, nitrogen, and phosphorus stoichiometry of three dominant plant communities distributed along a small-scale elevation gradient in the East Dongting Lake. Phys. Chem. Earth Parts A/B/C 2017, 103, 28–34. [Google Scholar] [CrossRef]
  50. Yong, Z.; Boutton, T.W.; Ben, W.X. Soil c:n:p stoichiometry responds to vegetation change from grassland to woodland. Biogeochemistry 2018, 140, 341–357. [Google Scholar]
  51. Song, Z.; Liu, H.; Zhao, F.; Xu, C. Ecological stoichiometry of N:P:Si in China’s grasslands. Plant Soil 2014, 380, 165–179. [Google Scholar] [CrossRef]
  52. Rong, Q.; Liu, J.; Cai, Y.; Lu, Z.; Zhao, Z.; Yue, W.; Xia, J. “Fertile island” effects of Tamarix chinensis Lour. on soil N and P stoichiometry in the coastal wetland of Laizhou Bay, China. J. Soils Sediments 2016, 16, 864–877. [Google Scholar] [CrossRef]
  53. Feng, D.; Bao, W. Shrub encroachment alters topsoil C:N:P stoichiometric ratios in a high-altitude forest cutover. Iforest Biogeosci. For. 2018, 11, 594–599. [Google Scholar] [CrossRef]
  54. Schwob, G.; Roy, M.; Manzi, S.; Pommier, T.; Fernandez, M.P. Green alder (Alnus viridis) encroachment shapes microbial communities in subalpine soils and impacts its bacterial or fungal symbionts differently. Environ. Microbiol. 2017, 19, 3235–3250. [Google Scholar] [CrossRef]
  55. Forestry, G.A.O. Classification and Code of Guizhou Vascular Plants. Available online: http://gzslky.freetable.cn/index.php?m=Index&c=Content&a=index&cid=31&aid=329 (accessed on 27 January 2018).
  56. Flora of China Editorial Committee. Flora of China; Science Press & Missouri Botanical Garden Press: Beijing, China; St. Louis, MO, USA, 2006; Volume 22, pp. 1–733. [Google Scholar]
  57. Walker, L.R.; Wardle, D.A.; Bardgett, R.D.; Clarkson, B.D. The use of chronosequences in studies of ecological succession and soil development. J. Ecol. 2010, 98, 725–736. [Google Scholar] [CrossRef] [Green Version]
  58. Hu, P.-L.; Liu, S.-J.; Ye, Y.-Y.; Zhang, W.; Wang, K.-L.; Su, Y.-R. Effects of environmental factors on soil organic carbon under natural or managed vegetation restoration. Land Degrad. Dev. 2018, 29, 387–397. [Google Scholar] [CrossRef]
  59. Belay, L.; Kebede, F. The Impact of Woody Plants Encroachment on Soil Organic Carbon and Total Nitrogen Stocks in Yabello District, Borana Zone, Southern Ethiopia. J. Drylands 2010, 3, 234–240. [Google Scholar]
  60. Bao, D.S. Soil and Agricultural Chemistry Analysis, 3rd ed.; China Agriculture Press: Beijing, China, 2000. [Google Scholar]
  61. Liu, Y.; Dang, Z.-Q.; Tian, F.-P.; Wang, D.; Wu, G.-L. Soil Organic Carbon and Inorganic Carbon Accumulation Along a 30-year Grassland Restoration Chronosequence in Semi-arid Regions (China). Land Degrad. Dev. 2017, 28, 189–198. [Google Scholar] [CrossRef]
  62. Liu, X.; Ma, J.; Ma, Z.-W.; Li, L.-H. Soil nutrient contents and stoichiometry as affected by land-use in an agro-pastoral region of northwest China. Catena 2017, 150, 146–153. [Google Scholar] [CrossRef]
  63. SPSS. SPSS Two Way ANOVA—Basics Tutorial. Available online: https://www.spss-tutorials.com/spss-two-way-anova-basics-tutorial/ (accessed on 2 February 2018).
  64. Liu, S.; Zhang, W.; Wang, K.; Pan, F.; Yang, S.; Shu, S. Factors controlling accumulation of soil organic carbon along vegetation succession in a typical karst region in Southwest China. Sci. Total Environ. 2015, 521–522, 52–58. [Google Scholar] [CrossRef]
  65. Mcculley, R.L.; Archer, S.R.; Boutton, T.W.; Hons, F.M.; Zuberer, D.A. Soil respiration and nutrient cycling in wooded communities developing in grassland. Ecology 2004, 85, 2804–2817. [Google Scholar] [CrossRef]
  66. Lal, R. Soil carbon sequestration impacts on global climate change and food security. Science 2004, 304, 1623–1627. [Google Scholar] [CrossRef]
  67. Chen, H.; Zhang, W.; Wang, K.; Hou, Y. Soil organic carbon and total nitrogen as affected by land use types in karst and non-karst areas of northwest Guangxi, China. J. Sci. Food Agric. 2011, 92, 1086–1093. [Google Scholar] [CrossRef]
  68. Schade, J.D.; Hobbie, S.E. Spatial and temporal variation in islands of fertility in the Sonoran Desert. Biogeochemistry 2005, 73, 541–553. [Google Scholar] [CrossRef]
  69. Yu, Z.P.; Wang, M.H.; Huang, Z.Q.; Lin, T.C.; Vadeboncoeur, M.A.; Searle, E.B.; Chen, H.Y.H. Temporal changes in soil c-n-p stoichiometry over the past 60 years across subtropical china. Glob. Chang. Biol. 2017, 24, 1308–1320. [Google Scholar] [CrossRef]
  70. Nidzgorski, D.A.; Hobbie, S.E. Urban trees reduce nutrient leaching to groundwater. Ecol. Appl. A Publ. Ecol. Soc. Am. 2016, 26, 1566–1580. [Google Scholar] [CrossRef]
  71. Qiao, L.; Zou, C.B.; Stebler, E.; Will, R.E. Woody plant encroachment reduces annual runoff and shifts runoff mechanisms in the tallgrass prairie, USA. Water Resour. Res. 2017, 4838. [Google Scholar] [CrossRef]
  72. Hobbie, S.E.; Finlay, J.C.; Janke, B.D.; Nidzgorski, D.A.; Millet, D.B.; Baker, L.A. Contrasting nitrogen and phosphorus budgets in urban watersheds and implications for managing urban water pollution. Proc. Natl. Acad. Sci. USA 2017, 114, 4177–4182. [Google Scholar] [CrossRef] [Green Version]
  73. Jobbágy; Esteban, G.; Jackson, R.B. The vertical distribution of soil organic carbon and its relation to climate and vegetation. Ecol. Appl. 2000, 10, 423–436. [Google Scholar]
  74. Maestre, F.T.; Bowker, M.A.; Puche, M.D.; Belen Hinojosa, M.; Martinez, I.; Garcia-Palacios, P.; Castillo, A.P.; Soliveres, S.; Luzuriaga, A.L.; Sanchez, A.M.; et al. Shrub encroachment can reverse desertification in semi-arid Mediterranean grasslands. Ecol. Lett. 2009, 12, 930–941. [Google Scholar] [CrossRef]
  75. Knapp, A.K.; Briggs, J.M.; Collins, S.L.; Archer, S.R.; Bret-Harte, M.S.; Ewers, B.E.; Peters, D.P.; Young, D.R.; Shaver, G.R.; Pendall, E.; et al. Shrub encroachment in North American grasslands: Shifts in growth form dominance rapidly alters control of ecosystem carbon inputs. Glob. Chang. Biol. 2008, 14, 615–623. [Google Scholar] [CrossRef]
  76. Schlesinger, W.H.; Pilmanis, A.M. Plant-Soil Interactions in Deserts. Biogeochemistry 1998, 42, 169–187. [Google Scholar] [CrossRef]
  77. Zhao, H.L.; Liu, R.T. The “bug island” effect of shrubs and its formation mechanism in Horqin Sand Land, Inner Mongolia. Catena 2013, 105, 69–74. [Google Scholar] [CrossRef]
  78. Qu, L.; Wang, Z.; Huang, Y.; Zhang, Y.; Song, C.; Ma, K. Effects of plant coverage on shrub fertile islands in the upper minjiang river valley. Sci. China Life Sci. 2018, 61, 340–347. [Google Scholar] [CrossRef] [PubMed]
  79. Richardson, A.E.; Kirkby, C.A.; Banerjee, S.; Kirkegaard, J.A. The inorganic nutrient cost of building soil carbon. Carbon Manag. 2014, 5, 265–268. [Google Scholar] [CrossRef]
  80. Kirkby, C.A.; Richardson, A.E.; Wade, L.J.; Batten, G.D.; Blanchard, C.; Kirkegaard, J.A. Carbon-nutrient stoichiometry to increase soil carbon sequestration. Soil Biol. Biochem. 2013, 60, 77–86. [Google Scholar] [CrossRef]
  81. Kirkby, C.A.; Richardson, A.E.; Wade, L.J.; Conyers, M.; Kirkegaard, J.A. Inorganic Nutrients Increase Humification Efficiency and C-Sequestration in an Annually Cropped Soil. PLoS ONE 2016, 11, e0153698. [Google Scholar] [CrossRef] [PubMed]
  82. van Groenigen, J.W.; van Kessel, C.; Hungate, B.A.; Oenema, O.; Powlson, D.S.; van Groenigen, K.J. Sequestering soil organic carbon: A nitrogen dilemma. Environ. Sci. Technol. 2017, 51, 4738–4739. [Google Scholar] [CrossRef] [PubMed]
  83. Oren, R.; Ellsworth, D.S.; Johnsen, K.H.; Phillips, N.; Ewers, B.E.; Maier, C.; Schäfer, K.V.R.; McCarthy, H.; Hendrey, G.; McNulty, S.G.; et al. Soil fertility limits carbon sequestration by forest ecosystems in a CO2-enriched atmosphere. Nature 2001, 411, 469–472. [Google Scholar] [CrossRef] [PubMed]
  84. Van Groenigen, K.J.; Six, J.; Hungate, B.A.; de Graaff, M.A.; van Breemen, N.; van Kessel, C. Element interactions limit soil carbon storage. Proc. Natl. Acad. Sci. USA 2006, 103, 6571–6574. [Google Scholar] [CrossRef] [Green Version]
  85. Chen, R.; Senbayram, M.; Blagodatsky, S.; Myachina, O.; Dittert, K.; Lin, X.; Blagodatskaya, E.; Kuzyakov, Y. Soil C and N availability determine the priming effect: Microbial N mining and stoichiometric decomposition theories. Glob. Chang. Biol. 2014, 20, 2356–2367. [Google Scholar] [CrossRef]
  86. Gosling, P.; van der Gast, C.; Bending, G.D. Converting highly productive arable cropland in Europe to grassland: -a poor candidate for carbon sequestration. Sci. Rep. 2017, 7, 10493. [Google Scholar] [CrossRef] [PubMed]
  87. Hartman, W.H.; Ye, R.Z.; Horwath, W.R.; Tringe, S.G. A genomic perspective on stoichiometric regulation of soil carbon cycling. ISME J. 2017, 11, 2652–2665. [Google Scholar] [CrossRef] [PubMed] [Green Version]
  88. Kirkby, C.A.; Richardson, A.E.; Wade, L.J.; Passioura, J.B.; Batten, G.D.; Blanchard, C.; Kirkegaard, J.A. Nutrient availability limits carbon sequestration in arable soils. Soil Biol. Biochem. 2014, 68, 402–409. [Google Scholar] [CrossRef]
  89. Hobbie, S.E.; Nadelhoffer, K.J.; Högberg, P. A synthesis: The role of nutrients as constraints on carbon balances in boreal and Arctic regions. Plant Soil 2002, 242, 163–170. [Google Scholar] [CrossRef]
  90. Wang, W.; Sardans, J.; Zeng, C.; Zhong, C.; Li, Y.; Peñuelas, J. Responses of soil nutrient concentrations and stoichiometry to different human land uses in a subtropical tidal wetland. Geoderma 2014, 232–234, 459–470. [Google Scholar] [CrossRef]
  91. Pan, P.; Zhao, F.; Ning, J.; Zhang, L.; Ouyang, X.; Zang, H. Impact of understory vegetation on soil carbon and nitrogen dynamic in aerially seeded Pinus massoniana plantations. PLoS ONE 2018, 13, e0191952. [Google Scholar] [CrossRef]
  92. Zhao, W.; Zhang, R.; Huang, C.; Wang, B.; Cao, H.; Koopal, L.K.; Tan, W. Effect of different vegetation cover on the vertical distribution of soil organic and inorganic carbon in the Zhifanggou Watershed on the loess plateau. Catena 2016, 139, 191–198. [Google Scholar] [CrossRef]
  93. Cornwell, W.K.; Cornelissen, J.H.; Amatangelo, K.; Dorrepaal, E.; Eviner, V.T.; Godoy, O.; Hobbie, S.E.; Hoorens, B.; Kurokawa, H.; Perez-Harguindeguy, N.; et al. Plant species traits are the predominant control on litter decomposition rates within biomes worldwide. Ecol. Lett. 2008, 11, 1065–1071. [Google Scholar] [CrossRef]
  94. Steinbeiss, S.; BeßLer, H.; Engels, C.; Temperton, V.M.; Buchmann, N.; Roscher, C.; Kreutziger, Y.; Baade, J.; Habekost, M.; Gleixner, G. Plant diversity positively affects short-term soil carbon storage in experimental grasslands. Glob. Chang. Biol. 2008, 14, 2937–2949. [Google Scholar] [CrossRef]
  95. Lange, M.; Eisenhauer, N.; Sierra, C.A.; Bessler, H.; Engels, C.; Griffiths, R.I.; Mellado-Vazquez, P.G.; Malik, A.A.; Roy, J.; Scheu, S.; et al. Plant diversity increases soil microbial activity and soil carbon storage. Nat. Commun. 2015, 6, 6707. [Google Scholar] [CrossRef] [Green Version]
Figure 1. Location of the study site and the scheme of the plant survey and soil sampling in Longli county on the Guizhou plateau, southwest China.
Sustainability 11 01732 g001
Figure 2. Effect of shrub encroachment (SE) on the soil environment, nutrient concentration, and carbon storage (CS) (n = 3). Different letters within the same soil layer indicate significant differences (p < 0.05). A-L: Effect of shrub encroachment (SE) on (A) soil pH, (B) water content (WC), (C) bulk density (BD), (D) organic carbon (OC) concentration, (E) total nitrogen (TN) concentration, (F) total phosphorus (TP) concentration, (G) available nitrogen (AN) concentration, (H) available phosphorus (AP) concentration, (I) available potassium (AK) concentration, (J) available calcium (ACa) concentration, (K) available magnesium (AMg) concentration, and (L) organic carbon storage (CS) in the 0–5, 5–10 and 0–20 cm soil layers.
Sustainability 11 01732 g002
Figure 3. Effect of shrub encroachment (SE) on soil stoichiometry (n = 3). Different letters within the same soil layer indicate significant differences (p < 0.05). A-K: Effect of shrub encroachment (SE) on the stoichiometry ratios of (A) OC:TN, (B) OC:TP, (C) TN:TP, (D) OC:TN:TP, (E) AN:AP, (F) AN:AK, (G) AN:ACa, (H) AN:AMg, (I) AP:AK, (J) AP:ACa, and (K) AP:AMg in the 0–5, 5–10 and 0–20 cm soil layers.
Sustainability 11 01732 g003
Figure 4. (A) The biplot of the redundancy analysis (RDA) of the soil nutrient concentration over shrub encroachment (n = 9). (B) The biplot of the RDA of soil nutrient stoichiometry over shrub encroachment (n = 9). (C) The percentages of the variation in the soil nutrient concentration explained by factors in the partial RDA (n = 9). (D) The percentages of the variation in soil nutrient stoichiometry explained by factors in the partial RDA (n = 9). (E) The percentages of the variation in soil carbon storage explained by factors in the partial RDA (n = 9). Cover represents the shrub relative cover. * p < 0.05; ** p < 0.01; *** p < 0.001.
Sustainability 11 01732 g004
Figure 5. Linear regression model of (A) the soil organic carbon (OC) concentration and (B) carbon storage (CS) to plant species diversity. The grey shade represents the confidence interval of 95%.
Sustainability 11 01732 g005
Table 1. Characteristics of plots surveyed in the different shrub encroachment stages.
CharacteristicsGrass StageMosaic StageShrub Stage
Latitude 126°19′44″ N26°19′49″ N26°19′48″ N
Longitude 2106°51′9″ E106°51′6″ E106°51′7″ E
Altitude a. s. l. 31610.7 m1610.5 m1610.2 m
Dominant speciesEulalia pallens (Hack.) Kuntze;Arundinella anomala Steud.Eulalia pallens (Hack.) Kuntze;Arundinella anomala Steud.;Vaccinium fragile Franch.Vaccinium fragile Franch.; pallens (Hack.) Kuntze
Plant functional typesSubalpine grassland with dense and tall herbaceous plants and grasses with few shrubsPatchy shrubs interspaced by subalpine grasslandDense shrubs stand with few herbaceous plants and grasses
Total plant cover (%)91.67 ± 2.89 a86.67 ± 4.16 a85.00 ± 5.00 a
Shrub relative cover (%)6.53 ± 0.91 c34.38 ± 4.23 b83.10 ± 1.74 a
Plant species richness per plot101215
Plant species richness per quadrat4.67 ± 0.57 b5.67 ± 0.57 b7.33 ± 0.57 a
Note: 1–3 were measured using a global positioning system; different letters within the same characteristic indicate significant differences (p < 0.05).

