Does Participation in Social Networks Foster Trust and Respect for Other People—Evidence from Poland


Faculty of Economic Sciences, University of Warsaw, Długa 44/50, PL-00241 Warsaw, Poland
Sustainability 2019, 11(6), 1733; https://doi.org/10.3390/su11061733
Submission received: 26 February 2019
/
Revised: 14 March 2019
/
Accepted: 19 March 2019
/
Published: 22 March 2019
Abstract
:A shortage of social capital may hinder sustainable development. According to the “social capital dream” there is a virtuous circle between participation in social networks, trust, and cooperation. It is a promising idea for proponents of sustainability, as it is easier to promote participation than affect social norms. Participation may, however, lead to particularized and not generalized trust, which hinders social inclusion and undermines the idea of a sustainable society. The aim of this paper is to validate the role of participation in informal and formal social networks in enhancing social trust and respect towards others. The relevance of both strong and weak ties is considered. Fixed-effects modeling on three-wave data from a Polish social survey is utilized. An increase in generalized trust corresponds with an increase in the acquaintances network, a decrease in the family and friends network, and an increase in volunteering. A rise in expectations about the cooperativeness of others is enhanced by an increase in the family and friends network, and by volunteering. The lack of respect for some groups of people is not affected by participation in organizations and informal networks. Overall within-person heterogeneity is small, suggesting that possibilities for fostering moral trust by participation are limited.
1. Introduction
Social capital has been well acknowledged as an important factor of economic growth [1,2,3]. It matters even more in the context of sustainable development, and the recognition of this fact is growing in literature [4]. The idea of social capital is close to that of a sustainable community, focusing on within- and between-communities cohesion and social inclusion, and being, next to ecological concerns, a fundamental part of sustainable development [5,6,7]. Social capital is believed to determine the introduction of sustainable plans and policies by local authorities [8]. However, its influence here is not straightforward and depends on institutional context and its evolution. Pierce at al. found a positive effect of social trust on adopting sustainability initiatives in 2000, and a lack of impact ten years later [8]. There are many ways in which social capital may affect sustainable development. Social capital, associated with notions of reputation, trust, and reciprocity, enhances collective action and helps to solve the problem of governing commons by reducing transaction and monitoring costs [9,10]. This is especially important for the protection of endangered national resources, like fisheries and forests [11,12], and dealing with climate change [13]. Additionally, interactions within social networks play an important role in social learning and adaptive co-management and therefore are crucial for the management of social-ecological systems [14,15]. Furthermore, people who trust others and feel identification with a community care more for a group/public good and therefore it is not surprising that social capital correlates with pro-environmental norms and attitudes [16,17].
Social capital, considered from the perspective of community or society, is generally associated with social trust, cooperative attitudes, and social cohesion [1,3,18,19]. Social trust is understood as “an expectation that people will behave with good will, that they intend to honor their commitments, and that they will avoid harming others” [20] (p. 25). Readiness to cooperate is based both on expectations about the cooperativeness of others, and the internal values of cooperative individuals [21]. Social cohesion requires connectedness not only within but also between distinct groups [3,6]. The notion that connects all three concepts is moral trust, as proposed by Uslaner [22], which is trust based not on personal experience or calculations, but on the assumption of shared fundamental values. This leads to trusting other people, however different they are, caring for them and treating them equally [22] (1–50). Such a perception of social capital is especially meaningful from the perspective of sustainable development, and many studies mentioned above use similar conceptualization [8,11,12,13].
The alternative understanding of social capital focuses on resources embedded in social networks and connected with structural positions within those networks [23,24]. Those resources determine individual well-being and may serve the competitive aims of individuals and organizations [25]. This is well illustrated in the study carried by Bodin and Crona [26], who showed that the coexistence of coherent groups (bonding ties) and connections between groups (bridging ties) was not guaranteeing sustainable fishing practices. The explanation was that the most influential actors, occupying central brokering positions in the local ecological knowledge network, were deep-sea fishers. They were not affected by the problem of declining fish stock and were driven by their particular interests [26]. This example shows that micro-level mechanisms connected with social capital are complex and their aggregated impact on sustainable development can be diverse.
Taking into consideration the role that community/society social capital plays in sustainable development, there is a big concern regarding a possibility to foster social capital in communities and societies in which it is lacking. According to the “social capital dream” there is a virtuous circle between participation in social networks, trust, and cooperation [21]. This idea refers to the belief that different definitions of social capital have common roots, connected with the same underlying phenomenon. In particular, it means that the main components of social capital, emphasized by different authors, are mutually interconnected [21]. Community- and society-level trust and cooperation are believed to emerge from grass-root interactions between individuals within social networks, however the operating mechanisms are still not recognized enough [27,28]. The most influential contribution in this area can be accredited to Putnam [18,19]. He claimed, following the ideas of Tocqueville, that participation in dense and vertical networks, especially networks of civic engagement, produces positive external effects and fosters trust and cooperative attitudes [19] (p. 173). The processes that are at work are a facilitation of communication, a flow of information about trustworthiness of others, and learning positive patterns of collaboration [19] (p. 174). A special role is played here by weak ties (like acquaintances networks and voluntary associations) connecting different people, in opposition to strong ties (like family and friends networks) which tend to be homogeneous [29]. A good illustration comes from Sabatini, who stated, for Italy, that high involvement in voluntary associations connected with heterogeneity of their members “generally implies the sharing of moral norms of trust and reciprocity that can counteract the negative effects of the ‘amoral familism’, as well as the tendency of organizations to lobby for the narrow interests of their members” [28] (p. 439). The thesis that participation in social networks and voluntary associations fosters social trust and collaboration is a promising view for proponents of sustainability, as it is potentially easier to promote participation than affect social norms.
There are empirical evidences, based on the statistical modeling of data from social surveys, which lead to the conclusion that participation in associations enhances social trust [30,31,32,33]. Findings based on the structural model, performed on data from the General Social Survey aggregated for 1972–1994, show that the influence of civic engagement on interpersonal trust is stronger than the reverse relationship between these variables [30]. A reciprocal relationship between participation in voluntary associations and interpersonal trust was also validated for Michigan Socialization Study panel data, which presented partial evidence that participation is a significant cause for trust and no results indicating an influence of trust on participation [31]. According to results of multilevel modeling performed on the 1999–2001 wave of the World Values Survey from 48 countries, among different individual-level factors of generalized trust, the strongest effect is connected with voluntary associations membership [32]. Some authors postulate that both active and passive membership in voluntary organizations can matter for increasing social trust and civic engagement, as the passive membership can influence sense of community and identification with a group [33]. Additionally, experiments show that group affiliation fosters within-group altruistic norms [34], and that group membership builds a social identity that enhances cooperative behavior even if assignment to groups is random and interactions between members last a short time [35]. The type of organization also matters, as connected organizations were found to be more beneficial for the creation of generalized trust than isolated groups [36]. More generalized trust was found to be generated in organizations with diverse and engaged members connected by weak ties [37], and due to participation in various associations with multiple interests [33]. Other researchers argue that in many countries informal networks are more important for building social trust than memberships in associations [38,39]. Contact with friends turned out to be a significant factor explaining generalized trust in all seven countries studied (South Korea, Switzerland, East Germany, West Germany, Spain, Hungary, and Slovenia), while membership in voluntary organizations was significant only in three countries (Switzerland, East Germany, and Hungary) [38]. Interestingly, close interpersonal relationships were similarly important in Central-Eastern European and Western countries [38]. The relevance of participation in informal relationships was also confirmed in the case of Poland, as lagged relationships with acquaintances (from 2005) were found to be positively correlated with generalized trust (from 2007) [39]. At the same time, contact with family and friends turned out to be insignificant upon adding control variables [39].
Some authors challenge the hypothesis advocated above and suggest that the direction of the relationship between participation in networks and social trust is the other way around, i.e., it is the second that causes the first [40,41]. This is in accordance with findings of the studies which show that social norms are persistent over time and culturally dependent [42,43,44]. Other studies stress that it is socialization in early childhood and education attainment which determines social trust the most [22,45,46]. There is also evidence, based on research on twins, that social trust has a genetic origin [47]. All these arguments, however, do not exclude the possibility that social interactions foster trust and cooperation, as there may be several determinants of social trust working simultaneously.
What seems especially important for the considerations presented in this paper is the argument that participation in groups causes within-group trust and within-group cooperation, which do not apply beyond the organization boundaries [22,40]. Participation may lead to particularized and not generalized trust and can hinder social inclusion [22]. Furthermore, some organizations enhance hostility toward other groups [36,48]. This conflict between within- and beyond-group trust and cooperativeness concerns both formal and informal networks. An interesting finding comes from a study of 1540 students from different Polish regions, based on the comparison of survey and experiment data [49]. The outcomes determine that a high frequency of contact with friends is associated with: a belief in strategies which are both cooperative and “on the borders of legality”, low generalized trust, acceptance of tax evasion, and cooperative behaviors within in-group, experimental designs [49].
A helpful distinction of potential mechanisms operating in social networks is one based on the idea of closure and brokerage. Closure is associated with dense and strong ties within a community, which, through means of social sanctions and a sense of belonging, encourage trust and cooperation [48,50]. At the same time, closure can lead to the emergence of distrust towards strangers, and it reinforces divisions between “us” and “them” [48]. Generalized trust seems to be more associated with brokerage, based on ties between individuals from different groups, located across structural holes [18,19,48,51]. These ties are expected to be weak and connect heterogeneous individuals [29]. At the same time, brokerage reduces the group-dependency of individuals, and increases the possibility of breaking group norms, so brokers are more free to follow their private interests. This contradiction has been noticed by Gonzalez-Bailon [52], who shows that the same network structure that efficiently serves the flow of information also increases the likelihood of free riding, and thus destroys willingness to cooperate and trustworthiness of others. Some researchers claim that this contradiction can be solved by a coexistence of closure and brokerage [3,48] or the existence of underlying, general moral values [22].
The aim of this paper is to validate the role of participation in informal and formal social networks in enhancing social trust and respect towards others. The relevance of both strong and weak ties is considered. Social trust is divided into two components. The first is generalized trust, which is an expectation that others play fair. The second is a belief that other people are cooperative and ready to help those in need. The justification of this division, together with an explanation regarding the measurements used for all dependent and independent variables and the expected effects of the proposed determinants of social trust and respect, are presented in the Materials and Methods section. The following hypotheses are stated:
- Generalized trust is positively affected by relationships with acquaintances, participation in voluntary associations, and volunteering. The strong ties that characterize friends and family networks undermine generalized trust.
As it was argued in the presented literature review, weak interpersonal ties and participation in civil organizations are expected to be plausible sources of generalized trust [18,19,28,29,51]. Strong ties may lead to particularized trust and therefore decrease generalized trust [22,49]. This is especially plausible in societies with a narrow radius of trust [1,28] and therefore may be expected in Poland, which has been assessed to be characterized by low social trust [39,53].
- 2.
- Expectations about the cooperativeness of others are grounded in relationships with friends and family, and volunteering.
Behaviors involving help are specific for networks of strong ties [48,50], as well as charities and volunteering [22].
- 3.
- A lack of respect for all people can be overcome by participation in voluntary associations, relationships with acquaintances, and volunteering. The strong ties that characterize friends and family networks enhance disrespect to some groups of persons.
Weak ties are connected with the heterogeneity of network members and this can lead to an openness for new perspectives and ways of living [22,29,48]. By being involved with charity and volunteering, a belief in common moral values and the equality of all people may be fostered [22]. Strong ties can enhance beyond-group hostility [36,48].
Most of the existing studies validating the relationship between participation in social networks and social trust are cross-sectional [30,32,33,36,37,38,45]. Sometimes a time sequence is introduced by regressing generalized trust on lagged indicators of participation [39]. Cross-sectional approaches are connected with a potential problem of omitted variables, regarding psychological traits of respondents and their early-life socialization, which can be remedied by utilizing a fixed-effect longitudinal approach [54,55,56]. According to the best knowledge of the author, this method has so far been utilized only twice for analyzing the effect of changes in social network participation on changes in social trust. These studies were performed for cases of the USA [57] and the UK [58]. The first used data from 2006 and 2008 waves of the General Social Survey and concluded that a change in the frequency of social interactions with friends, family, and neighbors is a source of change in the index of interpersonal trust. It does not take into consideration participation in voluntary associations [57]. In the case of the second, the results of fixed-effects modeling, performed on data from six waves (1998–2008) of the British Household Panel Survey, are compared with estimations of pulled and random-effects logistic regressions. These two alternative approaches have been accused of being biased when investigating relationships between social connections and trust, due to omitted variables. The authors concluded, based on fixed-effects outcomes, that the number of organization memberships, frequency of meetings with friends and family, and frequency of talking with neighbors are not significant for generalized trust [58].
This research follows the methodological approach of these two studies but differs from them in a few important points. First, it introduces a different cultural surrounding—a Central-Eastern European country. In Poland, in comparison with Western countries, social trust and civic engagement are small, and stocks of social capital are more evident in relation to informal relationships with family and friends than participation in voluntary associations [39,59,60]. Second, in addition to explaining the determinants of generalized trust, it introduces two alternative dependent variables connected with the notion of moral trust (and distrust): the belief that other people are helpful and the conviction that some people do not deserve respect. Third, in both reference papers, participation in informal social networks was measured by the amount of time spent on socializing with friends, relatives, and neighbors. The present research instead takes into consideration the size of (1) family and friends and (2) acquaintances networks (contacted on regular basis). The justification of the perceived superiority of this approach is given in the Materials and Methods section.
Fixed-effects’ logistic regression models were estimated in Stata 15 [61,62] on data from the 2011, 2013, and 2015 waves of “Social Diagnosis” (“Diagnoza Społeczna”), which is a panel survey conducted in Poland [63,64,65,66,67,68]. They make it possible to determine if, for an observed panel of Polish respondents, a change in informal and formal networks is followed by a change in social trust and respect towards others. An increase in generalized trust turns out to correspond with an increase in the acquaintances network, a decrease in the friends and family network, and an increase in volunteering. A rise in expectations about the cooperativeness of others is found to be enhanced by an increase in the friends and family network and by volunteering. A lack of respect to some groups of people is not affected by participation in either formal or informal networks. Overall within-person heterogeneity is small, suggesting that possibilities for fostering moral trust by participation are limited.
2. Materials and Methods
2.1. Data
The utilized data came from the Polish scientific and interdisciplinar survey program “Social Diagnosis” (“Diagnoza Społeczna”), which was conducted in 2000, 2003, 2005, 2007, 2009, 2011, 2013, and 2015 and has a panel character. In the first wave, 6625 individual respondents (16 years old and above) from 3005 households all over Poland were interviewed. This sample was increased in subsequent waves up to 26,453 individual respondents from 12,381 households in 2011, 26,308 individual respondents from 12,352 households in 2013, and 22,425 individual respondents from 11,740 households in 2015. As much as it was attainable, the same households and the same individual respondents were interviewed in the subsequent years, but with time, there was a growing number of initial respondents who were disappearing from the database. For example, out of the initial sample from 2000, only 711 individual respondents were reached in 2015 [69]. Subsequently, new households were added to the sample, ensuring the proportional coverage of all Polish regions [69]. Details about the research design and sampling procedure, as well as all the questionnaires used, and the data collected, are publicly available in Polish and English on the “Social Diagnosis” webpage (www.diagnoza.com).
Several questions altered in the different waves. For example, the question regarding the size of the informal networks of family, friends, and acquaintances, crucial for the present study, appeared in questionnaires once in 2005, and then was reentered in 2011, and repeated in 2013 and 2015′s waves of the survey. It has been therefore decided to use data from three waves: 2011, 2013, and 2015. The year 2005 was not taken into consideration for the panel modeling, because an insufficient number of respondents from 2005 were reached again in 2011, 2013, and 2015. Even with the choice of the period from 2011 to 2015, a lot of respondents who took part in the initial year were not reached in subsequent years. In 2013, 68.12% of the individual respondents from 2011 were reached again. In 2015, 66.51% of the individual respondents from 2013 were interviewed again, and only 43.32% of those from 2011 [69]. Additionally, samples used in analyses have been reduced by missing data in the case of particular variables. Furthermore, in the fixed-effects logistic regression models, only respondents who have a variance in the scores of dependent variables can be included, which leads to a significant decrease in size of the analyzed samples. Final samples, used in particular analyses, are reported in the corresponding parts of the Results section.
2.2. Dependent Variables
2.2.1. Generalized Trust
The first dependent variable, “generalized trust”, was created based on answers for the question: “Generally, do you believe that you can trust most people, or do you think you can never be too careful?”. This is a standard question, which is a commonly used indicator of generalized trust [2,22,30,31,32,33,36,38,39,40,41,42,44,45,46,57,58,70]. In a straightforward manner, the answer: “you can trust most people” was coded as one, indicating the existence of trust, and the answer: “you can never be too careful” was coded as zero, indicating a lack of trust [36,38,39]. Such an approach means leaving out the respondents who answered, “hard to say”, as it is difficult to determine the reasons behind this choice. Their answer may refer to the middle point between “trust” and “distrust”, or to a difficulty in deciding who should be included in the “most people” group and what type of circumstances should be considered (like leaving a baby with a stranger versus buying second-hand goods online). Following some previous studies [58,70], an alternative variable was constructed, with answers “hard to say” and “you can never be too careful” being coded as zero, and the modeling was repeated. Additionally, a variable measuring “distrust” was utilized, with “you can never be too careful” coded as one and the two remaining answers coded as zero. The results of these alternative robustness checks do not alter the conclusions presented in the Results section.
Generalized trust is important for prospering in both society and business, as it characterizes an environment where commitments are kept. It is in direct opposition to the notion of opportunism—behavior based on “self-interest seeking with guile” [71] (p. 30). In the literature, however, there is some dispute over whether this survey question is understood in the same way by people from different cultures [20]. This does not affect the results of the current study, as the analyzed group of respondents consists of Poles who are ethnically homogenous. Nevertheless, there is still some uncertainty as to what the exact meaning of this question is to respondents, and whom they perceive as “most people”. According to findings of Delhey et al., the “radius” of trust covered by this indicator can differ between countries, and is wider in wealthy societies [72].
2.2.2. Belief in the Cooperativeness of Others
The second dependent variable, “others are helpful”, was constructed using answers regarding the statement: “People above all try to help others”. A binary variable was built, equaling one for positive answers (“definitely yes”, “yes”, or “rather yes”) and zero for other answers (“neither yes nor no”, “rather not”, “no”, “definitely not”). The expectation that other people are helpful is sometimes used as one of the indicators of social trust, and is included in an aggregative measure (index) of social trust [31,51]. Nevertheless, it can be argued that the “others are helpful” variable does not measure the same as the previous indicator directly connected with a notion of generalized trust [40]. “Trusting most people” in opposition to “you can never be too careful” is connected with the belief that others will not take advantage of oneself, will not cheat or do any harm, and will not break promises. A belief in the cooperativeness of others is something more than the expectations of playing fair, as giving help includes some extra, voluntary effort. Helping behavior is a norm in social networks based on strong ties, among family and friends.
This question had a slightly different wording in 2011 than in the subsequent years: “People mostly try to help others”. As a robustness check, the analysis was repeated only for years 2013 and 2015, when the wording was identical, but the main results stayed unchanged in comparison to modeling covering all three years and ignoring this slight wording difference.
2.2.3. Lack of Respect to Some Groups of People
The third and last dependent variable, “no respect to some people”, was created on the basis of respondents’ reactions to the statement: “Some groups of persons are not worthy of respect”. The coding was the same as in the case of the previous variable, with one indicating a lack of respect to all people and meaning agreement with the cited statement (“definitely yes”, “yes”, or “rather yes”) and zero indicating a lack of such agreement (“neither yes nor no”, “rather not”, “no”, “definitely not”). There are two reasons for including this question in the analysis. First, it refers to the idea of social inclusion and treating all people equally, which is a foundation of moral trust, as defined in the Introduction section [22]. Second, regarding the previous comment of the unclear radius of generalized trust, this question makes it possible to measure the attitude towards some minor groups of society, who may be not included by a respondent in the group of “most people”.
2.3. Independent Variables
2.3.1. Membership in Voluntary Associations
Membership in voluntary associations, “organizations”, is measured as the number of organizations in which the respondent participates [33,58]. It is argued that, from the point of view of the methodological approach taken, this is a better measure than a membership in any organization. Within-person change in membership, indicated by a binary variable, occurs only when a respondent joins a first association or withdraws from all memberships. With the number of memberships, such a change is about increasing and decreasing the scope of organizational involvement (assuming that membership is not purely passive).
The actual question that was asked about membership was: “Are you a member of any organizations, associations, parties, committees, councils, religious groups, or clubs?”. The possible answers were: “yes, one”; yes, two”; “yes, three or more”; and “no”. In all the included waves, only less than 1% of respondents chose the “three or more” option and this answer was treated as participation in three organizations. Alternatively, as a robustness check, models were refitted using a binary variable of organizational membership and the main results were unaffected.
In 2013 and 2015, respondents who declared membership in at least one organization were asked about belonging to specific types of associations, including: sports clubs; business, professional, or agricultural organizations; political parties; charity organizations; trade unions; interest clubs or unions; residents’ associations; parents’ associations; ecological organizations; social clubs; religious organizations; educational organizations; elected local authorities; and other organizations. Performing a two-wave panel analysis utilizing variables measuring participation in different types of organizations was considered. Unfortunately, too few respondents belonged to a given type of organization to obtain sufficient information for modeling. As the respondents with no changes in dependent variables scores could not be included in the fixed-effects panel logistic regression, it turned out that within the sample under study there were very small numbers (less than ten) of people who had changed participation in any of given organization types. This could lead to spurious results as the estimation would be determined by those few cases. Therefore, data on type of organizations was only used in descriptive analyses.
2.3.2. Informal Social Networks—Strong and Weak Ties
The utilized measures of informal social networks made it possible to distinguish between strong (count of close family members and friends: “family and friends”) and weak ties (count of acquaintances: “acquaintances”). They are based on the question: “We would like to know how many persons you have contact with regularly for social and personal reasons (at least several times a year). Please give the approximate number of such persons: among close family members; among friends; among acquaintances (work/school colleagues, neighbors, and others)”. The advantage of this approach is that it defines the kind of ties that should be taken into consideration, based both on the condition of having regular contact and on the type of relationship (family, friends, and acquaintances). In this study, family and friend ties are aggregated into one network, as both can be considered strong ties.
It can be argued that these measures of informal social networks are more informative than those used in previous research based on fixed-effects panel models. The measures used previously referred to the frequency of interpersonal contact involving: meeting with friends and distant family, talking to neighbors [58], and socializing with friends, relatives, and neighbors, and at bars or taverns [57]. An approach that included both network size and frequency of contact was proposed by Delhey and Newton, but it considered only close friends [38]. At the same time, the networks that are expected to generate trust are those with diverse members [22,28] and involving weak ties [29]. Frequent interpersonal contacts may take place within a very small and homogenous group of people, while it can be expected that diversity among participants increases with network size.
In the 2015 wave there was asked a question that approached the problem of diversity in social networks in a more straightforward manner: “Among the acquaintances and friends you contact for social reasons, are there any people who: are significantly older or younger than you are?; have other political views than yours?; are significantly poorer or richer than you are?; prefer different music, literature, pastimes than you do?; prefer different cuisine than you do?”. Possible answers were “yes” and “no” for each part of the question. As no panel data are available, measures of the diversity of social ties are utilized only in descriptive analyses, presented in the Results section.
2.3.3. Volunteering
It can be argued that the generation of moral trust which spans across group borders is possible only in the case of volunteering and charities, as both are connected to helping people who may not belong to the social network of an individual [22]. A binary measure of “volunteering” was created based on the question “Have you in the last year done any voluntary work for people outside the family or for a social organization?”, where positive answers were coded as one.
2.3.4. Life Satisfaction
Previous studies recognize life satisfaction as an important determinant of social trust [22,30,45]. Controlling an increase or decrease in life satisfaction in a given wave also matters because it may be a manifest of the respondent’s general mood in the time of interview, which can affect their perception of other people. A binary variable “happiness” was created based on answers to the question: “Considering all, how would you assess your life in recent times—would you say you are: very happy; rather happy; rather unhappy; unhappy”. The first two answers were coded as one, indicating happiness, and two subsequent answers were coded zero, indicating unhappiness.
2.3.5. Educational Attainment
Researchers claim that social trust is connected to better education [30,45] and additional educational attainment can increase trust [57]. “Educational attainment” was measured as years of education completed, which can change between the observation waves. It is argued that it can increase generalized trust, belief in the cooperativeness of others, and respect to all people.
2.3.6. Economic Situation
Low trust and no respect for some groups of people can be connected to a difficult economic situation [30]. At the same time, it may have a different effect on the perception of others as helpful, as economic hardship can be an occasion to receive help from other people. As economic situation can change over time, several variables were included as controls. An objective measure utilized was personal net income, averaged for the last three months (“personal income”). The economic situation of people with the same personal income may vary according to whether or not they have financially dependent children. Therefore, a binary variable indicating a need to provide for children, “children provided for”, was added as a control. Additionally, a subjective measure of “financial problems” was included. A binary variable was coded as one for respondents who stated that, in the recent months, their financial problems often “worried them and made their life harder”.
2.3.7. Problems with Health
In addition to a change in economic situation, a change in health conditions can also affect social trust and perception of other people. In the fixed-effects analysis performed by Glanville et al., this was the only variable significant for explaining social trust, other than frequency of socializing [57]. The utilized “health problems” measure was constructed as a binary variable with score one indicating regular health problems in recent months that “made it difficult to perform everyday activities or to take part in other activities”.
2.3.8. Traumatic Experiences with Others
Traumatic experiences with other people cause fear and therefore can undermine trust in strangers, the belief that others are helpful, and respect towards all groups of people [30]. A binary variable named “victim” was created, which scores one if a respondent admitted that in the last year he or she: (1) was robbed; (2) was mugged and beaten; (3) suffered from burglary; or (4) was discriminated against/humiliated. Only respondents who commented on all four potential offences were included into analyses.
2.3.9. Wave-Dependent Confounders
Within the fixed-effects modeling framework it is possible to include trends in time, which can be connected with the effects of variables that change in time but are constant across respondents [54] (pp. 192–201, 232, 234). In the case of this study, such variables may be connected with the economic situation in the country, political events in the country and abroad, and different characteristics of different survey waves, like minor changes in wording (the case of the “others are helpful” variable described in Section 2.2.2) or a change in the questionnaire composition and sequence of questions. As long as such confounders affect different respondents in the same way, they may be controlled by time dummies. It is also possible to introduce a linear or quadratic function of the interview year, but with only three waves and no assumptions about the shape of the relationship between the dependent variables and time, it is more convenient to use time dummies. Treating the 2011 wave as a reference category, two dummies were included, equaling one for year 2013 and zero otherwise (“time dummy 2013”), and equaling one for year 2015 and zero otherwise (“time dummy 2015”).
2.3.10. Other Control Variables
Two additional variables were tried as indicators of participation in social networks: frequency of taking part in a church service or religious meetings, and involvement in actions benefitting the local community. As they were not significant in any variables’ configurations and there are no strong theoretical reasons that they should be controlled for, they were omitted in the final models presented in the Results section. The fixed-effects approach itself served as a control for all possible time-invariant variables, so factors like gender or main place of residence were not considered.
2.4. Fixed-Effects Logit Model
As all dependent variables are binary, a fixed-effects panel logistic regression was utilized. A general form of this model is presented in Equation (1), where i is the number of respondents, t stands for the wave of observations (measurement occasion), β0 is a regression constant, β1, … βk are unknown parameters indicating the effects of k time-variant variables, and ui is a unit-specific fixed effect, an unknown parameter specific to each respondent.
When the number of units N grows to infinity for a fixed number of waves (T), ui does not have a consistent estimator, which is known as an incidental-parameter problem [55] (p. 240), [56] (p. 236). It is necessary to perform a transformation in order to eliminate ui from the equation. In the case of a binary dependent variable model and within a logistic regression framework, this is possible by maximizing the conditional maximum likelihood function [54,56]. Equation (2) presents this function for the three waves of observations utilized in the present study:
The main idea is to relate the probability of observing a given phenomenon (in the case of this study, a manifestation of generalized trust, a belief that others are helpful, or disrespect to some groups of people) during a specific measurement occasion to the overall history of measurement for a given individual (respondent). The conditional likelihood can be calculated as a product of adequate conditional probabilities, as presented in Equation (3):
It can be observed that the probabilities of getting: (1) three zero scores, conditioned on having the sum of scores equal zero, and (2) three one scores, conditioned on having the sum of scores equal three, both equal one. Therefore, the first two parts of Equation (3) could be dropped. In consequence, the sample was limited to N–N2. This means that respondents whose scores in a dependent variable do not change over time were not included in the analyses. Their answers were not used for estimating the model parameters. After this simplification, Equation (4) was obtained by fitting Equation (1) into Equation (3):
where:
and:
Equation (4) could be simplified into Equation (5). It could be observed that during algebraic transformation both the regression constant β0 and the unit-specific fixed effect ui were eliminated from the equation.
Equation (6) refers specific variables, included in estimations presented in the Results section, to the general model form:
All the analyzed variables can change in time and their value at a given wave was related to the whole history of a given respondent. Therefore, the observed effects were connected with an increase, decrease or no change in comparison to the average for a given person. The models explain the conditional probability that at a given wave, a given respondent revealed generalized trust, the belief that others are helpful, or disrespect to some groups of people. They include only within-subject effects (time-invariant variables, like gender, were eliminated from the estimation). There are two main advantages of using this approach. First, it is suitable when it is not possible to control heterogeneity between respondents by a set of independent variables (as in the case of pooled logistic estimation which does not take into consideration the panel character of data) or when it is not reasonable to assume that this unobserved subject-specific heterogeneity is independent from the effects included in the model (as in the case of random-effects logistic estimation) [54] (pp. 242–243). In the case of explaining social trust, there are differences between individuals in relation to their psychological traits and early-life socialization, which are difficult to measure and include in the model. At the same time, those differences could be correlated with the independent variables regarding participation in social networks, so a fixed-effects approach is preferred over the random-effects approach [57,58]. This intuition, for the case of the models in the current study, was supported by obtaining a significant Hausman test [61] (pp. 266–268). Second, a conditional maximum likelihood does not need any assumptions about the distribution of the included within-respondents effects [62] (p. 558).
This model is also called conditional logistic regression and can be estimated in Stata by the commands xtlogit, with fe option, or by clogit [62] (p. 557). The second option enables the use of robust clustered standard errors (clustered sandwich estimator, option vce(cluster cluster_variable)) [61] (pp. 330–335) and this is the reason why it was chosen. Due to the structure of the survey program, respondents were nested in households, as for each household there was an attempt to interview all members aged 16 and above. Therefore, it may be expected that answers of individuals from the same households are correlated and there are some household-level omitted variables. Using standard errors clustered by a household is at least a partial remedy for this problem. All the analyses were repeated using general robust standard errors, which can help in some other types of model misspecification, as well as the standard option—square roots of the diagonal elements of the variance-covariance matrix related to estimates of parameters. Applying those alternative methods of calculating standard errors did not affect the main results.
3. Results
The results and conclusions are divided into two parts. A descriptive analysis using both three-wave panel data and variables available only in a shorter number of periods (Section 3.1) is followed by the presentation of estimations of conditional logistic regression modeling (Section 3.2).
3.1. Descriptive Analysis
3.1.1. Correlations between Generalized Trust, the Belief That Others Are Helpful, and Lack of Respect to Some Groups of People
Table 1, Table 2 and Table 3 present tetrachoric correlations between the dependent variables for the three analyzed waves—2011, 2013, and 2015. Tetrachoric correlations are recommended when observed binary variables can be assumed to be manifestations of underlying latent continuous variables and signal that those latent traits have exceeded some thresholds. The results, based on the estimation of joint distributions of observed binary variables, can be interpreted as coefficients of correlation between unobserved continuous traits [73]. In the case of this research, these traits are latent generalized trust, the belief that others are helpful, and lack of respect to some groups of people, underlining the available binary indicators. It is plausible that these latent variables are continuous.
As can be observed in Table 1, Table 2 and Table 3, there are significant (p < 0.05) positive correlations between generalized trust and the belief that others are helpful, and between the belief that others are helpful and lack of respect to some groups of people. It is an interesting observation for two reasons. First, all three indicators are not inter-correlated, so it is doubtful that they measure the same underlying concept of moral trust. Additionally, all the significant correlations are weak, which supports the decision to model those three dependent variables separately. Second, the belief that others are helpful pairs not only with generalized trust (as expected in studies including both these indicators in an index of social trust [31,51]), but also with lack of respect to some groups of people. The second can suggest that the “others are helpful” measure is connected with bonding social capital, having a dark side enhancing the distrust of “us” to “them”, and can lead to social exclusion [18,48].
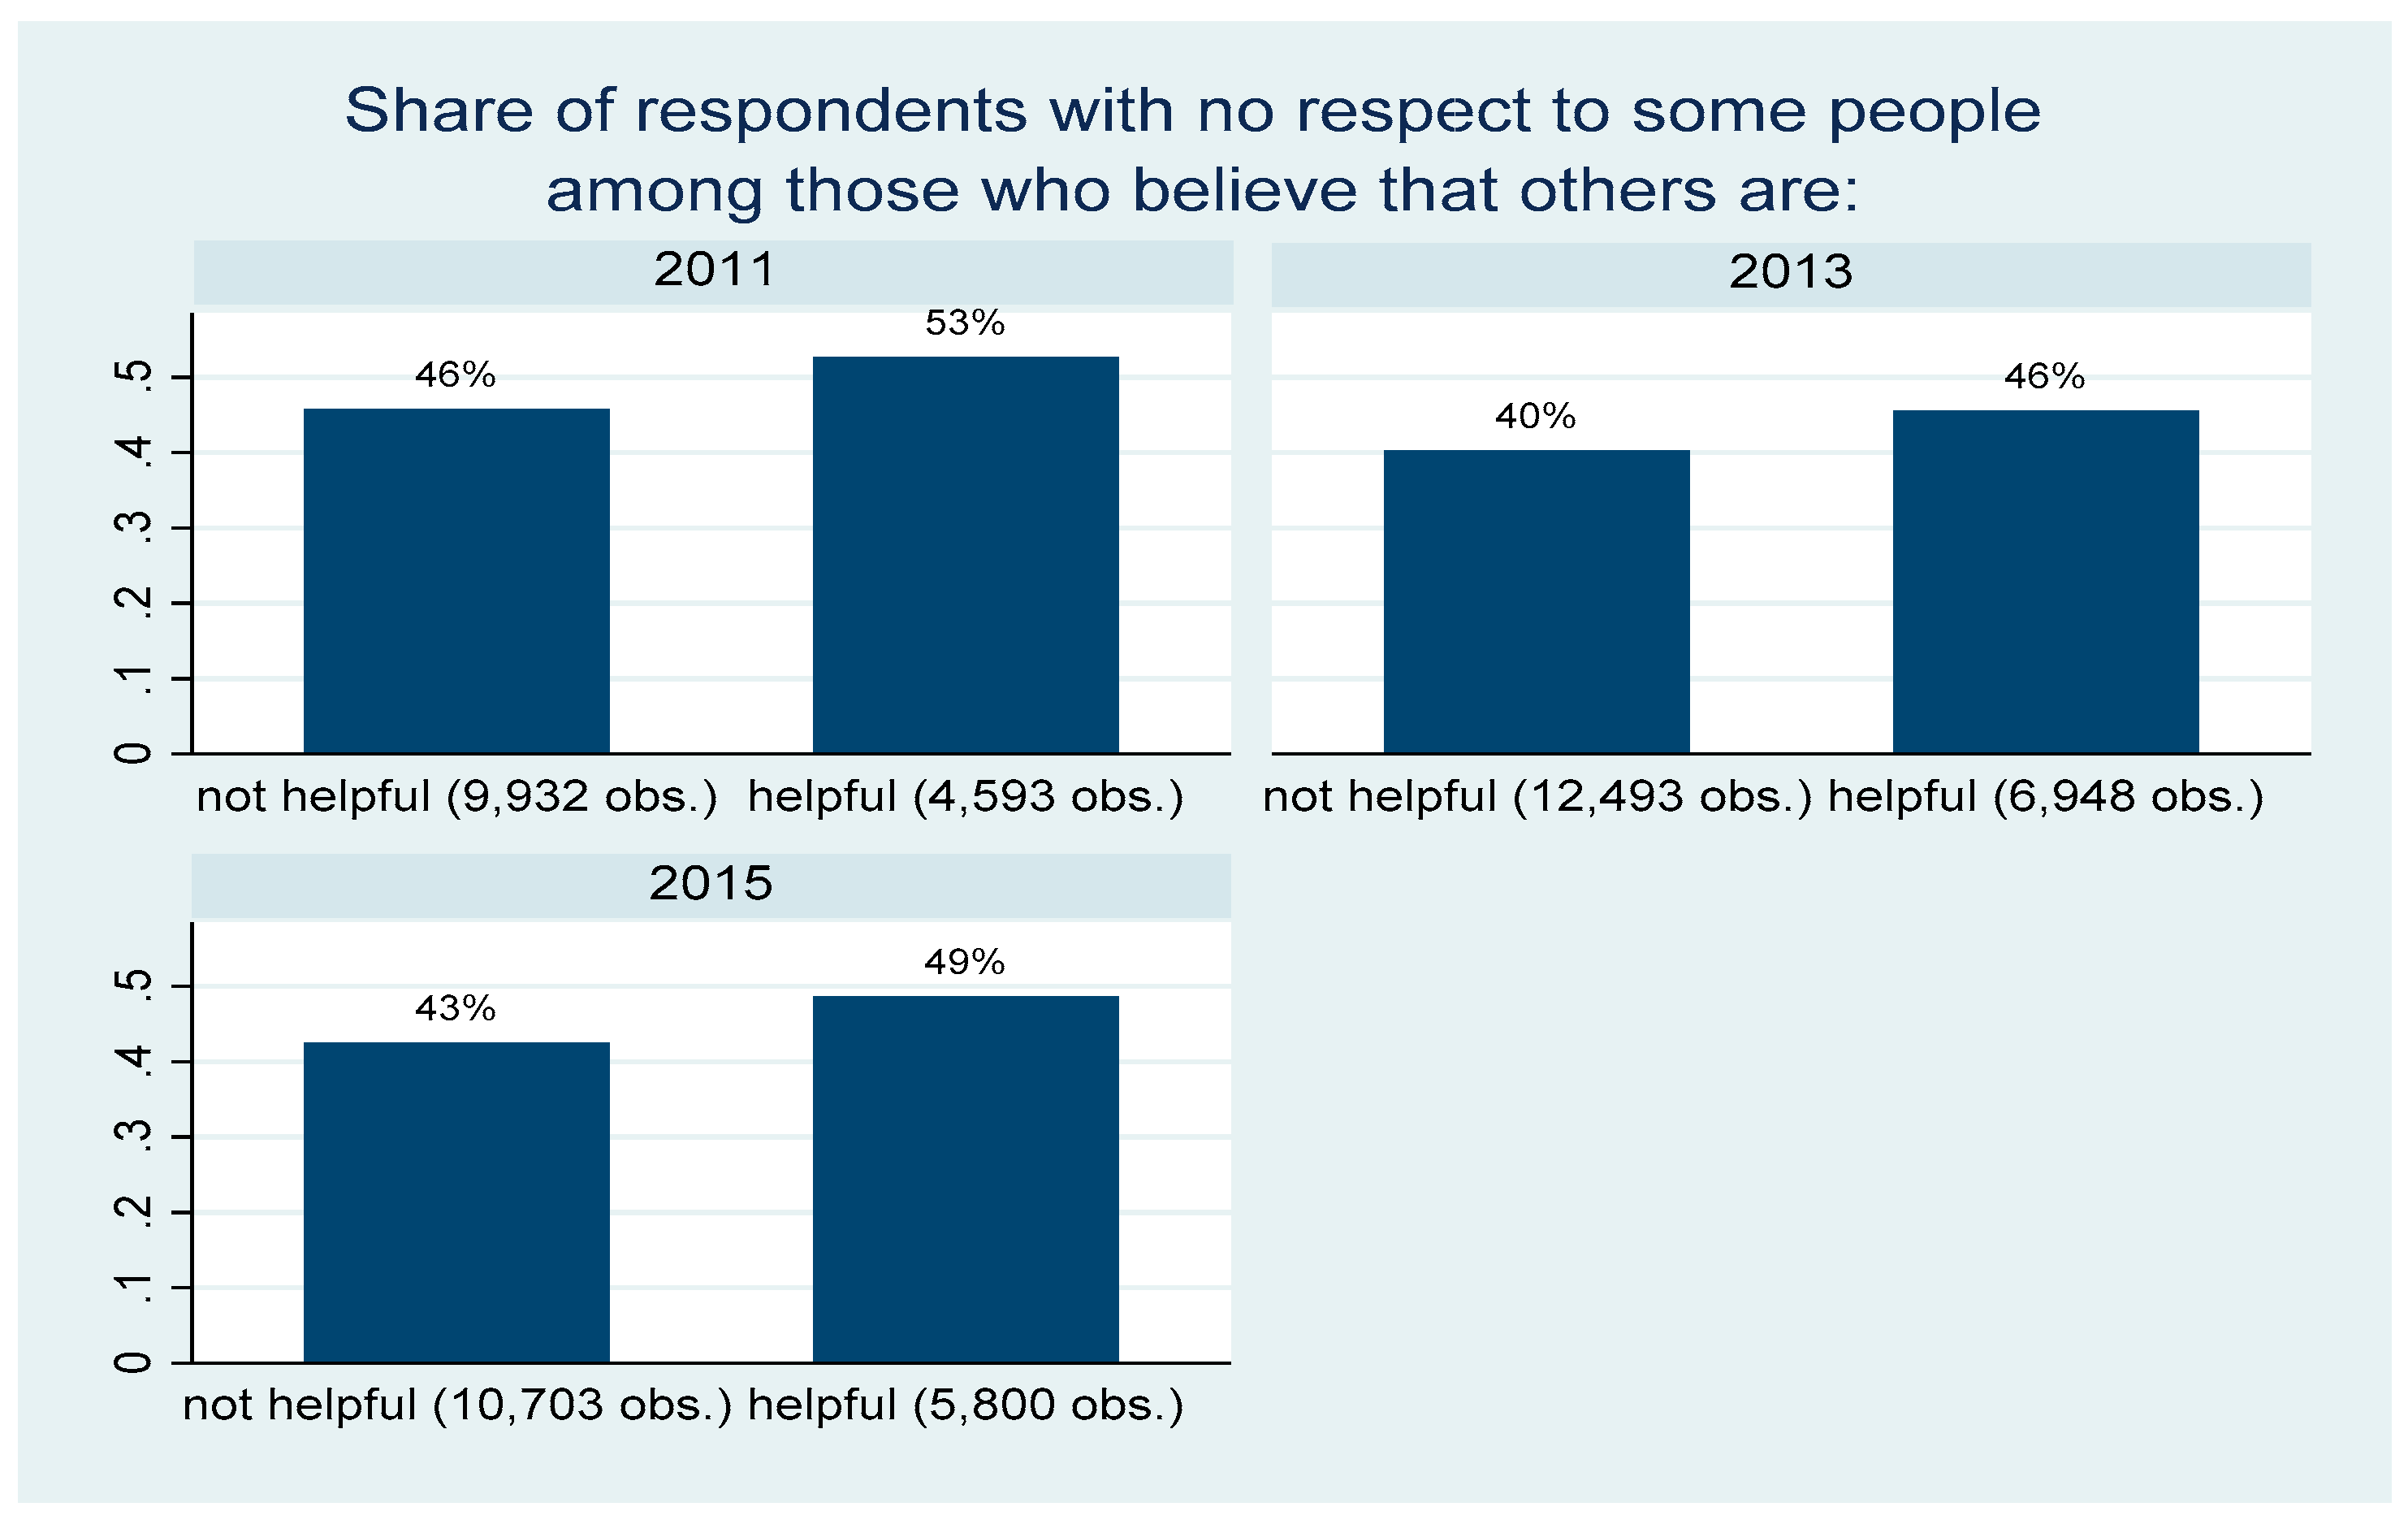
Figure 1 and Figure 2 present the proportion of respondents who trust (Figure 1) and lack respect to some groups of people (Figure 2) over the groups believing that others are helpful and unhelpful. The differences between the compared proportions are significant in all the cases, which confirms the conclusions from Table 1, Table 2 and Table 3. Additionally, as can be deduced from Figure 1 and Figure 2, the statements on generalized trust are rarer than those regarding the belief that others are helpful and those connected with respect to all groups of people. A belief that people do not take advantage of oneself (being the core of generalized trust) is less demanding than an assumption about others being ready to help. Therefore, it may be concluded that respondents take into consideration a different radius of people for these two concepts. The fact that respondents more often admit social distrust than a lack of respect for some groups of people may suggest that the second is more radical. At the same time these two indicators are not correlated, so they seem to measure different concepts. Generalized trust may refer to an average stranger, while disregarding “some groups” may suggest an attitude towards minorities. Additionally, people who are assessed as not deserving respect may not be accounted for in the radius of the population which is considered for the “generalized trust” question.
3.1.2. The Role of Participation in Voluntary Associations
Although it was not possible to distinguish between different types of organizations in fixed-effects panel models, some observations can be made based on cross-sectional descriptive analysis. The most interesting findings are illustrated in Figure 3, Figure 4 and Figure 5. Figure 3 discusses charity organizations, which, together with volunteering, are especially promising as potential incubators of moral trust [22]. This makes it possible to compare respondents belonging to charities and those belonging to organizations other than charities, excluding persons who are not members of any organizations. As was validated by an adequate test of proportions, the illustrated differences in generalized trust were significant both in 2013 and 2015, differences in the lack of respect were significant in 2015, and differences in the belief that others are helpful were not significant at all. This indicates that charities, among other organizations, can be associated with members who are trustful and have respect for all groups of people.
The same pattern of differences is illustrated in Figure 4, regarding religious organizations compared to other types of organizations. The difference is that all the variations regarding the belief that others are helpful and a lack of respect for some groups of people are significant, while differences regarding generalized trust are visibly small and not significant. Religious organizations, similarly to charities, may involve helping strangers. Nevertheless, their members can be expected to be homogenous, and defined by the religious character of an association. At the same time, in order to foster generalized trust, an organization needs to have diverse members [22,37]. This explains why membership in religious associations is not connected with higher generalized trust. However, the moral values of the members of religious associations may be responsible for greater respect for all people. The belief that others are helpful pairs with the bonding character of such organizations, as they can be expected to foster strong ties and provide experiences of help and support from other members.
Finally, Figure 5 presents data regarding interest clubs or unions—uniting, by definition, similar individuals sharing common hobbies or work interests. The pattern of differences here is reversed in comparison to the previous cases. The belief in people being helpful is significantly (in 2013) smaller in this type of organization than in the reference group, while disrespect for some groups of people is significantly (in 2015) higher than in other organizations. This observation corresponds well with a study showing that participants of labor unions are less prone than other respondents to engage in social relationships connected with providing help to those in need [74]. The cited paper presents this finding in the context of labor unions and in this paper the finding is in the context of interest clubs and unions, but it can be expected that similar mechanisms are in operation.
It must be clarified that all the presented speculations regarding the role of organization type are based on pure cross-sectional correlations. Therefore, they cannot be used to determine if specific organizations attract specific individuals, or if they have the potential to foster trust, cooperative attitudes, and social inclusion.
3.1.3. Heterogeneity in Informal Social Networks
Table 4 presents the tetrachoric correlations between the scores of dependent variables and several indicators of diversity in informal social networks, which was only measured in 2015. An initial conclusion is that all measures of diversity (having friends and acquaintances that are different ages, of different political opinions, having different wealth, of different interests and different culinary preferences) are strongly correlated. Additionally, a Mokken model procedure was performed, and all five variables were validated to belong to the same cumulative scale, which gives an additional justification to the possibility of summing them into one index [75,76]. The Mokken model is based on the nonparametric Item Response Theory and is suitable for building scales based on binary variables. This model assumes the existence of an underling cumulative scale, which means that lower levels of this latent variable are measured by more common manifestations (like different culinary preferences) and higher levels are measured by less common manifestations (like differences in wealth). If the variables follow the pattern of the Mokken scale, the fact that a given respondent shows a less common manifestation of the latent trait entails that he or she also shows a more common manifestation, and all the answers that do not suit this pattern are random errors.
The second conclusion is that all the measures of diversity positively correlate with generalized trust, but the pattern of the correlations in the case of the remaining dependent variables is more complex. Differences in age, that may characterize hierarchical networks (opposite to vertical networks, whose role was underlined by Putnam [19]) pair with a belief in the cooperativeness of others and disrespect for some groups of people. Having friends and/or acquaintances with different political opinions and with different interests and diets correlates with lower disrespect for some groups of people. This may indicate that such diversity of informal social networks characterizes people respecting minorities or fosters such attitudes. Different interests and diets of friends and/or acquaintances correlate negatively with the belief that others are helpful, which may suggest that those differences are associated with weak ties that do not provide the foundations for observing a readiness to help. However, it must be underlined that all these correlations between network diversity measures and the dependent variables are very weak, indicating that there should be other, more important reasons for the variations in generalized trust, the belief that other people are helpful, and disrespect for some groups of people.
Figure 6 illustrates that an index of diversity in informal social networks, constructed as a sum of five binary indicators, correlates with the size of both the family and friends, and acquaintances network. These correlations are significant and provide support for using network sizes as good measures of participation in informal social networks. The expectation that a bigger network size is connected with greater diversity seems to be justified.
3.2. Fixed-Effects Logistic Regression Model
Table 5 lists descriptive statistics of all the variables included in the fixed-effects logistic regression model. The standard deviations, minimums, and maximums are decomposed into overall, between-respondent, and within-respondent. It can be observed in all cases that between-respondent variance is higher than within-respondent variance.
The results from the fixed-effects logistic regression modeling are reported in Table 6. Within-respondent variance in generalized trust is negatively correlated with the size of the family and friends network, and positively correlated with the size of the acquaintances network and volunteering. In this case, weak ties turn out to be beneficial and strong ties seem to create a disadvantage. Among control variables, only life satisfaction is significant and its coefficient has an expected positive sign. Additionally, time dummy 2013 is significant and has a negative coefficient, which indicates some wave-specific factors leading to a decrease in generalized trust in 2013 compared to 2011. In the case of potential determinants of change in the belief that other people are helpful, the family and friends network and volunteering are significant and have positive coefficient signs. The weak ties associated with the acquaintances network do not matter, so it can be speculated that only strong ties or involvement in volunteering —often connected with helping others—give grounds for such a belief. Like in the former instance, happiness seems to have a positive impact. Additionally, financial problems reduce the conditional probability of a respondent declaring a belief that others are helpful. Financial distress turns out not to be an occasion to learn that others are helpful, especially when no sufficient help was received by a respondent and these problems persisted. Both time dummies are significant and have a positive influence, implying some factors that raise the belief about the cooperativeness of others in the 2013 and 2015 waves compared to 2011. In the case of the last dependent variable—a lack of respect for some groups of people—only time dummies are significant (p < 0.05) and indicate an improvement in respect for all people over time. Two variables are significant on a 0.1 significance level: educational attainment and traumatic experiences. Both coefficients have the expected signs, as disrespect for some groups of people is reduced by additional years of education and enhanced by being a victim of crime or discrimination.
4. Discussion
There are several conclusions that can be made based on the presented results. First, taking into consideration that heterogeneity in all the considered dependent variables was more affected by between- than within-person variance, the results support the arguments of authors claiming that the possibility of fostering social trust by an increase in participation is limited [22,40,45,58]. Second, as illustrated by the descriptive analysis, the type of organization and the level of diversity between members of social networks are worthy of consideration. As they could not be included in the estimation of the fixed-effects model in this study, future research in a longitudinal framework is needed to examine their effect on social trust. Third, although generalized trust, the belief that others are helpful, and respect for all groups of people are all connected with the theoretical idea of moral trust [22], when measured in a real-life empirical surrounding they differ and lead to different results. It seems that the radius of people regarded as a reference point varies in the case of these different indicators, and this observation is an extension of the previous findings regarding the different radius of social trust in different societies [72].
Following the postulations of the previous studies, it was reaffirmed that in Poland, as a post-transformation country, participation matters more in the case of informal social networks than in voluntary associations [39,59,60]. Within the research framework, it was possible to distinguish between the role of strong and weak interpersonal ties. For generalized trust, the findings indicate the negative impact of the family and friends network and the positive influence of the acquaintances network. These results support the theoretical considerations presented in the Introduction section. It can be expected that in a network based on strong ties, within-group trust is created and between-group trust may be weakened. The finding regarding the negative role of strong ties supports previous results from Poland which distinguish a group of students in which frequent contact with close friends was associated with within-group cooperation but not with following legal norms and generalized trust [49]. Trust for strangers seems to be dependent on weak ties connecting heterogeneous individuals [36,37,51]. The significance of the acquaintances network for fostering generalized trust confirms previous evidence from Poland, obtained with the use of the same data source but from earlier years [39]. At the same time, it turned out that experiences gained within a network of strong ties are important for individuals to learn that other people are helpful. This supports the thesis that both brokerage and closure are important [48], and homogenous and heterogeneous ties serve different aims [24]. The results also confirm the important role of volunteering, which seems to influence both generalized trust and the belief that people are helpful, as it has the potential to enhance perceptions about shared fundamental values [22]. Research hypotheses 1 and 2 are therefore confirmed regarding the role of strong and weak informal ties and volunteering, but not with regard to memberships in organizations, which turned out not to matter for either generalized trust or for expectations that people are helpful. Interestingly, opposite to the expectations of hypothesis 3, changes in social participation do not correlate with changes in respect for all groups of people. Such respect seems to be dependent on moral values, which cannot be positively influenced either by interactions with acquaintances or co-members from voluntary associations, who probably do not belong to disrespected groups. In this case, even volunteering experience does not help, inferring that for some respondents respect for all people is a norm, while in the case of others, disrespected groups are beyond the radius of common fundamental values [22]. At the same time, also opposite to the expectations, an increase in the family and friends network did not enhance disrespect for some groups of people, and this is an optimistic finding. An interesting result is connected with improvement of respect for all groups of people and increase in the belief that other are helpful, observed for analyzed sample of Poles between 2011 and 2015. However, explanation of these effects is beyond the scope of this study and needs further research.
The current study has some limitations. The analyses presented do not determine causality, as changes in dependent variables are taking place in the same period as changes in independent variables [54] (p. 6). It was possible to use lagged independent variables, but this would shorten the panel to two waves of observations, because of a lack of measurement of informal networks in 2009. Additionally, it can be argued that the effects of participation on social trust, if they exist, appear earlier than two years after joining an organization or enlarging the informal social network. This intuition is confirmed by results for the parent sample from the Michigan Socialization Studies, in which case the simultaneous effects of participation on trust were significant, while the lagged effects were not [31]. By both controlling the differences between respondents and including a set of potential time-variant variables that could have affected the change in social trust and respect to others, it can be carefully deduced that the observed correlations between variables, conditioned on the respondents’ histories, indicate the effect of participation on trust and not vice versa. The additional limitation is that the fixed-effect panel models’ results are conditioned on the effects observed in the sample and therefore cannot be generalized out of the sample [56] (pp. 48–49).
Future research is needed to further explore the relationship between participation and social trust within different cultural settings in order to confirm if there are any general patterns operating in diverse environments. It would also be beneficial to use longer panels with a longer history of individuals’ changes regarding participation and trust. An especially promising direction of future research is based on the possibility of including more variables regarding the diversity and structure of social networks. In order to do so, it is necessary to obtain data on characteristics (attributes) of all ego network members and network data enabling calculations of brokerage and closure measures.
Funding
This research was funded by National Science Centre, Poland, grant number 2016/21/D/HS4/00705. As such it is a part of research grant titled “Mechanisms of creating social capital—analysis on the basis of Polish empirical examples” and carried out at Faculty of Economic Sciences, University of Warsaw.
Acknowledgments
I would like to thank Anna Gerus for her technical support in retrieving and preparing data for the analysis. I also thank anonymous reviewers for their constructive feedback which helped me to improve my paper.
Conflicts of Interest
The author declares no conflict of interest.
References
- Fukuyama, F. Trust: The Social Virtues and the Creation of Prosperity; Free Press: New York, NY, USA, 1995; pp. 3–49. [Google Scholar]
- Knack, S.; Keefer, P. Does Social Capital have an economic payoff? A cross-country investigation. Q. J. Econ. 1997, 112, 1251–1288. [Google Scholar] [CrossRef]
- Woolcock, M. Social Capital and Economic Development: Toward a Theoretical Synthesis and Policy Framework. Theor. Soc. 1998, 27, 151–208. [Google Scholar] [CrossRef]
- Garrigos-Simon, F.J.; Botella-Carrubi, M.D.; Gonzalez-Cruz, T.F. Social Capital, Human Capital, and Sustainability: A Bibliometric and Visualization Analysis. Sustainability 2018, 10, 4751. [Google Scholar] [CrossRef]
- Boyle, D.; Simms, A. The New Economics: A Bigger Picture; Earthscan: London, UK, 2009; pp. 1–16. [Google Scholar]
- Dale, A.; Onyx, J.A. Dynamic Balance: Social Capital and Sustainable Community Development; UBC Press: Vancouver, BC, Canada, 2005; pp. 13–32, 71–86. [Google Scholar]
- Dale, A.; Newman, L. Social capital: A necessary and sufficient condition for sustainable community development? Com. Dev. J. 2010, 45, 5–21. [Google Scholar] [CrossRef]
- Pierce, J.; Lovrich, N.; Johnson, B.; Reames, T.; Budd, W. Social Capital and Longitudinal Change in Sustainability Plans and Policies: U.S. Cities from 2000 to 2010. Sustainability 2014, 6, 136–157. [Google Scholar] [CrossRef]
- Ostrom, E. Analyzing collective action. Agric. Econ. 2010, 41, 155–166. [Google Scholar] [CrossRef] [Green Version]
- Dietz, T.; Ostrom, E.; Stern, P.C. The struggle to govern the commons. Science 2003, 302, 1907–1912. [Google Scholar] [CrossRef]
- Ostrom, E. A general framework for analyzing sustainability of social-ecological systems. Science 2009, 325, 419–422. [Google Scholar] [CrossRef]
- Pretty, J.; Ward, H. Social capital and the environment. World Dev. 2001, 29, 209–227. [Google Scholar] [CrossRef]
- Adger, W.N. Social capital, collective action and adaptation to climate change. Econ. Geogr. 2003, 79, 387–404. [Google Scholar] [CrossRef]
- Prell, C.; Reed, M.; Hubacek, K. Social network analysis for stakeholder selection and the links to social learning and adaptive co-management. In Networks and Natural Resource Management: Uncovering the Social Fabric of Environmental Governance; Bodin, Ö., Prell, C., Eds.; Cambridge University Press: Cambridge, UK, 2011; pp. 95–118. [Google Scholar]
- Folke, C.; Hahn, T.; Olsson, P.; Norberg, J. Adaptive governance of social-ecological systems. Annu. Rev. Environ. Resour. 2005, 30, 441–473. [Google Scholar] [CrossRef]
- Onyx, J.; Osburn, L.; Bullen, P. Response to the environment: Social capital and sustainability. Australas. J. Environ. Manag. 2004, 11, 212–219. [Google Scholar] [CrossRef]
- Liu, J.; Qu, H.; Huang, D.; Chen, G.; Yue, X.; Zhao, X.; Liang, Z. The role of social capital in encouraging residents’ pro-environmental behaviors in community-based ecotourism. Tour. Manag. 2014, 41, 190–201. [Google Scholar] [CrossRef]
- Putnam, R.D. Bowling alone: The Collapse and the Revival of American Community; Simon and Schuster: New York, NY, USA, 2000; pp. 31–148, 219–325. [Google Scholar]
- Putnam, R.D. Making Democracy Work, Civic Traditions in Modern Italy; Princeton University Press: Princeton, NJ, USA, 1993; pp. 163–181. [Google Scholar]
- Freitag, M.; Bauer, P.C. Testing for Measurement Equivalence in Surveys: Dimensions of Social Trust across Cultural Contexts. Public. Opin. Quart. 2013, 77, 24–44. [Google Scholar] [CrossRef]
- Paldam, M. Social Capital: One or Many? Definition and Measurement. J. Econ. Surv. 2000, 14, 629–653. [Google Scholar] [CrossRef]
- Uslaner, E. The Moral Foundations of Trust; Cambridge University Press: Cambridge, UK, 2002; pp. 1–50, 115–159. [Google Scholar]
- Bourdieu, P. The forms of capital. In Handbook of Theory of Research for the Sociology of Education; Richardson, J.G., Ed.; Greenwood Press: New York, NY, USA, 1986; pp. 241–258. [Google Scholar]
- Lin, N. Social Capital: A Theory of Social Structure and Action; Cambridge University Press: Cambridge, UK, 2001; pp. 19–28. [Google Scholar]
- Dasgupta, P. The Economics of Social Capital. Econ. Rec. 2005, 81, S2–S21. [Google Scholar] [CrossRef]
- Bodin, Ö.; Crona, B.I. Friends or neighbors? Subgroup heterogeneity and the importance of bonding and bridging ties in natural resource governance. In Networks and Natural Resource Management: Uncovering the Social Fabric of Environmental Governance; Bodin, Ö., Prell, C., Eds.; Cambridge University Press: Cambridge, UK, 2011; pp. 206–233. [Google Scholar]
- Glaeser, L. The Formation of Social Capital. Can. J. Pol. Res. 2001, 2, 34–40. [Google Scholar]
- Sabatini, F. Social capital as social networks: A new framework for measurement and an empirical analysis of its determinants and consequences. J. Socio-Econ. 2009, 38, 429–442. [Google Scholar] [CrossRef]
- Granovetter, M. The Strength of Weak Ties. Am. J. Sociol. 1973, 78, 1360–1380. [Google Scholar] [CrossRef]
- Brehm, J.; Rahn, W. Individual-Level Evidence for the Causes and Consequences of Social Capital. Am. J. Political Sci. 1997, 41, 99–1023. [Google Scholar] [CrossRef]
- Claibourn, M.P.; Martin, P.S. Trusting and Joining? An Empirical Test of the Reciprocal Nature of Social Capital. Political Behav. 2000, 22, 267–291. [Google Scholar] [CrossRef]
- Park, C.; Subramanian, S.V. Voluntary Association Membership and Social Cleavages: A Micro-Macro Link in Generalized Trust. Soc. Forces 2012, 90, 1183–1205. [Google Scholar] [CrossRef]
- Wollebćk, D.; Selle, P. Participation and Social Capital Formation: Norway in a Comparative Perspective. Scand. Political Stud. 2003, 26, 67–91. [Google Scholar] [CrossRef]
- Bernhard, H.; Fehr, E.; Fischbacher, U. Group affiliation and altruistic norm enforcement. Am. Econ. Rev. 2006, 96, 217–221. [Google Scholar] [CrossRef]
- Goette, L.; Huffman, D.; Meier, S. The impact of group membership on cooperation and norm enforcement: Evidence using random assignment to real social groups. Am. Econ. Rev. 2006, 96, 212–216. [Google Scholar] [CrossRef]
- Paxton, P. Association Memberships and Generalized Trust: A Multilevel Model across 31 Countries. Soc. Forces 2007, 86, 47–76. [Google Scholar] [CrossRef]
- Stolle, D. Bowling Together, Bowling Alone: The Development of Generalized Trust in Voluntary Associations. Political Psychol. 1998, 19, 497–524. [Google Scholar] [CrossRef]
- Delhey, J.; Newton, K. Who Trusts? The Origins of Social Trust in Seven Nations. Eur. Soc. 2003, 5, 1–45. [Google Scholar] [CrossRef]
- Growiec, K. Związek miedzy sieciami społecznymi a zaufaniem społecznym—Mechanizm wzajemnego wzmacniania? (The relation between social capital and social trust—A self-fulfilling prophecy?). Psychol. Społeczna 2009, 4, 55–66. [Google Scholar]
- Uslaner, E.M.; Brown, M. Inequality, Trust, and Civic Engagement. Am. Political Res. 2005, 33, 868–894. [Google Scholar] [CrossRef]
- Sønderskov, K.M. Does Generalized Social Trust Lead to Associational Membership? Unravelling a Bowl of Well-Tossed Spaghetti. Eur. Sociol. Rev. 2011, 27, 419–434. [Google Scholar] [CrossRef]
- Rice, T.W.; Feldman, J.L. Civic Culture and Democracy from Europe to America. J. Political 1997, 59, 1143–1172. [Google Scholar] [CrossRef]
- Tabellini, G. The scope of cooperation: Values and incentives. Q. J. Econ. 2008, 123, 905–950. [Google Scholar] [CrossRef]
- Uslaner, E. Where you stand depends on where your grandparents sat: The inheritability of generalized trust. Public Opin. Quart. 2008, 72, 725–740. [Google Scholar] [CrossRef]
- Freitag, M. Beyond Tocqueville: The Origins of Social Capital in Switzerland. Eur. Sociol. Rev. 2003, 19, 217–232. [Google Scholar] [CrossRef] [Green Version]
- Huang, J.; Brink, H.M.; Groot, W. Does education promote social capital? Evidence from IV analysis and nonparametric-bound analysis. Empir. Econ. 2012, 42, 1011–1034. [Google Scholar] [CrossRef]
- Sturgis, P.; Read, S.; Hatemi, P.K.; Zhu, G.; Trull, T.; Wright, M.J. A Genetic Basis for Social Trust? Political Behav. 2010, 32, 205–230. [Google Scholar] [CrossRef]
- Burt, R.S. Brokerage and Closure. An Introduction to Social Capital; Oxford University Press: Oxford, UK, 2005; pp. 4–5, 10–28, 93–223. [Google Scholar]
- Markowska-Przybyła, U.; Ramsey, D.M. Social Capital and Polish Students’ Behaviour in Experimental Games Designed to Illustrate Cooperation. Econ. Sociol. 1015, 8, 191–206. [Google Scholar] [CrossRef]
- Coleman, J.S. Social Capital in the Creation of Human Capital. Am. J. Sociol. 1988, 94, S95–S120. [Google Scholar] [CrossRef] [Green Version]
- Ziller, C. Ethnic Diversity, Economic and Cultural Contexts, and Social Trust: Cross-Sectional and Longitudinal Evidence from European Regions, 2002–2010. Soc. Forces 2015, 93, 1211–1240. [Google Scholar] [CrossRef]
- González-Bailón, S. The role of Dynamic Networks in Social Capital: A Simulation Experiment. Pap. Rev. Sociol. 2006, 80, 171–194. [Google Scholar] [CrossRef]
- Sztompka, P. Trust and Emerging Democracy: Lessons from Poland. Int. Sociol. 1996, 11, 37–62. [Google Scholar] [CrossRef]
- Andreß, H.J.; Golsch, K.; Schmidt, A.W. Applied Panel Data Analysis for Economic and Social Surveys; Springer: Heidelberg, Germany, 2013; pp. 1–12, 192–201, 203–286. [Google Scholar]
- Baltagi, B.H. Econometric Analysis of Panel Data, 5th ed.; Wiley: Chichester, UK, 2013; pp. 1–11, 239–271. [Google Scholar]
- Hsiao, C. Analysis of Panel Data, 3rd ed.; Cambridge University Press: Cambridge, UK, 2014; pp. 1–16, 230–280. [Google Scholar]
- Glanville, J.L.; Andersson, M.A.; Paxton, P. Do Social Connections Create Trust? An Examination Using New Longitudinal Data. Soc. Forces 2013, 92, 545–562. [Google Scholar] [CrossRef]
- Sturgis, P.; Patulny, R.; Allum, N.; Buscha, F. Social Connectedness and Generalized Trust: A Longitudinal Perspective. ISER Working Paper Series. 2012. No. 2012-19. Available online: http://hdl.handle.net/10419/65913 (accessed on 20 December 2018).
- Growiec, J.; Growiec, K. Social capital, well-being, and earnings: Theory and evidence from Poland. Eur. Soc. 2010, 12, 231–255. [Google Scholar] [CrossRef]
- Letki, N.; Evans, G. Endogenizing Social Trust: Democratization in East-Central Europe. Brit. J. Political Sci. 2005, 35, 515–529. [Google Scholar] [CrossRef]
- Cameron, A.C.; Trivedi, P.K. Microeconometrics Using Stata, Revised Edition; Stata Press: College Station, TX, USA, 2010; pp. 266–268, 330–335, 621–631. [Google Scholar]
- Rabe-Hesketh, S.; Skrondal, A. Multilevel and Longitudinal Modeling Using Stata, Volume II: Categorical Responses, Counts, and Survival, 3rd ed.; Stata Press: College Station, TX, USA, 2012; pp. 501–574. [Google Scholar]
- Council for Social Monitoring. Social Diagnosis, Questionnairs 2011. Available online: www.diagnoza.com (accessed on 12 November 2018).
- Council for Social Monitoring. Social Diagnosis, Questionnairs 2013. Available online: www.diagnoza.com (accessed on 12 November 2018).
- Council for Social Monitoring. Social Diagnosis, Questionnairs 2015. Available online: www.diagnoza.com (accessed on 12 November 2018).
- Council for Social Monitoring. Integrated Database 2011. Available online: www.diagnoza.com (accessed on 10 December 2018).
- Council for Social Monitoring. Integrated Database 2013. Available online: www.diagnoza.com (accessed on 10 December 2018).
- Council for Social Monitoring. Integrated Database 2015. Available online: www.diagnoza.com (accessed on 10 December 2018).
- Panek, T.; Czapiński, J.; Kotowska, I.E. The research method. Social Diagnosis 2015, the Objective and Subjective Quality of Life in Poland. Contemp. Econ. 2015, 9, 24–33. [Google Scholar] [CrossRef]
- Alesina, A.; Ferrara, E. Who Trusts Others? J. Public Econ. 2002, 85, 207–234. [Google Scholar] [CrossRef]
- Williamson, O.E. The Economic Institutions of Capitalism: Firms, Markets, Relational Contracting; Free Press: New York, NY, USA, 1985; pp. 30–32. [Google Scholar]
- Delhey, J.; Newton, K.; Welzelc, C. How General Is Trust in “Most People”? Solving the Radius of Trust Problem. Am. Sociol. Rev. 2011, 76, 786–807. [Google Scholar] [CrossRef]
- Uebersax, J.S. The Tetrachoric and Polychoric Correlation Coefficients. Statistical Methods for Rater Agreement. Available online: http://www.john-uebersax.com/stat/tetra.htm (accessed on 3 December 2018).
- Granberry, P.J.; Marcelli, E.A. “In the Hood and on the Job”: Social Capital Accumulation among Legal and Unauthorized Mexican Immigrants. Sociol. Perspect. 2007, 50, 579–595. [Google Scholar] [CrossRef]
- Mokken, R.J.; Lewis, C. A nonparametric approach to the analysis of dichotomous item responses. Appl. Psychol. Meas. 1982, 6, 417–430. [Google Scholar] [CrossRef]
- Sijtsma, K. Item Scores Methodology Review: Nonparametric IRT Approaches to the Analysis of Dichotomous. Appl. Psychol. Meas. 1998, 22, 3–31. [Google Scholar] [CrossRef]
Figure 1.
Generalized trust versus the belief that other are helpful. Source: author’s calculation.

Figure 2.
Lack of respect for some groups of people versus the belief that others are helpful. Source: author’s calculation.
Figure 2.
Lack of respect for some groups of people versus the belief that others are helpful. Source: author’s calculation.

Figure 3.
Generalized trust, belief that others are helpful, and no respect for some people in the case of members of charity organizations compared to members of other organizations. Source: author’s calculation.
Figure 3.
Generalized trust, belief that others are helpful, and no respect for some people in the case of members of charity organizations compared to members of other organizations. Source: author’s calculation.

Figure 4.
Generalized trust, the belief that others are helpful, and no respect for some people in the case of members of religious organizations versus members of other organizations. Source: author’s calculation.
Figure 4.
Generalized trust, the belief that others are helpful, and no respect for some people in the case of members of religious organizations versus members of other organizations. Source: author’s calculation.

Figure 5.
Generalized trust, the belief that others are helpful, and no respect for some people in the case of the members of interest clubs and unions versus members of other organizations. Source: author’s calculation.
Figure 5.
Generalized trust, the belief that others are helpful, and no respect for some people in the case of the members of interest clubs and unions versus members of other organizations. Source: author’s calculation.

Figure 6.
Average sizes of family and friends, and acquaintances networks versus the level of heterogeneity of social ties. Source: author’s calculation
Figure 6.
Average sizes of family and friends, and acquaintances networks versus the level of heterogeneity of social ties. Source: author’s calculation


Table 1.
Tetrachoric correlations between dependent variables’ scores in 2011.
| Generalized Trust | Others are Helpful | No Respect to Some People | |
|---|---|---|---|
| generalized trust | 1 | ||
| others are helpful | 0.23 *** | 1 | |
| no respect to some people | −0.03 * | 0.11 *** | 1 1 |
Source: author’s calculation 1 p < 0.1; ** p < 0.05; *** p < 0.01, n = 13,031.
Table 2.
Tetrachoric correlations between dependent variables’ scores in 2013.
| Generalized Trust | Others are Helpful | No Respect to Some People | |
|---|---|---|---|
| generalized trust | 1 | ||
| others are helpful | 0.12 *** | 1 | |
| no respect to some people | −0.02 | 0.08 *** | 1 1 |
Source: author’s calculation 1 p < 0.1; ** p < 0.05; *** p < 0.01, n = 17,402.
Table 3.
Tetrachoric correlations between dependent variables’ scores in 2015.
| Generalized Trust | Others are Helpful | No Respect to Some People | |
|---|---|---|---|
| generalized trust | 1 | ||
| others are helpful | 0.18 *** | 1 | |
| no respect to some people | −0.01 | 0.09 *** | 1 1 |
Source: author’s calculation 1 p < 0.1; ** p < 0.05; *** p < 0.01, n = 15,028.
Table 4.
Tetrachoric correlations between dependent variables’ scores and different measures of diversity in informal social networks (2015).
Table 4.
Tetrachoric correlations between dependent variables’ scores and different measures of diversity in informal social networks (2015).
| General Trust | Others Are Helpful | No Respect | Different Age | Different Political Opinions | Different Wealth | Different Interests | Different Cuisine | |
|---|---|---|---|---|---|---|---|---|
| general trust | 1 | |||||||
| others are helpful | 0.01 | 1 | ||||||
| no respect | 0.18 *** | 0.09 *** | 1 | |||||
| different age | 0.07 *** | 0.03 ** | 0.06 *** | 1 | ||||
| different political opinions | 0.15 *** | −0.02 | −0.08 *** | 0.61 *** | 1 | |||
| different wealth | 0.07 *** | 0.02 | −0.01 | 0.68 *** | 0.75 *** | 1 | ||
| different interests | 0.10 *** | −0.04 *** | −0.06 *** | 0.54 *** | 0.80 *** | 0.78 *** | 1 | |
| different cuisine | 0.09 *** | −0.03 ** | −0.06 *** | 0.51 *** | 0.77 *** | 0.75 *** | 0.92 *** | 1 |
Source: author’s calculation 1 p < 0.1; ** p < 0.05; *** p < 0.01, n = 14,897.
Table 5.
Within- and between-person heterogeneity in data—descriptive statistics.
| Variable | Mean | Standard Deviation | Min | Max | Observations | |
|---|---|---|---|---|---|---|
| generalized trust (binary) | overall | 0.16 | 0.36 | 0.00 | 1.00 | N = 45,600 |
| between | 0.30 | 0.00 | 1.00 | n = 20,502 | ||
| within | 0.22 | −0.51 | 0.82 | T-bar = 2.22 | ||
| others are helpful (binary) | overall | 0.34 | 0.47 | 0.00 | 1.00 | N = 50,508 |
| between | 0.37 | 0.00 | 1.00 | n = 21,070 | ||
| within | 0.32 | −0.32 | 1.01 | T-bar = 2.40 | ||
| no respect to some people (binary) | overall | 0.45 | 0.50 | 0.00 | 1.00 | N = 50,494 |
| between | 0.38 | 0.00 | 1.00 | n = 21,069 | ||
| within | 0.33 | −0.22 | 1.11 | T-bar = 2.40 | ||
| organizations (number of memberships) | overall | 0.18 | 0.49 | 0.00 | 3.00 | N = 50,447 |
| between | 0.43 | 0.00 | 3.00 | n = 21,078 | ||
| within | 0.25 | −1.82 | 2.18 | T-bar = 2.39 | ||
| family & friends (network size) | overall | 13.50 | 10.48 | 0.00 | 139.00 | N = 50,105 |
| between | 8.91 | 0.00 | 139.00 | n = 21,042 | ||
| within | 6.09 | −60.50 | 95.16 | T-bar = 2.38 | ||
| acquaintances (network size) | overall | 6.74 | 8.45 | 0.00 | 99.00 | N = 49,826 |
| between | 7.41 | 0.00 | 99.00 | n = 21,032 | ||
| within | 4.99 | −41.26 | 72.74 | T-bar = 2.37 | ||
| volunteering (binary) | overall | 0.24 | 0.43 | 0.00 | 1.00 | N = 50,290 |
| between | 0.34 | 0.00 | 1.00 | n = 21,068 | ||
| within | 0.27 | −0.43 | 0.90 | T-bar = 2.39 | ||
| happiness (binary) | overall | 0.81 | 0.39 | 0.00 | 1.00 | N = 50605 |
| between | 0.32 | 0.00 | 1.00 | n = 21078 | ||
| within | 0.24 | 0.14 | 1.48 | T-bar = 2.40 | ||
| education attainment (years) | overall | 11.52 | 3.39 | 0.00 | 99.00 | N = 61,916 |
| between | 3.39 | 0.00 | 99.00 | n = 23,557 | ||
| within | 0.91 | −36.48 | 59.52 | T-bar = 2.63 | ||
| personal income (Polish zloty) | overall | 1,647.26 | 1,301.11 | 0.00 | 50,000.00 | N = 40,228 |
| between | 1,252.25 | 0.00 | 32,500.00 | n = 18,441 | ||
| within | 519.94 | −15,852.74 | 19,147.26 | T-bar = 2.18 | ||
| children provided for (binary) | overall | 0.37 | 0.48 | 0.00 | 1.00 | N = 50,310 |
| between | 0.45 | 0.00 | 1.00 | n = 21,055 | ||
| within | 0.17 | −0.30 | 1.04 | T-bar = 2.39 | ||
| financial problems (binary) | overall | 0.18 | 0.38 | 0.00 | 1.00 | N = 50,212 |
| between | 0.31 | 0.00 | 1.00 | n = 21,025 | ||
| within | 0.23 | −0.49 | 0.84 | T-bar = 2.39 | ||
| health problems (binary) | overall | 0.13 | 0.34 | 0.00 | 1.00 | N = 50,530 |
| between | 0.27 | 0.00 | 1.00 | n = 21,076 | ||
| within | 0.20 | −0.54 | 0.80 | T-bar = 2.40 | ||
| victim (binary) | overall | 0.04 | 0.19 | 0.00 | 1.00 | N = 50,463 |
| between | 0.15 | 0.00 | 1.00 | n = 21,067 | ||
| within | 0.13 | −0.63 | 0.71 | T-bar = 2.40 1 |
Source: author’s calculation 1 N: number of observations (sum of all measurement occasions for all respondents), n: number of respondents, T-bar: average number of years a respondent was observed.
Table 6.
Results from the fixed-effects logistic regression models performed on observations from the three waves: 2011, 2013, and 2015.
Table 6.
Results from the fixed-effects logistic regression models performed on observations from the three waves: 2011, 2013, and 2015.
| Model 1 | Model 2 | Model 3 | |
|---|---|---|---|
| dependent variable | generalized trust | others are helpful | no respect to some people |
| no of respondents excluded due to lack of heterogeneity in dependent variable | 14,851 | 12,452 | 11,843 |
| no of observations | 6626 | 14,736 | 16,333 |
| no of respondents | 2611 | 5692 | 6304 |
| no of households | 2110 | 4095 | 4539 |
| Within-respondent effects’ parameters: | |||
| organizations | 0.06 (0.08) | −0.01 (0.05) | −0.07 (0.05) |
| family & friends | −0.01 ** (0.00) | 0.01 *** (0.00) | −0.00 (0.00) |
| acquaintances | 0.01 *** (0.00) | 0.00 (0.00) | 0.00 (0.00) |
| volunteering | 0.15 ** (0.07) | 0.14 ** (0.05) | −0.01 (0.05) |
| happiness | 0.36 *** (0.10) | 0.14** (0.06) | −0.05 (0.05) |
| education attainment | 0.04 (0.03) | 0.01 (0.02) | −0.03 * (0.02) |
| personal income | 0.00 (0.00) | −0.00 (0.00) | −0.00 (0.00) |
| children provided for | 0.02 (0.12) | 0.09 (0.08) | −0.00 (0.08) |
| financial problems | −0.10 (0.10) | −0.32 *** (0.06) | 0.06 (0.06) |
| health problems | 0.06 (0.11) | −0.06 (0.06) | 0.08 (0.06) |
| victim | −0.08 (0.16) | −0.00 (0.11) | 0.17 * (0.10) |
| time dummy 2013 | −0.21 *** (0.06) | 0.28 *** (0.04) | −0.31 *** (0.04) |
| time dummy 2015 | −0.05 (0.06) | 0.20 *** (0.04) | −0.15 *** (0.04) |
| Wald chi2(13) | 52.57 | 117.05 | 89.05 |
| Prob > chi2 | 0.00 | 0.00 | 0.00 |
| Log pseudolikelihood | −2348.77 | −5231.76 | −5826.13 1 |
Source: author’s calculation 1 p < 0.1; ** p < 0.05; *** p < 0.01, standard errors clustered in households reported in parentheses.
© 2019 by the author. Licensee MDPI, Basel, Switzerland. This article is an open access article distributed under the terms and conditions of the Creative Commons Attribution (CC BY) license (http://creativecommons.org/licenses/by/4.0/).
Share and Cite
MDPI and ACS Style
Łopaciuk-Gonczaryk, B. Does Participation in Social Networks Foster Trust and Respect for Other People—Evidence from Poland. Sustainability 2019, 11, 1733. https://doi.org/10.3390/su11061733
AMA Style
Łopaciuk-Gonczaryk B. Does Participation in Social Networks Foster Trust and Respect for Other People—Evidence from Poland. Sustainability. 2019; 11(6):1733. https://doi.org/10.3390/su11061733
Chicago/Turabian StyleŁopaciuk-Gonczaryk, Beata. 2019. "Does Participation in Social Networks Foster Trust and Respect for Other People—Evidence from Poland" Sustainability 11, no. 6: 1733. https://doi.org/10.3390/su11061733
Note that from the first issue of 2016, this journal uses article numbers instead of page numbers. See further details here.