Effects of Biochar on the Net Greenhouse Gas Emissions under Continuous Flooding and Water-Saving Irrigation Conditions in Paddy Soils


Abstract
:1. Introduction
2. Materials and Methods
2.1. Site Description
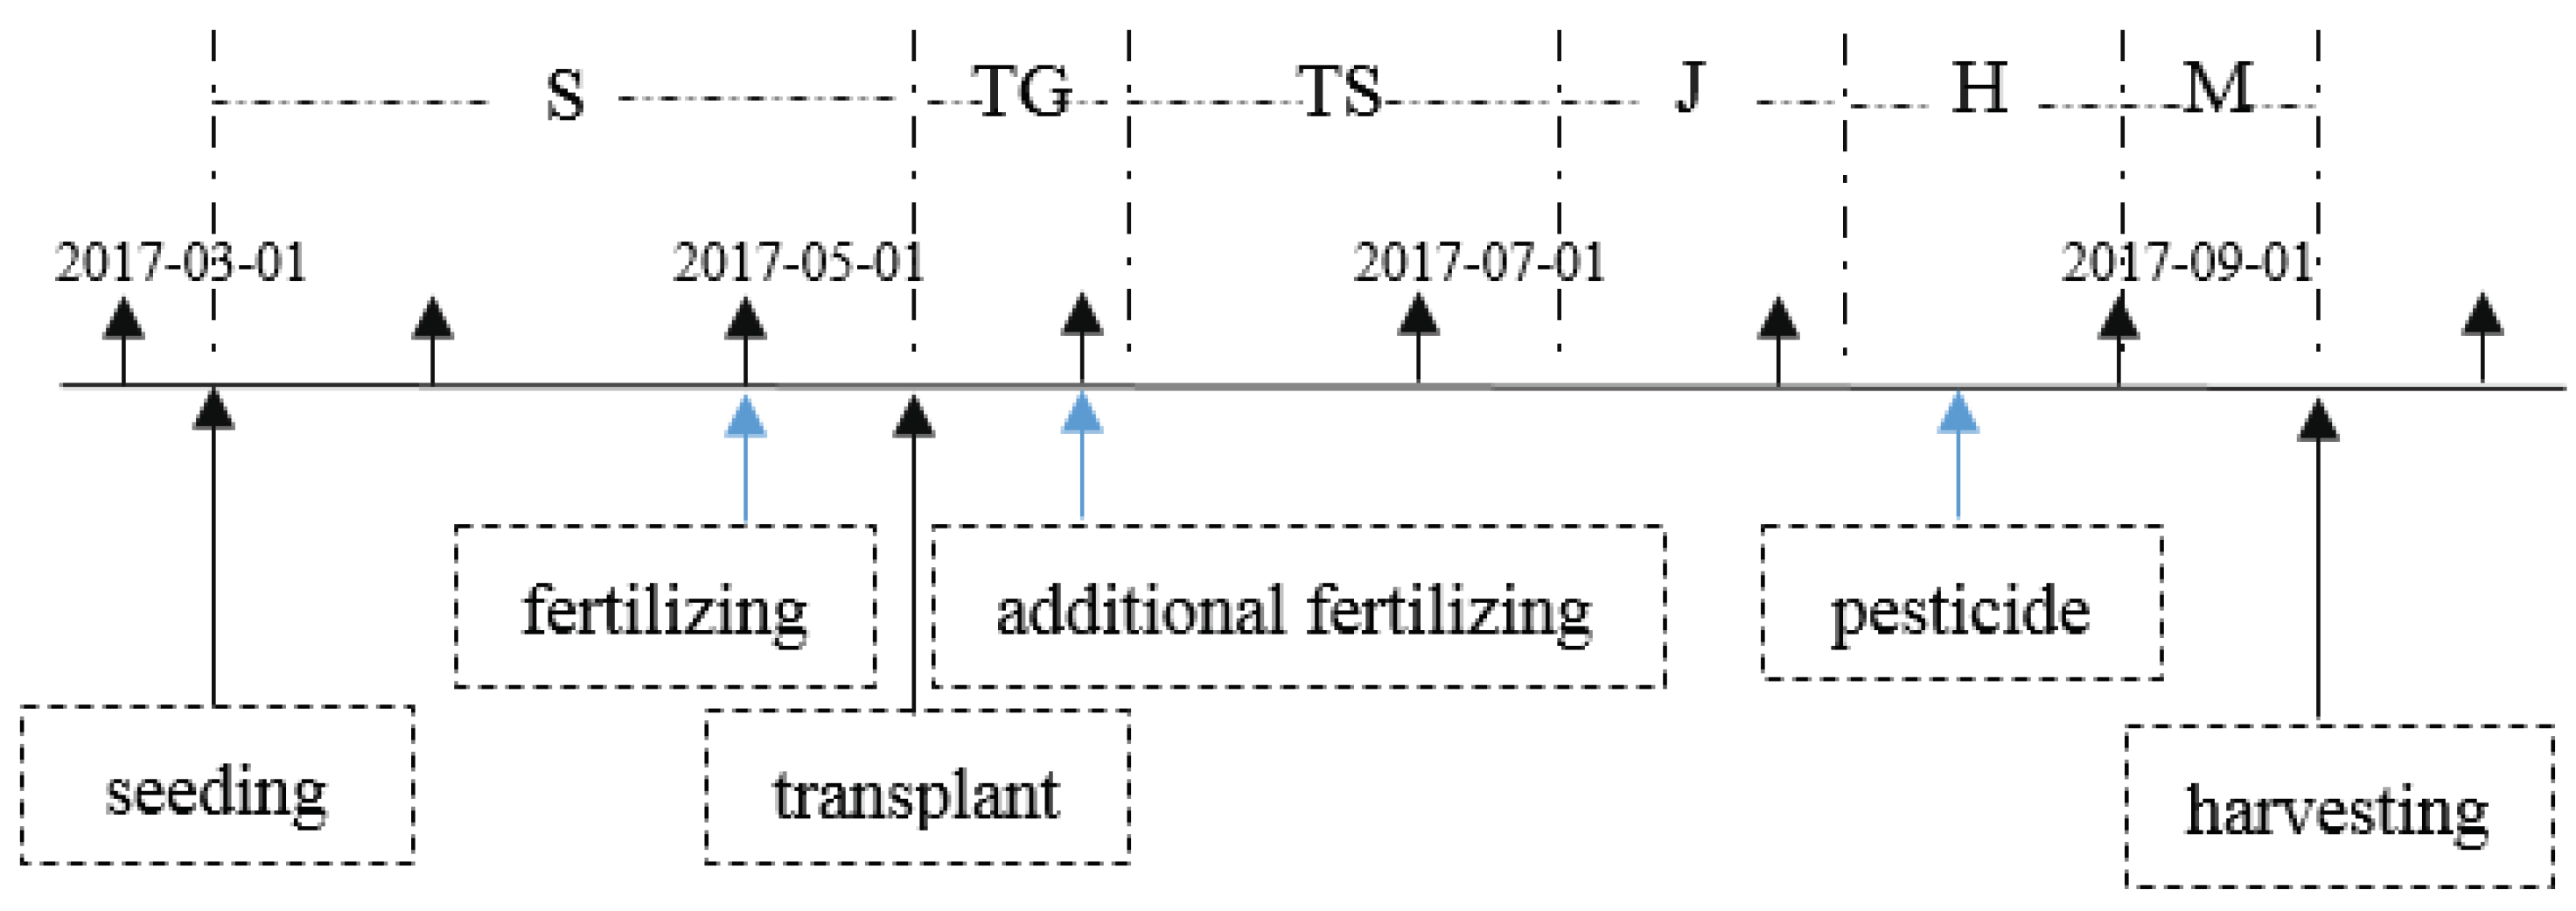
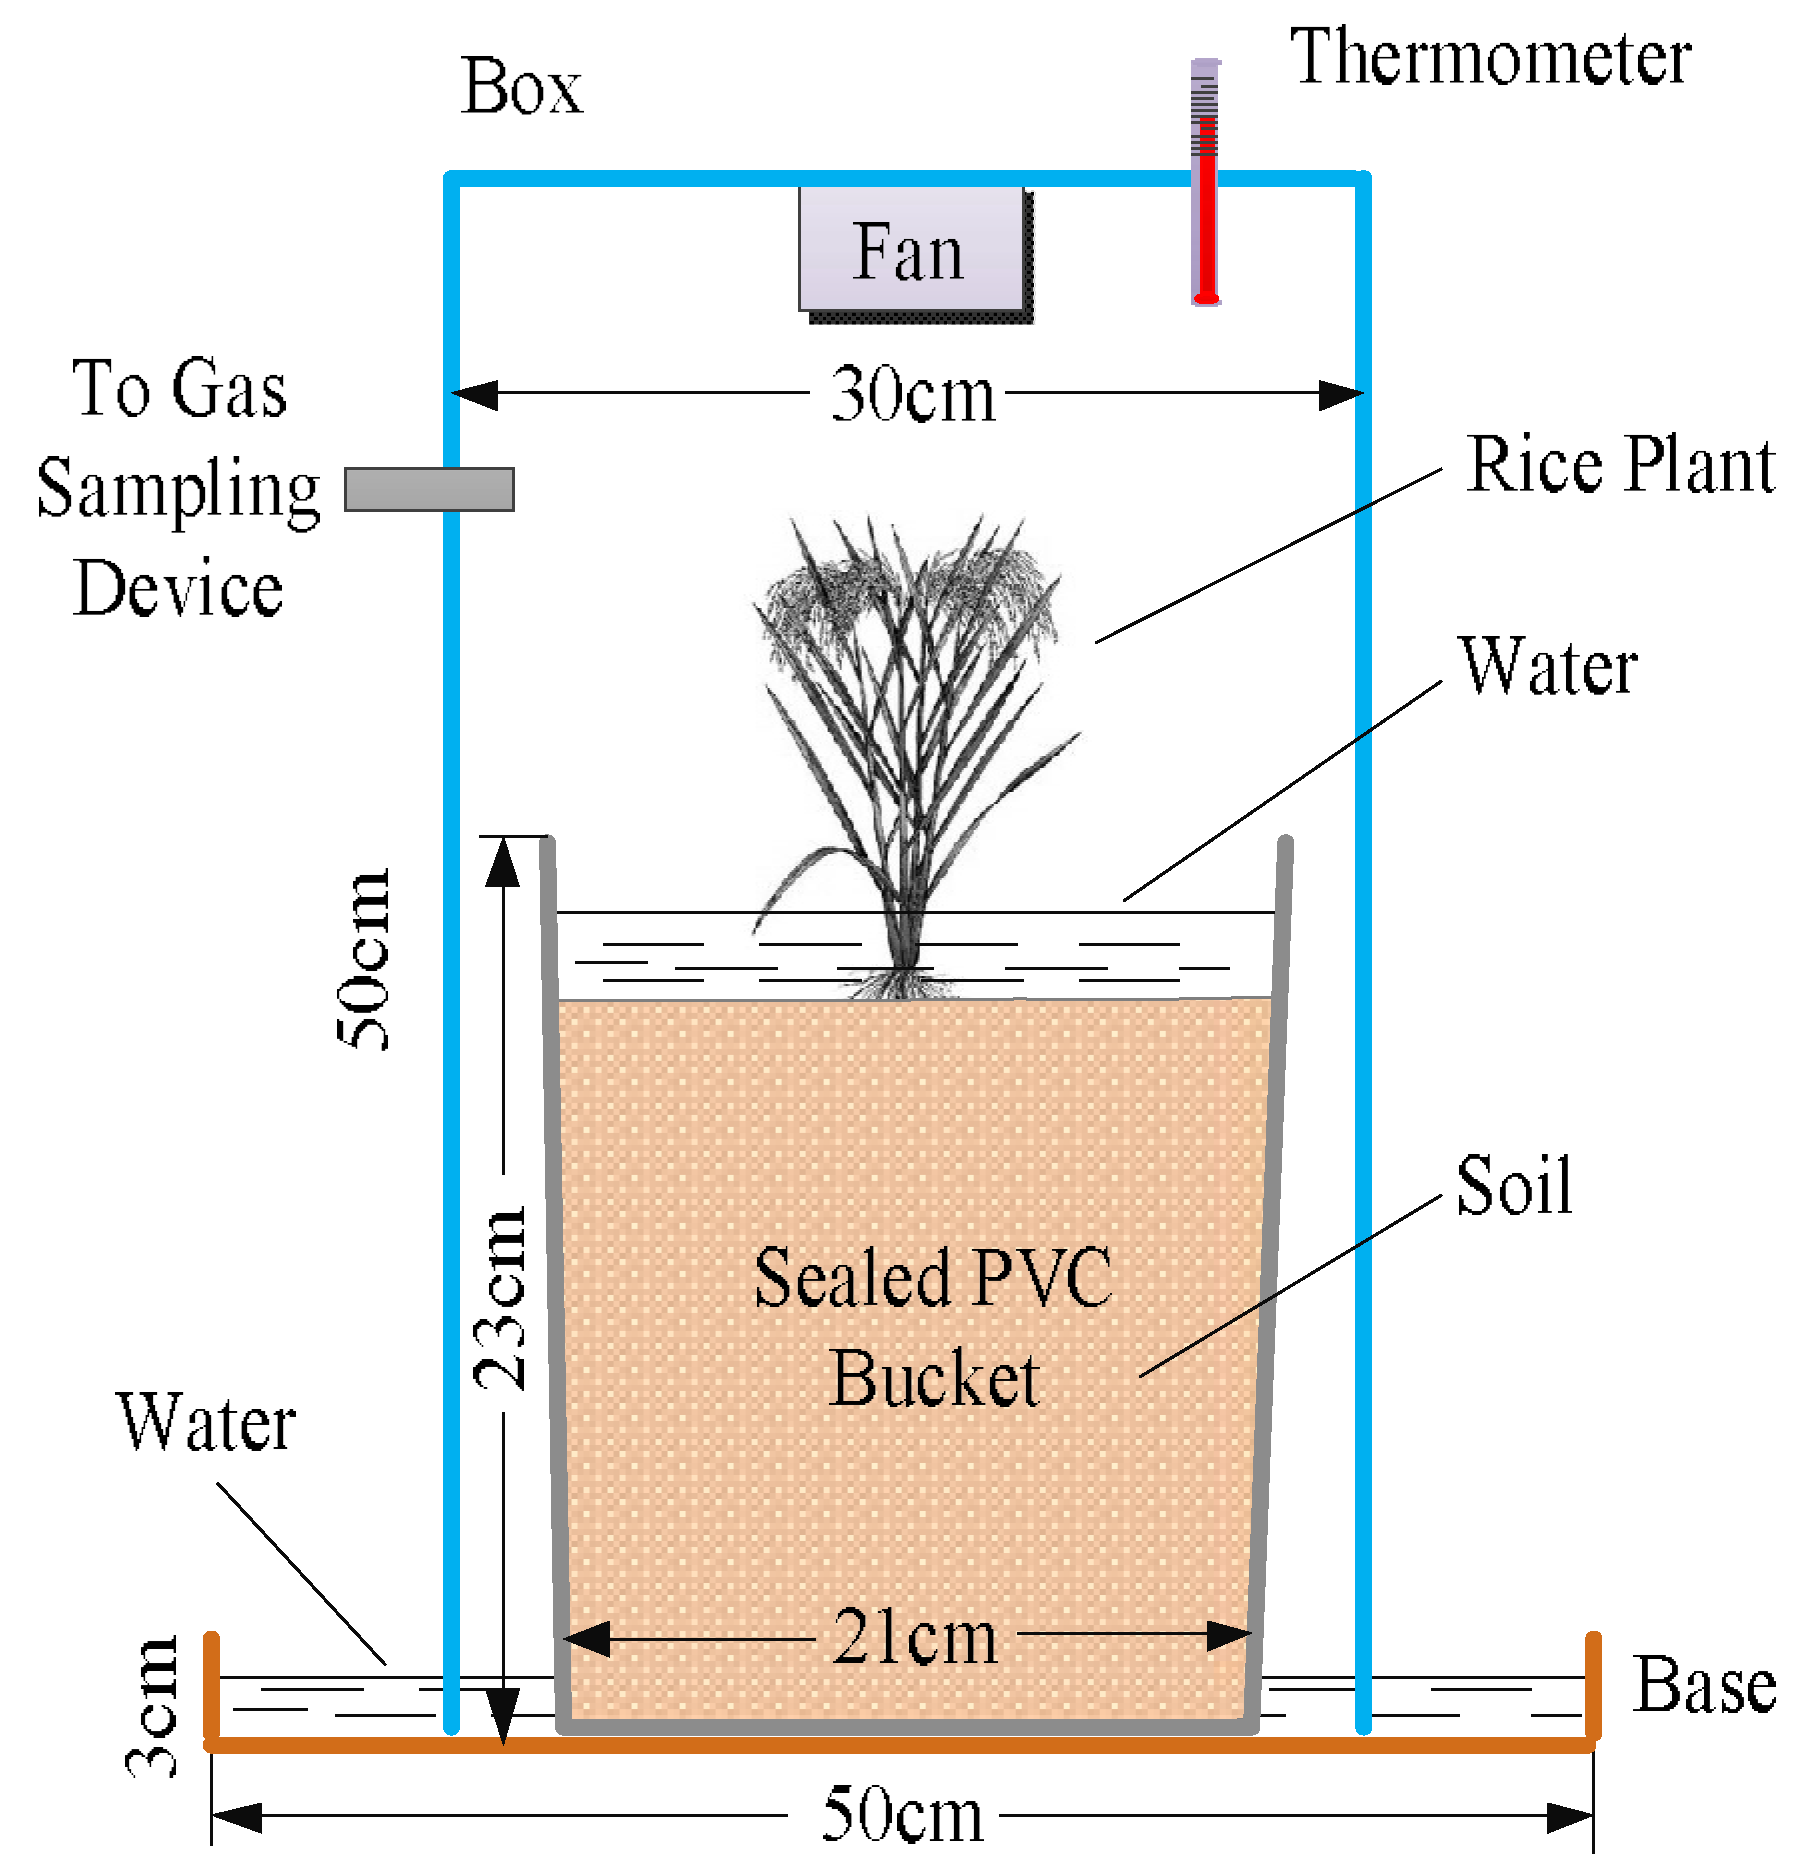
2.2. Experimental Design
2.3. Gas Sampling and Analysis
2.4. Soil Properties
2.5. Rice Organic Carbon Storage
2.6. Net Greenhouse Gas Balance
2.7. Data and Statistical Analyses
3. Results
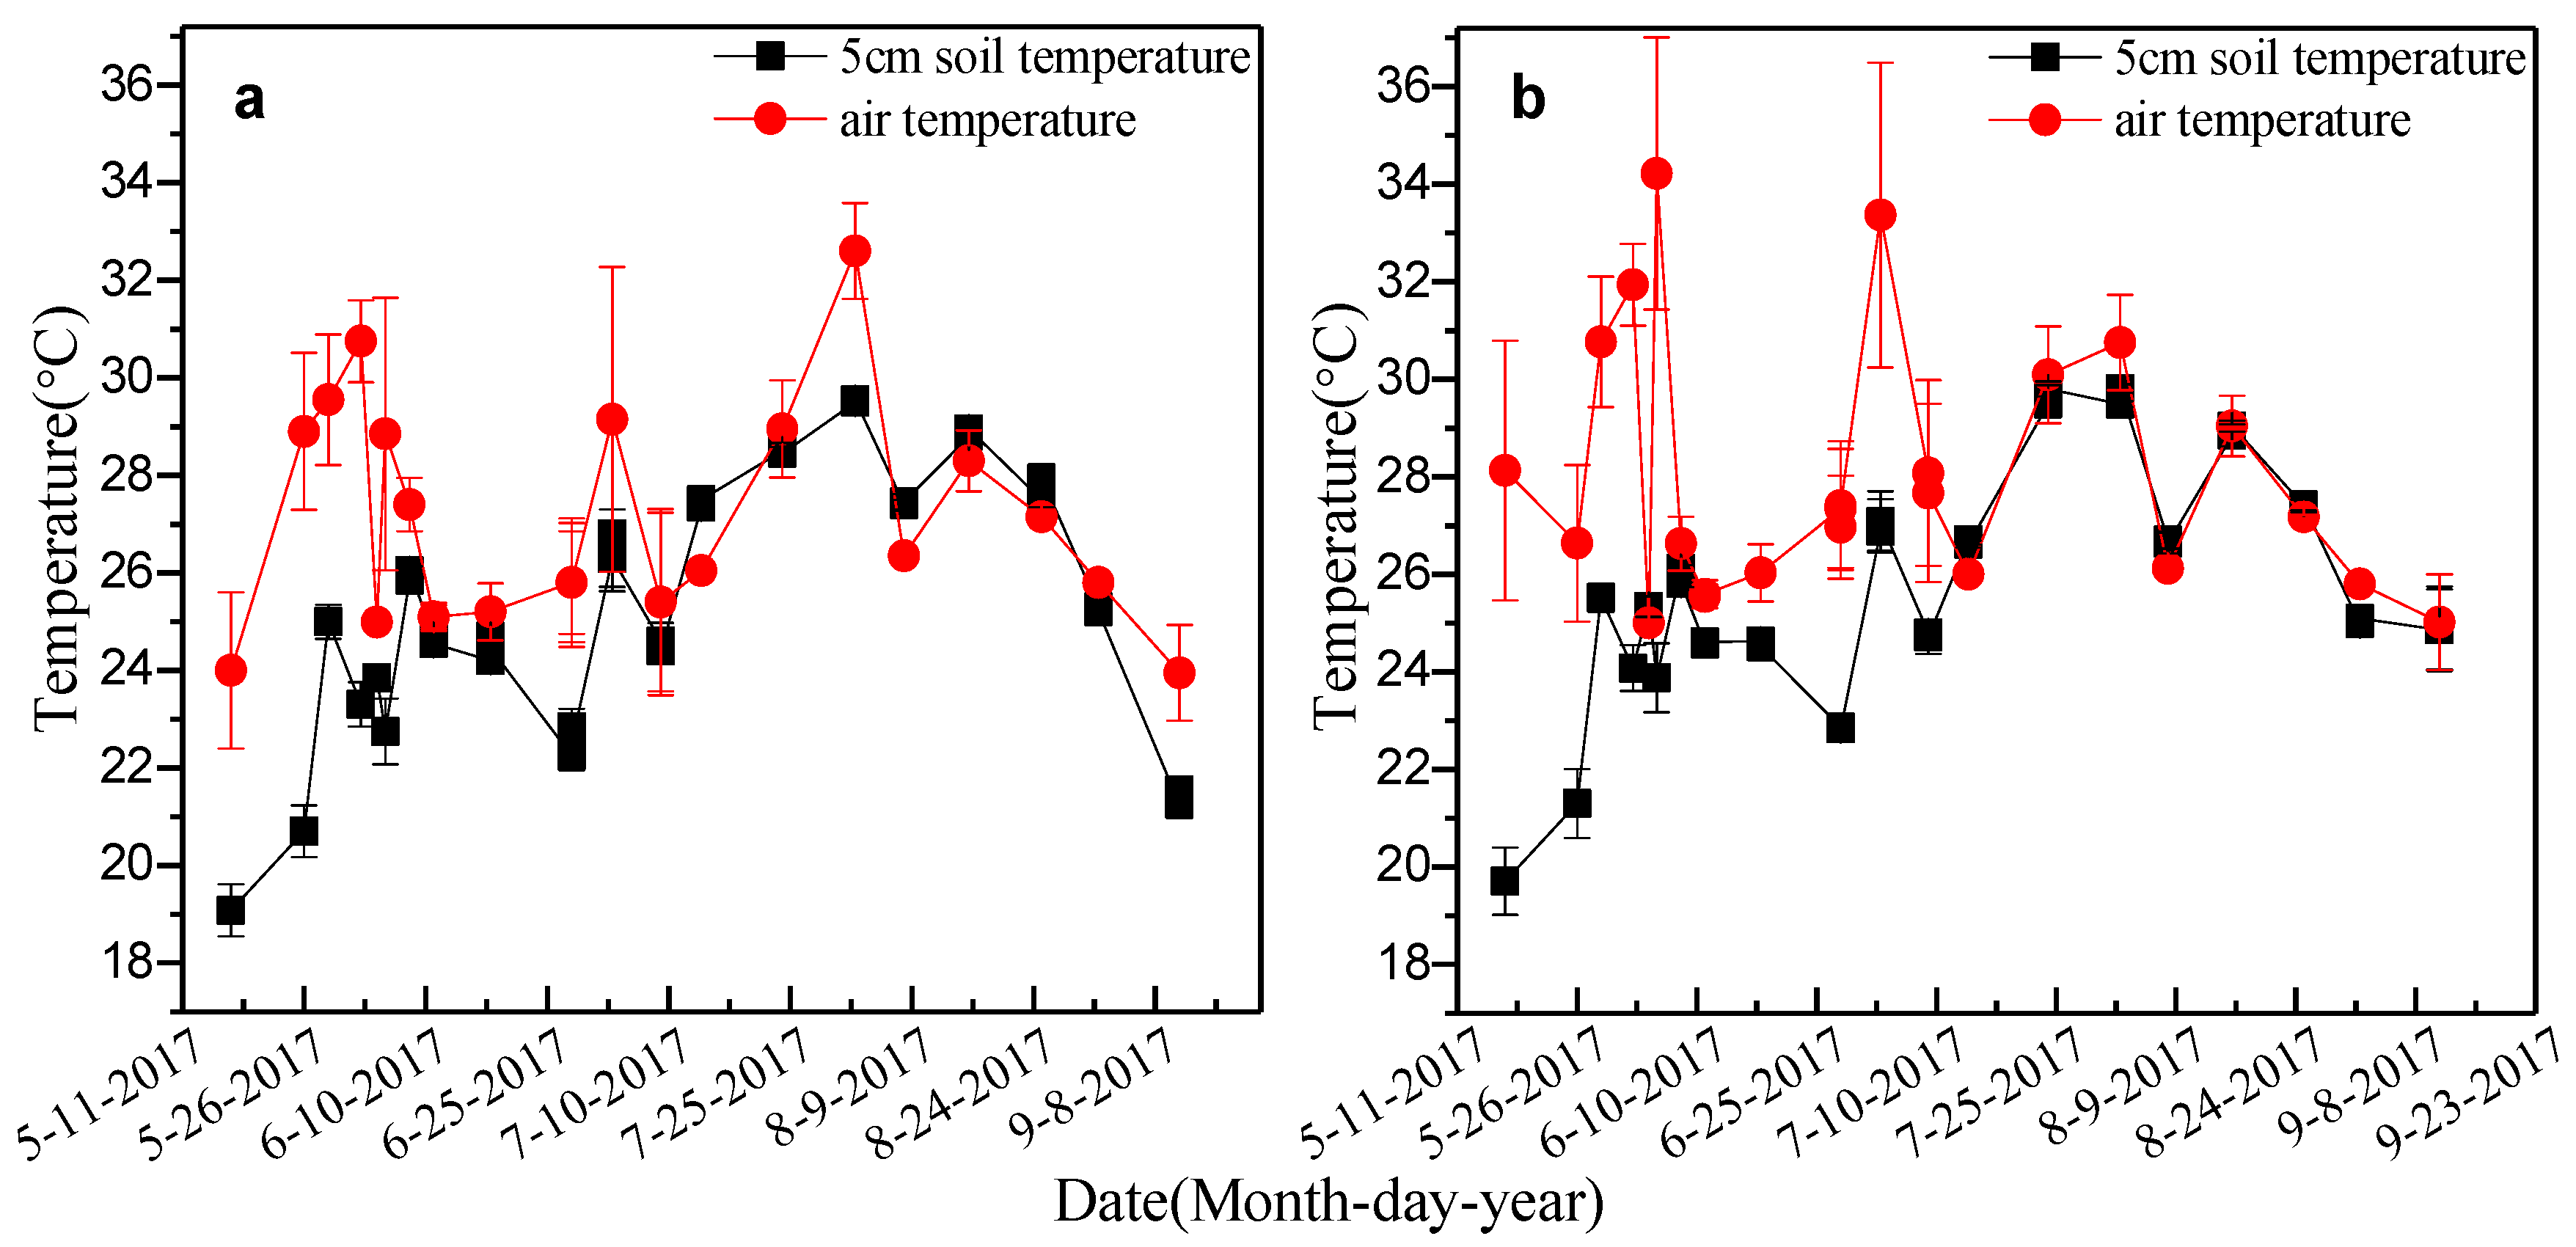
3.1. Temperature
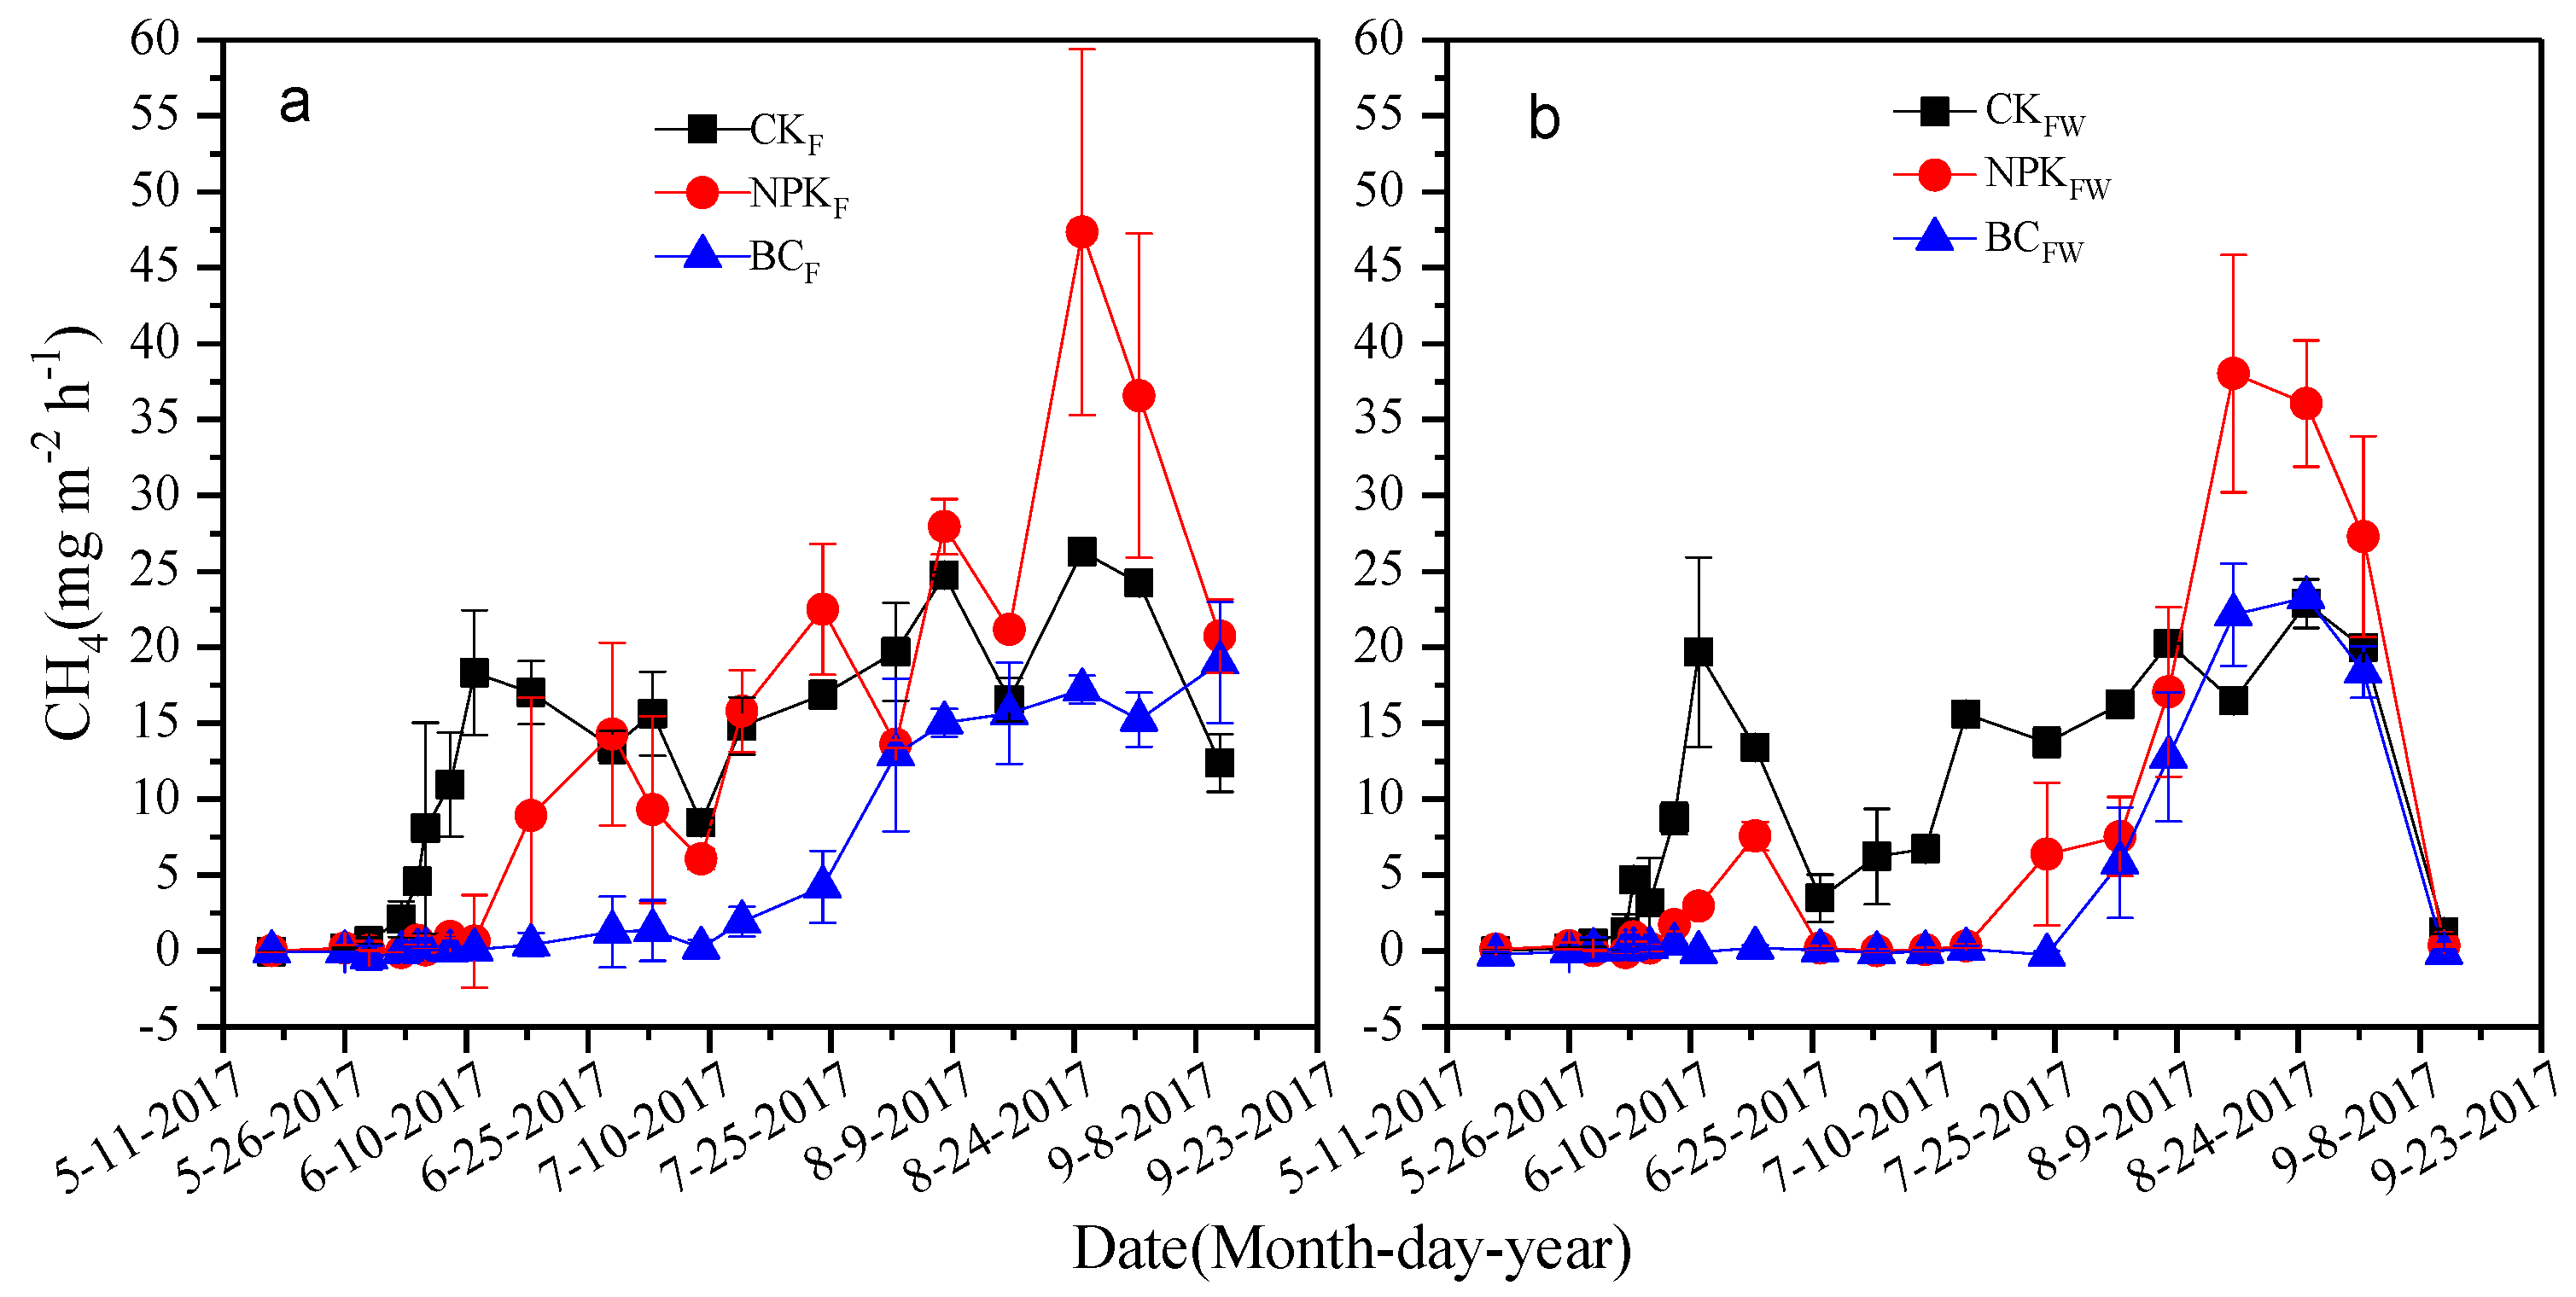
3.2. The CH4 Emissions of the Soil
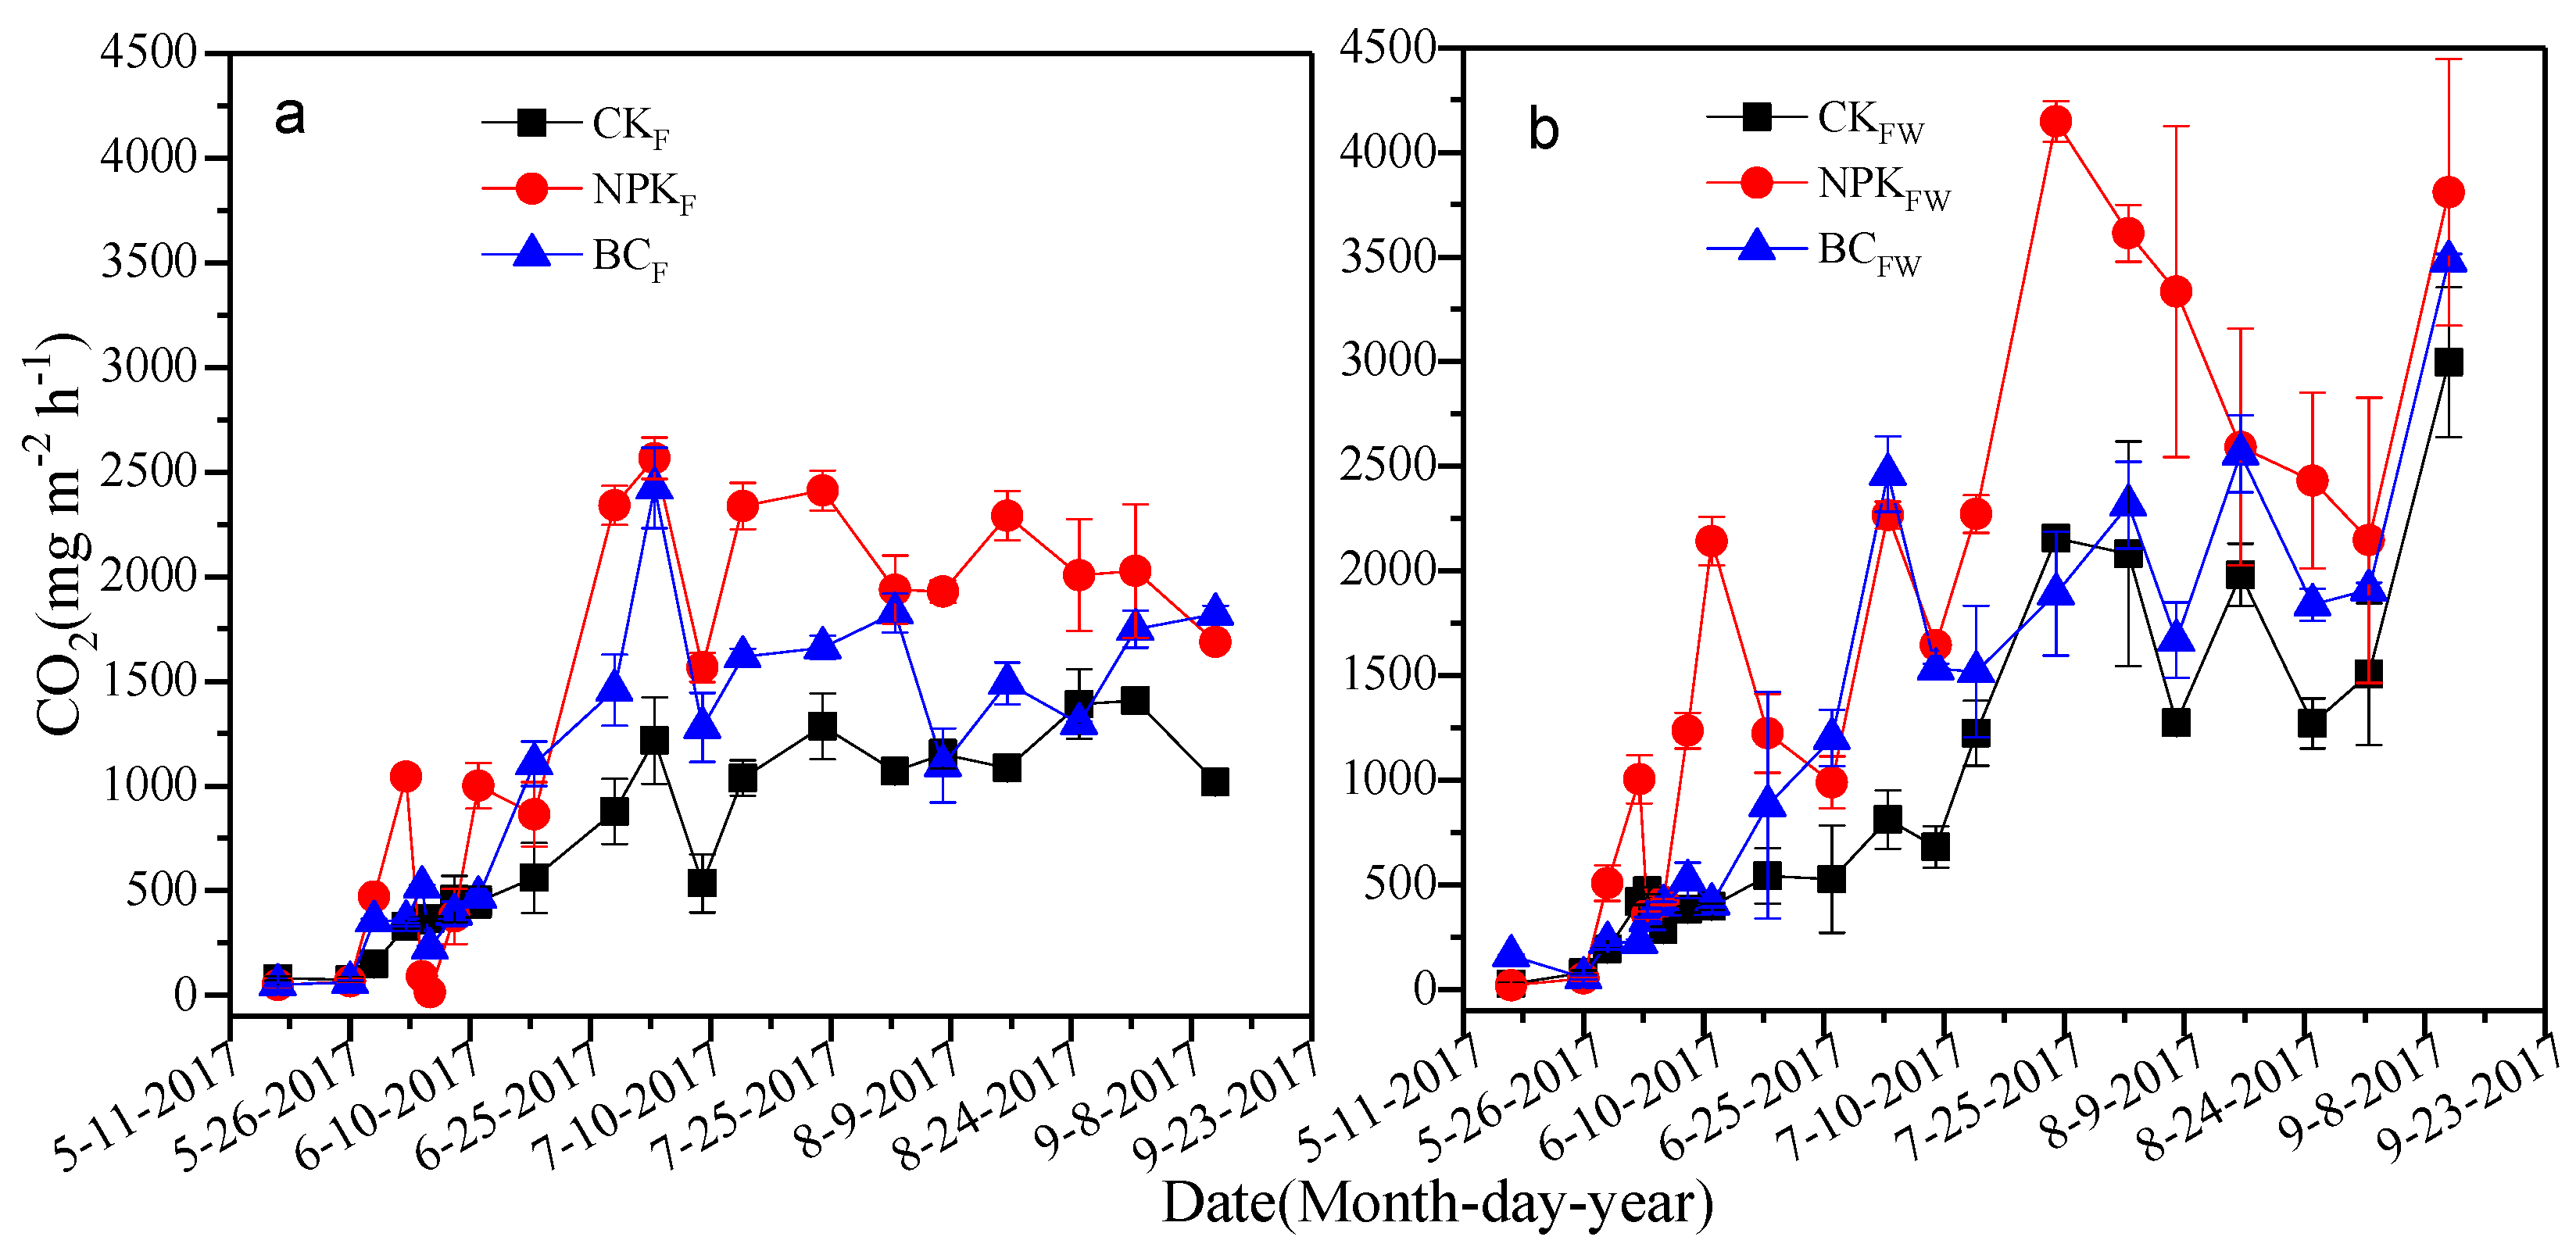
3.3. The CO2 Emissions of the Soil
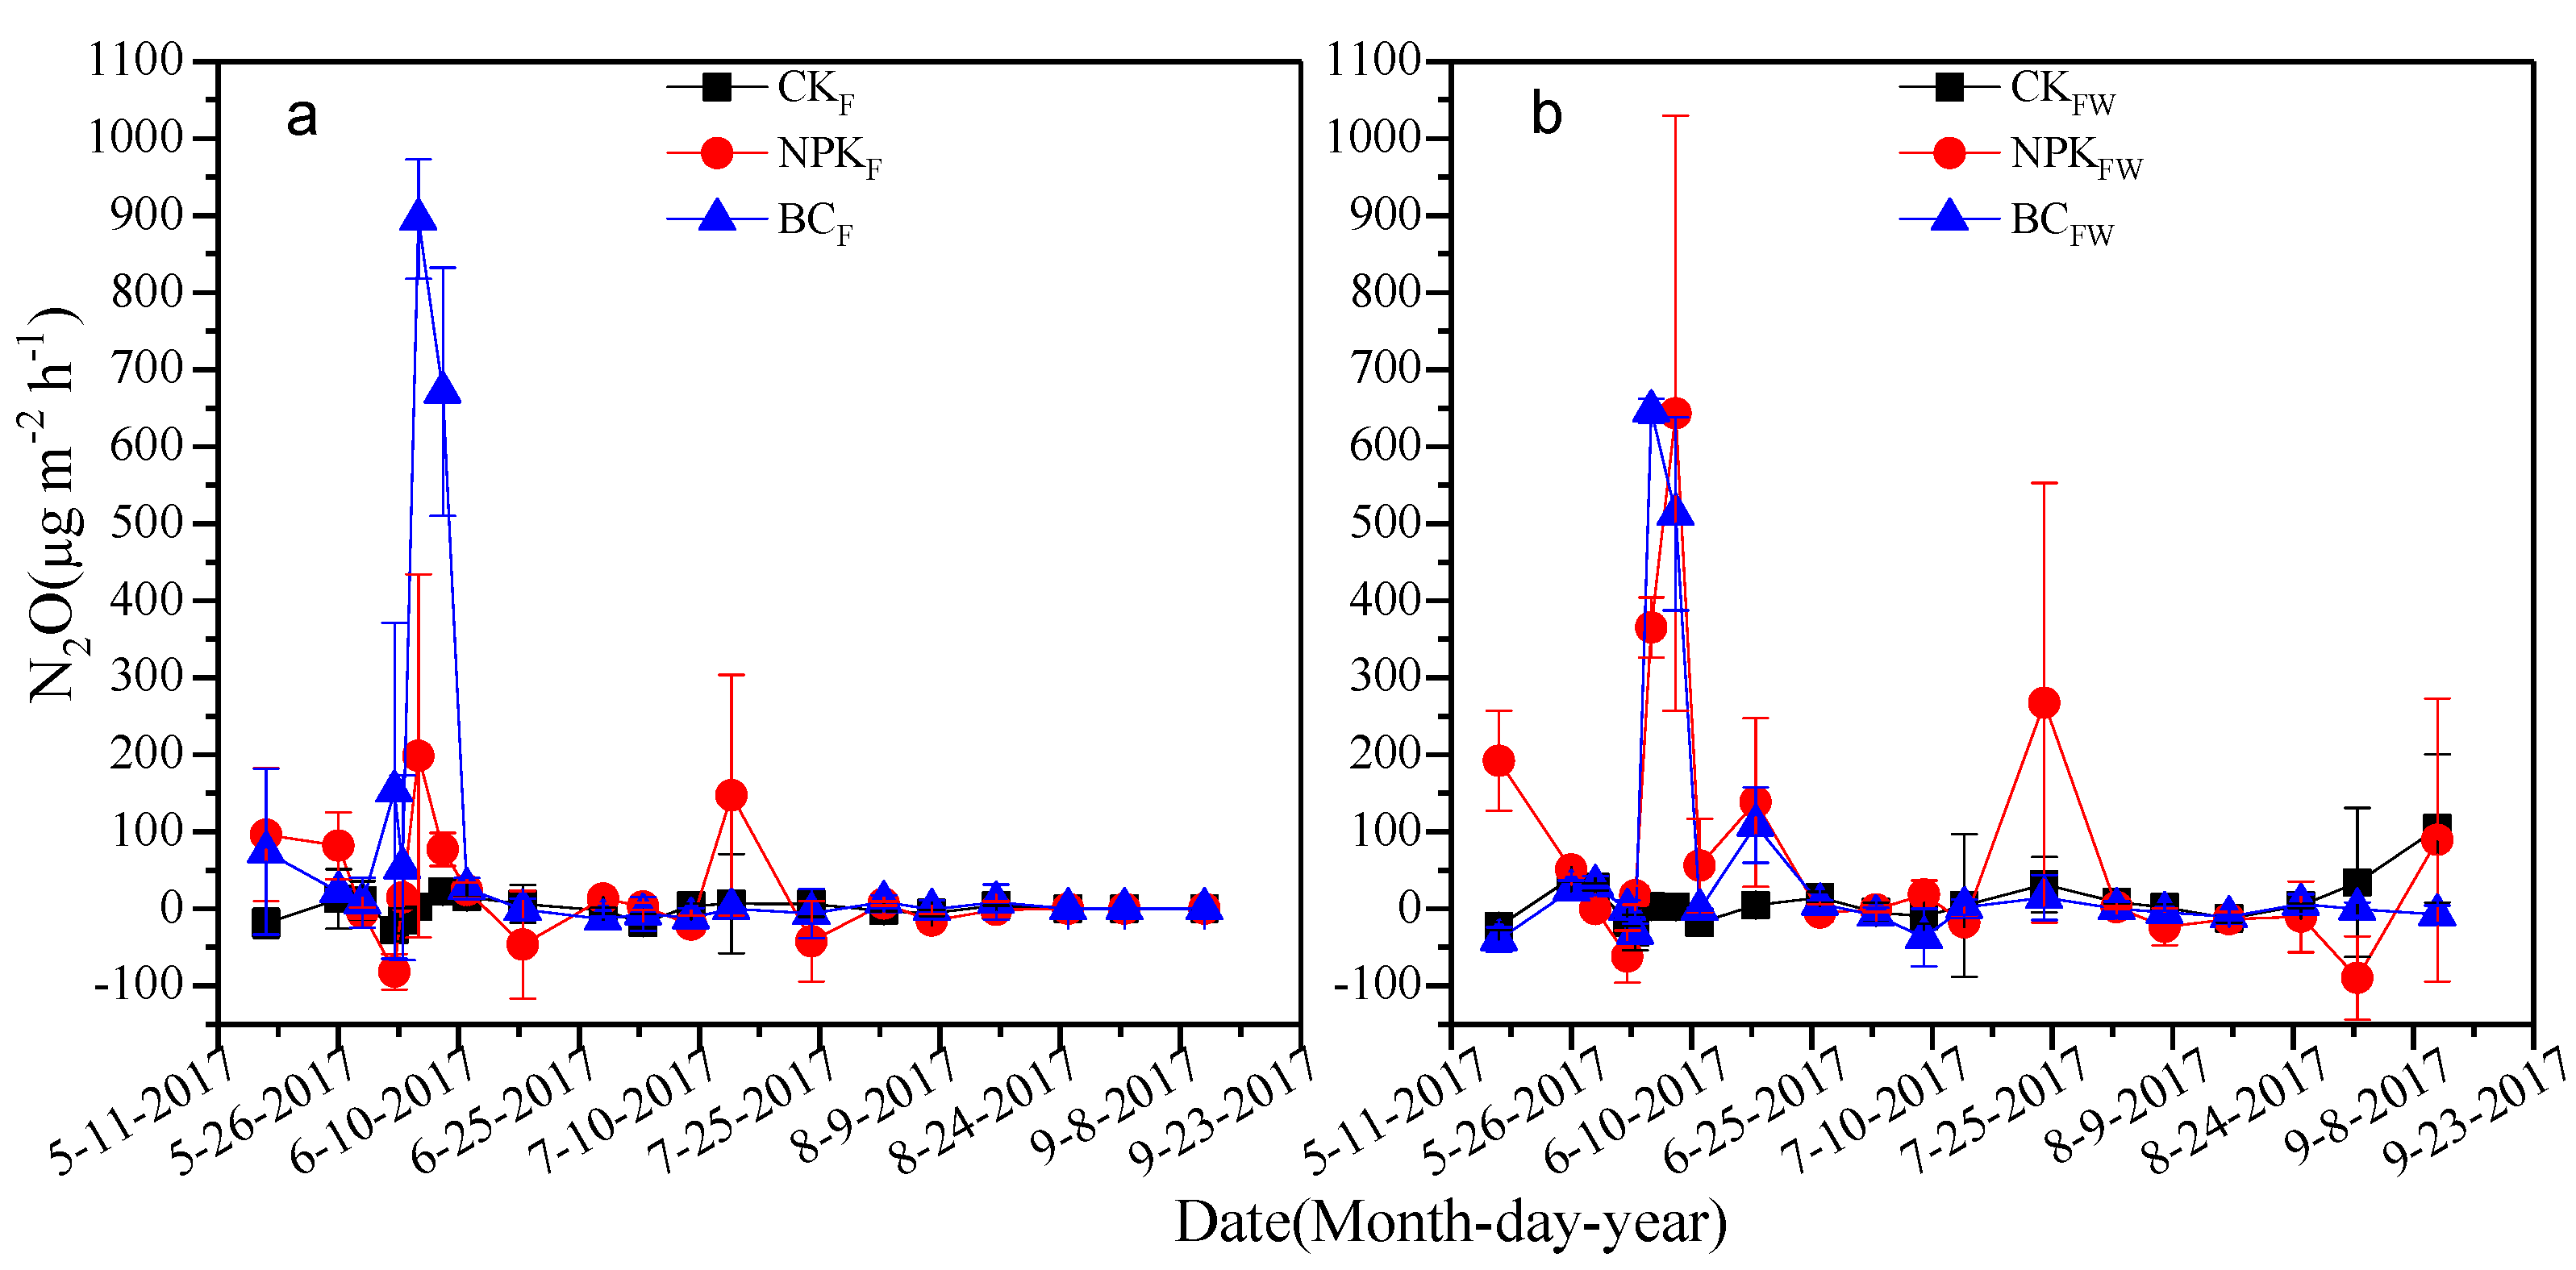
3.4. The N2O Emissions of the Soil
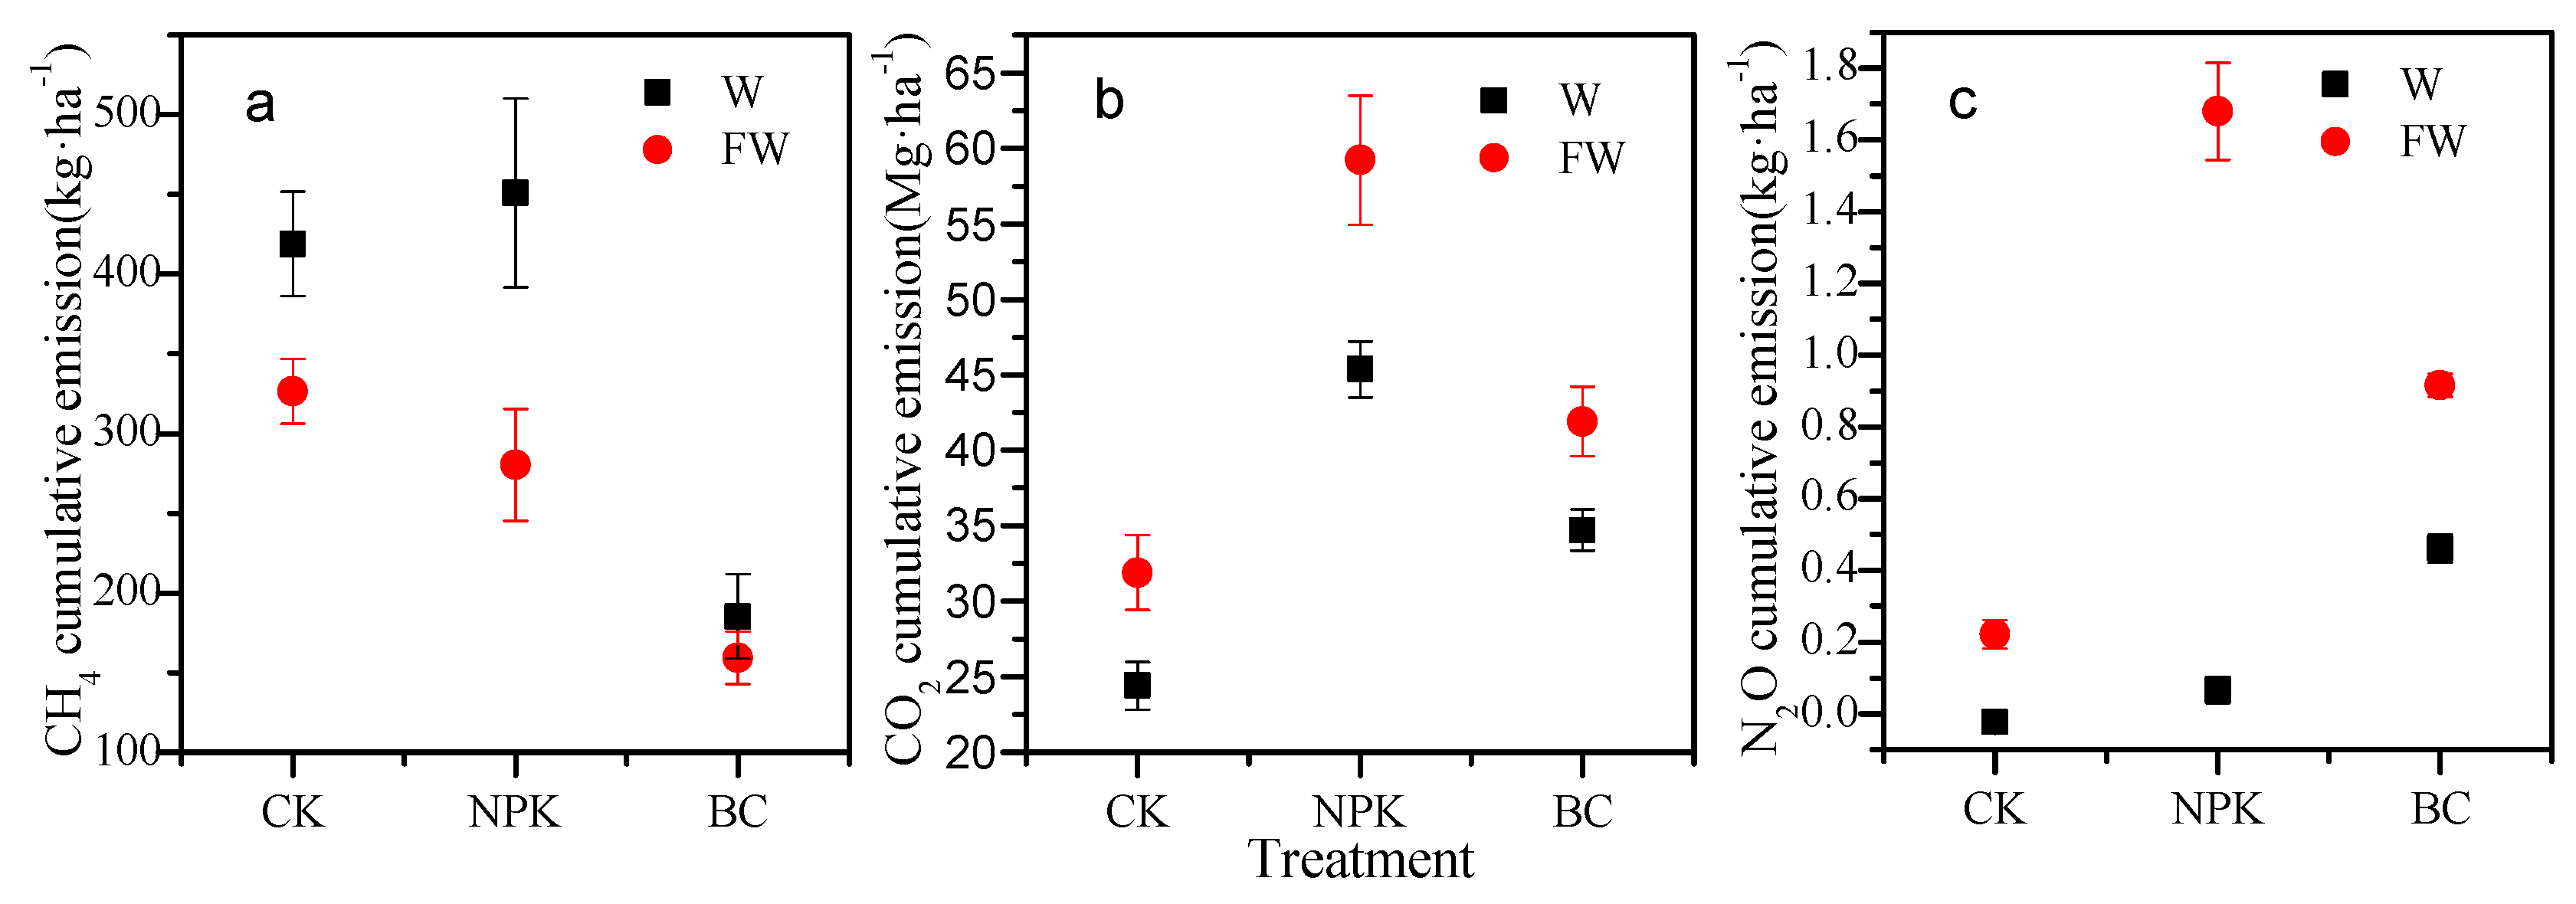
3.5. GHG Total Flux
3.6. Net Greenhouse Gas Balance of the GHG Emissions of the Soil
4. Discussion
4.1. Effect of Irrigation Conditions and Biochar Application on the CH4 Emission of the Soil
4.2. The CO2 Emissions of the Soil
4.3. The N2O Emissions of the Soil
4.4. Net Greenhouse Gas Balance of the GHG Emissions of the Soil
5. Conclusions
Author Contributions
Funding
Acknowledgments
Conflicts of Interest
References
- Stocker, T. IPCC, 2013: Technical Summary. In Climate Change 2013: The Physical Science Basis. Contribution of Working Group I to the Fifth Assessment Report of the Intergovernmental Panel on Climate Change; Cambridge University Press: Cambridge, UK; New York, NY, USA, 2013; pp. 159–254. [Google Scholar]
- Solomon, S. IPCC (2007): Climate Change. The Physical Science Basis. Am. Geophys. Union 2007, 9, 123–124. [Google Scholar]
- Karakurt, I.; Aydin, G.; Aydiner, K. Sources and mitigation of methane emissions by sectors: A critical review. Renew. Energy 2012, 39, 40–48. [Google Scholar] [CrossRef]
- Haque, M.M.; Sang, Y.K.; Ali, M.A.; Kim, P.J. Contribution of greenhouse gas emissions during cropping and fallow seasons on total global warming potential in mono-rice paddy soils. Plant Soil 2015, 387, 251–264. [Google Scholar] [CrossRef]
- Jeong, S.T.; Kim, G.W.; Hwang, H.Y.; Kim, P.J.; Kim, S.Y. Beneficial effect of compost utilization on reducing greenhouse gas emissions in a rice cultivation system through the overall management chain. Sci. Total Environ. 2017, 115, 613–614. [Google Scholar] [CrossRef] [PubMed]
- Pump, J.; Conrad, R. Rice biomass production and carbon cycling in 13CO2 pulse-labeled microcosms with different soils under submerged conditions. Plant Soil 2014, 384, 213–229. [Google Scholar] [CrossRef]
- Schmidt, H.P.; Abiven, S.; Kammann, C.; Glaser, B.; Bucheli, T.; Leifeld, J.; Shackley, S. European Biochar Certificate—Guidelines for a Sustainable Production of Biochar; European Biochar Foundation (EBC): Arbaz, Switzerland, 2016. [Google Scholar]
- Hagemann, N.; Subdiaga, E.; Orsetti, S.; Rosa, J.M.D.L.; Knicker, H.; Schmidt, H.P.; Kappler, A.; Behrens, S. Effect of biochar amendment on compost organic matter composition following aerobic compositing of manure. Sci. Total Environ. 2018, 613–614, 20–29. [Google Scholar] [CrossRef] [PubMed]
- Zhang, A.; Liu, Y.; Pan, G.; Hussain, Q.; Li, L.; Zheng, J.; Zhang, X. Effect of biochar amendment on maize yield and greenhouse gas emissions from a soil organic carbon poor calcareous loamy soil from Central China Plain. Plant Soil 2012, 351, 263–275. [Google Scholar] [CrossRef]
- Stewart, C.E.; Zheng, J.Y.; Botte, J.; Cotrufo, M.F. Co-generated fast pyrolysis biochar mitigates green-house gas emissions and increases carbon sequestration in temperate soils. Glob. Chang. Biol. Bioenergy 2013, 5, 153–164. [Google Scholar] [CrossRef]
- Kim, J.; Yoo, G.; Kim, D.; Ding, W.; Kang, H. Combined application of biochar and slow-release fertilizer reduces methane emission but enhances rice yield by different mechanisms. Appl. Soil Ecol. 2017, 117–118, 57–62. [Google Scholar] [CrossRef]
- Aguilar-Chávez, Á.; Díaz-Rojas, M.; Mdr, C.A.; Dendooven, L.; Luna-Guido, M. Greenhouse gas emissions from a wastewater sludge-amended soil cultivated with wheat (Triticum spp. L.) as affected by different application rates of charcoal. Soil Biol. Biochem. 2012, 52, 90–95. [Google Scholar]
- Sohi, S.P. Carbon Storage with Benefits. Science 2012, 338, 1034–1035. [Google Scholar] [CrossRef] [PubMed]
- Lehmann, J. A handful of carbon. Nature 2007, 447, 143–144. [Google Scholar] [CrossRef] [PubMed]
- Woolf, D.; Amonette, J.E.; Streetperrott, F.A.; Lehmann, J.; Joseph, S. Sustainable biochar to mitigate global climate change. Nat. Commun. 2010, 1, 56. [Google Scholar] [CrossRef] [PubMed]
- Liu, X.; Zheng, J.; Zhang, D.; Cheng, K.; Zhou, H.; Zhang, A.; Li, L.; Joseph, S.; Smith, P.; Crowley, D. Biochar has no effect on soil respiration across Chinese agricultural soils. Sci. Total Environ. 2016, 259, 554–555. [Google Scholar] [CrossRef] [PubMed]
- Sagrilo, E.; Jeffery, S.; Hoffland, E.; Kuyper, T.W. Emission of CO2 from biochar-amended soils and implications for soil organic carbon. Glob. Chang. Biol. Bioenergy 2015, 7, 1294–1304. [Google Scholar] [CrossRef]
- Cayuela, M.L.; Zwieten, L.V.; Singh, B.P.; Jeffery, S.; Roig, A.; Sánchez-Monedero, M.A. Biochar’s role in mitigating soil nitrous oxide emissions: A review and meta-analysis. Agric. Ecosyst. Environ. 2014, 191, 5–16. [Google Scholar] [CrossRef]
- Karhu, K.; Mattila, T.; Bergström, I.; Regina, K. Biochar addition to agricultural soil increased CH 4 uptake and water holding capacity–Results from a short-term pilot field study. Agric. Ecosyst. Environ. 2011, 140, 309–313. [Google Scholar] [CrossRef]
- Feng, Y.; Xu, Y.; Yu, Y.; Xie, Z.; Lin, X. Mechanisms of biochar decreasing methane emission from Chinese paddy soils. Soil Biol. Biochem. 2012, 46, 80–88. [Google Scholar] [CrossRef]
- Knoblauch, C.; Maarifat, A.A.; Pfeiffer, E.M.; Haefele, S.M.; Knoblauch, C.; Maarifat, A.A.; Pfeiffer, E.M.; Haefele, S.M. Degradability of black carbon and its impact on trace gas fluxes and carbon turnover in paddy soils. Soil Biol. Biochem. 2011, 43, 1768–1778. [Google Scholar] [CrossRef]
- Zheng, J.; Stewart, C.E.; Cotrufo, M.F. Biochar and nitrogen fertilizer alters soil nitrogen dynamics and greenhouse gas fluxes from two temperate soils. J. Environ. Q. 2012, 41, 1361. [Google Scholar] [CrossRef] [PubMed]
- Yanai, Y.; Toyota, K.; Okazaki, M. Effects of charcoal addition on N2O emissions from soil resulting from rewetting air-dried soil in short-term laboratory experiments. Soil Sci. Plant Nutr. 2007, 53, 181–188. [Google Scholar] [CrossRef]
- Luo, L.J. Breeding for water-saving and drought-resistance rice (WDR) in China. J. Exp. Bot. 2010, 61, 3509–3517. [Google Scholar] [CrossRef] [PubMed]
- Serraj, R.; Mcnally, K.L.; Slametloedin, I.; Kohli, A.; Haefele, S.M.; Atlin, G.; Kumar, A. Drought resistance improvement in rice: An integrated genetic and resource management strategy. Plant Prod. Sci. 2011, 14, 1–14. [Google Scholar] [CrossRef]
- Xu, Y.; Ge, J.; Tian, S.; Li, S.; Nguy-Robertson, A.L.; Zhan, M.; Cao, C. Effects of water-saving irrigation practices and drought resistant rice variety on greenhouse gas emissions from a no-till paddy in the central lowlands of China. Sci. Total Environ. 2015, 505, 1043. [Google Scholar] [CrossRef] [PubMed]
- Sánchez-Llerena, J.; López-Piñeiro, A.; Albarrán, Á.; Peña, D.; Becerra, D.; Rato-Nunes, J.M. Short and long-term effects of different irrigation and tillage systems on soil properties and rice productivity under Mediterranean conditions. Eur. J. Agron. 2016, 77, 101–110. [Google Scholar]
- Yagi, K.; Tsuruta, H.; Kanda, K.I.; Minami, K. Effect of water management on methane emission from a Japanese rice paddy field: Automated methane monitoring. Glob. Biogeochem. Cycles 1996, 10, 255–267. [Google Scholar] [CrossRef]
- Minamikawa, K.; Sakai, N. The practical use of water management based on soil redox potential for decreasing methane emission from a paddy field in Japan. Agric. Ecosyst. Environ. 2006, 116, 181–188. [Google Scholar] [CrossRef]
- Tyagi, L.; Kumari, B.; Singh, S.N. Water management-a tool for methane mitigation from irrigated paddy fields. Sci. Total Environ. 2010, 408, 1085. [Google Scholar] [CrossRef] [PubMed]
- Rolston, D.E.; Klute, A. Gas flux. In Methods of Soil Analysis Part 1; Klute, A., Ed.; Soil Science Society of America; American Society of Agronomy: Madison, WI, USA, 1986; pp. 1103–1119. [Google Scholar]
- Pramanik, P.; Haque, M.M.; Sang, Y.K.; Kim, P.J. C and N accumulations in soil aggregates determine nitrous oxide emissions from cover crop treated rice paddy soils during fallow season. Sci. Total Environ. 2014, 490, 622–628. [Google Scholar] [CrossRef] [PubMed]
- Baahacheamfour, M.; Carlyle, C.N.; Lim, S.S.; Bork, E.W.; Chang, S.X. Forest and grassland cover types reduce net greenhouse gas emissions from agricultural soils. Sci. Total Environ. 2016, 571, 1115. [Google Scholar] [CrossRef] [PubMed]
- Lou, Y.; Li, Z.; Zhang, T.; Liang, Y. CO2 emissions from subtropical arable soils of China. Soil Biol. Biochem. 2004, 36, 1835–1842. [Google Scholar] [CrossRef]
- Cai, Y.; Ding, W.; Luo, J. Spatial variation of nitrous oxide emission between interrow soil and interrow plus row soil in a long-term maize cultivated sandy loam soil. Geoderma 2012, 181–182, 2–10. [Google Scholar] [CrossRef]
- Badagliacca, G.; Ruisi, P.; Rees, R.M.; Saia, S. An assessment of factors controlling N2O and CO2 emissions from crop residues using different measurement approaches. Biol. Fertil. Soils 2017, 53, 547–561. [Google Scholar] [CrossRef]
- Yamulki, S.; Anderson, R.; Peace, A.; Morison, J.I.L. Soil CO2 CH4 and N2O fluxes from an afforested lowland raised peatbog in Scotland: Implications for drainage and restoration. Biogeosciences 2013, 10, 7623–7630. [Google Scholar] [CrossRef]
- Praeg, N.; Wagner, A.O.; Illmer, P. Plant species, temperature, and bedrock affect net methane flux out of grassland and forest soils. Plant Soil 2016, 410, 193–206. [Google Scholar] [CrossRef]
- Huang, R.; Lan, M.; Liu, J.; Gao, M. Soil aggregate and organic carbon distribution at dry land soil and paddy soil: The role of different straws returning. Environ. Sci. Pollut. Res. 2017, 24, 27942–27952. [Google Scholar] [CrossRef] [PubMed]
- Walkley, A.J.; Black, I.A. An Examination of the Degtjareff Method for Determining Soil Organic Matter, and A Proposed Modification of the Chromic Acid Titration Method. Soil Sci. 1934, 37, 29–38. [Google Scholar] [CrossRef]
- Gispert, M.; Pardini, G.; Emran, M.; Doni, S.; Masciandaro, G. Seasonal evolution of soil organic matter, glomalin and enzymes and potential for C storage after land abandonment and renaturalization processes in soils of NE Spain. CATENA 2017, 162, 402–413. [Google Scholar] [CrossRef]
- Forster, J.C. Soil sampling, handling, storage and analysis. Methods Appl. Soil Microbiol. Biochem. 1995, 49–121. [Google Scholar] [CrossRef]
- Yan, G.; Xing, Y.; Wang, J.; Li, Z.; Wang, L.; Wang, Q.; Xu, L.; Zhang, Z.; Zhang, J.; Dong, X. Sequestration of atmospheric CO2 in boreal forest carbon pools in northeastern China: Effects of nitrogen deposition. Agric. For. Meteorol. 2018, 248, 70–81. [Google Scholar] [CrossRef]
- Huang, J.; Chen, Y.; Peng, S.; Gao, W. Estimation of net greenhouse gas balance using crop- and soil-based approaches: Two case studies. Sci. Total Environ. 2013, 456–457, 299–306. [Google Scholar] [CrossRef] [PubMed]
- Yu, L.; Tang, J.; Zhang, R.; Wu, Q.; Gong, M. Effects of biochar application on soil methane emission at different soil moisture levels. Biol. Fertil. Soils 2013, 49, 119–128. [Google Scholar] [CrossRef]
- Mer, J.L.; Roger, P. Production, oxidation, emission and consumption of methane by soils: A review. Eur. J. Soil Biol. 2001, 37, 25–50. [Google Scholar] [CrossRef]
- Cai, Z.; Tsuruta, H.; Gao, M.; Xu, H.; Wei, C. Options for mitigating methane emission from a permanently flooded rice field. Glob. Chang. Biol. 2003, 9, 37–45. [Google Scholar] [CrossRef]
- Kieft, T.L.; Soroker, E.; Firestone, M.K. Microbial biomass response to a rapid increase in water potential when dry soil is wetted. Soil Biol. Biochem. 1987, 19, 119–126. [Google Scholar] [CrossRef]
- Olefeldt, D.; Turetsky, M.R.; Crill, P.M.; Mcguire, A.D. Environmental and physical controls on northern terrestrial methane emissions across permafrost zones. Glob. Chang. Biol. 2013, 19, 589. [Google Scholar] [CrossRef] [PubMed]
- Jia, J.X.; Ma, Y.C.; Xiong, Z.Q. Net ecosystem carbon budget, net global warming potential and greenhouse gas intensity in intensive vegetable ecosystems in China. Agric. Ecosyst. Environ. 2012, 150, 27–37. [Google Scholar] [CrossRef]
- Ding, W.; Cai, Y.; Cai, Z.; Zheng, X. Diel pattern of soil respiration in N-amended soil under maize cultivation. Atmos. Environ. 2006, 40, 3294–3305. [Google Scholar] [CrossRef]
- Wan, S.; Norby, R.J.; Ledford, J.; Weltzin, J.F. Responses of soil respiration to elevated CO2, air warming, and changing soil water availability in a model old-field grassland. Glob. Chang. Biol. 2007, 13, 2411–2424. [Google Scholar] [CrossRef]
- Davidson, E.A.; Verchot, L.V.; Cattânio, J.H.; Ackerman, I.L.; Carvalho, J.E.M. Effects of soil water content on soil respiration in forests and cattle pastures of eastern Amazonia. Biogeochemistry 2000, 48, 53–69. [Google Scholar] [CrossRef]
- Fierer, N.; Schimel, J.P. Effects of drying–rewetting frequency on soil carbon and nitrogen transformations. Soil Biol. Biochem. 2002, 34, 777–787. [Google Scholar] [CrossRef]
- Trivedi, P.; Anderson, I.C.; Singh, B.K. Microbial modulators of soil carbon storage: Integrating genomic and metabolic knowledge for global prediction. Trends Microbiol. 2013, 21, 641–651. [Google Scholar] [CrossRef] [PubMed]
- Lu, M.; Zhou, X.; Luo, Y.; Yang, Y.; Fang, C.; Chen, J.; Li, B. Minor stimulation of soil carbon storage by nitrogen addition: A meta-analysis. Agric. Ecosyst. Environ. 2011, 140, 234–244. [Google Scholar] [CrossRef]
- Zhou, L.; Zhou, X.; Zhang, B.; Lu, M.; Luo, Y.; Liu, L.; Li, B. Different responses of soil respiration and its components to nitrogen addition among biomes: A meta-analysis. Glob. Chang. Biol. 2014, 20, 2332. [Google Scholar] [CrossRef] [PubMed]
- Liu, S.; Zhang, Y.; Zong, Y.; Hu, Z.; Wu, S.; Zhou, J.; Jin, Y.; Zou, J. Response of soil carbon dioxide fluxes, soil organic carbon and microbial biomass carbon to biochar amendment: A meta-analysis. Glob. Chang. Biol. Bioenergy 2016, 8, 392–406. [Google Scholar] [CrossRef]
- Zhou, H.; Zhang, D.; Wang, P.; Liu, X.; Cheng, K.; Li, L.; Zheng, J.; Zhang, X.; Zheng, J.; Crowley, D. Changes in microbial biomass and the metabolic quotient with biochar addition to agricultural soils: A Meta-analysis. Agric. Ecosyst. Environ. 2017, 239, 80–89. [Google Scholar] [CrossRef]
- Ball, B.C.; Mctaggart, I.P.; Scott, A. Mitigation of greenhouse gas emissions from soil under silage production by use of organic manures or slow-release fertilizer. Soil Use Manag. 2004, 20, 287–295. [Google Scholar] [CrossRef]
- Liu, Q.; Liu, B.; Zhang, Y.; Lin, Z.; Zhu, T.; Sun, R.; Wang, X.; Ma, J.; Bei, Q.; Liu, G. Can biochar alleviate soil compaction stress on wheat growth and mitigate soil N2O emissions? Soil Biol. Biochem. 2017, 104, 8–17. [Google Scholar] [CrossRef]
- Zhou, Z.; Xu, X.; Bi, Z.; Li, L.; Li, B.; Xiong, Z. Soil concentration profiles and diffusion and emission of nitrous oxide influenced by the application of biochar in a rice-wheat annual rotation system. Environ. Sci. Pollut. Res. Int. 2016, 23, 7949–7961. [Google Scholar] [CrossRef] [PubMed]
- Cayuela, M.L.; Sánchezmonedero, M.A.; Roig, A.; Hanley, K.; Enders, A.; Lehmann, J. Biochar and denitrification in soils: When, how much and why does biochar reduce N2O emissions? Sci. Rep. 2013, 3, 1732. [Google Scholar] [CrossRef] [PubMed]
- Nguyen, T.T.N.; Xu, C.Y.; Tahmasbian, I.; Che, R.; Xu, Z.; Zhou, X.; Wallace, H.M.; Bai, S.H. Effects of biochar on soil available inorganic nitrogen: A review and meta-analysis. Geoderma 2017, 288, 79–96. [Google Scholar] [CrossRef]
- Liu, B.; Mørkved, P.T.; Frostegård, Å.; Bakken, L.R. Denitrification gene pools, transcription and kinetics of NO, N2O and N2 production as affected by soil pH. FEMS Microbiol. Ecol. 2010, 72, 407–417. [Google Scholar] [CrossRef] [PubMed]
- Sánchezgarcía, M.; Roig, A.; Sanchezmonedero, M.A.; Cayuela, M.L. Biochar increases soil N2O emissions produced by nitrification-mediated pathways. Front. Environ. Sci. 2014, 2, 25. [Google Scholar]
- Liu, X.Y.; Qu, J.J.; Li, L.Q.; Zhang, A.F.; Zheng, J.; Zheng, J.W.; Pan, G.X. Can biochar amendment be an ecological engineering technology to depress N2O emission in rice paddies?—A cross site field experiment from South China. Ecol. Eng. 2012, 42, 168–173. [Google Scholar] [CrossRef]
- Schoeneberger, M.; Bentrup, G.; Gooijer, H.D.; Soolanayakanahally, R.; Sauer, T.; Brandle, J.; Zhou, X.; Current, D. Branching out: Agroforestry as a climate change mitigation and adaptation tool for agriculture. J. Soil Water Conserv. 2012, 67, 128A–136A. [Google Scholar] [CrossRef]
- Santos, V.B.; Araújo, A.S.F.; Leite, L.F.C.; Nunes, L.A.P.L.; Melo, W.J. Soil microbial biomass and organic matter fractions during transition from conventional to organic farming systems. Geoderma 2012, 170, 227–231. [Google Scholar] [CrossRef]
- Singh, B.P.; Cowie, A.L. Long-term influence of biochar on native organic carbon mineralisation in a low-carbon clayey soil. Sci. Rep. 2014, 4, 3687. [Google Scholar] [CrossRef] [PubMed]
- Slavich, P.G.; Sinclair, K.; Morris, S.G.; Kimber, S.W.L.; Downie, A.; Zwieten, L.V. Contrasting effects of manure and green waste biochars on the properties of an acidic ferralsol and productivity of a subtropical pasture. Plant Soil 2013, 366, 213–227. [Google Scholar] [CrossRef]
- Tang, J.; Wang, J.; Li, Z.; Wang, S.; Qu, Y. Effects of Irrigation Regime and Nitrogen Fertilizer Management on CH4, N2O and CO2 Emissions from Saline–Alkaline Paddy Fields in Northeast China. Sustainability 2018, 10, 475. [Google Scholar] [CrossRef]
- West, T.O.; Marland, G. A synthesis of carbon sequestration, carbon emissions, and net carbon flux in agriculture: Comparing tillage practices in the United States. Agric. Ecosyst. Environ. 2002, 91, 217–232. [Google Scholar] [CrossRef]


| Treatment | ID | Urea | Superphosphate | Potassium Chloride | Biochar | |
|---|---|---|---|---|---|---|
| 60% | 40% | |||||
| Control | CKF, CKFW | 0 | 0 | 0 | 0 | 0 |
| Fertilizer only | NPKF, NPKFW | 1.56 | 1.04 | 6.00 | 1.60 | 0 |
| 40 Mg ha−1 biochar and fertilizer | BCF, BCFW | 0.96 | 0.64 | 5.14 | 0.26 | 106.68 |
| □ | GWPsoil | GWPsoc | GWPplant | Net GHGs |
|---|---|---|---|---|
| CKF | 34.87 c | 4.22 a | 5.54 d | 25.11 c |
| NPKF | 56.66 a | −1.86 b | 10.71 a | 47.82 b |
| BCF | 39.49 c | −10.47 d | 9.88 a | 40.08 b |
| CKFW | 40.12 b | −2.66 b | 4.93 d | 37.85 c |
| NPKFW | 66.73 a | −2.11 b | 10.83 a | 58.01 a |
| BCFW | 46.16 b | −10.18 d | 9.06 b | 47.29 b |
© 2018 by the authors. Licensee MDPI, Basel, Switzerland. This article is an open access article distributed under the terms and conditions of the Creative Commons Attribution (CC BY) license (http://creativecommons.org/licenses/by/4.0/).
Share and Cite
Qi, L.; Niu, H.-D.; Zhou, P.; Jia, R.-J.; Gao, M. Effects of Biochar on the Net Greenhouse Gas Emissions under Continuous Flooding and Water-Saving Irrigation Conditions in Paddy Soils. Sustainability 2018, 10, 1403. https://doi.org/10.3390/su10051403
Qi L, Niu H-D, Zhou P, Jia R-J, Gao M. Effects of Biochar on the Net Greenhouse Gas Emissions under Continuous Flooding and Water-Saving Irrigation Conditions in Paddy Soils. Sustainability. 2018; 10(5):1403. https://doi.org/10.3390/su10051403
Chicago/Turabian StyleQi, Le, Hai-Dong Niu, Peng Zhou, Rui-Jie Jia, and Ming Gao. 2018. "Effects of Biochar on the Net Greenhouse Gas Emissions under Continuous Flooding and Water-Saving Irrigation Conditions in Paddy Soils" Sustainability 10, no. 5: 1403. https://doi.org/10.3390/su10051403