Exergoecology Assessment of Mineral Exports from Latin America: Beyond a Tonnage Perspective


Abstract
:1. Introduction
2. Methodology
2.1. Research Framework
2.2. Data Compilation
3. Results and Analysis
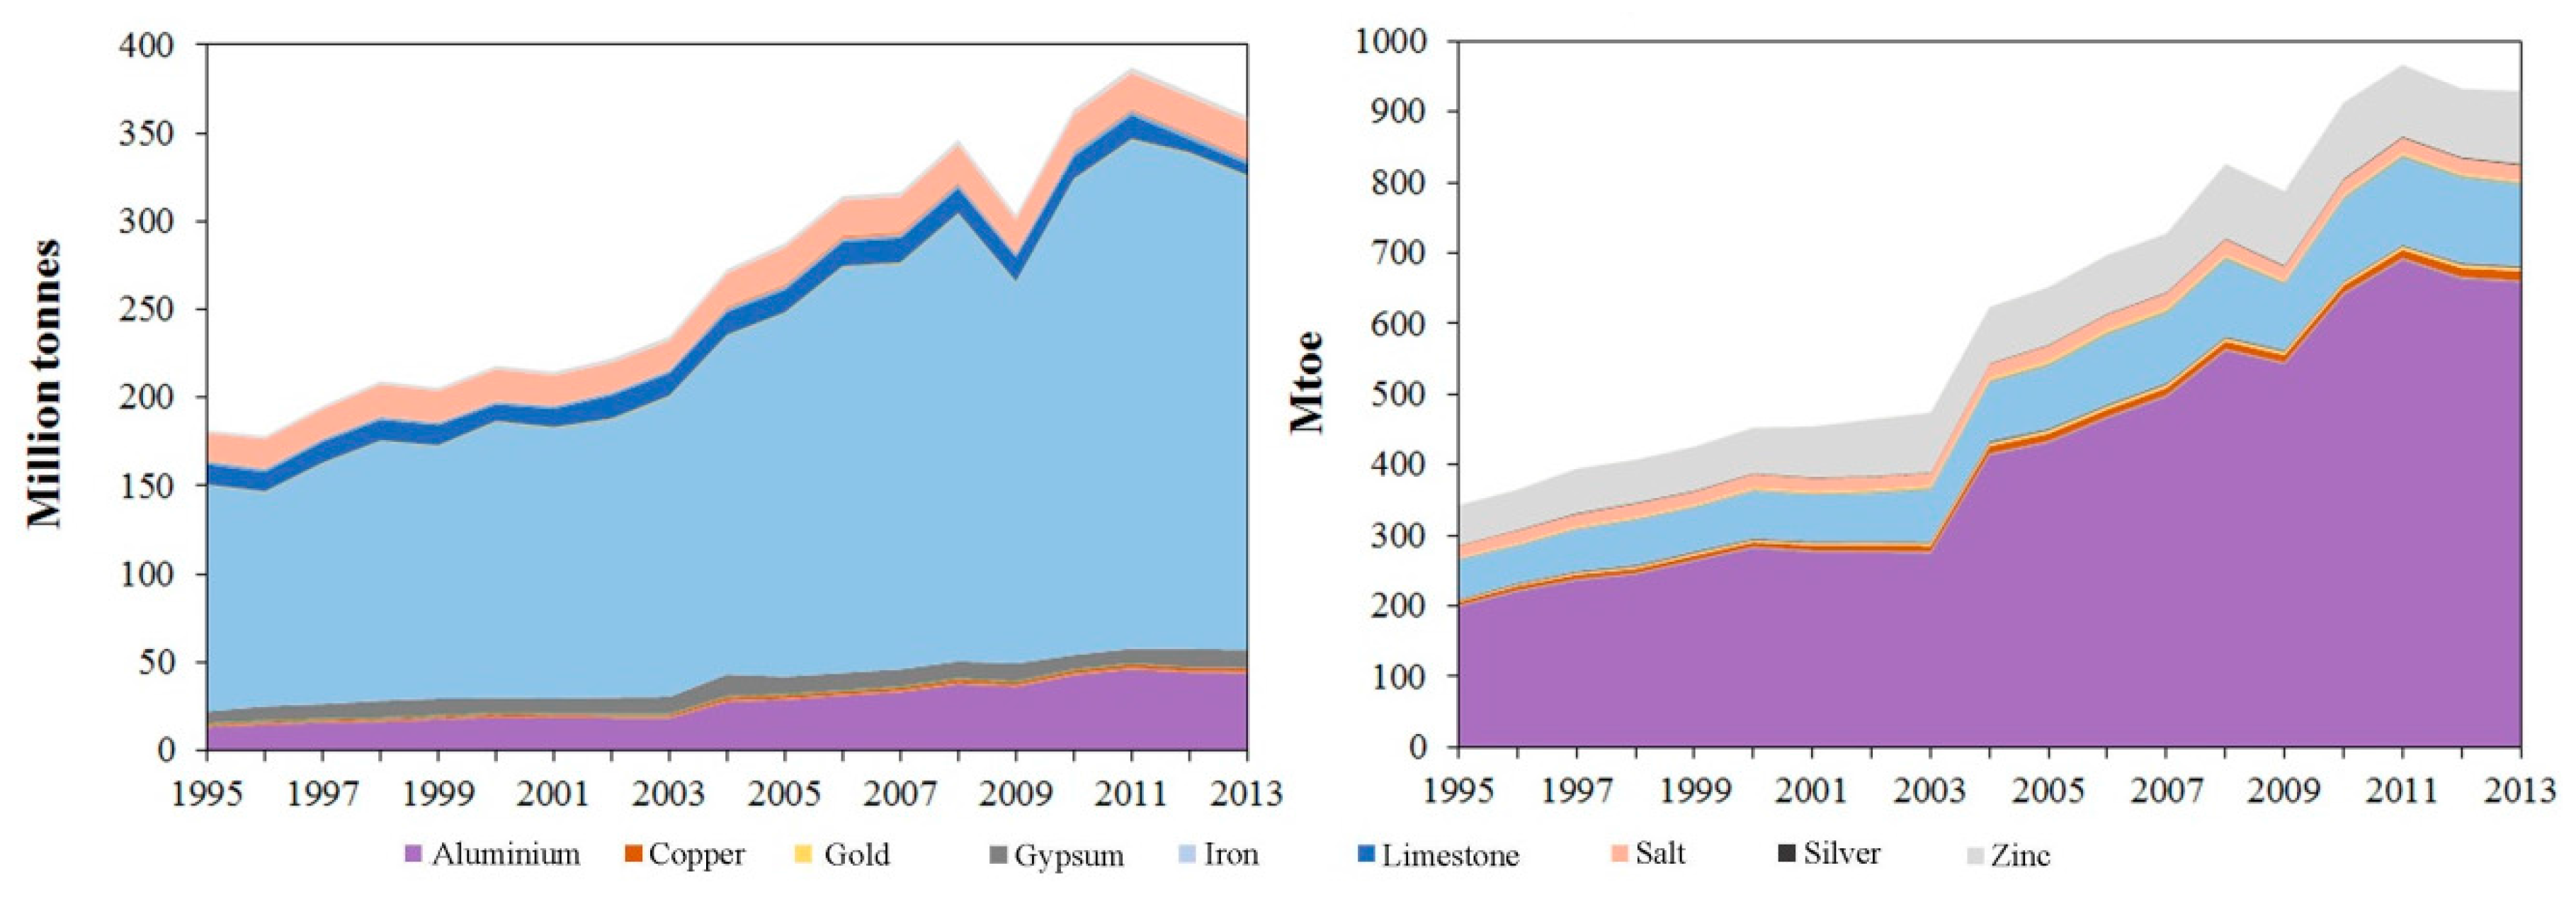
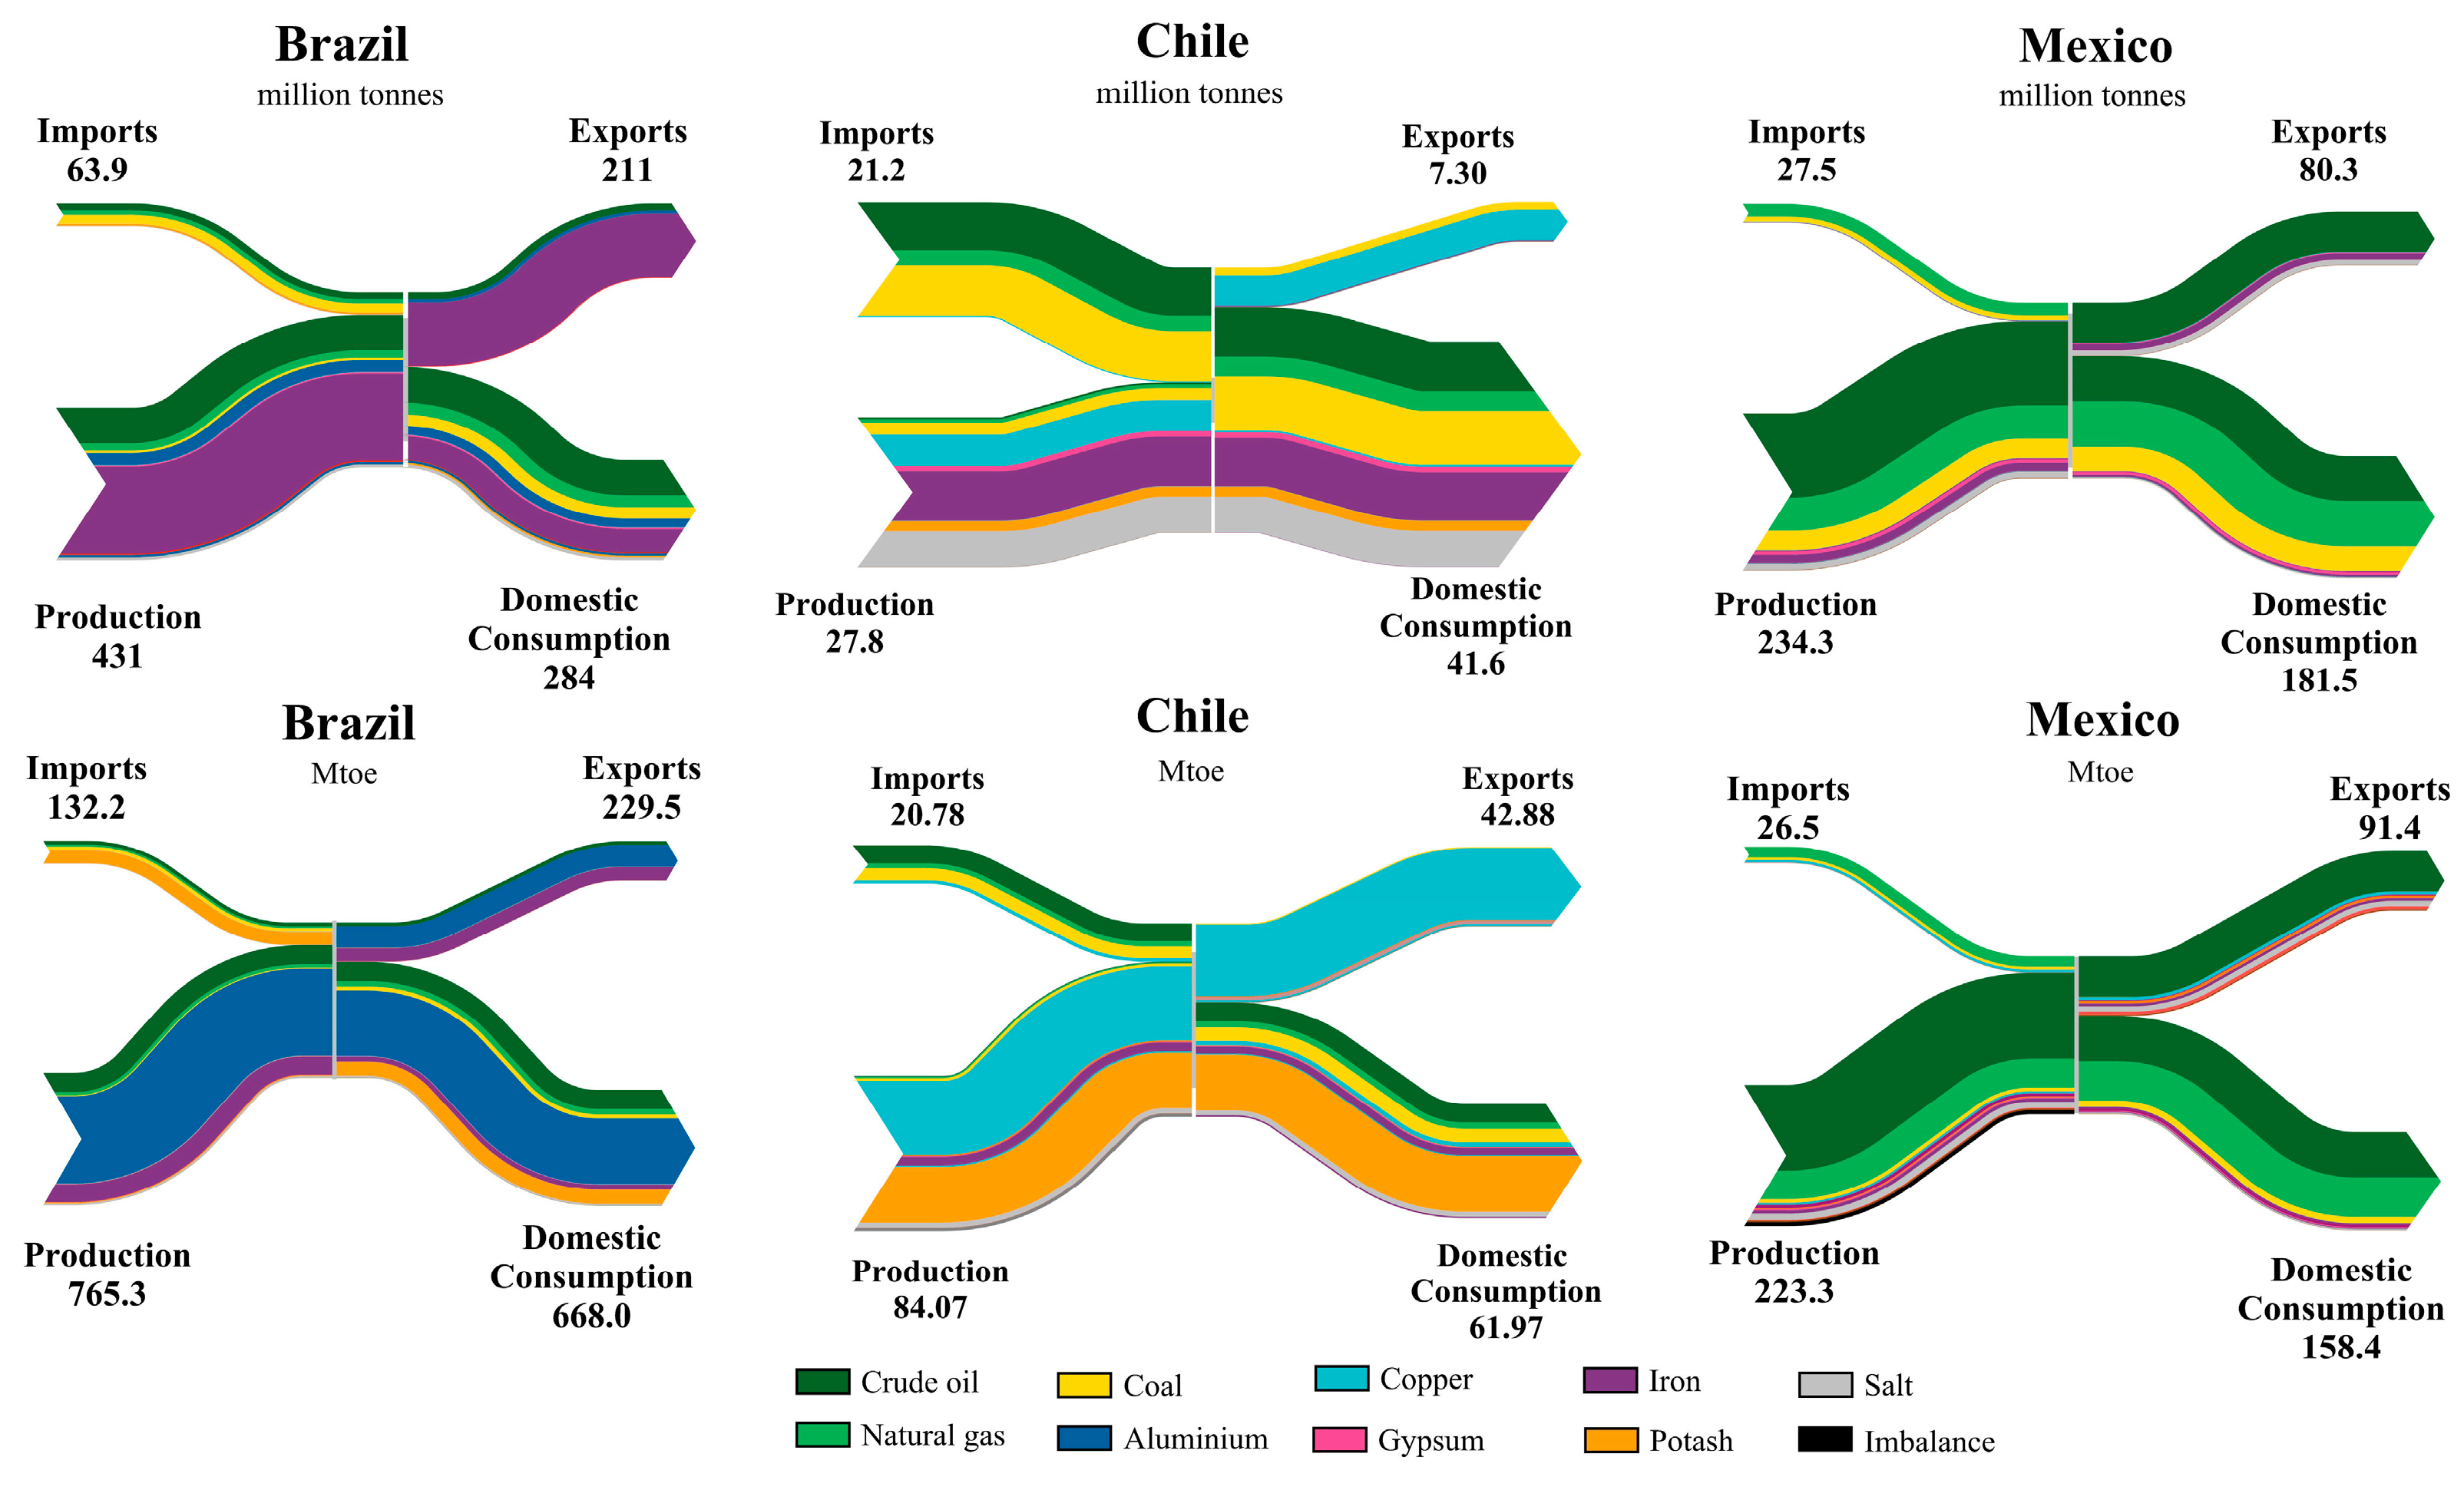
3.1. Mineral Balance
3.2. Mass and ERC Indicators
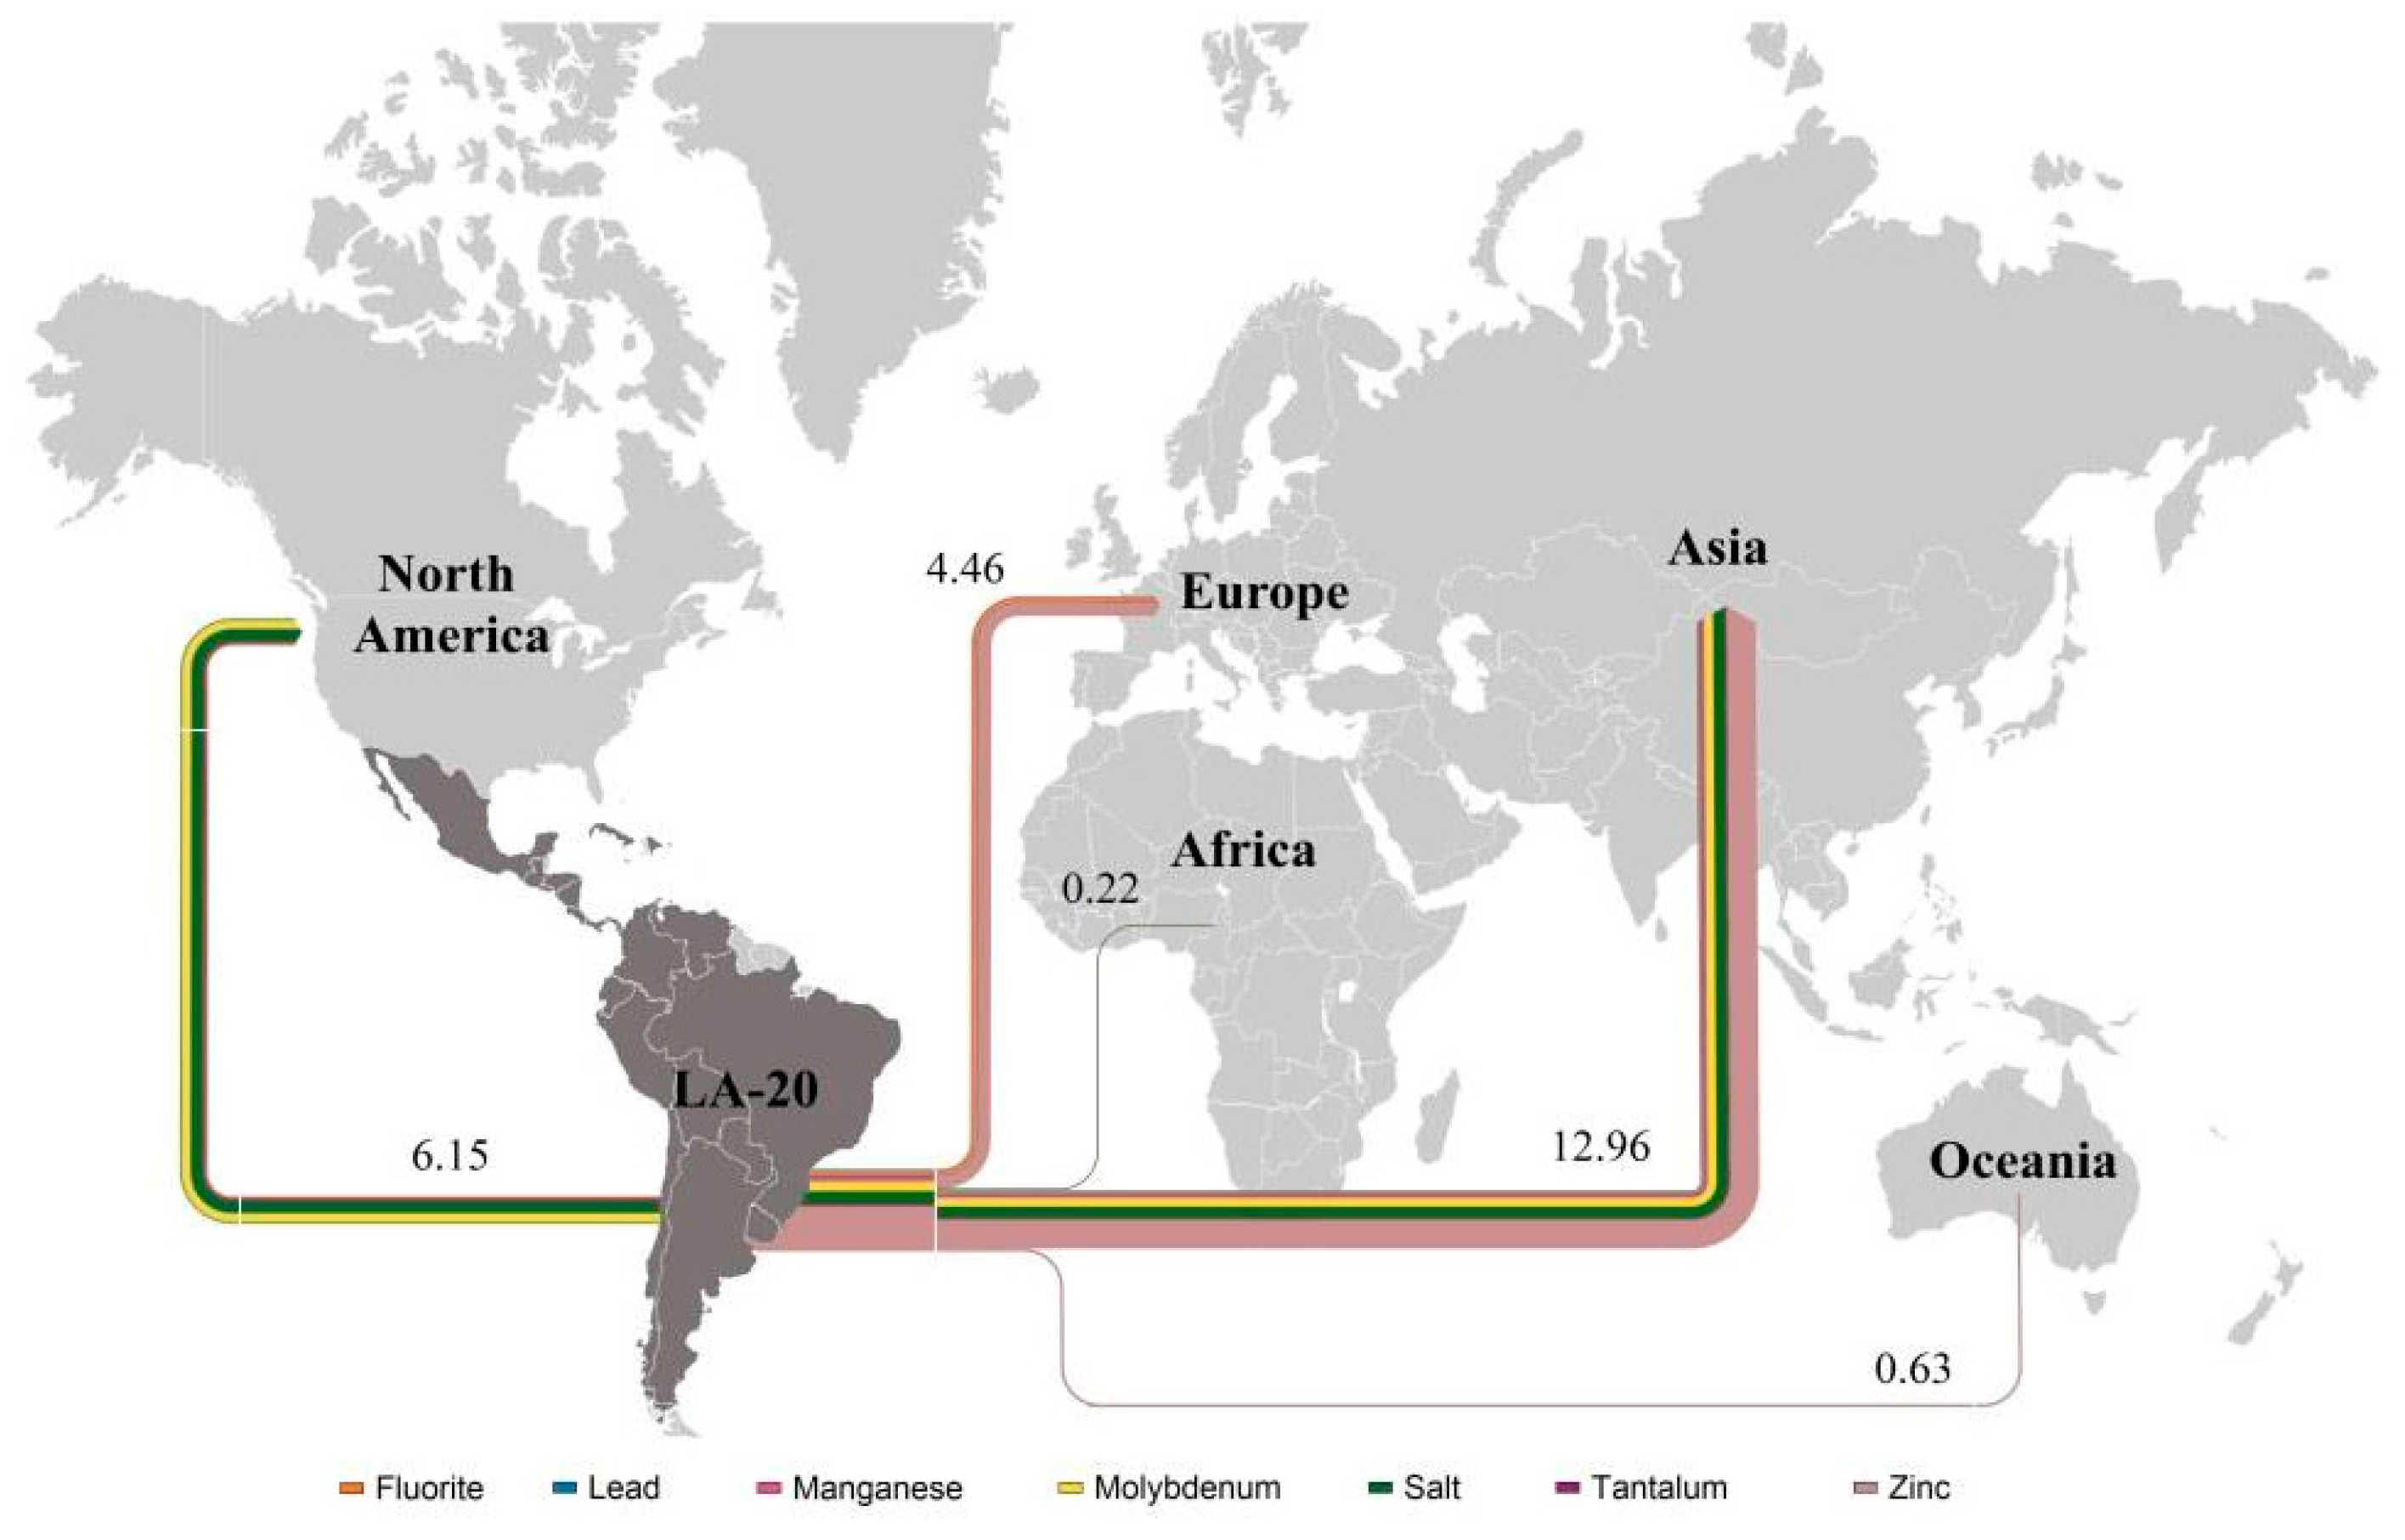
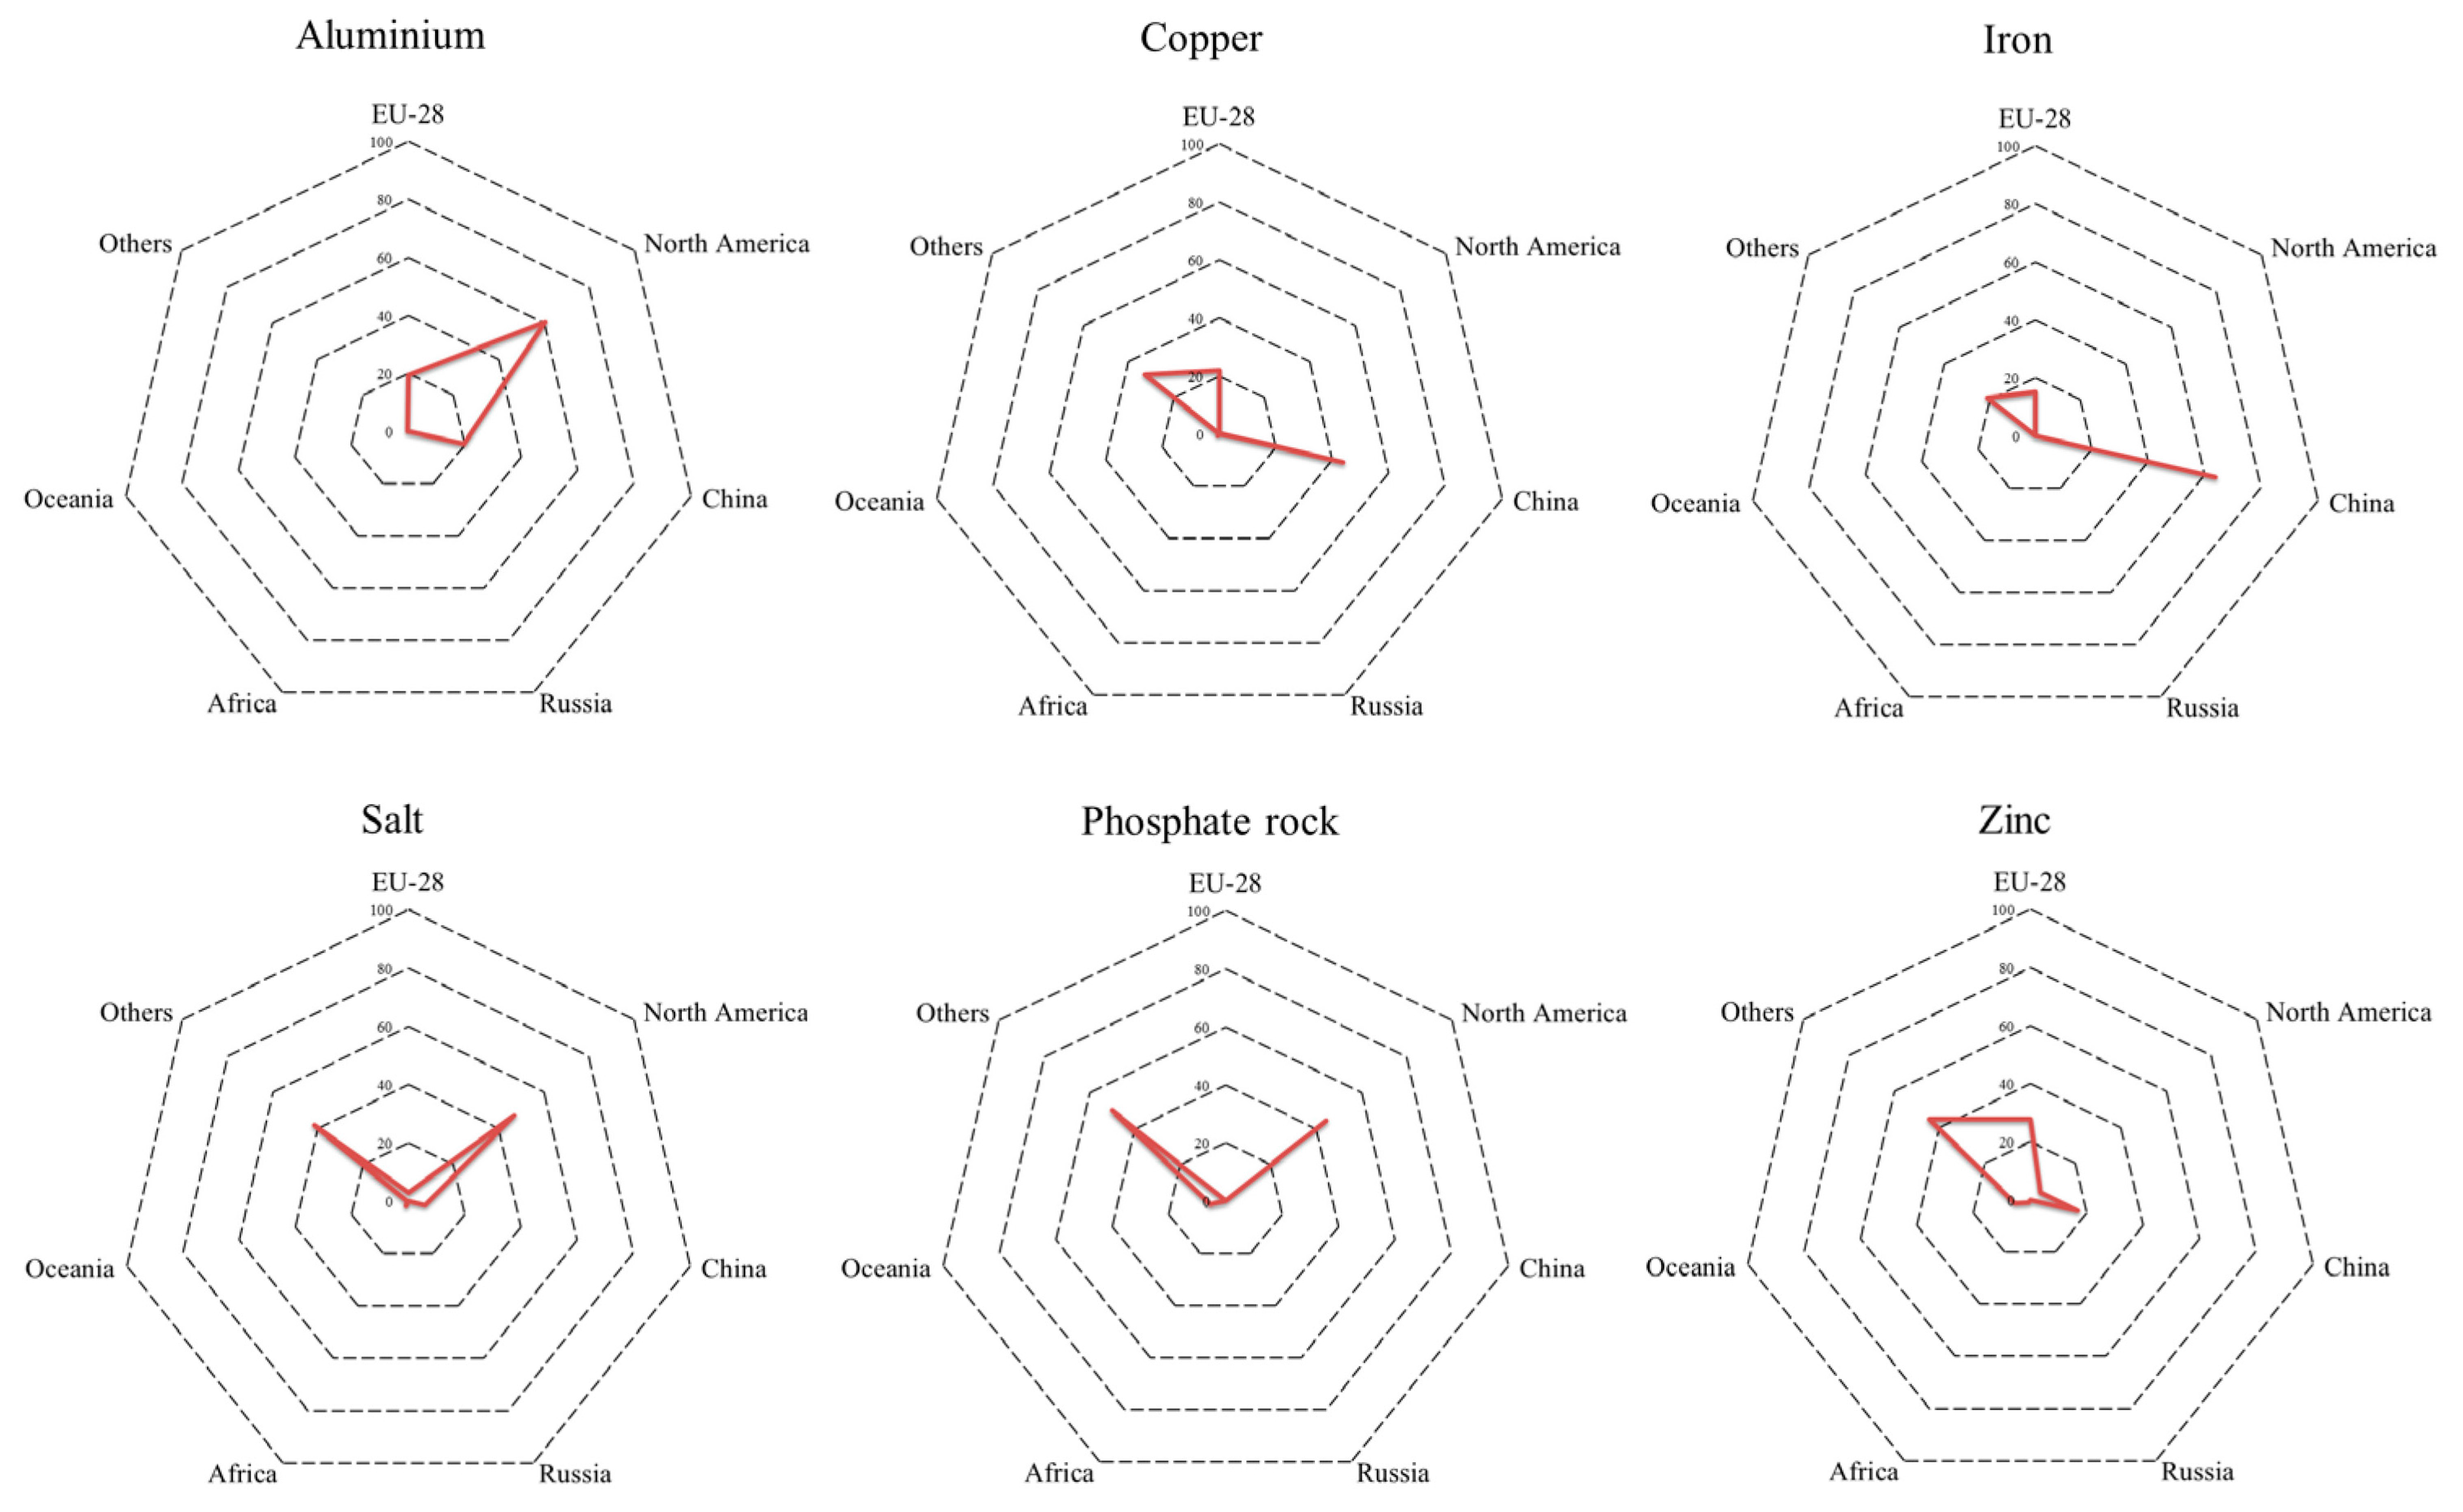
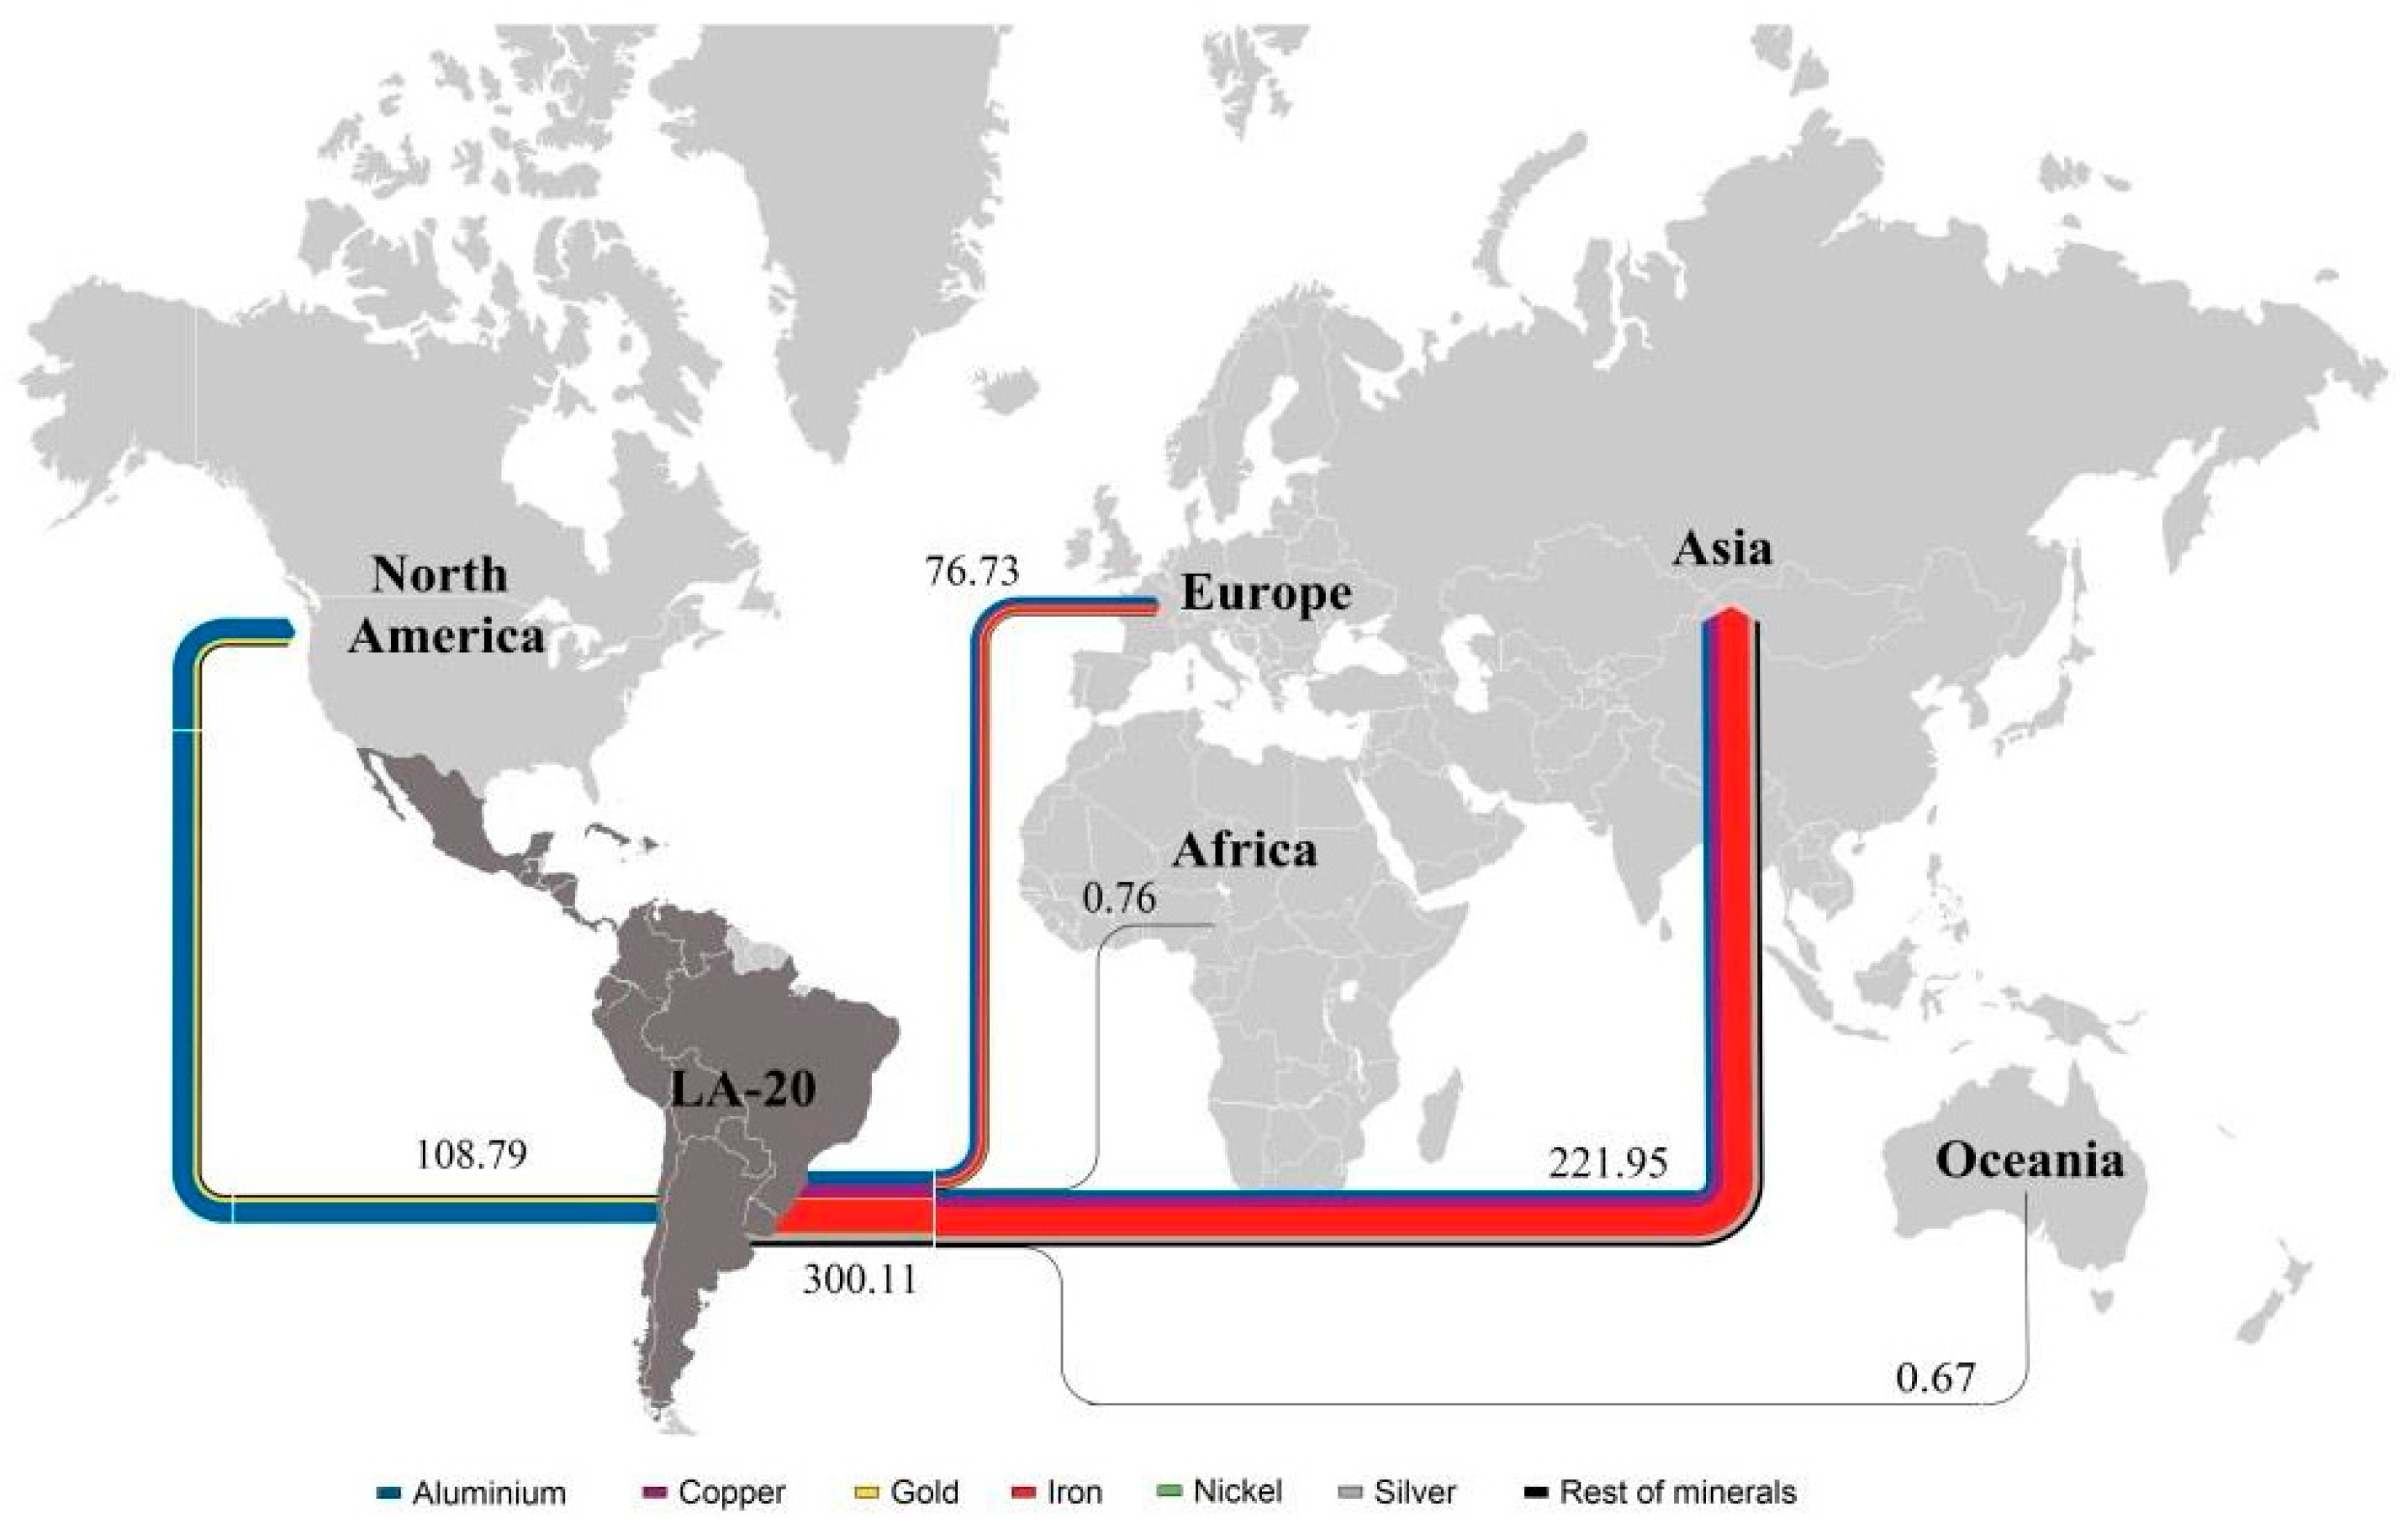
3.3. Exports by Destination
4. Discussion and Conclusions
Acknowledgments
Author Contributions
Conflicts of Interest
Appendix A

| No. | Mineral | ERC (GJ/t) | No | Mineral | ERC (GJ/t) |
|---|---|---|---|---|---|
| 1 | Aluminium (Gibbsite) | 627 | 20 | Mercury (Cinnabar) | 28,298 |
| 2 | Antimony (Stibnite) | 474 | 21 | Molybdenum (Molybdenite) | 908 |
| 3 | Barite | 38 | 22 | Nickel (Garnierite) | 168 |
| 4 | Beryllium (Beryl) | 253 | 23 | Niobium (Ferrocolumbite) | 4422 |
| 5 | Bismuth (Bismuthinite) | 489 | 24 | Platinum Group Metals (PGM) | 4,491,690 |
| 6 | Cadmium (Greenockite) | 5,898 | 25 | Phosphate Rock (Apatite) | 0.4 |
| 7 | Chromium (Chromite) | 4.5 | 26 | Potassium (Sylvite) | 665 |
| 8 | Cobalt (Linnaeite) | 10,872 | 27 | REE (Bastnaesite) | 348 |
| 9 | Copper (Chalcopyrite) | 292 | 28 | Sodium (Halite) | 44.07 |
| 10 | Fluorite | 183 | 29 | Selenium | 2,235,699 |
| 11 | Gold | 553,250 | 30 | Silver (Argentite) | 7371 |
| 12 | Graphite | 20 | 31 | Tantalum (Tantalite) | 482,828 |
| 13 | Gypsum | 15 | 32 | Tin (Cassiterite) | 426 |
| 14 | Iron ore (Hematite) | 18 | 33 | Titanium (Ilmenite) | 4.5 |
| 15 | Lead (Galena) | 37 | 34 | Vanadium | 1055 |
| 16 | Lime | 2.6 | 35 | Tungsten (Scheelite) | 7430 |
| 17 | Lithium (Spodumene) | 546 | 36 | Zinc (Sphalerite) | 155 |
| 18 | Magnesite | 26 | 37 | Zirconium (Zircon) | 654 |
| 19 | Manganese (Pyrolusite) | 16 |
Appendix B
| Country | Oil | Natural Gas | Coal | Non-Fuel Minerals | TOTAL | ||||||||||
|---|---|---|---|---|---|---|---|---|---|---|---|---|---|---|---|
| Production | Imports | Exports | Production | Imports | Exports | Production | Imports | Exports | Production | Imports | Exports | Production | Imports | Exports | |
| Argentina | 28.20 | 0.38 | 1.97 | 35.60 | 9.45 | 0.07 | 0.07 | 1.67 | 0.001 | 8.00 | 2.43 | 0.89 | 71.90 | 13.90 | 2.93 |
| Bolivia | 2.95 | - | - | 15.70 | - | 12.60 | - | - | - | 0.52 | 0.00 | 0.20 | 19.20 | 2.2 × 10⁻⁴ | 12.80 |
| Brazil | 101.00 | 19.60 | 19.80 | 20.80 | 12.80 | - | 6.86 | 25.00 | - | 436.00 | 6.43 | 293.00 | 422.71 | 63.83 | 210.20 |
| Chile | 0.34 | 8.84 | - | 0.71 | 2.87 | - | 2.18 | 9.27 | 0.89 | 24.50 | 0.20 | 5.85 | 27.70 | 21.20 | 6.75 |
| Colombia | 48.50 | - | 32.40 | 13.90 | - | 1.37 | 91.90 | - | 85.10 | 15.20 | 1.48 | 2.8 × 10⁻³ | 169.00 | 1.48 | 119.00 |
| Costa Rica | - | - | - | - | - | - | - | - | - | 0.01 | 0.00 | 4.7 × 10⁻³ | 0.01 | 0.00 | 4.7 × 10⁻³ |
| Cuba | 2.91 | 4.81 | - | 0.79 | - | - | - | 3.0 × 10⁻⁶ | - | 0.38 | - | - | 4.08 | 4.81 | - |
| Dominican Republic | - | 1.33 | - | - | 0.87 | - | - | 0.85 | - | 0.99 | 0.01 | 0.16 | 0.99 | 3.05 | 0.16 |
| Ecuador | 25.30 | - | 18.30 | 1.21 | - | - | - | - | - | 7.05 | - | 1.4 × 10⁻⁵ | 33.60 | - | 18.30 |
| El Salvador | 0.50 | - | 0.44 | - | - | - | - | - | - | 0.21 | 0.01 | 0.68 | 0.71 | 0.01 | 1.11 |
| Guatemala | - | - | - | - | - | - | - | - | - | 0.10 | 0.01 | 2.5 × 10⁻⁴ | 0.10 | - | 2.5 × 10⁻⁴ |
| Honduras | - | - | - | - | - | - | - | 0.12 | - | 0.08 | - | - | 0.08 | 0.12 | - |
| Mexico | 126.00 | - | 59.40 | 49.50 | 18.60 | 0.10 | 10.20 | 7.40 | 0.01 | 38.10 | 1.50 | 20.60 | 216.73 | 27.50 | 80.14 |
| Nicaragua | - | 0.64 | - | - | - | - | - | - | - | 0.04 | - | 2.4 × 10⁻⁵ | 0.04 | 0.64 | 2.4 × 10⁻⁵ |
| Panama | - | - | - | - | - | - | - | - | - | 0.03 | 0.00 | 1.4 × 10⁻⁴ | 0.03 | 2.6 × 10⁻⁴ | 1.4 × 10⁻⁴ |
| Paraguay | - | - | - | - | - | - | - | - | - | 0.07 | 0.11 | - | 0.07 | 0.11 | - |
| Peru | 3.13 | 4.17 | 0.73 | 13.90 | - | 4.69 | 0.25 | 0.65 | - | 25.80 | - | 3.39 | 43.10 | 4.82 | 8.81 |
| Uruguay | - | 1.89 | - | - | 0.04 | - | - | 0.00 | - | 1.49 | 4.0 × 10⁻⁹ | 3.8 × 10⁻⁶ | 1.49 | 1.94 | 3.8 × 10⁻⁶ |
| Venezuela | 144.00 | 0.61 | 96.30 | 20.80 | 1.55 | - | 1.08 | - | 0.80 | 16.20 | 13.60 | 3.23 | 182.00 | 15.80 | 100.00 |
Appendix C
| Country | Oil | Natural Gas | Coal | Non-Fuel Minerals | TOTAL | ||||||||||
|---|---|---|---|---|---|---|---|---|---|---|---|---|---|---|---|
| Production | Imports | Exports | Production | Imports | Exports | Production | Imports | Exports | Production | Imports | Exports | Production | Imports | Exports | |
| Argentina | 31.21 | 0.42 | 2.17 | 33.51 | 8.90 | 0.06 | 0.05 | 1.16 | 0.001 | 14.39 | 1.43 | 14.92 | 79.15 | 11.91 | 17.16 |
| Bolivia | 3.26 | - | - | 14.82 | - | 11.86 | - | - | - | 16.75 | 0.02 | 7.78 | 34.83 | 0.02 | 19.63 |
| Brazil | 111.64 | 21.71 | 21.86 | 19.57 | 12.09 | - | 5.18 | 18.92 | - | 702.60 | 85.51 | 268.79 | 778.47 | 138.23 | 225.38 |
| Chile | 0.37 | 9.77 | - | 0.67 | 2.70 | - | 1.51 | 6.44 | 0.62 | 84.97 | 1.87 | 44.32 | 87.53 | 20.78 | 44.94 |
| Colombia | 53.65 | - | 35.81 | 13.09 | - | 1.29 | 53.30 | - | 49.39 | 2.82 | 1.88 | 0.72 | 122.85 | 1.88 | 87.21 |
| Costa Rica | - | - | - | - | - | - | - | - | - | 0.01 | 1.43 | 8.07 | 0.01 | 1.43 | 8.07 |
| Cuba | 3.22 | 5.31 | - | 0.74 | - | - | - | - | - | 1.39 | - | - | 5.35 | 5.31 | - |
| Dominican Republic | - | 1.47 | - | - | 0.81 | - | - | 0.49 | - | 15.16 | 0.10 | 1.38 | 15.16 | 2.89 | 1.38 |
| Ecuador | 28.01 | - | 20.25 | 1.14 | - | - | - | - | - | 1.99 | - | 0.18 | 31.14 | - | 20.43 |
| El Salvador | 0.55 | - | 0.49 | - | - | - | - | - | - | 0.35 | 0.30 | 2.68 | 0.90 | 0.30 | 3.17 |
| Guatemala | - | - | - | - | - | - | - | - | - | 0.11 | - | - | 0.11 | - | - |
| Honduras | - | - | - | - | - | - | - | 0.07 | - | 1.06 | - | - | 1.06 | 0.07 | - |
| Mexico | 139.21 | - | 65.71 | 46.64 | 17.48 | 0.09 | 5.93 | 4.29 | 0.003 | 47.07 | 5.33 | 47.86 | 235.87 | 27.00 | 47.86 |
| Nicaragua | - | 0.71 | - | - | - | -- | - | - | - | 0.13 | - | 0.13 | 0.13 | 0.71 | 0.13 |
| Panama | - | - | - | - | - | - | - | - | - | 0.04 | 0.003 | 0.03 | 0.04 | 0.003 | 0.03 |
| Paraguay | - | - | - | - | - | - | - | - | - | 0.03 | 0.04 | - | 0.03 | 0.04 | - |
| Peru | 3.46 | 4.61 | 0.81 | 13.12 | - | 4.42 | 0.19 | 0.49 | - | 67.42 | - | 55.19 | 84.19 | 5.10 | 60.42 |
| Uruguay | - | 2.09 | 0.00 | 0.00 | 0.04 | - | - | 0.00 | - | 0.14 | 0.0001 | 0.05 | 0.14 | 2.13 | 0.05 |
| Venezuela | 159.57 | 0.68 | 106.51 | 19.58 | 1.46 | - | 0.75 | - | 0.55 | 40.03 | 0.0003 | 1.36 | 219.94 | 2.14 | 108.43 |
Appendix D

References
- Stanley, J.; Stein, B.H. La Herencia Colonial de América Latina; Siglo Veintiuno: Ciudad de México, México, 1970; ISBN 9682301572. [Google Scholar]
- Ferrer, A. De Cristóbal Colón a Internet: América Latina y la Globalización; Fondo de Cultura Económica: Mexico City, Mexico, 2002; ISBN 9681664523. [Google Scholar]
- Narins, T. The China Triangle: Latin America’s China Boom and the Fate of the Washington Consensus. AAG Rev. Books 2017, 5, 17–19. [Google Scholar] [CrossRef]
- Tanimoto, A.H.; Gabarrell Durany, X.; Villalba, G.; Pires, A.C. Material flow accounting of the copper cycle in Brazil. Resour. Conserv. Recycl. 2010, 55, 20–28. [Google Scholar] [CrossRef]
- Jaramillo, P.; Lehmann, S.; Moreno, D. China, Precios de Commodities y Desempeño de América Latina: Algunos Hechos Estilizados. Cuad. Econ. 2009, 46, 67–105. [Google Scholar] [CrossRef]
- Rosales, O. América Latina y el Caribe y China: Hacia una Nueva era de Cooperacion Economica; CEPAL: Santiago, Chile, 2015. [Google Scholar]
- World Trade Organization (WTO). International Trade Statistics 2015. Special Focus: World Trade Organization: 1995–2014; WTO: Geneva, Switzerland, 2015. [Google Scholar]
- Brunner, P.H.; Rechberger, H. Practical Handbook of Material Flow Analysis; CRC Press: Boca Raton, FL, USA, 2004. [Google Scholar]
- Allesch, A.; Brunner, P.H. Material flow analysis as a decision support tool forwaste management: A literature review. J. Ind. Ecol. 2015, 19, 753–764. [Google Scholar] [CrossRef]
- Giljum, S. Trade, Materials Flows, and Economic Development in the South: The Example of Chile. J. Ind. Ecol. 2008, 8, 241–261. [Google Scholar] [CrossRef]
- Organisation for Economic Co-Operation and Development (OECD). Measuring Material Flows and Resource Productivity; OECD: Paris, France, 2008; Volume I. [Google Scholar]
- Schaffartzik, A.; Mayer, A.; Gingrich, S.; Eisenmenger, N.; Loy, C.; Krausmann, F. The global metabolic transition: Regional patterns and trends of global material flows, 1950–2010. Glob. Environ. Chang. 2014, 26, 87–97. [Google Scholar] [CrossRef] [PubMed]
- Wang, P.-C.; Lee, Y.-M.; Chen, C.-Y. Estimation of Resource Productivity and Efficiency: An Extended Evaluation of Sustainability Related to Material Flow. Sustainability 2014, 6, 6070–6087. [Google Scholar] [CrossRef]
- Schaffartzik, A.; Wiedenhofer, D.; Eisenmenger, N. Raw Material Equivalents: The Challenges of Accounting for Sustainability in a Globalized World. Sustainability 2015, 7, 5345–5370. [Google Scholar] [CrossRef]
- Vexler, D.; Bertram, M.; Kapur, A.; Spatari, S.; Graedel, T.E. The contemporary Latin American and Caribbean copper cycle: 1 Year stocks and flows. Resour. Conserv. Recycl. 2004, 41, 23–46. [Google Scholar] [CrossRef]
- Perez-Rincon, M.A. Colombian international trade from a physical perspective: Towards an ecological “Prebisch thesis”. Ecol. Econ. 2006, 59, 519–529. [Google Scholar] [CrossRef]
- Vallejo, M.C. Biophysical structure of the Ecuadorian economy, foreign trade, and policy implications. Ecol. Econ. 2010, 70, 159–169. [Google Scholar] [CrossRef]
- Walter, M.; Brun, J.; Pérez-manrique, P.; González-martínez, A.C.; Alier, J.M. Análisis de flujo de materiales de la economía argentina (1970–2009). Tendencias y conflictos extractivos. Ecol. Política 2011, 45, 94–98. [Google Scholar]
- United Nations Environment Programme (UNEP). Recent Trends in Material Flows and Resource Productivity in Latin America; UNEP: Panama City, Panama, 2007; p. 2768. [Google Scholar] [CrossRef]
- Russi, D.; Gonzalez-Martinez, A.C.; Silva-Macher, J.C.; Giljum, S.; Martínez-Alier, J.; Vallejo, M.C. Material flows in Latin America: A comparative analysis of Chile, Ecuador, Mexico, and Peru, 1980–2000. J. Ind. Ecol. 2008, 12, 704–720. [Google Scholar] [CrossRef]
- West, J.; Schandl, H. Material use and material efficiency in latin america and the caribbean. Ecol. Econ. 2013, 94, 19–27. [Google Scholar] [CrossRef]
- Giljum, S.; Eisenmenger, N. North-South Trade and the Distribution of Environmental Goods and Burdens: A Biophysical Perspective. J. Environ. Dev. 2004, 13, 73–100. [Google Scholar] [CrossRef]
- Giljum, S.; Hubacek, K. International trade, material flows and land use: Developing a physical trade balance for the European Union. Analysis 2001, IR-01-059, 1–66. [Google Scholar]
- Leah, T.; del Bene, D.; Alier, J.M. Mapping the frontiers and frontlines of global e nvironmental justice: The EJAtlas. J. Political Ecol. 2015, 22, 255–278. [Google Scholar]
- Bottaro, L.; Sola-Alvarez, M. Conflictos Mineros en América Latina: Extracción, Saqueo y Agresión. Estado de Situación en 2016; OCMAL: Buenos Aires, Argentina, 2017. [Google Scholar]
- Observatorio de Conflictos Mineros de América Latina (OCMAL). Conflictos Mineros en América Latina. Available online: https://mapa.conflictosmineros.net/ocmal_db-v2/ (accessed on 19 January 2018).
- Aitken, D.; Rivera, D.; Godoy-Faúndez, A.; Holzapfel, E. Water Scarcity and the Impact of the Mining and Agricultural Sectors in Chile. Sustainability 2016, 8, 128. [Google Scholar] [CrossRef]
- Himley, M. Matthew Global Mining and the Uneasy Neoliberalization of Sustainable Development. Sustainability 2010, 2, 3270–3290. [Google Scholar] [CrossRef]
- Valero, A.; Valero, A. Thanatia: The Destiny of the Earth’s Mineral Resources. A Thermodynamic Cradle-to-Cradle Assessment; World Scientific Press: London, UK, 2014. [Google Scholar]
- Valero, A.; Valero, A.; Domínguez, A. Exergy Replacement Cost of Mineral Resources. J. Environ. Account. Manag. 2013, 1, 147–158. [Google Scholar] [CrossRef]
- Henckens, M.L.C.M.; van Ierland, E.C.; Driessen, P.P.J.; Worrell, E. Mineral resources: Geological scarcity, market price trends, and future generations. Resour. Policy 2016, 49, 102–111. [Google Scholar] [CrossRef]
- Torres, C.; Valero, A.; Valero, A. Exergoecology as a tool for ecological modelling. The case of the US food production chain. Ecol. Model. 2013, 255, 21–28. [Google Scholar] [CrossRef]
- Calvo, G.; Valero, A.; Carmona, L.; Whiting, K. Physical Assessment of the Mineral Capital of a Nation: The Case of an Importing and an Exporting Country. Resources 2015, 4, 857–870. [Google Scholar] [CrossRef]
- Calvo, G.; Valero, A.; Valero, A. Assessing maximum production peak and resource availability of non-fuel mineral resources: Analyzing the in fl uence of extractable global resources. Resour. Conserv. Recycl. 2017, 125, 208–217. [Google Scholar] [CrossRef]
- Calvo, G.; Valero, A.; Valero, A. Material flow analysis for Europe: An exergoecological approach. Ecol. Indic. 2016, 60, 603–610. [Google Scholar] [CrossRef]
- Gabriel Carmona, L.; Whiting, K.; Valero, A.; Valero, A. Colombian mineral resources: An analysis from a Thermodynamic Second Law perspective. Resour. Policy 2015, 45, 23–28. [Google Scholar] [CrossRef]
- Bejan, A.; Tsatsanoris, G.; Moran, M. Thermal Design & Optimization; John Wily & Sons, Inc.: Etobicoke, ON, Canada, 1996. [Google Scholar]
- Dincer, I.; Rose, M.A. EXERGY Energy, Environment and Sustainable Development, 2nd ed.; Elsevier: Oxford, UK, 2013. [Google Scholar]
- Sato, N. Chemical Energy and Exergy: An Introduction to Chemical Thermodynamics; Elsevier: Oxford, UK, 2005. [Google Scholar]
- Valero, A.; Valero, A. What are the clean reserves of fossil fuels? Resour. Conserv. Recycl. 2012, 68, 126–131. [Google Scholar] [CrossRef]
- Perrot, P. A to Z of Thermodynamics; Oxford University Press: Oxford, UK, 1998; ISBN 9780198565529. [Google Scholar]
- Moran, M.J.; Shapiro, H.N.; Boettner, D.D.; Bailey, M.B. Fundamentals of Engineering Thermodynamics, 7th ed.; John Wiley & Sons: Hoboken, NJ, USA, 2011; ISBN 978-0470495902. [Google Scholar]
- Szargut, J. Chemical exergies of the elements. Appl. Energy 1989, 32, 269–286. [Google Scholar] [CrossRef]
- Valero, A.; Valero, A. The Exergy Calculator. Online tool available at the Exergoecology Portal. Available online: http://www.exergoecology.com/excalc/index_html/new_calc_exergy (accessed on 19 January 2018).
- Valero, A.; Valero, A.; Vieillard, P. The thermodynamic properties of the upper continental crust: Exergy, Gibbs free energy and enthalpy. Energy 2012, 41, 121–127. [Google Scholar] [CrossRef]
- Szargut, J.; Ziebik, A.; Stanek, W.; Valero Delgado, A. Towards an international legal reference environment. In Proceedings of the ECOS 2005, Trondheim, Norway, 29 June–3 July 2015; pp. 409–420. [Google Scholar]
- Szargut, J.; Ziębik, A.; Stanek, W. Depletion of the non-renewable natural exergy resources as a measure of the ecological cost. Energy Convers. Manag. 2002, 43, 1149–1163. [Google Scholar] [CrossRef]
- Ayres, R.U. Energy, Complexity and Wealth Maximization; Springer International Publishing: Berlin, Germany, 2016; ISBN 978-3-319-30545-5. [Google Scholar]
- Dewulf, J.; Van Langenhove, H. Exergy. In Renewables-Based Technology; John Wiley & Sons, Ltd.: Chichester, UK, 2006; pp. 111–125. ISBN 9780470022443. [Google Scholar]
- Domínguez, A.; Valero, A. GLOBAL GOLD MINING: Is technological learning overcoming the declining in ore grades? J. Environ. Account. Manag. 2013, 1, 85–101. [Google Scholar] [CrossRef]
- Cox, D.P.; Singer, D.A. Mineral Deposits Models 1992; U.S. Geological Survey: Denver, CO, USA. Available online: https://pubs.usgs.gov/bul/1693/report.pdf (accessed on 6 March 2018).
- Valero, A.; Agudelo, A.; Valero, A. The crepuscular planet. A model for the exhausted atmosphere and hydrosphere. Energy 2011, 36, 3745–3753. [Google Scholar] [CrossRef]
- Calvo, G.; Valero, A.; Valero, A. Thermodynamic Approach to Evaluate the Criticality of Raw Materials and Its Application through a Material Flow Analysis in Europe. J. Ind. Ecol. 2017, 0. [Google Scholar] [CrossRef]
- Valero, A.; Valero, A. Thanatia: The Destiny of the Earth’s Mineral Resources; World Scientific: Singapore, 2014; ISBN 978-981-4273-93-0. [Google Scholar]
- Eurostat Economy-Wide Material Flow Accounts (EW-MFA) Compilation Guide 2013. Available online: http://ec.europa.eu/eurostat/web/environment/methodology (accessed on 6 March 2018).
- Departamento Nacional de Produção Mineral do Brasil (DNPM). Sumário Mineral; DNPM: Brasília, Brazil, 2015.
- Servicio Nacional de Geología y Minería (SERNAGEOMIN). Anuario de la Minería de Chile 2015; Servicio Nacional de Geología y Minería: Región de Tarapacá, Chile, 2015.
- Comisión Chilena del Cobre Anuario de Estadísticas del Cobre y Otros Minerales 1996–2015; COCHILCO: Santiago, Chile, 2015.
- Sistema de Información Minero Colombiano (SIMCO) Reportes de Minería. Available online: http://www.simco.gov.co/simco/Estadísticas/Producción/tabid/121/Default.aspx (accessed on 2 November 2016).
- Agencia de Regulación y Control Minero de Ecuador (ARCOM). Producción Mineral Reportada 2000–2014; ARCOM: Quito, Ecuador, 2014.
- Banco Central del Ecuador (BCE). Sistema de Información Macroeconómica-BCE (Versión BETA); BCE: Quito, Ecuador, 2017; Available online: https://www.bce.fin.ec/index.php/component/k2/item/788 (accessed on 5 December 2017).
- Ministerio de Energía y Minas. Perú 2015 Anuario Minero Reporte Estadístico; Ministerio de Energía y Minas: Lima, Perú, 2015.
- British Geological Survey (BGS). World Mineral Statistics Data. Available online: https://www.bgs.ac.uk/mineralsuk/statistics/wms.cfc?method=searchWMS (accessed on 20 June 2016).
- Comisión Económica para América Latina y el Caribe (CEPAL). Base de Datos Estadísticos de Comercio Exterior (BADECEL). Available online: http://interwp.cepal.org/badecel/index.html (accessed on 20 June 2017).
- UN. Statistics Division UN Comtrade. Available online: https://comtrade.un.org/data/ (accessed on 20 June 2017).
- United States Geological Survey (USGS). Mineral Commodity Summaries 2013; USGS: Reston, VA, USA, 2013; p. 198.
- Carrera, P.; Castillo, T.; López, J.; Rivadeneira, T.; Segura, K. Informe de Estadísticas Energéticas 2015; OLADE: Quito, Ecuador, 2015. [Google Scholar]
- United States Geological Survey (USGS). International Minerals Statistics and Information; USGS: Reston, VA, USA, 2017.
- Human Rights Watch. A Poisonous Mix Child Labor, Mercury, and Artisanal Gold Mining in Mali; Human Rights Watch: New York, NY, USA, 2011. [Google Scholar]
- MMSD. Bolivia Estudio Regional/Nacional sobre Pequeña Mineria y Artesanal. Reporte; MEDMIN Foundation: La Paz, Bolivia, 2003. [Google Scholar]
- Telmer, K.; Stapper, D. A Practical Guide Reducing Mercury Use in Artisanal and Small-Scale Gold Mining; UNEP: Nairobi, Kenya, 2012. [Google Scholar]
- The Global Initiative against Transnational Organized Crime. Organized Crime and Illegally Mined Gold in Latin America; The Global Initiative: Geneva, Switzerland, 2016. [Google Scholar]
- International Copper Study Group (ICSG). The World Copper Factbook 2014; ICSG: Lisbon, Portugal, 2014. [Google Scholar]
- Secretaria de Energía de México Sistema de Información Energética. Available online: http://sie.energia.gob.mx/bdiController.do?action=cuadro&cvecua=IE7C01 (accessed on 19 January 2018).
- Harper, E.M.; Bertram, M.; Graedel, T.E. The contemporary Latin America and the Caribbean zinc cycle: One year stocks and flows. Resour. Conserv. Recycl. 2006, 47, 82–100. [Google Scholar] [CrossRef]
- Schandl, H.; Fischer-kowalski, M.; West, J.; Giljum, S.; Dittrich, M.; Geschke, A.; Lieber, M.; Schaffartzik, A.; Krausmann, F. Global Material Flows and Resource Productivity; UNESCO: France, Paris, 2016; ISBN 9789280735543. [Google Scholar]


| Mineral Ore | ERC (GJ/t) | |
|---|---|---|
| Non-fuel minerals | ||
| Gold | Native gold | 553,250 |
| Silver | Argentite | 7371 |
| Zinc | Sphalerite | 1627 |
| Copper | Chalcopyrite | 292 |
| Lead | Galena | 37 |
| Limestone | Calcite | 3 |
| Phosphate rock | Fluorapatite | 0.4 |
| Fuel minerals | ||
| Crude Oil | 46.3 | |
| Coal | 24.3–31.6 | |
| Natural Gas | 39.4 |
| LA-20 (2013 Data) | EU-28 (2011 Data) | |||||
|---|---|---|---|---|---|---|
| DE/DMC | I/DMC | E/DMC | DE/DMC | I/DMC | E/DMC | |
| Non-fuel minerals | ||||||
| Mass | 1.88 | 0.11 | 1.00 | 0.79 | 0.30 | 0.09 |
| ERC | 1.50 | 0.16 | 0.66 | 0.45 | 0.94 | 0.40 |
| Fossil fuels | ||||||
| Mass | 1.36 | 0.24 | 0.59 | 0.52 | 0.62 | 0.13 |
| ERC | 1.35 | 0.22 | 0.57 | 0.41 | 0.76 | 0.17 |
| Country | DMC (Mtoe) | DE/DMC | I/DMC | E/DMC |
|---|---|---|---|---|
| Argentina | 73.90 | 1.07 | 0.16 | 0.23 |
| Bolivia | 15.22 | 2.29 | 0.00 | 1.29 |
| Brazil | 669.62 | 1.16 | 0.21 | 0.37 |
| Chile | 63.37 | 1.38 | 0.33 | 0.71 |
| Colombia | 37.52 | 3.27 | 0.05 | 2.32 |
| Costa Rica | −6.64 | 0.00 | −0.22 | −1.22 |
| Cuba | 10.66 | 0.50 | 0.50 | 0.00 |
| Dominican Republic | 16.67 | 0.91 | 0.17 | 0.08 |
| Ecuador | 10.71 | 2.91 | 0.00 | 1.91 |
| El Salvador | −1.97 | −0.46 | −0.15 | −1.61 |
| Guatemala | 0.11 | 1.00 | 0.00 | 0.00 |
| Honduras | 1.13 | 0.94 | 0.06 | 0.00 |
| Mexico | 148.05 | 1.59 | 0.18 | 0.78 |
| Nicaragua | 0.71 | 0.18 | 1.00 | 0.18 |
| Panama | 0.02 | 2.16 | 0.15 | 1.31 |
| Paraguay | 0.07 | 0.43 | 0.57 | 0.00 |
| Peru | 28.87 | 2.92 | 0.18 | 2.09 |
| Uruguay | 2.22 | 0.06 | 0.96 | 0.02 |
| Venezuela | 113.66 | 1.94 | 0.02 | 0.95 |
| Average LA-20 | 62.31 | 1.43 | 0.19 | 0.62 |
© 2018 by the authors. Licensee MDPI, Basel, Switzerland. This article is an open access article distributed under the terms and conditions of the Creative Commons Attribution (CC BY) license (http://creativecommons.org/licenses/by/4.0/).
Share and Cite
Palacios, J.-L.; Calvo, G.; Valero, A.; Valero, A. Exergoecology Assessment of Mineral Exports from Latin America: Beyond a Tonnage Perspective. Sustainability 2018, 10, 723. https://doi.org/10.3390/su10030723
Palacios J-L, Calvo G, Valero A, Valero A. Exergoecology Assessment of Mineral Exports from Latin America: Beyond a Tonnage Perspective. Sustainability. 2018; 10(3):723. https://doi.org/10.3390/su10030723
Chicago/Turabian StylePalacios, Jose-Luis, Guiomar Calvo, Alicia Valero, and Antonio Valero. 2018. "Exergoecology Assessment of Mineral Exports from Latin America: Beyond a Tonnage Perspective" Sustainability 10, no. 3: 723. https://doi.org/10.3390/su10030723
APA StylePalacios, J.-L., Calvo, G., Valero, A., & Valero, A. (2018). Exergoecology Assessment of Mineral Exports from Latin America: Beyond a Tonnage Perspective. Sustainability, 10(3), 723. https://doi.org/10.3390/su10030723