Assessment of and Improvement Strategies for the Housing of Healthy Elderly: Improving Quality of Life

1
College of Creative Design, Asia University, 500 Lioufeng Rd., Wufeng, Taichung 41354, Taiwan
2
Faculty of Humanities and Arts, Macau University of Science and Technology, Avenida Wai Long, Taipa 999078, Macau, China
3
Graduate Institute of Urban Planning, College of Public Affairs, National Taipei University, 151, University Rd., San Shia District, New Taipei City 23741, Taiwan
*
Author to whom correspondence should be addressed.
Sustainability 2018, 10(3), 722; https://doi.org/10.3390/su10030722
Submission received: 1 February 2018
/
Revised: 2 March 2018
/
Accepted: 2 March 2018
/
Published: 6 March 2018
Abstract
:Global population is aging, particularly in developed countries and cities. Through the “Friendly Elderly Cities” and “Aging in Place” initiatives, various countries are making great efforts to improve the welfare and quality of life of the elderly, with the aim of catering to the physical and spiritual health as well as social welfare of the elderly. In this regard, the improvement of the housing environment of the elderly is one of the key factors in their quality of life and health. This study aims to effectively assess and improve the housing environment of the elderly in order to enhance their quality of life; it also aims to contribute the knowledge about improving elderly housing by applying an assessment framework using expert interviews and data collected from relevant literature. Using a mixed Multi-Criteria Decision Analysis model, a combination of the DEMATEL (Decision Making Trial and Evaluation Laboratory)-based ANP (Analytic Network Process) (DANP) and the modified VlseKriterijumska Optimizacija I Kompromisno Resenje (VIKOR) methods, and the investigations and assessments in the case study, this study proposes strategies and directions for improving elderly housing. The study results indicate that, as distinct from using traditional methodologies where the hypothesis criteria are mutually independent, the proposed hybrid model (examining real-life problems by considering the mutual influences of factors) identifies a priority sequence wherein emphasis is placed on improving ventilation and air quality rather than adjustment of temperature. The systemic way of thinking shifts the focus from the most apparent problems to the root cause of the problems. Doing so avoids any mismatch of resource allocation in decision-making and thus maximizes the efficiency and sustainability of the improvement.
1. Introduction
In 1987, the World Commission of Environment and Development gave sustainable development a definition: (development) “that meets the needs of the present without compromising the ability of future generations to meet their own needs”. This definition gives rise to the necessity of sustainable decision-making based on economic, social, and environmental principles [1,2]. Hence, in response to the problem of aging society and the objectives of sustainable development in terms of economic growth, social services, and environmental improvement, the aged population is not to be neglected by research on how to build a friendly city and sustainable policies during the development of a global city [3]. However, the issue of aging society is specific to each country and region. Planning and strategies regarding the urban environment, communities and neighborhoods, housing policies, social welfare, and quality of life must take into consideration the professional and resource-intensive services required by the aged population [4]. Only through this can sustainable urban development and strategies for continuous improvement be possible.
It is estimated that by 2050, the elderly population (aged 60+) will exceed 2 billion globally [5]. Therefore, addressing the maintenance of the elderly people’s health is even more important than the problem of an aging population. Initiatives proposed by World Health Organization’s 2007 report include the idea of “positive aging” as a guiding principle for the development of aging cities, and improving the welfare and productivity of urban residents through modification and services of urban structures, in addition to creating elderly-friendly cities. This benefits the elderly by creating living environments that compensate for aging-related physical and social changes [6]. Yet, housing is an important health-related determinant for the residents’ health and safety as well as sustainable development [7]. Therefore, housing is remarkably important to the elderly and examining the development and restricting factors of housing environment can help address the important issues of maintaining the health of the elderly and improving their quality of life [8].
Much research has testified that the ability of the elderly to continue to live in their original homes generates a more positive feeling and effect on the maintenance of health, control of diseases and quality of life [9,10,11]. For some elderly people who suffer from deteriorating bodily functions and disabilities and thus are unable to live independently, it is also helpful to continue living in their so-called “homes” [12,13]. A home signifies safety and security for the people living in it [13], and this is also the essence of Hancock’s (1987) idea of “aging in place” [12,14,15]. Many studies regarding the level of satisfaction of the elderly with their housing environment show that the improvement of housing environment has a significant influence on their psychological well being and level of satisfaction with life, which markedly increases the elderly’s quality of life [11].
As the elderly experience the gradual deterioration of biological functions and various social changes, they need flexible strategies and a constantly adapting and changing environment to deal with the issues of their aging [4]. The general aim of the housing policies in Finland in 2013 were to ensure that a sufficient number of affordable housing was provided to the elderly as well as the homeless and the mentally disabled, while improving the conditions of existing housing [16]. In 2007, the WHO also provided the guidelines and policies for the housing conditions of the elderly. In the face of the elderly’s deteriorating bodily functions, reactions, and mobility coupled with changes in family structure and lifestyles [17], the old housing that they have dwelled in for a long time certainly cannot meet some aspects of their actual requirements. However, elderly people may not always perceive these requirements because their perceptions of their family environment and their emotional attachment to the housing may fuse [9] to create a sense of familiarity and spatial identity [18]. Therefore, they may be oblivious to the impediments experienced regarding certain functions of living, and thus the elderly may not be willing to change their existing lifestyles and may reject the assessment and improvement plans for their existing housing. This is also one of the reasons why it is easier for some unforeseen accidents to occur in the home. As such, intervention measures for improving housing environments are necessary to enhance the quality of life of the elderly. However, these cannot be achieved overnight and require strategic and continuous implementation. To achieve this goal, it is necessary to engage in effective communication with the elderly while considering their personal preferences [19] and personalized requirements [12].
The idea of successful aging proposed by Rowe and Kahn in 1997 can be defined in three parts: the low likelihood of disease and disabilities, a high degree of perception and physical ability, and active participation in social activities [20]. The living environment of the elderly concerns not only health, daily activities, and their subjective sense of happiness but also health-related negative events and dangers [17]. Therefore, the improvement of housing should enable the elderly to lead a safe life and to maintain their health, all in accordance with their level of physical mobility and their sense of comfort and happiness. However, the improvement of housing environment also means the elderly will be required to modify some of their existing living habits and lifestyles. Since humans and their environment are interactive and reciprocally influenced, human–environment interaction relies on emotional and cognitive subjective experiences; in other words, humans display different levels of satisfaction with housing through their perception of the physical environment and their emotional fixation on it [8]. In the field of environmental gerontology, Lawton (1982) also emphasized the interaction between personal competence and the home environment of older people [14]. According to the person–environment fit (P–E) theory, the significant influence of the interdependent factors of humans, environment, and P–E is an important predictor of residential satisfaction, with direct impacts on the old-age mental health of the elderly [21]. At the same time, with their own adaptability, older people that are subject to long-term external stimuli can gradually adapt to the environment. This can explain why they manifest life satisfaction despite the adversity of their external environment. However, as their age increases, many old-age conditions start to emerge. Since their ability to counteract the adverse environment weakens, the environmental pressure that they withstand builds up. As a result, compared with other age groups, environmental impacts on older people are more significant owing to their aging and life changes.
Once again, to implement strategies for evaluating and improving the housing conditions of older people to enhance their health conditions and quality of life, from the global perspective, it is necessary to devise effective and sustainable housing improvement strategies and expand their scope to urban, town, and community re-designing; this way, a healthy living environment that is truly suitable for the elderly and all other groups can be established. This is also the vision and goal of age-friendly cities [4]. Take “new urbanism”, which emerged in the U.S. in the 1990s, as an example [22]. Its principle was to re-define the significance and format of cities and communities, so as to construct new cities and communities that were more beneficial to the residents’ lives, work, and health. It also retained valuable existing architectures and communities as part of its construction and design approach of mixing the old and the new to improve urban landscape and functionality. To extend this approach, in addition to elderly care communities that are newly constructed or under planning along with residential housing (social housing), existing urban housing with satisfactory health conditions should also be leveraged, as this may reduce the pollution and waste disposal resulting from the construction and demolition of buildings. It can also serve as a sustainable strategy for improving the housing conditions of older people and, consequently, their health and quality of life. Universal design [23] and inclusive design [24] should also be introduced gradually, as they devise products and spatial environments suitable for all users while contributing to the continuous improvement in the physical and mental health of the elderly by considering and satisfying their diverse needs.
The present study aims to therefore examine and devise a systemic and continuous strategic approach for improving the existing housing of the elderly. Existing research on housing improvement and its health impacts are dominated by quantitative studies based on statistical regression. However, as the premise of this quantitative approach is to assume that all criteria are independent of one another, it is improbable to conduct statistical analyses on systemic complexity, in which criteria display dynamic and non-linear cause-effect relations. Instead, this study adopts the Multiple attribute decision making (MADM) method combined with three analytical techniques. This can not only prioritize the criteria based on the intensity of their interrelations but also identify the root of the problem to help formulate optimal improvement strategies, in turn facilitating effective resource allocation and continuous, dynamic improvement targeted on the needs of the sustainability objective of ameliorating old-age housing conditions.
2. Framework and Analysis of Improvement and Assessment of Existing Housing Quality for the Elderly
Research related to aging has put a heavy emphasis on the effects of housing on the health and well being of the elderly [3,14,20,25], referring to the home environment as a determinant for healthy aging [26]. However, many of these studies were based on descriptive research and lacked validity and a detailed assessment of their concrete methods [4,8,12,16,27]. Although some of the intervention measures focused on the physical environment [15,17,24,28], others were concerned with improvements in the social environment [4,11,26,29]. Despite the extensive recognition of the achievements made by studies related to housing and its health impacts on older people, these studies seldom applied effective performance assessment tools to reality as a reference to support the formulation of concrete improvement strategies. Therefore, this study focuses on the effects of the indoor living environment on the health of the elderly because there is a complex interrelationship among indoor housing factors that can be harmful to health. In 2010, the member states of the World Health Organization arrived at the consensus that “the housing and residential environments are localities having high environmental health risks in relation to injury from accidents, as well as infectious and non-communicable diseases” [30]. Hence, affecting factors that are beyond the realm of the indoor living environment, such as social environment, medical services, and communities and neighborhoods, are excluded from the assessment framework. The research scope is narrowed down to important indoor housing factors that directly affect the health and safety of the elderly. The assessment dimensions and criteria were extracted from previous studies through literature review.
To the elderly, the home is a familiar and safe place. The home offers familiarity and security to the person who lives there, and it is an important signification of independence and autonomy in very old age [13]. Moreover, safety confers not only a perceptive meaning to the elderly but also signifies the safety of the living environment (buildings, communities, and rooms) in the actual living experience [11,13] as well as the prevention of accidents. Housing improvement policies guided by safety considerations mainly strive to prevent any possible accidents, such as falling [31,32,33], fire caused by a power surges and short circuits, or fire accidents [34]. Hence, such interventions for the improvement of safety and prevention of accidents are to ensure the elderly are secure in their daily lives, preventing them from suffering accident-related fatalities and injuries.
Nevertheless, in addition to focusing on physical health and family care in living spaces, perceptions of bodily and emotional comforts are equally important when it comes to studying aging and the lives of the elderly [35]. Perceptions of bodily comforts concern spatial quality. Spatial quality [36] emphasizes improving the quality of the living area of the elderly, which affects their subjective sense of happiness [37]. The four parameters derived by Frontczak and Wargocki in their 2011 paper on the comfort of indoors environment are “thermal, visual, acoustic environment and air quality” [38]. They encompass the adjustment of and response to room temperatures [39,40,41], the intensity of lighting (natural and artificial) [11,37,42,43], indoor color schemes [37], indoor ventilation and air quality [38,44], noise disturbances [45], and even the fact that improvements in the aesthetical appearance of a physical environment may directly affect people’s subjective well being [36,37].
With aging population, living environments must be modified to make people’s lives easier and more comfortable in their old age [25]. Research has shown that the elderly who live in their own homes and are able to look after most matters in their daily lives typically have a higher quality of life than those who require constant assistance [12,46]. The assessment and improvement of the housing environment of the elderly not only increase the safety and comfort of the housing but also improve the various functions of living, affording them more convenience and utility in their daily lives and enabling them to more efficiently manage their own lives.
Incorporating all of the above, the improvement of the quality of the housing environment for increasing the quality of life of the elderly includes three aspects: personal safety, perceptive comfort, and functionality of space. These three aspects interact closely with one another, with the core purpose to ensure the maintenance of the health of the elderly. Safety is achieved by relying on external intervention approaches and methods to ensure the elderly can live with peace of mind and safety. Comfort is achieved through adjustment and control that improve the quality of the space so that the elderly feel comfortable both physically and psychologically. The final element of functionality is achieved through enhancing the necessary functions of living by improving the housing environment. The ultimate aim is to enable the elderly to enjoy the greatest degree of happiness in health, safety, comfort, and convenience.
2.1. Personal Safety
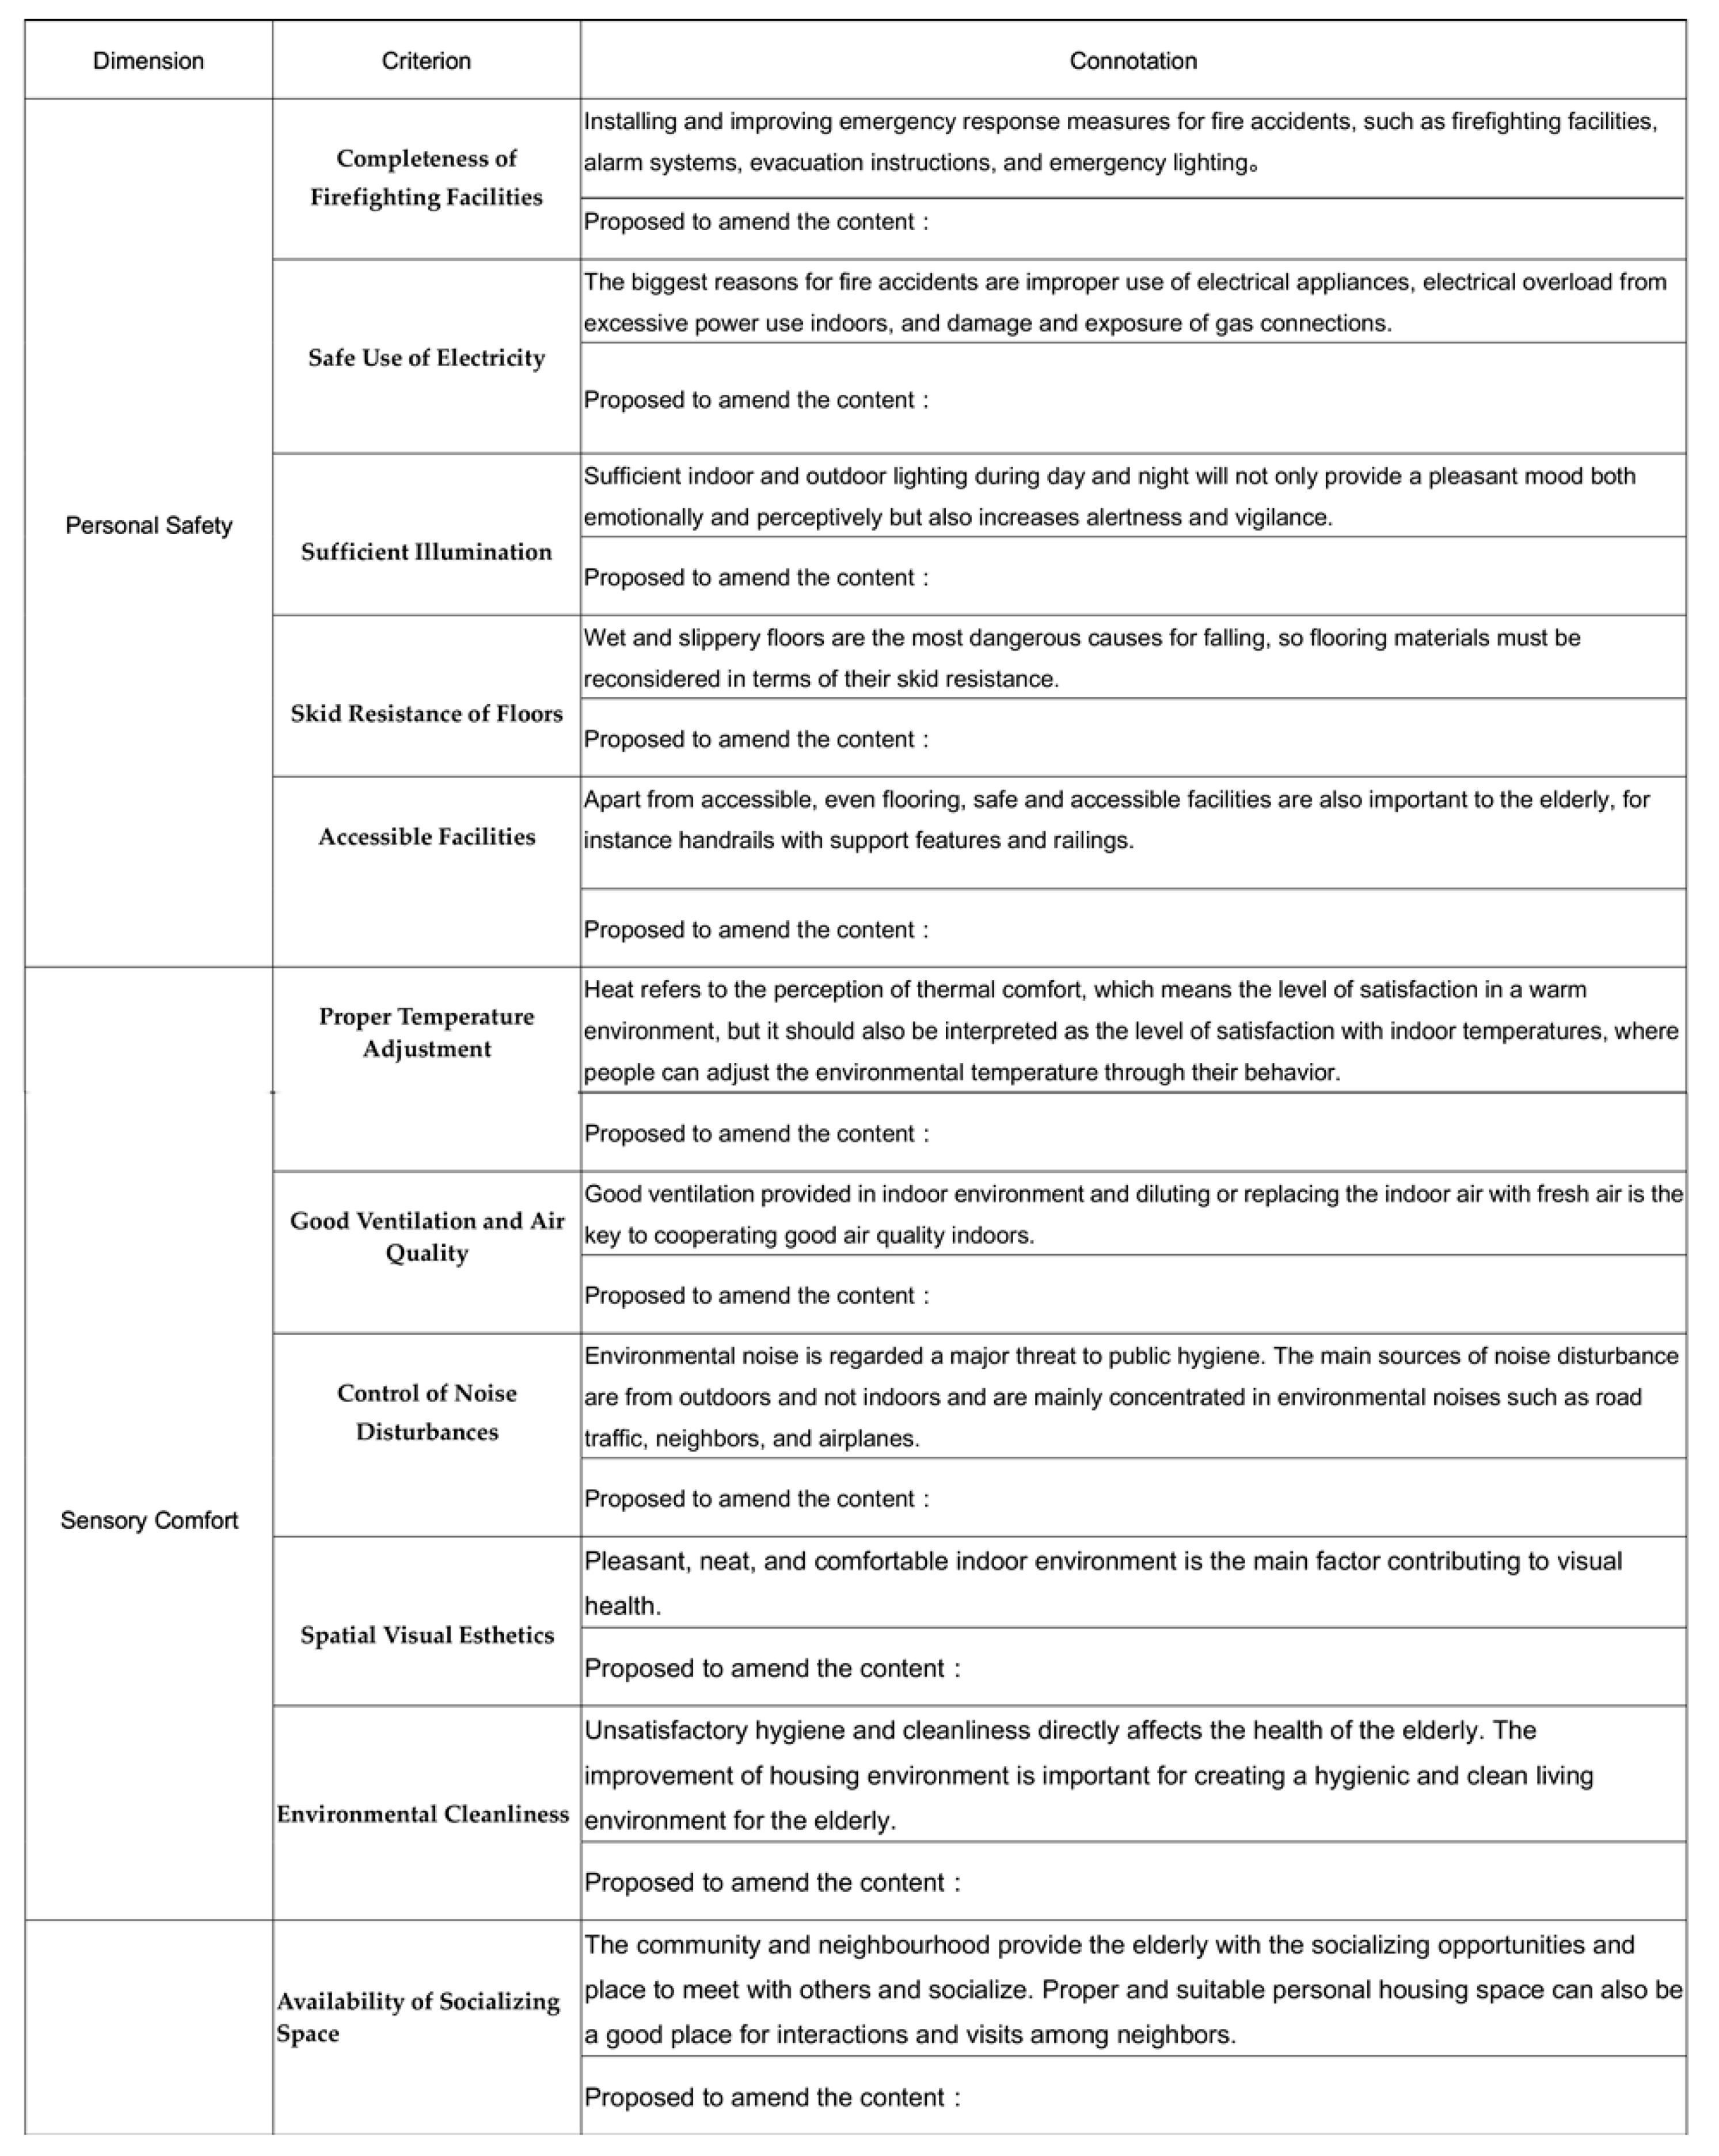
The assessment and improvement of the original housing of the elderly to enhance safety and prevent accidents involve an active intervention approach. All the intervention measures for assessment and improvement focus not only on the present circumstances, but more importantly also on life in the future [27]. A good outdoors environment in a residential area can enable the elderly to engage in daily activities independently and safely and encourage them to be more mobile [28]. In terms of the housing buildings, their structural durability [17,47] and the strength of doors, windows, and other relevant parts must be tested. Even the housing’s protection against natural disasters, such as typhoons and earthquakes, needs to be considered. Additionally, fire facilities, alarm systems, evacuation instructions, and emergency lighting for preventing and responding to fire accidents [48] must be put in place and improved. The biggest causes of fire are the improper use of electrical appliances, electrical overload from excessive power use indoors, and damage and exposure of gas connections, all leading to electricity-caused fires [47]. These issues may result in accidental deaths of and injuries to the elderly, as their perceptive and sensory functions deteriorate [48].
Once again, sufficient lighting indoors and outdoors day and night affects the safety of the elderly. Lighting provides not only a pleasant mood both emotionally and perceptually but also higher alertness and vigilance [49]. Apart from that, wet and slippery floors in bathrooms and kitchens make these areas the most dangerous for falling, which can then lead to major injuries and medical expenses [32]. Therefore, flooring materials must, once again, be considered in terms of their anti-slip [4,36] properties.
Bathrooms, kitchens, and bedrooms are areas in the housing environment where impediments occur most frequently [50]. The impediments include uneven flooring and thresholds [31], which are risk factors. Therefore, apart from even, impediment-free floors, safe and impediment-free facilities are also important to the elderly, such as handrails with support features and railings [31,32,42,50].
2.2. Sensory Comfort
There are many risk factors in the living space of the elderly [34], including their senses of the physical environment. These factors may exert a menacing and damaging effect on the health of elderly people, as well as causing them physical sensory discomfort. Among the four parameters for the comfort of indoor environments mentioned above, heat refers to the perception of thermal comfort, which means the level of satisfaction with a warm environment [37], but it should also be interpreted as the level of satisfaction with the indoor temperature. For the elderly, overly hot or cold environments cause discomfort. Frontczak and Wargocki’s research indicates that people are able to regulate the temperature of their environment through their behavior [39]. Ormandy and Ezratty also point out that the perception of the thermal comfort, not the measurement of the environmental temperature, is used to determine the solution plan for the indoor temperature of housing. The advantage of this approach is that it considers personal senses and other factors, particularly those that are difficult to measure [40]. Hence, the standards for a comfortable indoor temperature for elderly housing vary.
The outdoor climate and seasons also affect the perception of thermal comfort. Compared to air-conditioned buildings, naturally ventilated buildings usually have a higher neutral temperature [39]. Research has demonstrated that providing good ventilation indoors and diluting or replacing the existing indoor air with fresh air are keys to good indoor air quality [44]. Nevertheless, there are still other factors influencing indoor air quality. Poor air quality is caused mainly by unpleasant smells and discomfort-causing stimulants [39]. Poor air quality often leads to asthma and other respiratory diseases among the elderly [51,52]. Therefore, the level of air pollution both outdoors and indoors must be considered and evaluated together, followed by the adoption of effective intervention measures.
The impacts of environmental noise and air pollution on the anxiety and mental health of the elderly are similar [51,53]. Environmental noise is regarded as a major threat to public hygiene, where the main sources of noise are outdoors and not indoors. Environmental noise is mainly concentrated in environmental noises such as road traffic, neighbors, and airplanes [54,55,56]. Intervention in the outdoors environment is required to allow the elderly to have a high quality housing environment.
Moreover, the overall aesthetics of the appearance of the indoor environment can also directly influence people’s subjective sense of happiness [37]. Home is the most important place in an individual’s life. It is even described as an “extension of the self through place” [35]. A pleasant, neat, and comfortable indoor environment is the primary factor contributing to visual health [37]; a pleasant indoor space includes the atmosphere created by elements that beautify the space, such as lighting, color [37], texture of materials [36], and decorations. To the elderly, it is a place of emotional release and attachment, privacy, and safety and has a direct effect on their psychological well being.
The holistic principles of hygiene and public health have contributed substantially to an increase in life expectancy of more than 30 years and in life quality since the beginning of the 20th century [57]. The most direct consequences of poor hygiene and cleanliness in a housing environment are the spreading of contagious and skin diseases. Some elderly people may neglect their own hygiene and cleanliness due to their own idleness and disabilities. Therefore, in addition to the government’s role of raising the awareness of personal cleanliness, a clean and hygienic living environment must also be created through intervening in and improving the housing environment [36].
2.3. Spatial Functionalities
The objective of the idea of “age-friendliness” initiated by WHO (2007) is to provide more venues and opportunities for elderly people to be able to participate in activities and increase their mobility in communities and neighborhoods [4,29]. Therefore, communities and neighborhoods can provide opportunities for socializing and venues for the elderly to meet and interact with others [58,59], and a good housing environment can also serve as a venue for activities and socialization. Case studies have shown that improving the housing space of the elderly can increase and promote the accessibility and availability of the housing [19]. For instance, an improved living space can serve the functions of receiving visitors, leisure, and entertainment. Rioux discovers, in a study on the well being of elderly people living in families in communities, that those who live in the communities for a long are most satisfied with receiving visits from other people [18].
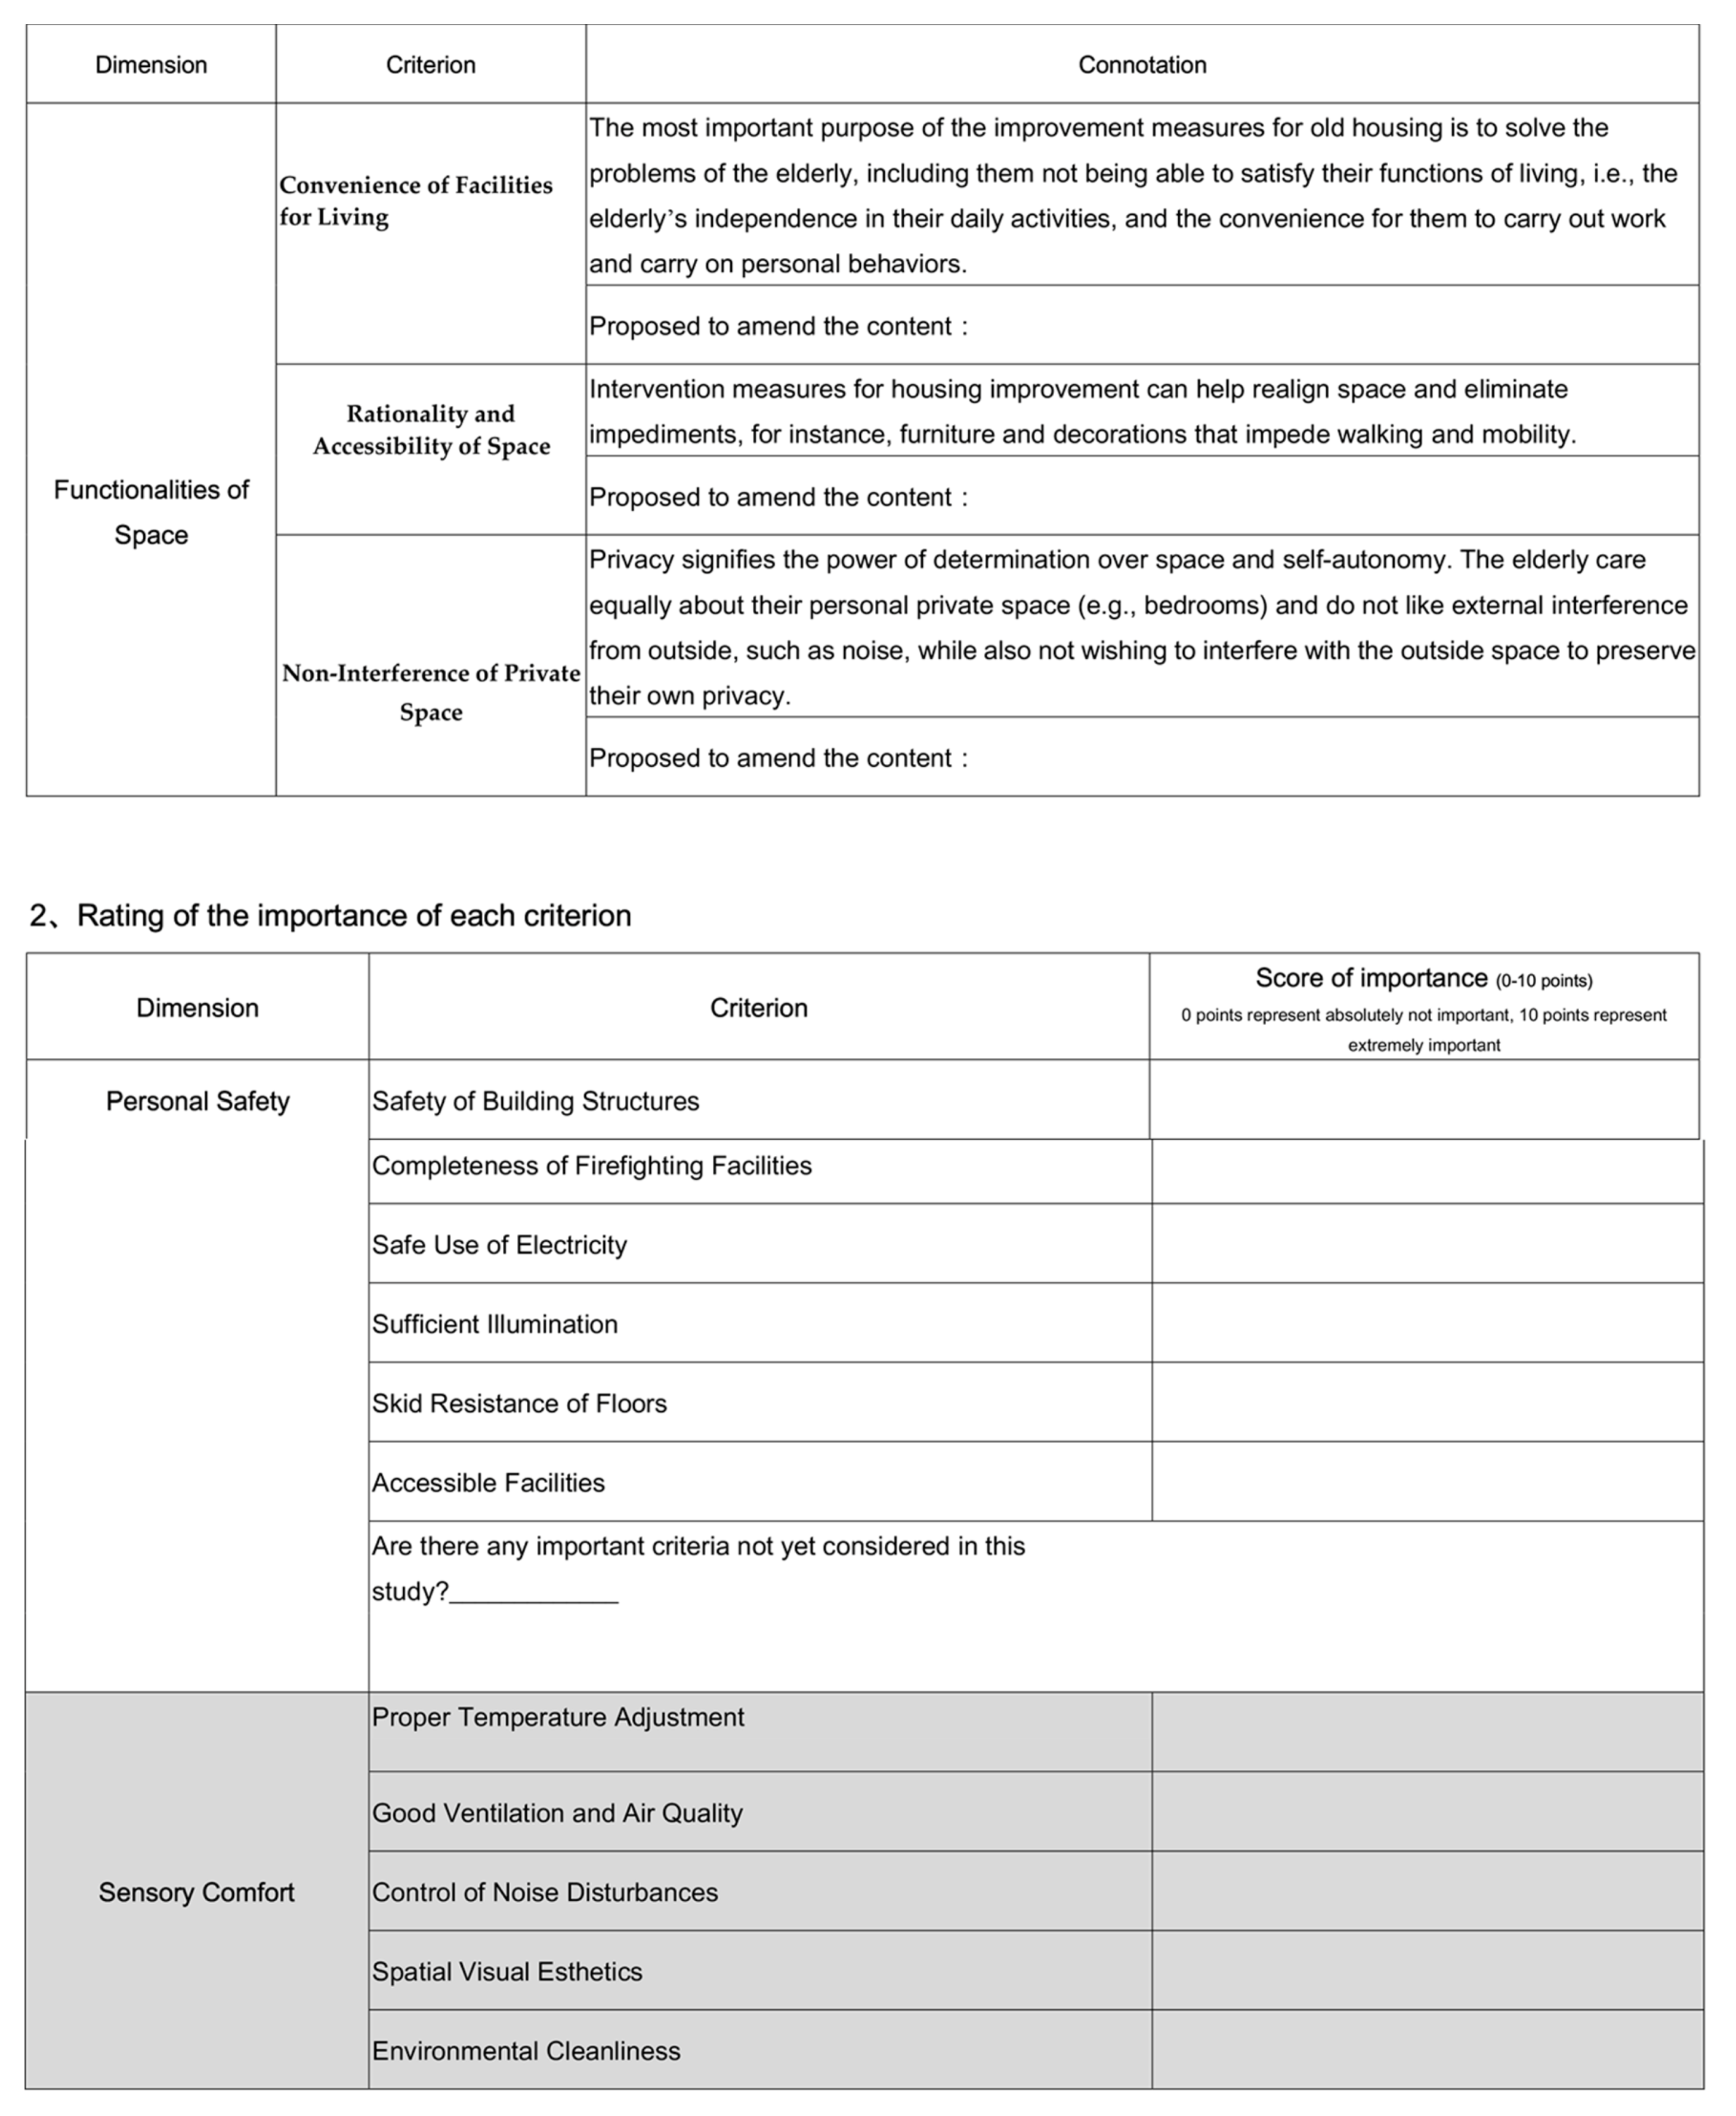
The elderly usually view personal independence as synonymous to their ability to manage their daily lives and preserve their environment; this also has to do with the ability to control their living environment [12]. As they age, their independence in living and their ability to control their environment are gradually affected. The impact caused by a decrease in this ability is reflected in certain basic functions and demands of life, which not only lead to a deterioration of the quality of life but also the inability to feel satisfaction and happiness in life. Therefore, through the measures for improving the existing housing of the elderly, the most important issue is to resolve the problem of the elderly not being able to satisfy their functions of life. For instance, insufficient maneuvering space in the kitchen [50] leads to inconvenience in cooking [42], and the unsuitability of bathroom facilities, e.g., a walk-in shower replacing the bathtub [4,60], inconveniences washing oneself [10,50]. In other words, the elderly must be made independent in their daily activities in life, and the convenience to be able to carry out certain work and carry on with personal habits must be satisfied. The goal is that the elderly will still be able to have personal control and convenience over their basic needs in life through the improvement of their housing, despite the deterioration of their abilities, so as to maintain their well-being and sense of independence in daily life [19].
To enable the elderly to move freely in various areas of their housing and to have better mobility and accessibility to destination points [11,61], intervening to improve housing can help realign rational spaces and eliminate impediments in space, for instance, furniture and decorations that are impeding walking and mobility, thus enabling the elderly to enjoy convenience and unimpeded functions in terms of accessibility to various areas in the house.
In much of the research literature, home is described as a place where one feels safe, protected, and warm and where one has self-autonomy and is able to shut off interference from the outside world and not incur any criticisms on their behavior [10]. Therefore, home signifies the privacy that one holds in relation to the people and the world outside. In addition, privacy means having the power of determination in a space and self-autonomy [16]. When the elements of privacy and self-autonomy are extended into the family, where there are other members of the family living alongside the elderly, the latter would similarly require personal space (e.g., bedrooms) and would not like disturbances from the outside space, such as noises, but at the same time would not want to interact with the outside space. Therefore, the improvement of the housing environment can eradicate circumstances in which indoor and outdoor factors interfere with one another. Finally, pretest assessment indicators were put together based on the discourses from the literature.
2.4. Pretest of Indicators
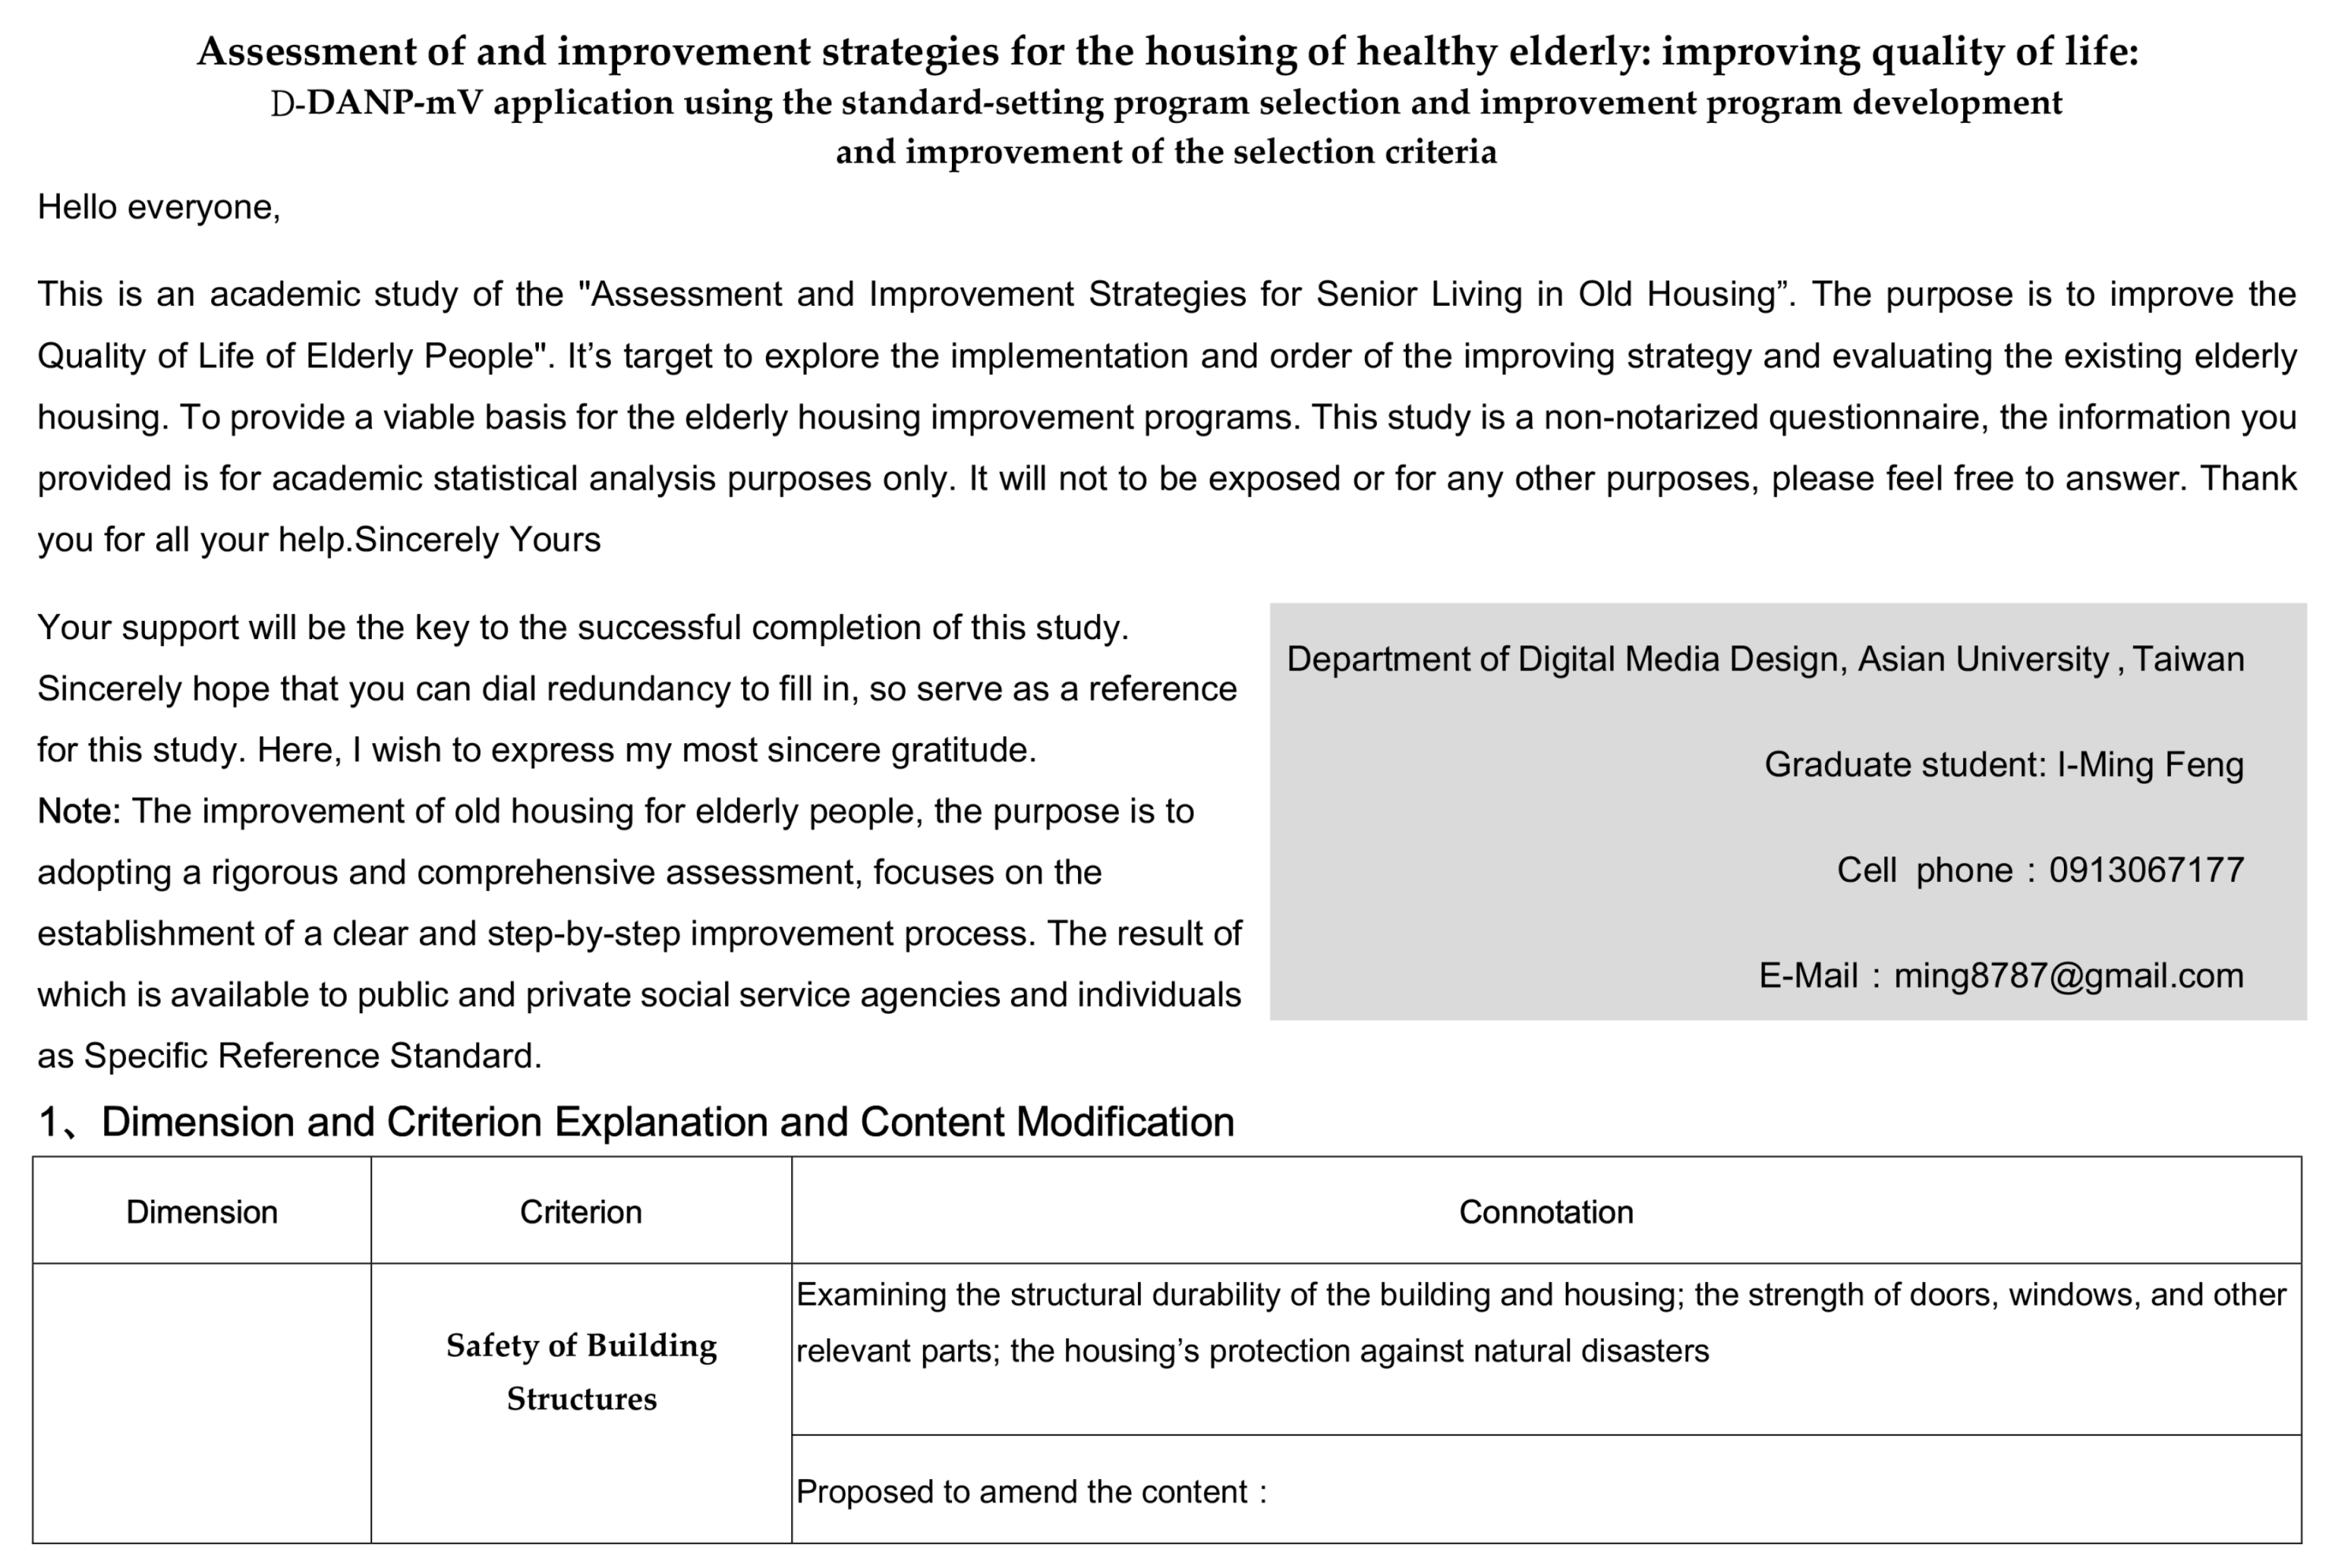
The pretest assessment indicators were carried out through a semi-structured questionnaire divided into two parts. The first part was the indication of the importance of each criterion through the use of a 0–10 scale, using a 10-point Likert scale to indicate the importance of each criterion, with 0 indicating “extremely unimportant” and 10 indicating “extremely important”. Expert opinion was utilized to assess each criterion, and the importance of each criterion was observed based on the average scores. Therefore, the research adopted 7.5 as the threshold for assessing each criterion, where any standard value above 7.5 was deemed important, and those under 5 were deemed unimportant and removable, while standard values between 5 and 7.5 would require a second round of investigation and interviews with the experts to confirm and modify the reasons behind the importance of the criteria. This process was repeated as needed, until all the outcomes for the criteria were completely confirmed. The second part was conducted as an open interview, where the criteria and content of the questionnaire were modified based on the experts’ knowledge and experience and clarified according to the suggestions made for each criterion to ensure the effectiveness of the research framework and confirm the final assessment criteria for the questionnaire.
This strategic study uses assessment to improve the quality of life of the elderly by sorting out the various assessment criteria through the aggregate commentaries in the literature and distributing questionnaires to 12 professional architects and interior designers; of the distributed questionnaires, two were excluded, and the other 10 returned questionnaires were considered. The first part of the study shows that all the criteria are rated 7 and above, which means their importance is confirmed beyond doubt. However, with respect to the descriptions of the three criteria of necessity of firefighting facilities, safety of home appliances and electrical circuits, and quality and functionalities of the socializing environment, the interviewed experts voiced their doubts. First, regarding necessity of firefighting facilities [48], while the facilities are certainly necessary for safety in the living space, the completeness of firefighting facilities should be assessable. Safety of home appliances and electrical circuits was judged to not be a sufficiently accurate description. Electricity-caused fire [47] is one of the main factors contributing to fire accidents in housing, but the problems are not necessarily related to the damage of appliances and electrical circuits. In safety issues concerning the protection of housing, the knowledge regarding safe use of electricity is often emphasized. Therefore, the description of the safe use of electricity would make assessments more accurate. Finally, the description quality and functionalities of the socializing environment was judged to be vague and inaccurate. Many studies have pointed out that participation in social activities has an impact on the health of the elderly [58,59]. The emphasis has been on the space and premises, and when it comes to quality and functionalities, no definite standard has been provided for evaluating the socializing space of housing. The emphasis should be placed on the availability of socializing space in housing.
After revising the descriptions of the three criteria, questionnaires were again circulated online to the experts to ascertain the importance of the criteria. The importance of the criteria in the returned questionnaires was rated 7.5 and above, and there were no doubts regarding the description and content of the criteria. Therefore, the research framework was unanimously confirmed as effective, thus concluding this stage of the research. The names and descriptions of the amended framework and criteria are presented in Figure 1 and Table 1 below.
This section is divided by subheadings. It should provide a concise and precise description of the experimental results, their interpretation and the experimental conclusions that can be drawn.
3. Evaluation Methods
The D-DANP-mM model in multiple-attribute decision-making was first proposed by Taiwanese scholar Tzeng Gwo-Hshiung [62], who developed this model to refine traditional assessment methods that relied on inter-criteria independence. The D-DANP-mV model consists of three analytical techniques: The decision-making trial and evaluation laboratory (DEMATEL), the DEMATEL-based analytic network process (DANP), and the modified VIKOR. In recent years, the advantages of this decision-making model have attracted increasing attention from scholars in related fields. Zhu et al. (2017) [63] summarized these advantages, categorizing them into four points: DEMATEL can clarify the interrelations among criteria, thereby lifting the restriction imposed by the assumption in conventional analytical techniques that the assessment criteria are independent of one another; prioritization and selection of criteria can be carried out despite any conflicts among the attributes; using the ideal standard as the benchmark instead of relative standards can avoid selecting the best option out of a bad batch; this model can propose improvement strategies systemically at the source of the impacts.
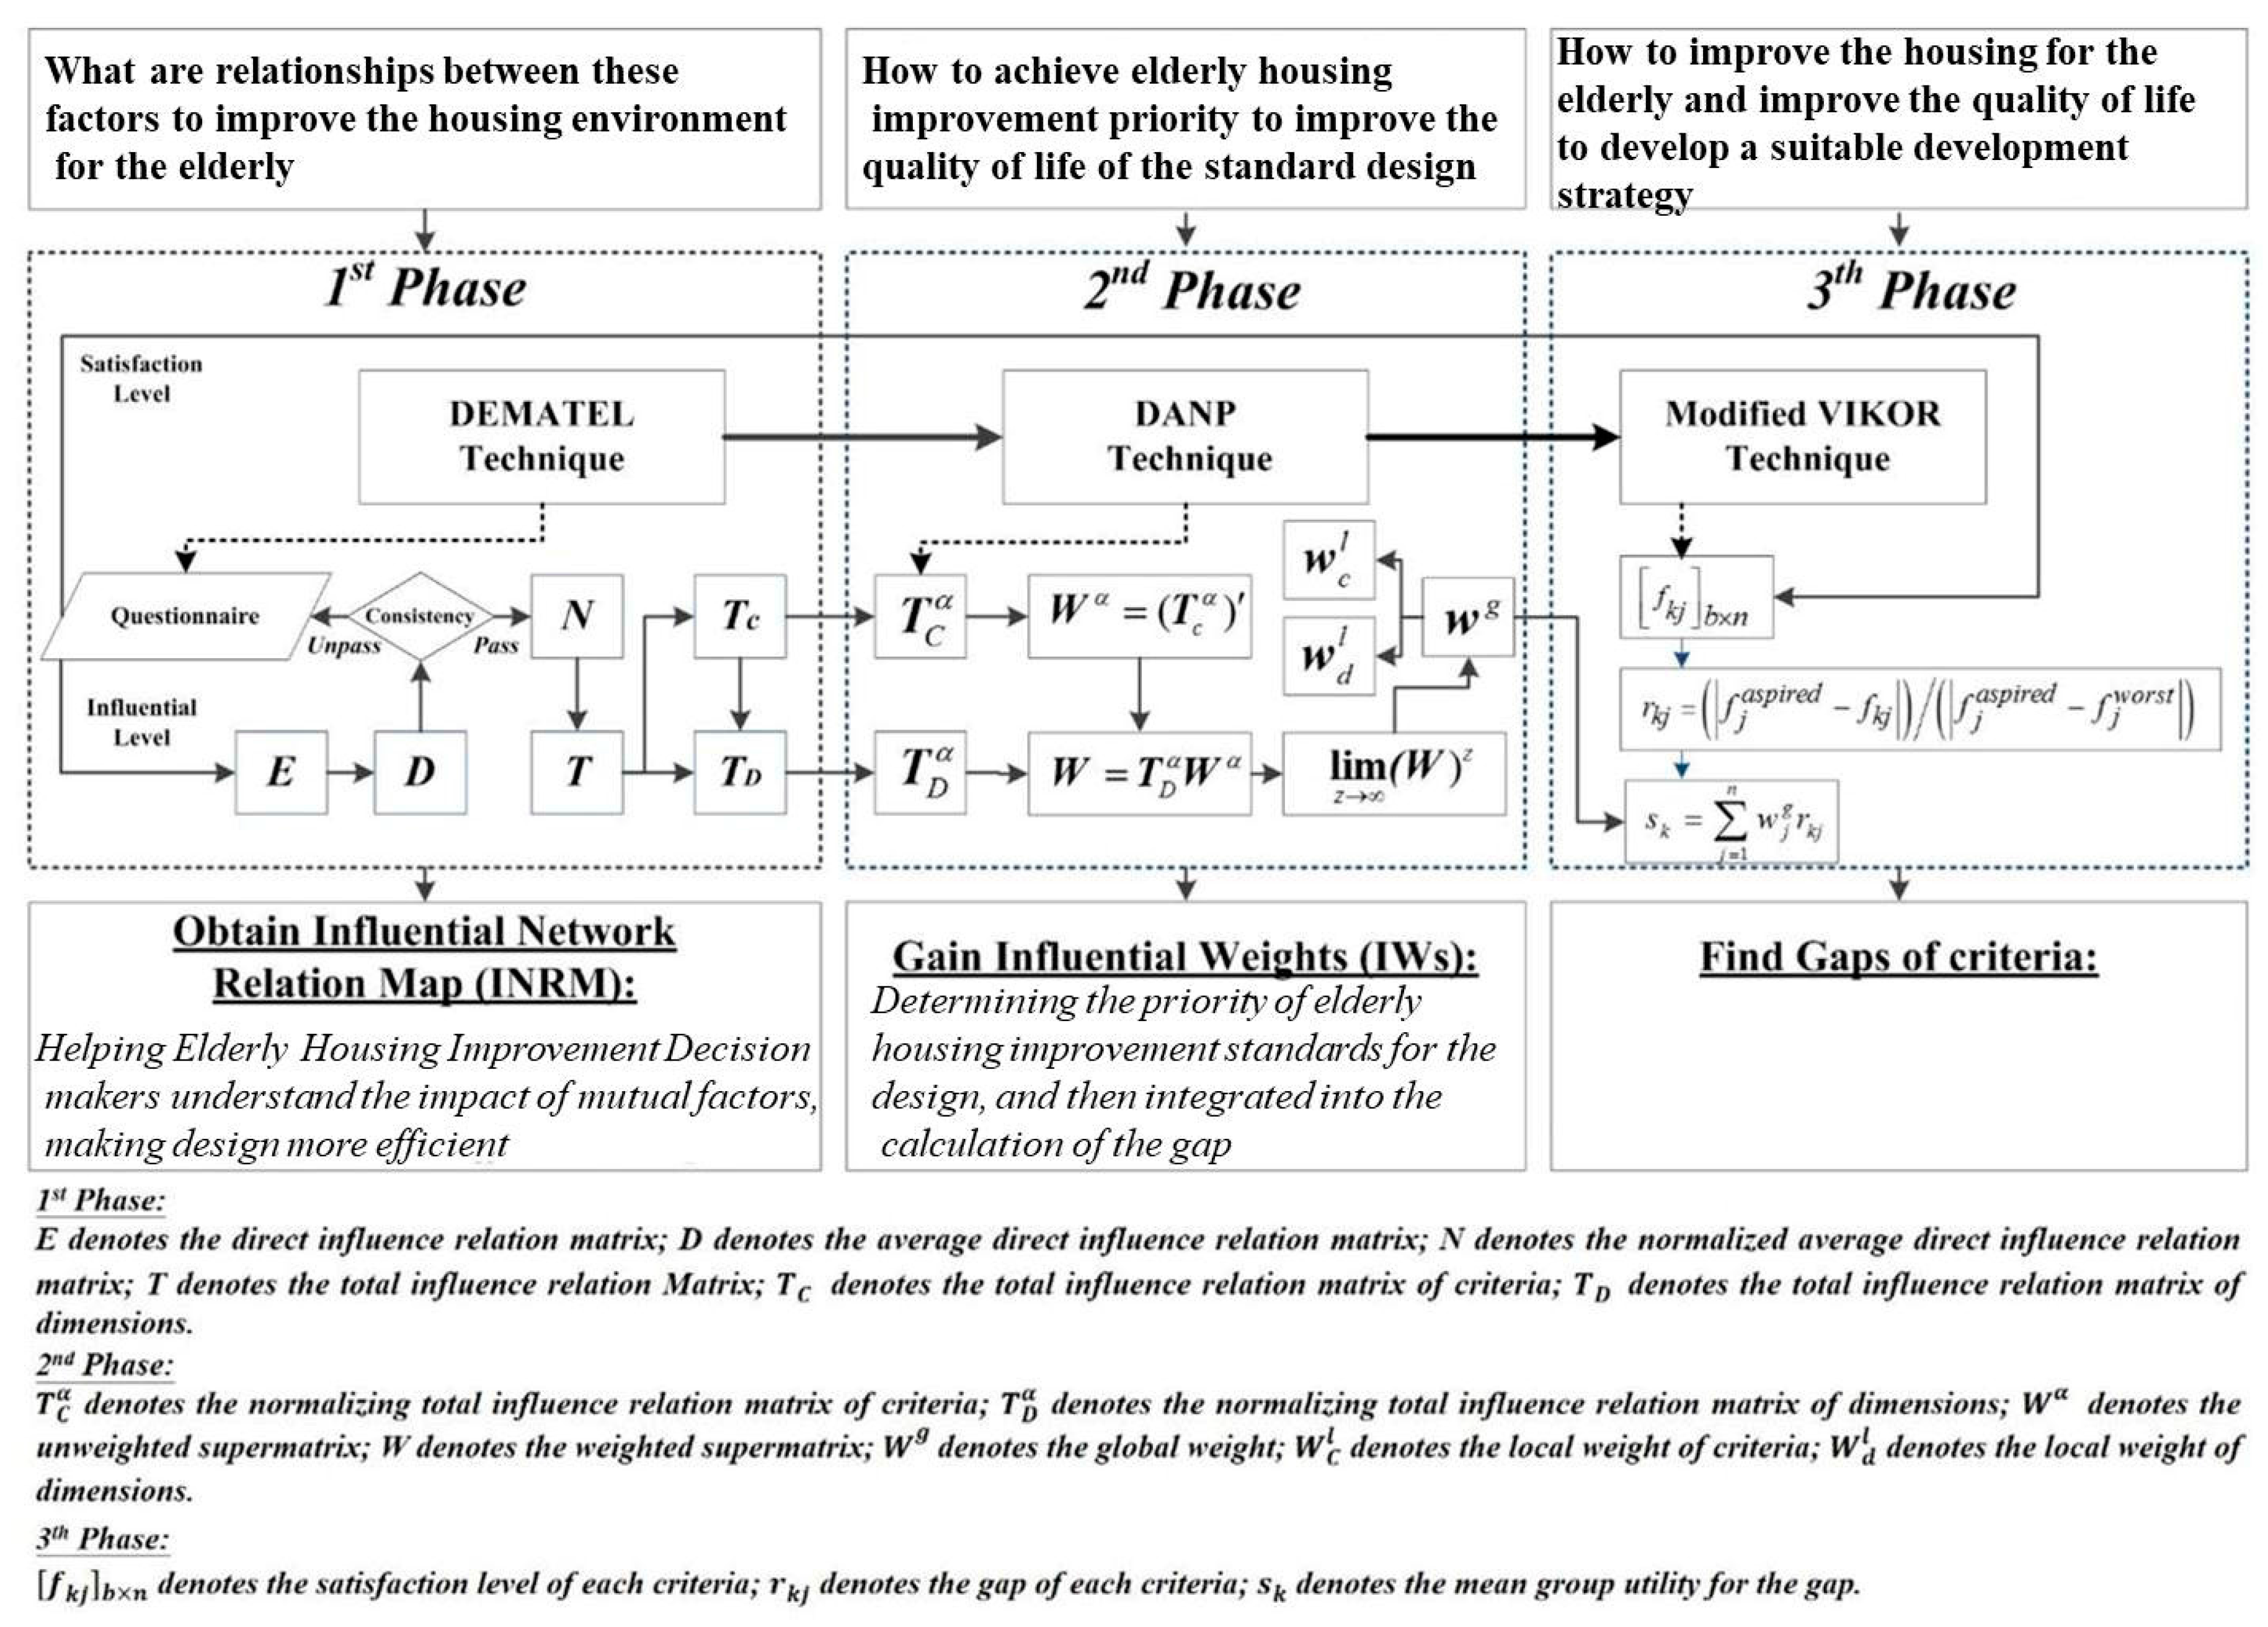
Based on the three analytical techniques included in the D-DANP-mV model, this study divides the detailed operational procedure of the decision-making model into three phases and demonstrates the calculations involved in each phase with the aid of Figure 2, Figure 3, Figure 4 and Figure 5:
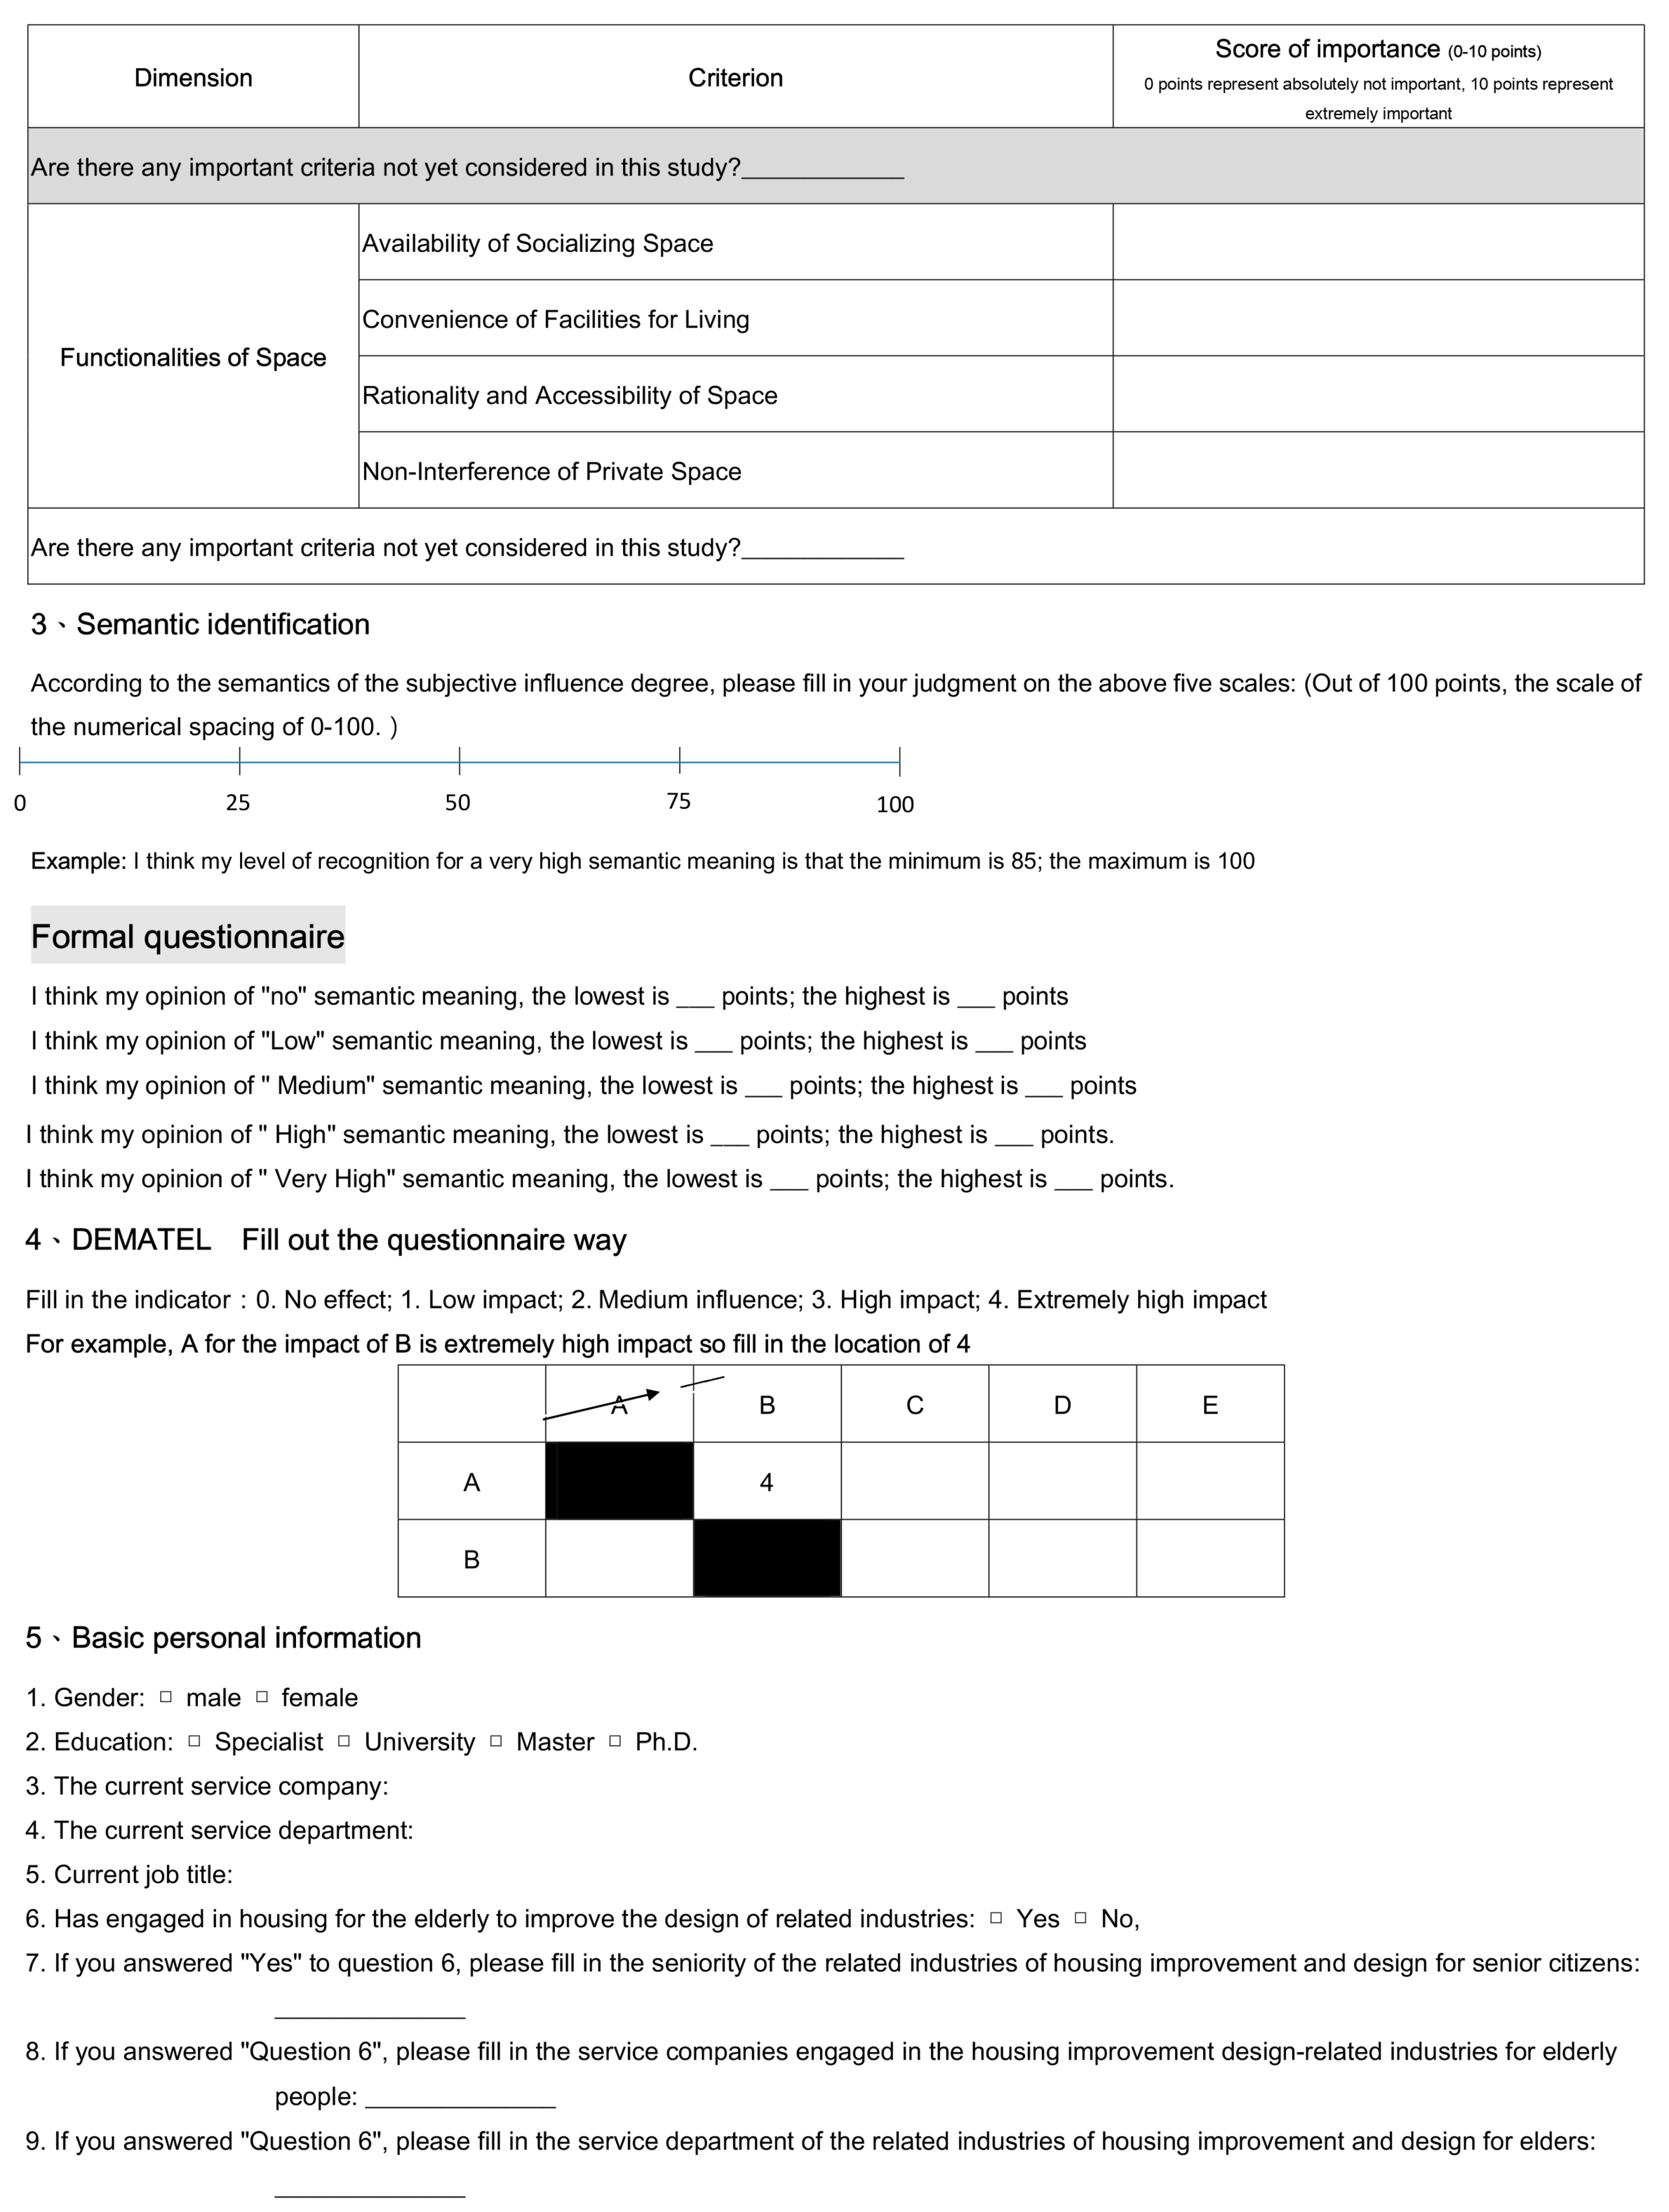
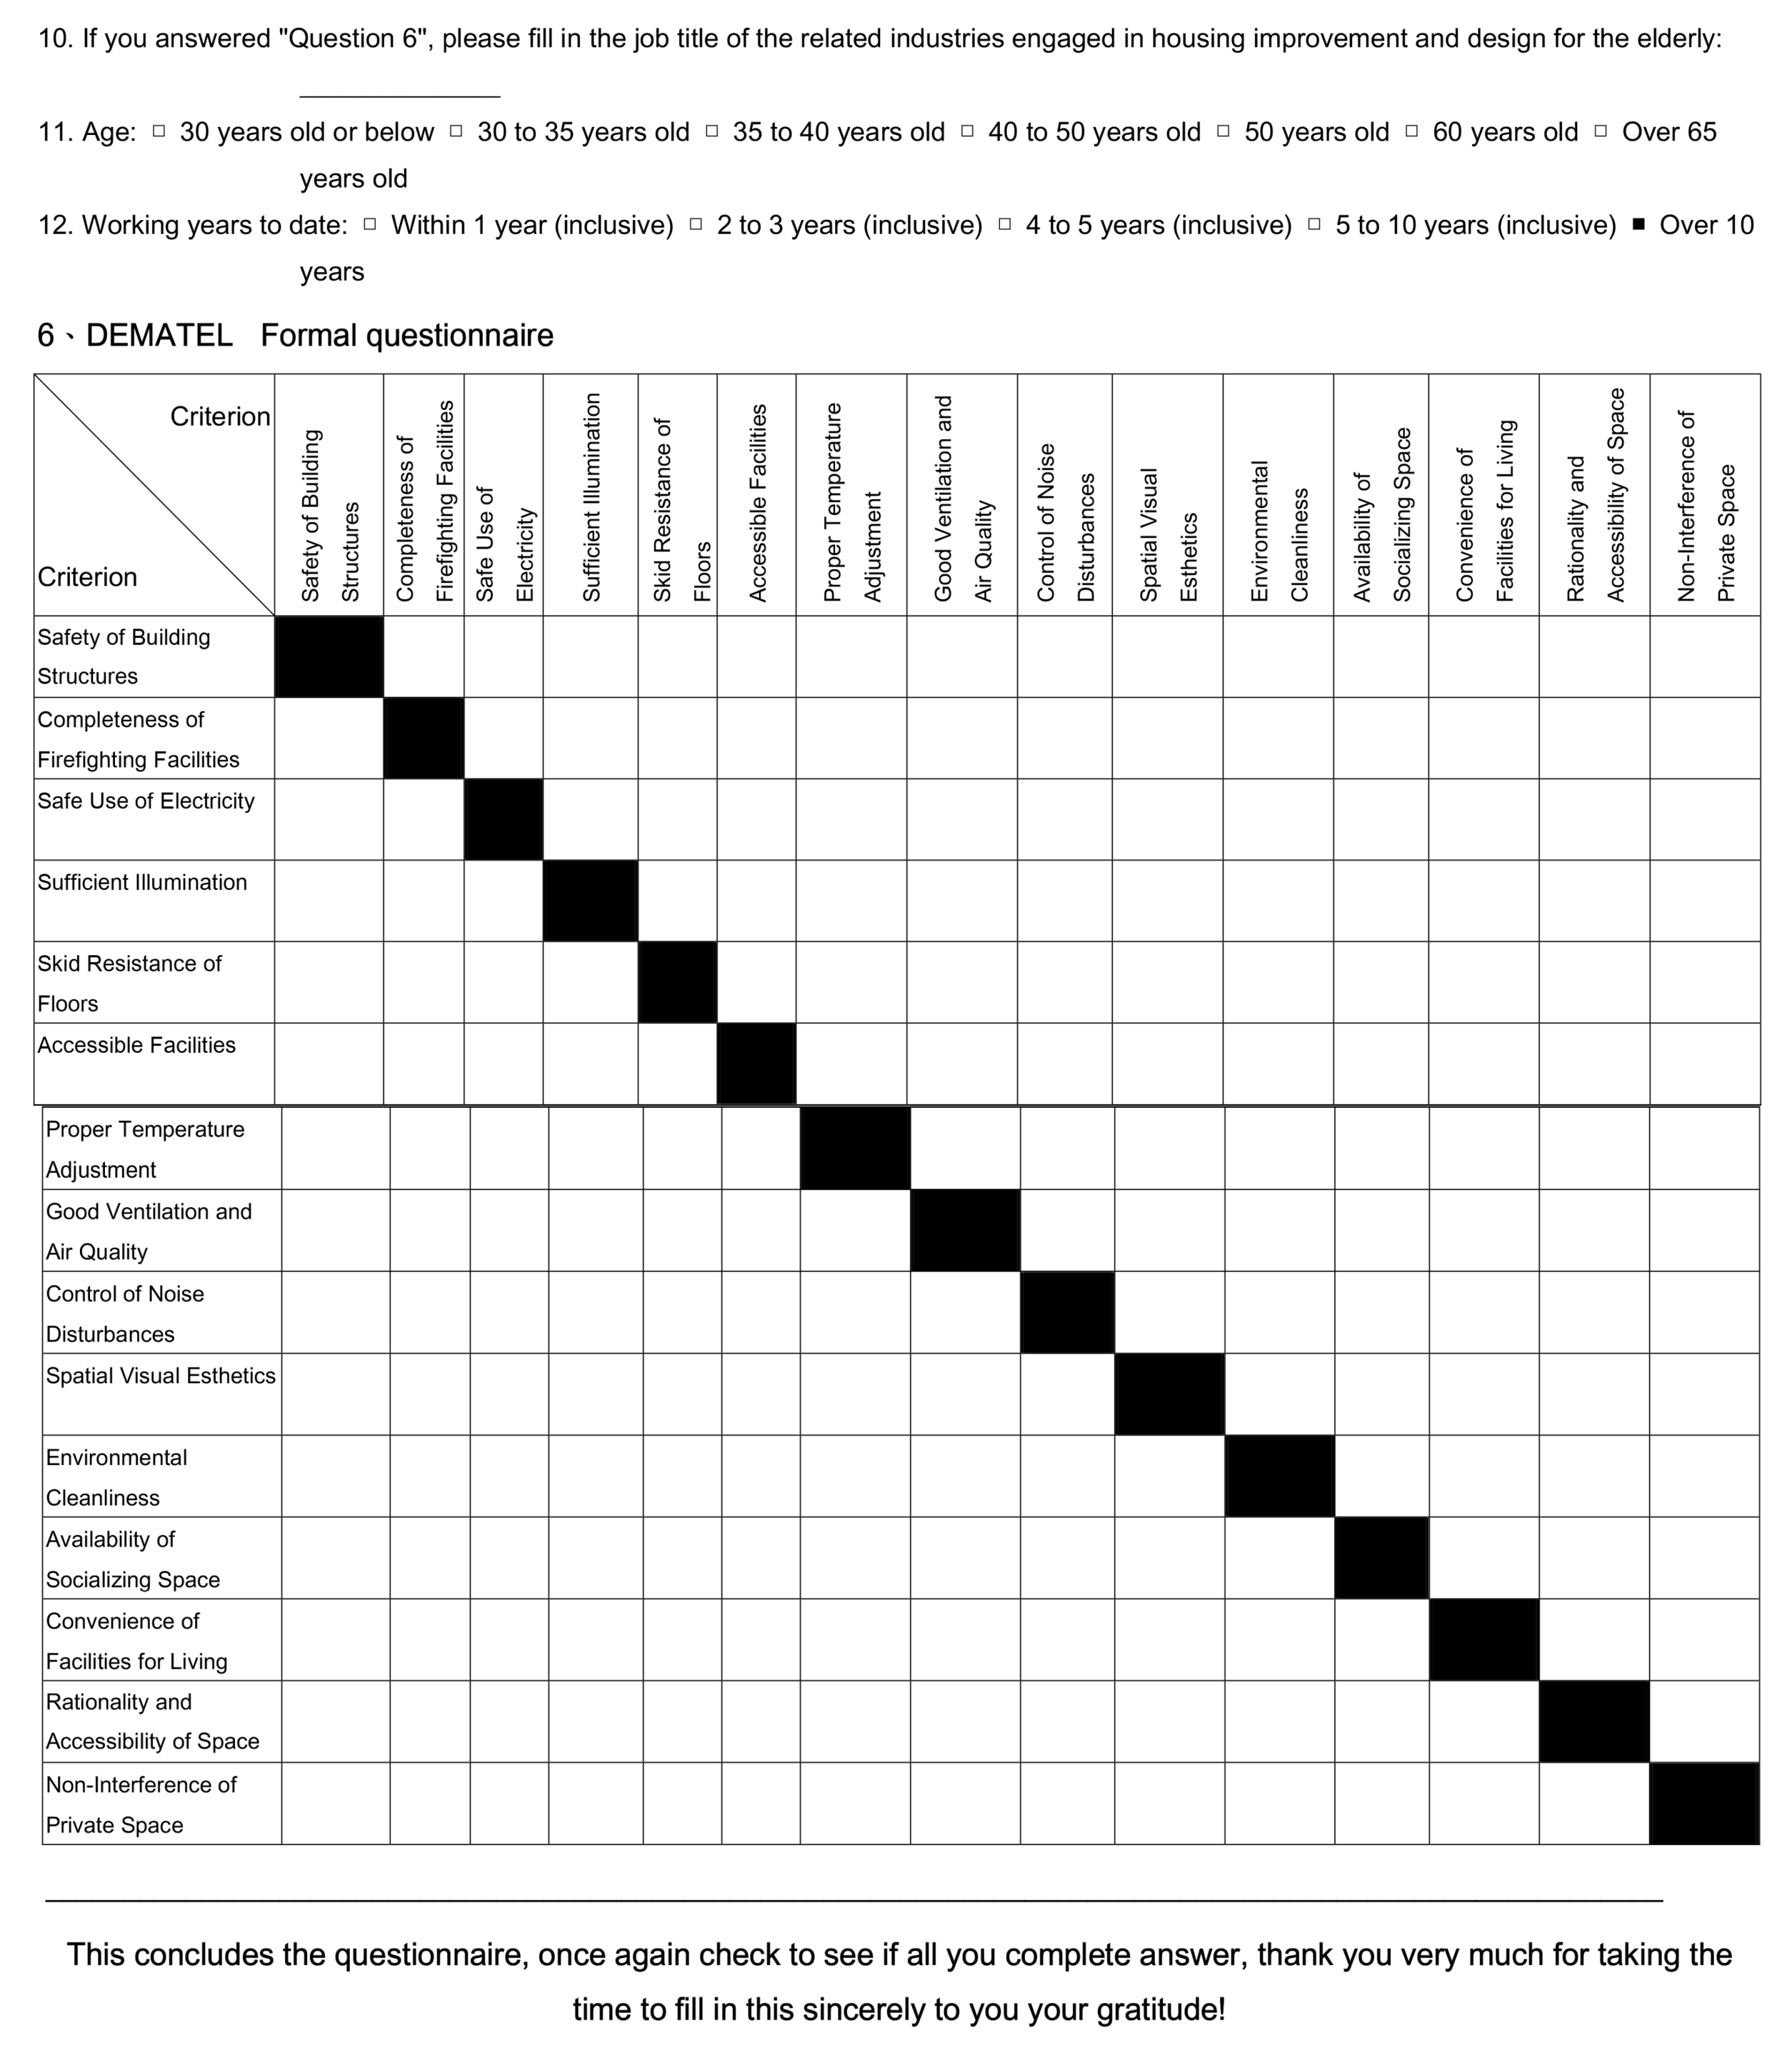
(1) Construction of Influential Network Relation Map (INRM) Using DEMATEL
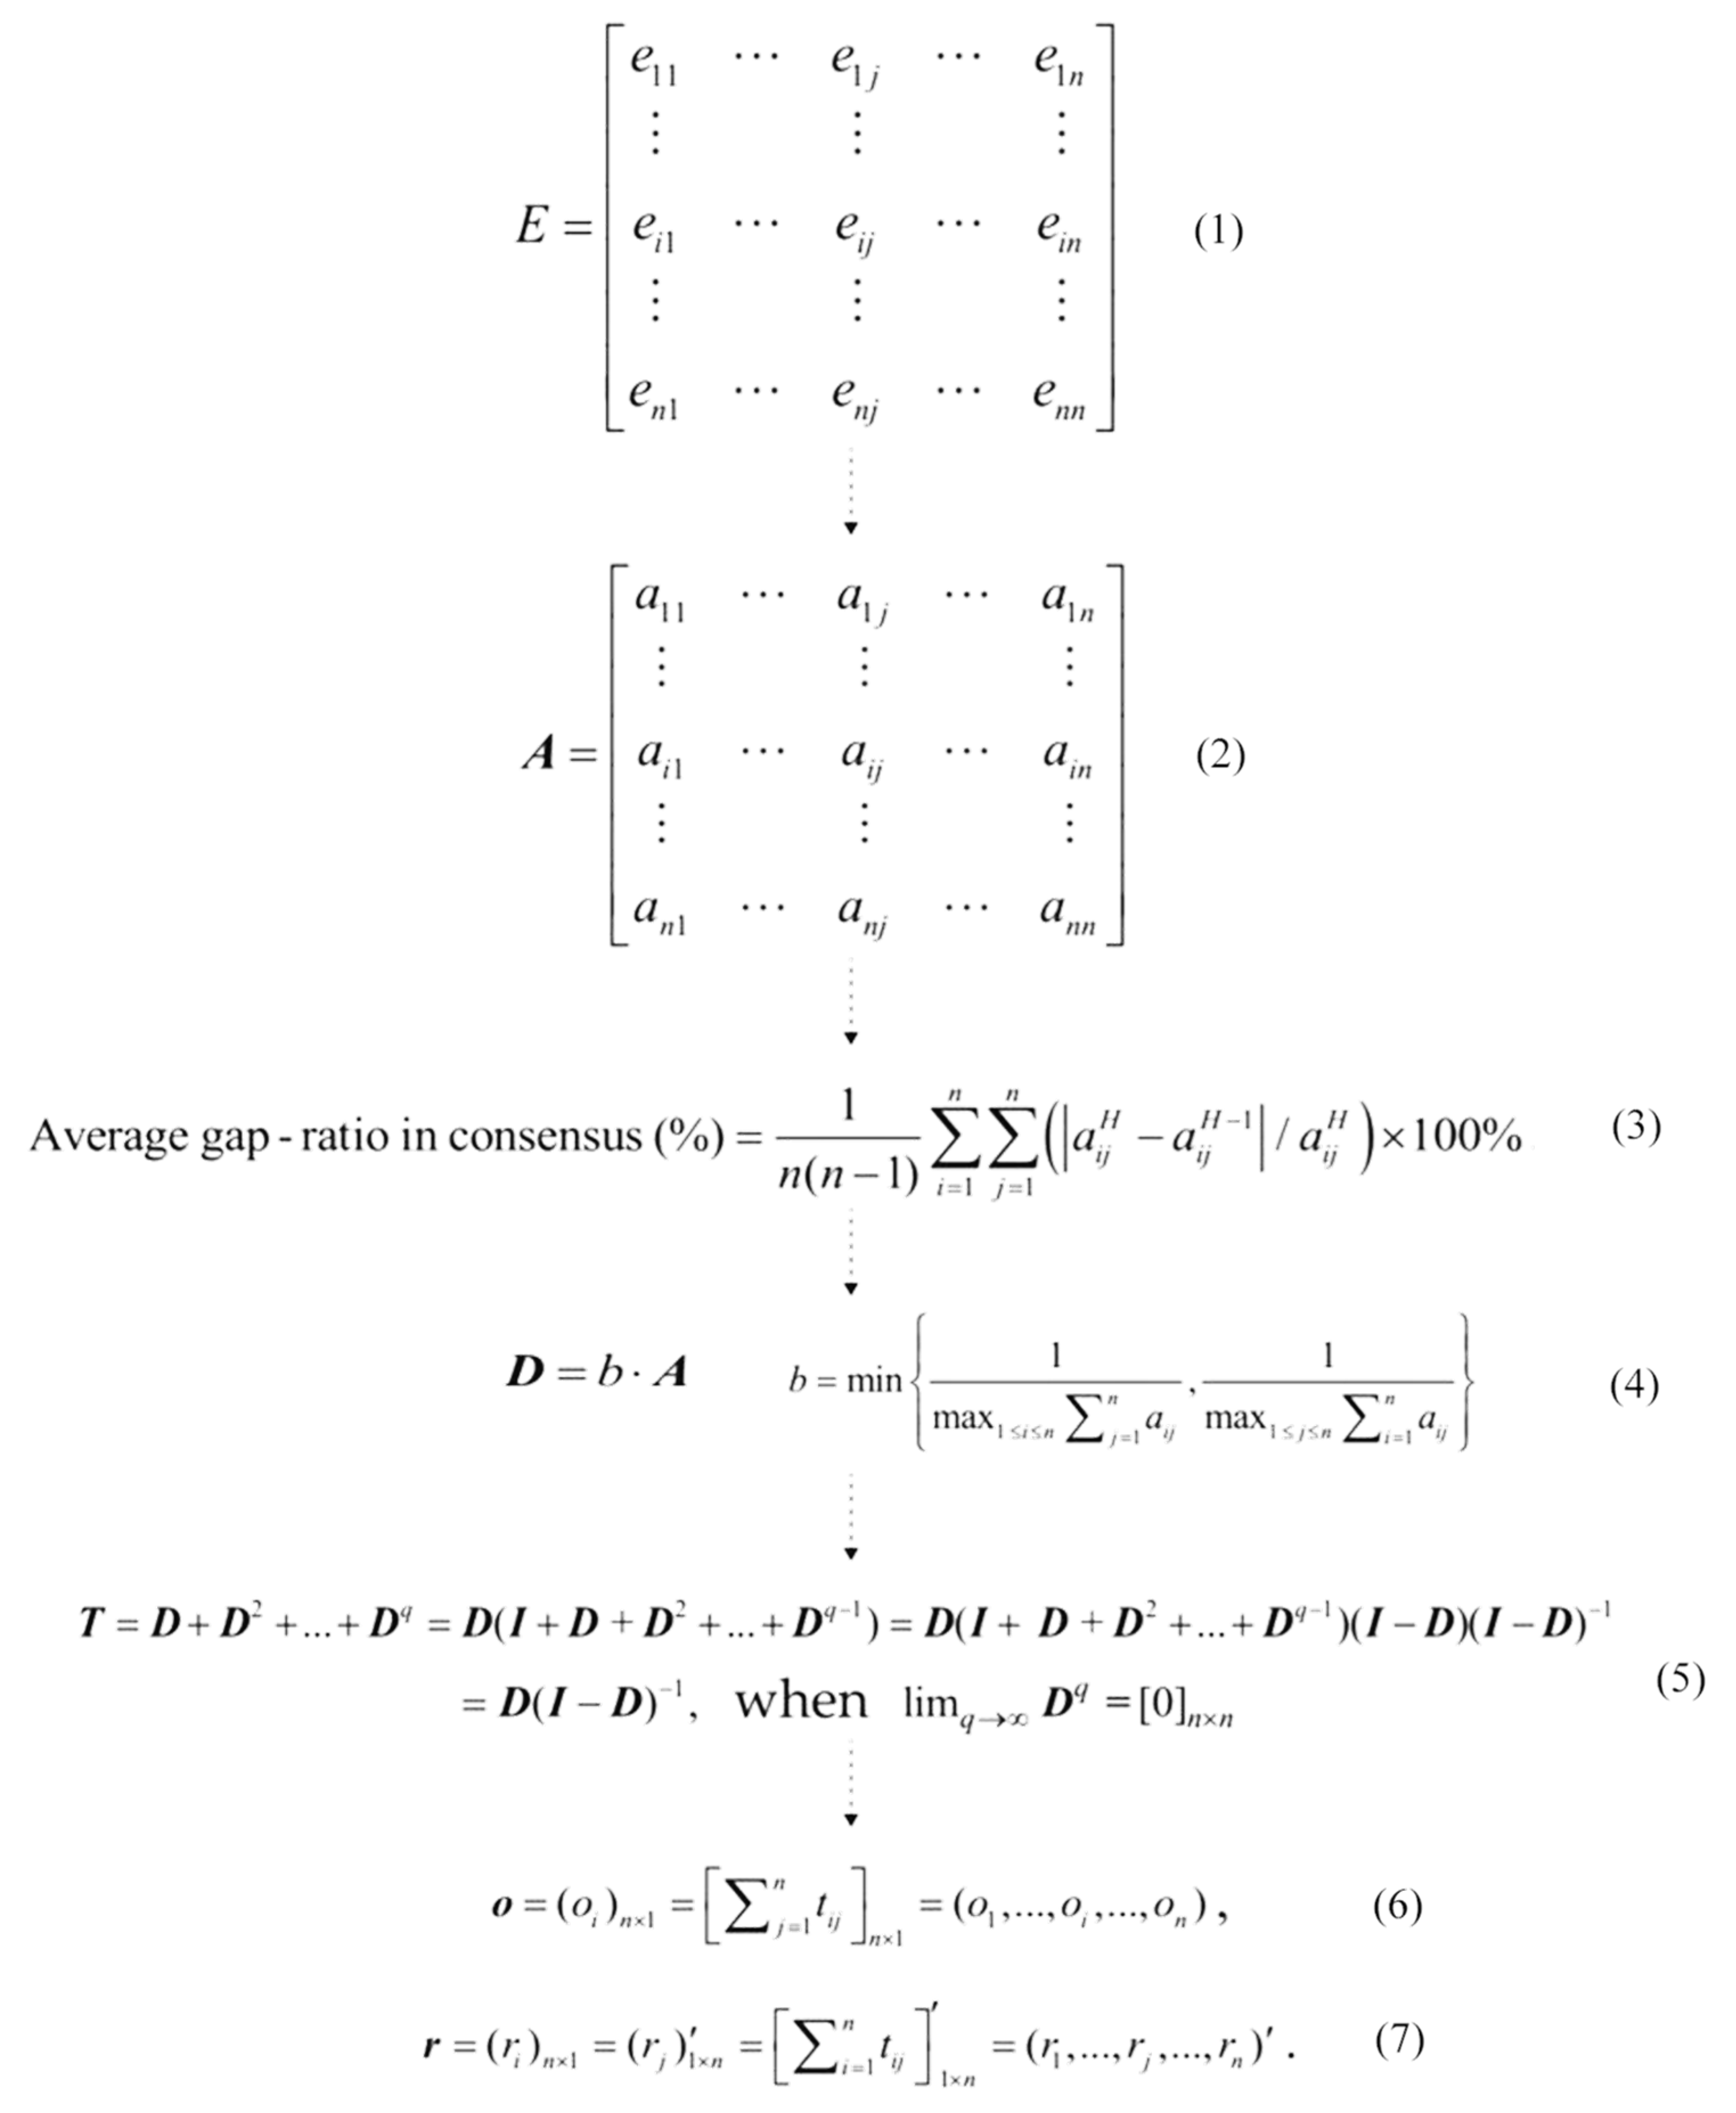
First, a direct influence matrix E was constructed based on the questionnaire results collected from the experts. The assessment scores in the questionnaire included 0, 1, 2, 3, and 4, among which, 0 indicated “no influence,” and 4 indicated “highly influential”. The mean values of the direct influence matrix were then computed to construct the average direct influence matrix A. Afterward, before the next analytical step, it was necessary to conduct consensus tests on the collected questionnaires. As the statistical average threshold for gap values was 5%, computational results that were lower than 5% meant that the collected questionnaires had a reliability level of over 95%. Then, the system could be deemed as stable and reliable, and the questionnaires were said to display a high level of consensus. However, if the test results showed that the system was unstable, review of the accuracy of the collected data and the adequacy of the number of participating experts would be required. After passing the consensus tests, the average influence matrix A was normalized to create matrix D. The purpose of normalization was not only to remove the units and orientations of values; more importantly, it was to convert the values to be between 0 and 1. On top of this, Equation (5) as shown in Figure 3 was used to construct the total influence matrix T, the foundation for drawing the influential network relation map (INRM) in this study. Equations (6) and (7) in Figure 3 were then employed to add up the values in each column and row of the matrix, respectively. The degree of centrality (o + r) and degree of influence (o − r) of each assessment criterion were subsequently obtained.
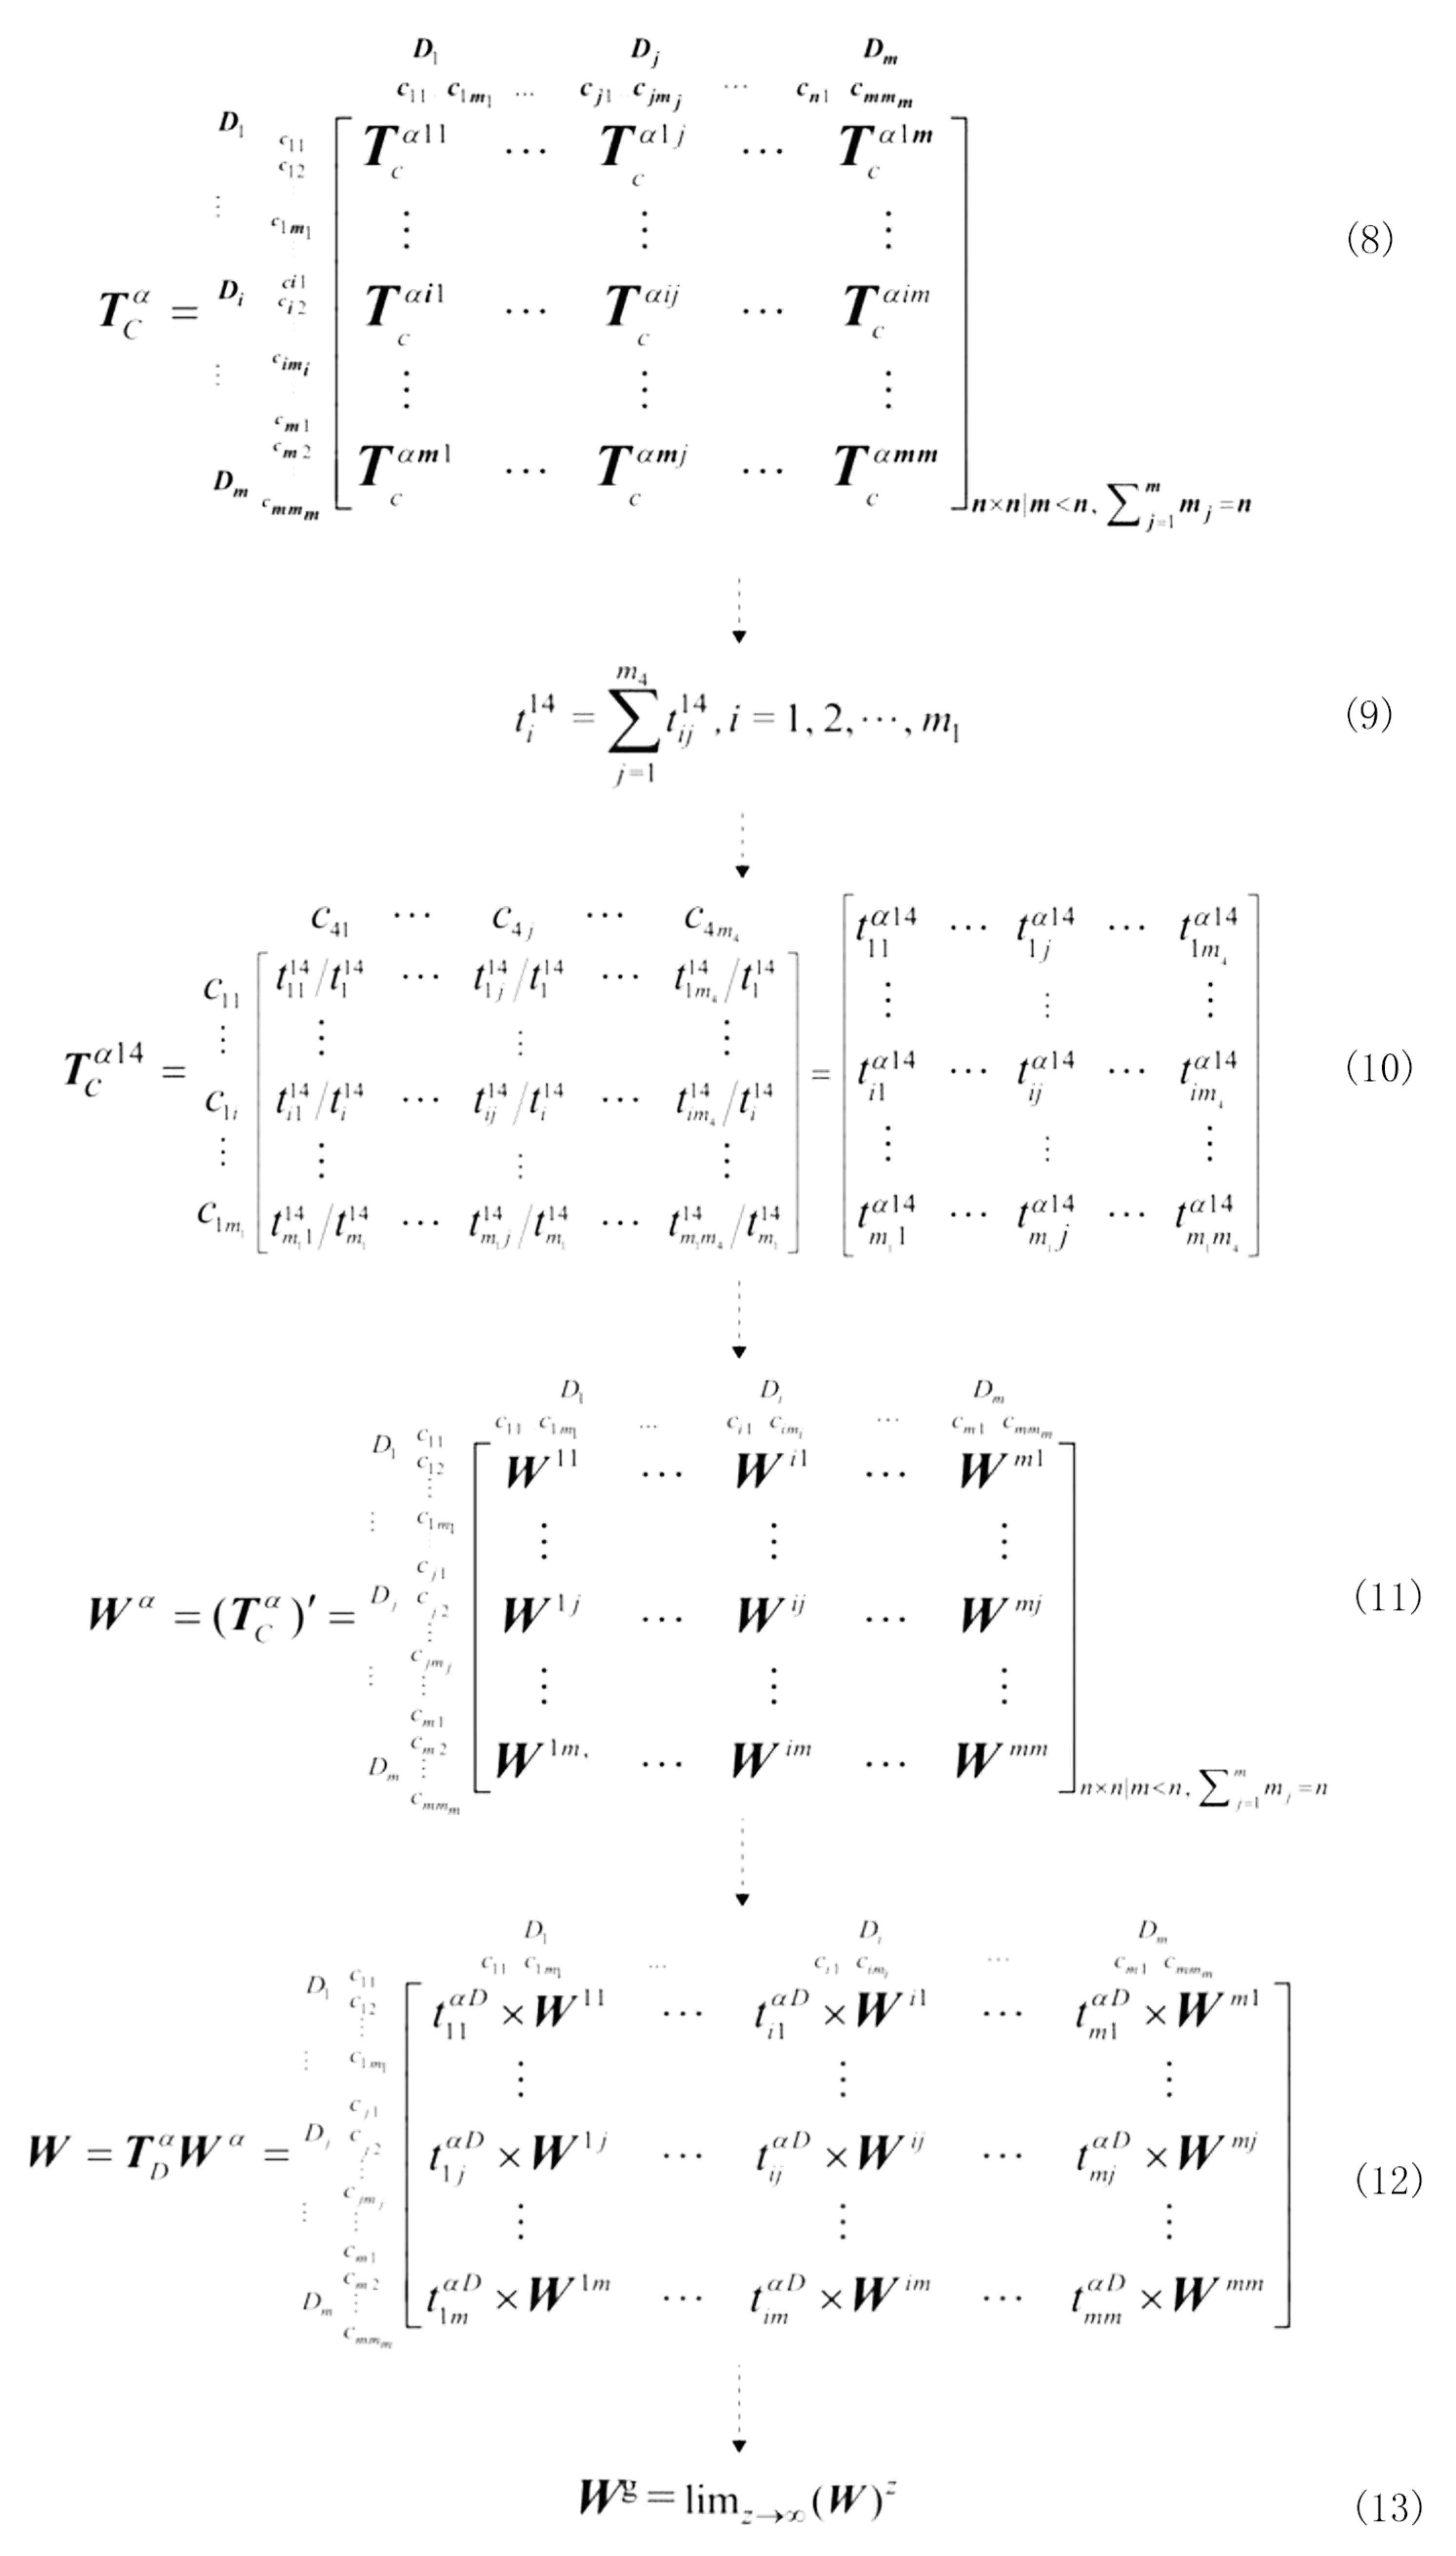
(2) Distribution of Influential Weights (IWs) Using DANP
In the D-DANP-mV model, this analytical stage aims at allocating influential weights (IWs) to all the criteria in the assessment framework. First, the total influence matrix was vertically partitioned according to different dimensions. The criteria under each dimension were then added up horizontally. Afterward, each criterion in the partitioned matrix was divided by the horizontal sum of the dimension to which it belonged, so as to obtain the normalized matrix in Figure 4 With reference to the pairwise comparisons of criteria in the AHP process, the normalized influence matrix was converted into an unweighted supermatrix, . The same method was used to normalize and convert the total influence matrix of the dimensions into matrix . Multiplying matrix by matrix resulted in a weighted supermatrix, (as shown in Figure 4). Eventually, the limit supermatrix was computed by multiplying the weighted supermatrix by itself to achieve a convergent and stable matrix, . After composing the limit supermatrix, the values in each column of the weighted supermatrix stood for the global weights of the corresponding criteria, also called the influential weights (IWs).
(3) Performance Assessment of the Empirical Case Using Modified VIKOR
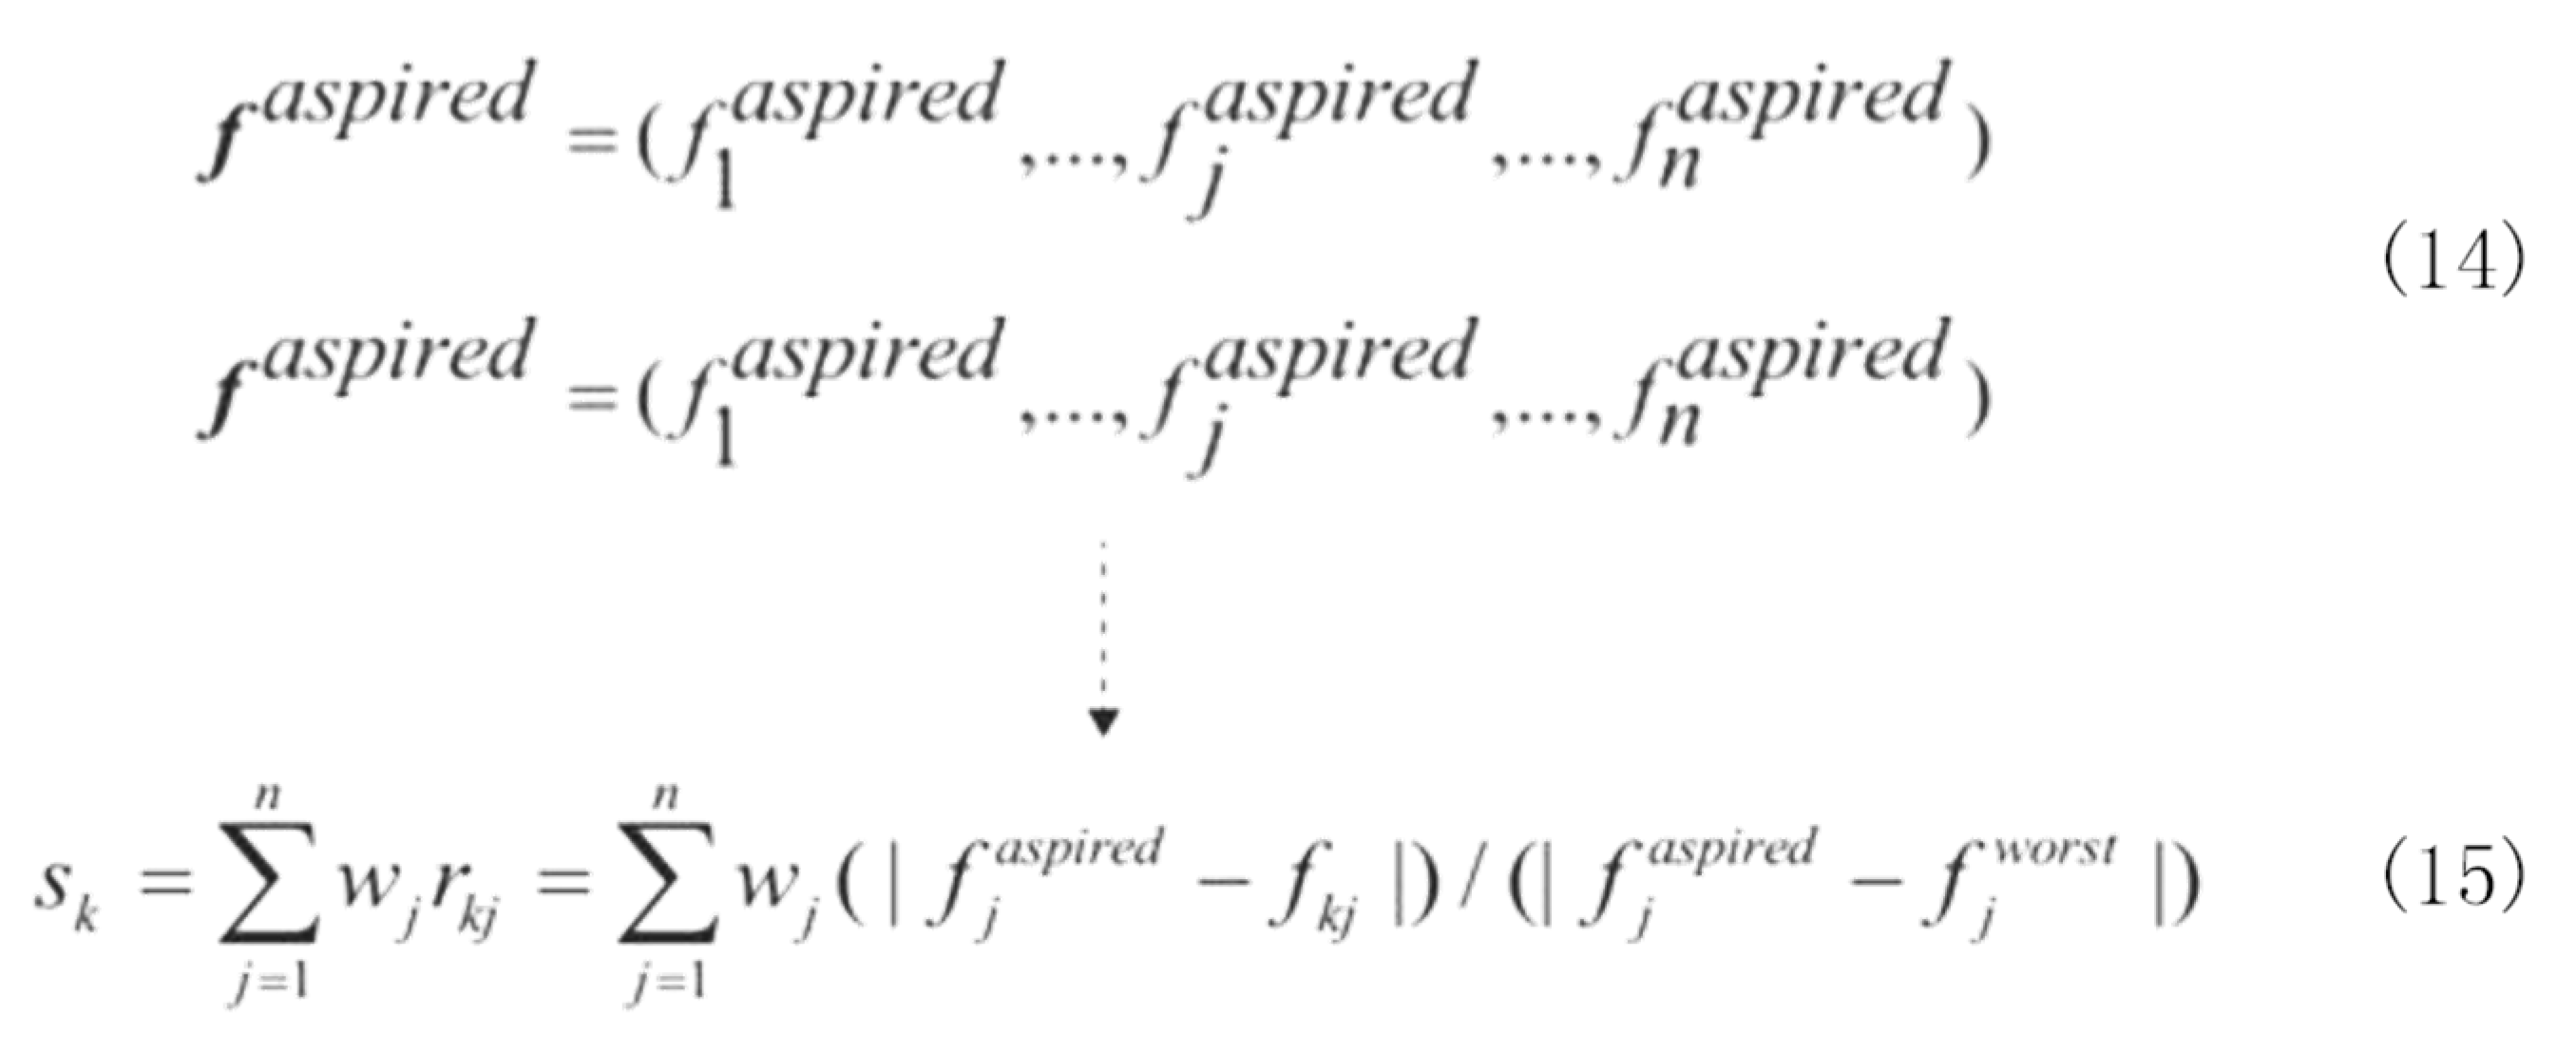
The modified VIKOR technique used in this study aims at the clear evaluation of the positive-ideal solution and negative-ideal solution of each assessment criterion in the specific empirical case. It prioritizes the criteria based on the distances of the outcomes of performance assessment from the positive-ideal solution of the case. Opricovic and Tzeng (2002) proposed a method to rectify the conventional VIKOR technique, introducing the concept of “ideal standards” to substitute the positive-ideal solution; this can avoid the predicaments of having to choose the best option out of a bad batch or having no desirable option or zero room for improvement. After this amendment, the analytical technique becomes more suitable for solving the inadequacies of performance assessment in real life. Equation (14) in Figure 5 was adopted to compute the total gap value and total performance value of the empirical case to provide essential support for further development of improvement strategies.
4. Empirical Case
This section describes the geographical environment and analysis of current situations in relation to an empirical case and explains in detail the process of collection and analysis of the relevant data. Based on the results of the performance assessment under INRM and VIKOR, the priority items for improvement in relation to the empirical case are elaborated. In addition, the basis as well as the reasons behind the prioritization of the confirmed improvement items are analyzed.
4.1. Geographical Description of Empirical Case
The empirical case of this study focuses on the Wuchang United Building Community of Xinjuli in the Songshan District of Taipei City, it is a multifamily apartment style buildings. The Wuchang United Building Community was established in 1973. The building consists of 11 linked 6-storey residential blocks, with elevators and a total of 264 households. The number of residents meeting the elderly criteria is approximately 150 (including those with physical and mental disabilities). Although the building has reached its 50-year use limit (the economic period of durability for buildings), the structure of the building remains sound. The floor area of the housing ranges from 100 m2 to 133 m2. As the entrance and exit of the building are fairly narrow, it is rather challenging to install disability ramps in view of the aging population. For the elderly and those with mobility difficulties requiring mobility aids to enter and exit the housing, the steps at the entrance and exit still present a major concern, despite the convenience of the elevators. In terms of firefighting facilities, there are fire extinguishers, public announcement systems for emergencies, emergency illumination installed on every floor, and stairs and emergency ladders at each of the elevators, but no evacuation instructions have been put in place. Due to the old age of the building, improvements and repairs to many of the housing units ceased after 30 years; hence, there are hidden concerns with regard to the safe use of electricity. Some adjacent buildings are only separated by an 8-m alley (the main alley is 10 m wide). Residents at the lower levels have insufficient natural lighting, and their ventilation also affected. Geographically, Taipei City is a basin, and when the humid air from the south and the rains arrive in spring, excessive humidity is common. As a result, the skid resistance of the floors, if tiled, may decrease.
The community is connected through alleys, and the major thoroughfares on all four sides have heavy traffic. Therefore, residents facing the alleys are more likely to be disturbed by noise. The units on the lower levels are also more likely to be affected by vehicle emissions. There are no open spaces, such as green spaces and parks, in the vicinity for the elderly to interact with one another and engage in activities, and there is a lack of interaction and mingling among the residents.
4.2. Data Collection
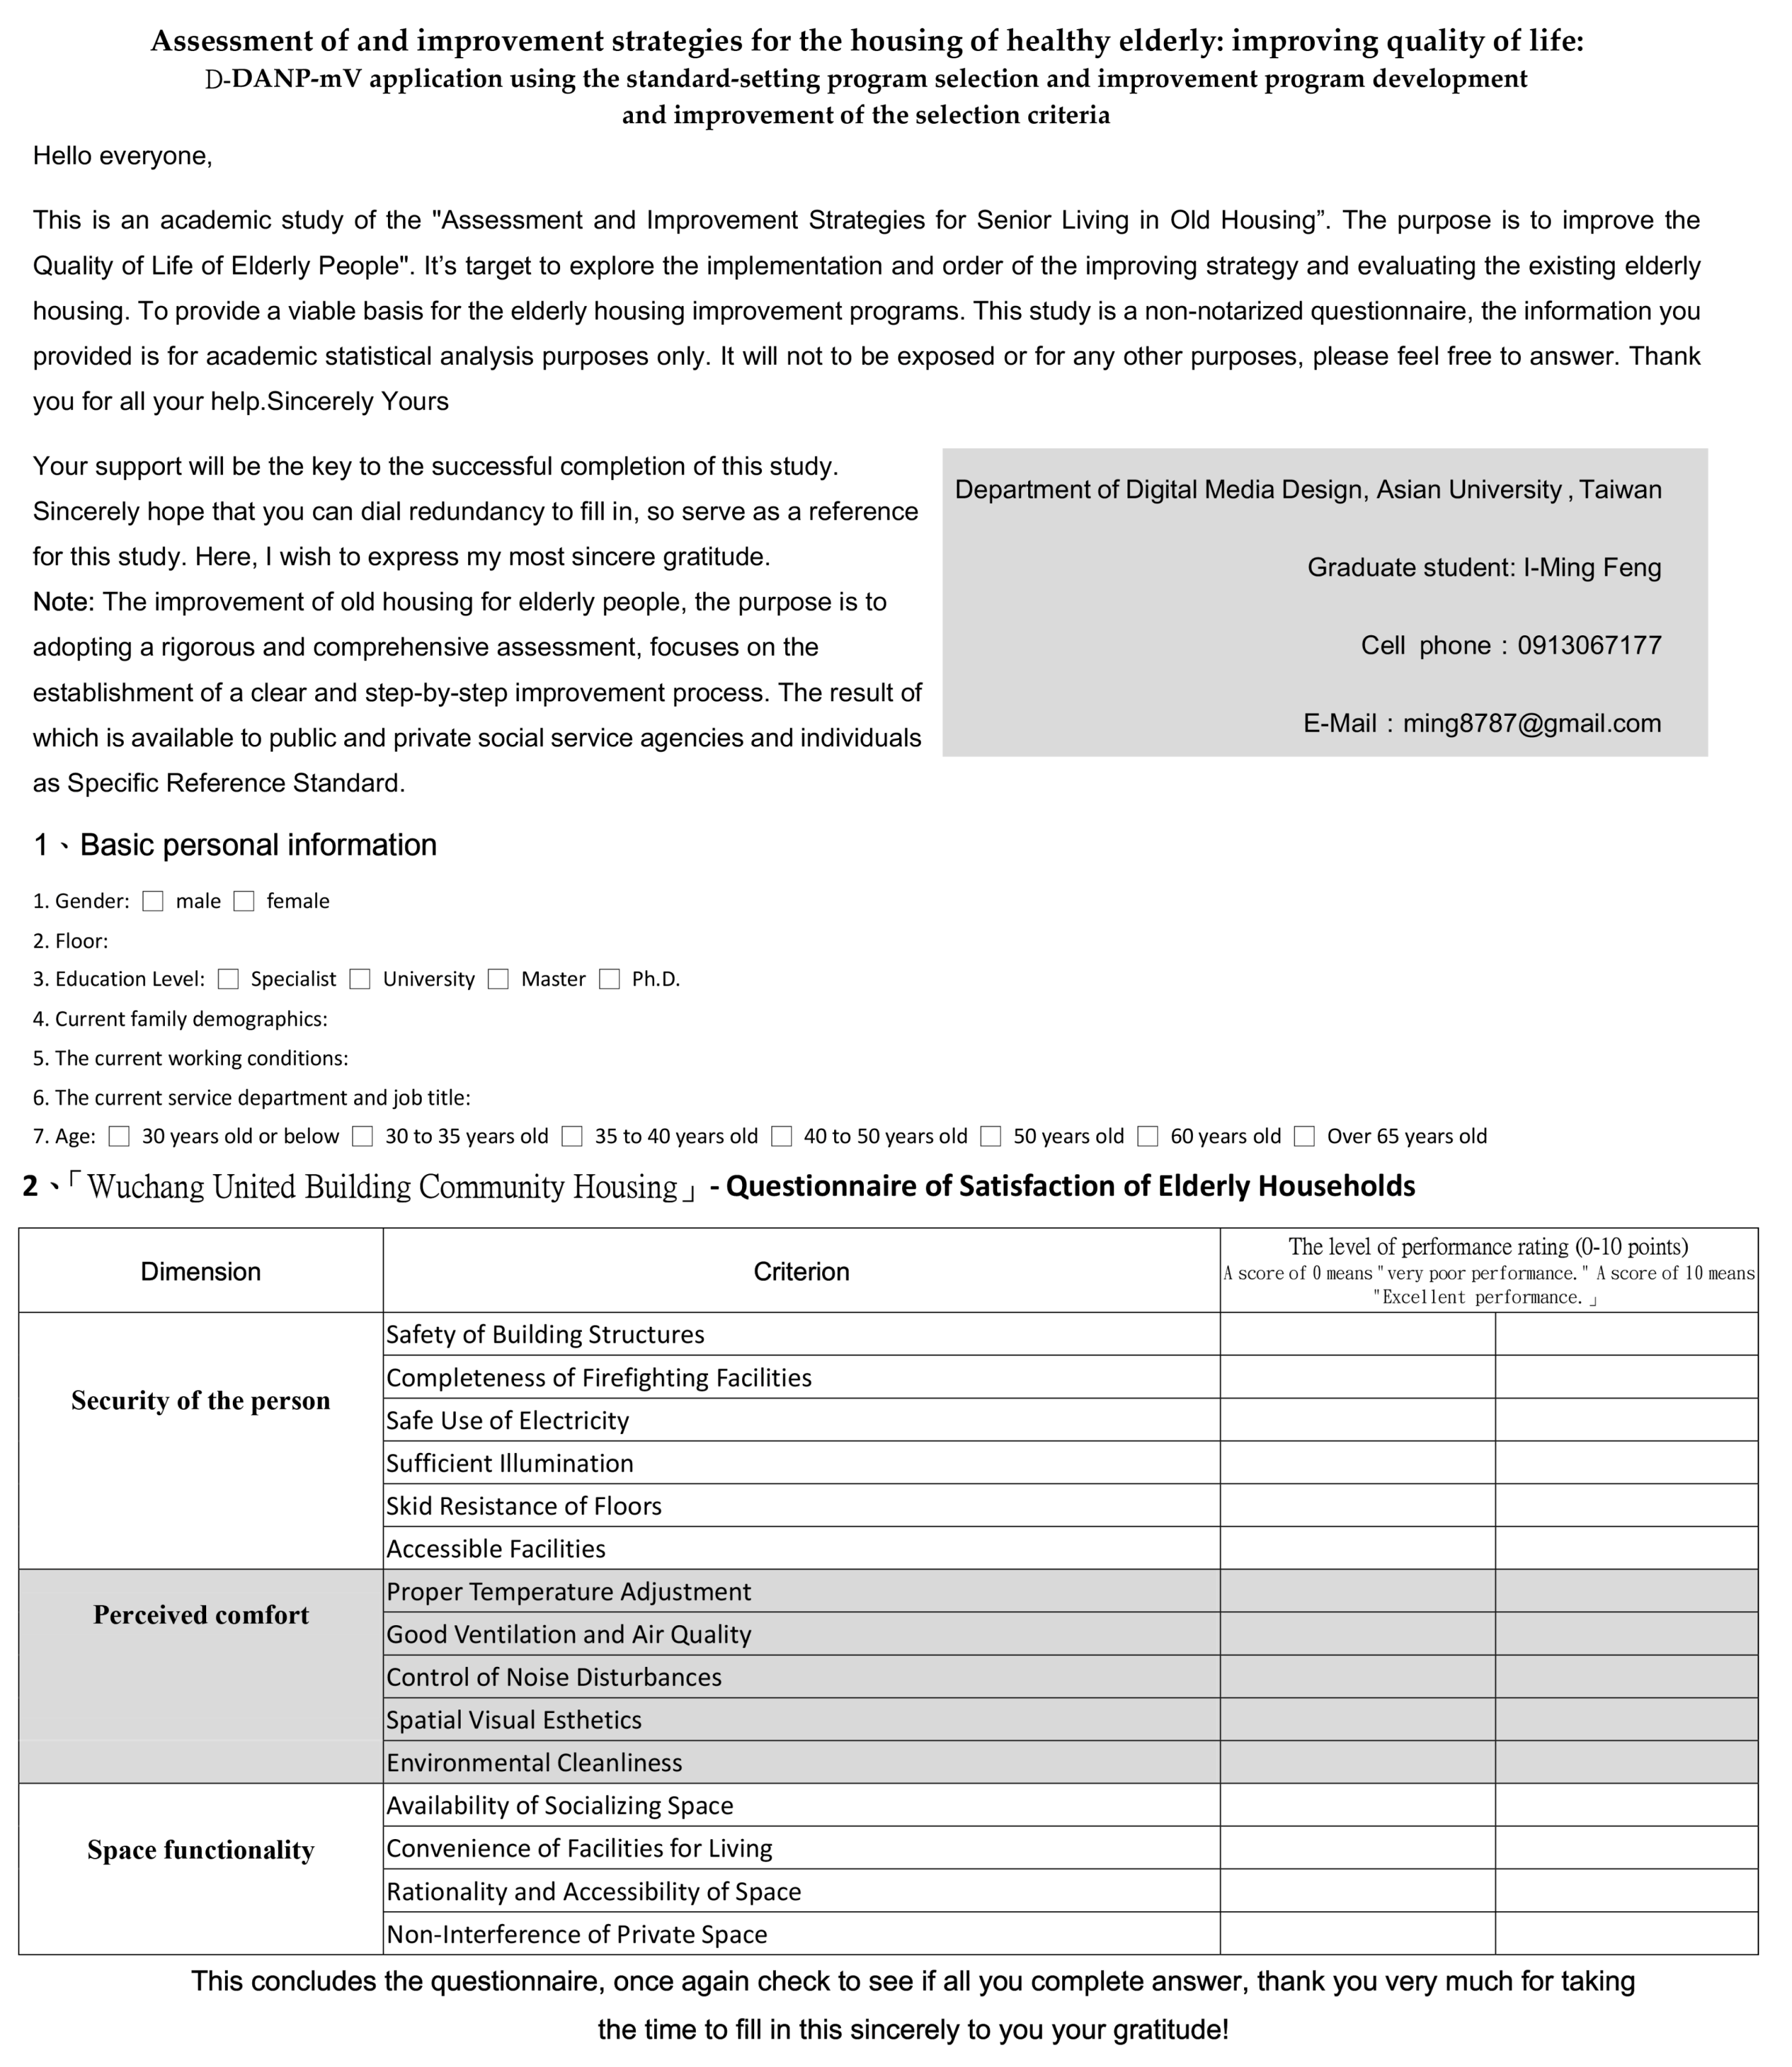
This section elaborates the approach of collecting the data and the basis on which the interviewees selected the factors. The interviewees were divided into two groups: The experts group and the elderly group. The mutual influences between the 15 criteria were surveyed using the DEMATEL questionnaire, and the experts were those interviewees who were appropriate for this form of survey. The degree to which a single criterion influences or is influenced was rated from 0–5, with 0 indicating “no influence”, and 5 indicating “highly influential”. On the contrary, VIKOR questionnaires were used to collect data on the level of satisfaction of the elderly with the 15 criteria; these elderly people lived locally in the empirical case site. The rating scale was from 0–10, with 0 indicating “extremely poor performance”, and 10 indicating “extremely good performance”.
The first stage involved surveying the experts. The following are the conditions and qualifications used to select the experts for interviews. The interviewed experts came from both industry and academia. Interviewees who were experts in the industry (building planning and interior design) had a deep understanding of the living needs and quality of life of the elderly, both in theory and practice, and they possessed practical experience in planning for and designing housing environments for the elderly. Experts from academia consisted of professional university scholars in the fields of architecture and interior design. Apart from having an understanding of and research experience with relevant issues, they had also guided students in relevant planning and training. Lastly, the selected experts were required to understand how a DEMATEL survey works and its purpose.
Fifteen experts were selected in the first stage. Eleven DEMATEL surveys were returned, of which ten met the selection criteria. Two did not because they did not provide definite ratings for the levels of influence among the 15 criteria. Among the experts who completed the ten valid questionnaires, six were heads of companies in the architectural and interior design industries, while four were professors in architectural programs and department heads of interior design programs at universities. To increase the effectiveness of the questionnaires, the surveys were conducted as structured interviews, with the average time of completion ranging from 2 to 2.5 h.
The second stage used the modified VIKOR survey questionnaires to conduct the interviews, where the interviewees were elderly people meeting WHO criteria (age 65 and above) and fulfilling the following conditions: They lived in the building area of the empirical case and they were in a healthy state (not including those with mobility difficulties, who are unable to independently live and look after oneself, and who suffer from mental degenerative diseases). The surveys were conducted over a period of 3 months, from 30 March to 30 June 2016, in two time slots, 8:00–10:00 in the morning and 3:00–5:00 in the afternoon. The author and an assistant collected the data by visiting the homes in person and by randomly waiting for and interacting with residents in the alleys around the community. Firstly, whether the elderly met the selection criteria was determined by visual observation, followed by obtaining the consent of the elderly to carry out the surveys, each lasting about 5–8 min. After the surveyors had explained, each criterion was investigated through a Q&A approach, where the ratings provided by the elderly with regard to the 15 criteria based on their levels of satisfaction with their current housing. To obtain the trust of the elderly respondents, their names and residential addresses were not recorded. We intended to interview approximately 80 elderly people, and we managed to approach 100 people who were healthy, of which, a total of 63 were successful interviews, with the rejection rate being 37%. There were 46 valid and 17 invalid questionnaires (where their levels of satisfaction with each criterion were too similar and where they did not know how to answer some of the questions); of the valid responses, 21 (46%) were male and 25 (54%) were female.
During the process of data collection, a large amount of rejections were received from the experts with regard to the interviews. The main reason was a lack of acquaintance with the experts and their lack of time due to work and the fact that the survey questionnaire required highly professional thinking and a sufficient amount of time to complete. Hence some experts decided to turn down the assessment or give up halfway. Therefore, those experts who were able to effectively complete the questionnaires were either introduced by experts who had agreed to participate or those who visited us in person and approved of the research. Furthermore, previous tutors and upper classmates from university have also been very helpful.
In using the VIKOR questionnaires to conduct interviews with the elderly in the empirical case, there was a serious issue of lack of trust. The reason could be the prevalence of fraud cases over recent years and the degradation of social morals, of which many elderly people are the primary victims. Therefore, the elderly were deeply distrustful towards strangers, resulting in a 70% rejection rate in the initial stages of the survey. To solve the problem of a high rejection rate, local community leaders were approached in the later stages to assist us in finding elderly people willing to undertake the survey, and the rejection rate then dropped to 15%. The highest rate of rejection by the elderly occurred when approached for random interviews in the alleys. The community lacked parks and open public spaces for the elderly to gather, and therefore, the method of waiting for the elderly people one by one to conduct interviews with them was operationally inefficient.
5. Results and Discussion
The INRM shown in Figure 6 explains the relationship of mutual influences between the three criteria of personal safety (D1), sensory comfort (D2) and functionalities of space in the improvement model. D3 is influenced by D1 and D2, while D1 is influenced by D2. Therefore, based on the results, to improve the housing environment of the elderly, the improvement and increase of D3 depends on increasing D2 and D1, and the improvement of D1 is also dependent on the increase of D2.
Through the same approach, judging from the perspective of INRM, “good ventilation and air quality” (C22) is the most influential criterion for “sensory comfort” (D2), “sufficient illumination” (C14) for “personal safety” (D1) and “rationality and accessibility of space” (C33) is the most influential for “functionalities of space” (D3).
- It can be seen from DANP’s results shown in IW (Figure 2), that VIKOR’s performance assessment can be used to study and analyze the issue of assessing and improving the housing of the elderly in an empirical case. The total gap value is the aggregate of all gap values of the criteria, which can be obtained by multiplying each of the gap values by its weight. The gap indicates the distance between the performance of the criterion and the ideal standard. In this study, the gap values obtained from surveying the elderly living in the location of the empirical case are represented by the gap values, as shown in Figure 2, which if improved, can increase the performance of each dimension/criterion.
- The performance values in the INRM model are shown in Table 2. D2 displays the largest gap value in all three framework criteria (0.415), which means D2 has the highest priority in terms of improvement. This is in line with the sequence of effects of the mutual influences between the three framework criteria in the INRM model. In the D2 criteria, C21 shows the largest gap value (0.118). Therefore, whether the criterion shows the largest gap value can be used as the benchmark for improvement prioritization in elderly housing in the empirical case. The ultimate goal of enhancing the quality of life of the elderly is achieved through effective and continuous improvement strategies.
Based on INRM (Figure 6) and the results of the performance assessment (Table 2) and according to the relationships and levels of influences between the frameworks and criteria, continuous improvement strategies are proposed and discussed and composite analysis of the improvement priorities is conducted. Gap values are used to confirm the priority items. Figure 2 shows that the elderly in the empirical case are commonly dissatisfied with and perceive a lack of D2 in their housing environment. Compared to the gap values of the other two items, their level of satisfaction is also low, which means that the elderly in the empirical case are not entirely satisfied with all the items and have the most concern for the lack of sensory comfort in their housing environment. Among the 15 criteria in Table 2, the ones showing larger gap values are C21 (0.118), C23 (0.111), C31 (0.098), C12 (0.079), and C22 (0.067). Therefore, C21, with the largest gap value, is the first priority for improvement, where strategies have to be devised through the systematic method of the DANP model to resolve the fundamental problems in the empirical case concerning the lack of satisfaction with the quality of life.
First, in terms of C21, the locality of the building in this empirical case is a densely populated urban area, and it is geographically located in the subtropics (121°34′00″ E, 25°03′00″ N), with an average summer temperature of 28–29 degrees Celsius and an average winter temperature of 16 degrees Celsius. A record temperature of 38.8 degrees Celsius occurred in the summer of 2016 and in the winter of the same year the lowest temperature was 4 degrees Celsius. Such a big temperature difference is a major threat to elderly people with chronic cardiovascular diseases. The measures used by the local residents to respond to temperature adjustment include the use of air-conditioners to adjust and control the temperature and humidity indoors. However, the increased use of air-conditioners by residents in the summer also increases the outdoor heat. To reduce electricity costs, the local residents often opt not to use air-conditioners and try to adapt to thermal discomforts through other means, such wearing light and breathable materials. They adjust and adapt to the heat in the environment through their behavior, reduce their anticipated discomfort with temperature, and adapt to the current circumstances. This method has been introduced in previous research as a self-adaptive approach [39]. Therefore, apart from changing individual behavior to adapt to the temperature, using mechanical fans and maintaining the ventilation indoors are other active means of improvement, which also have an effect on health [52]. Natural ventilation is one of the best strategies for reducing energy consumption related to building usage [64]. However, energy saving methods should not affect the comfort and health of the residents [65].
Based on the relationship of mutual influences between the criteria in the figure for INRM, C21 can influence C23, which has the second largest gap value in the VIKOR performance assessment. Noise has a significant and negative impact on psychological and physical health. The elderly in the empirical case attributed their sources of noise mainly to interference by neighbors and renovation work of neighbors. These are concentrated during the daytime, but the main source of noise is the movement of traffic and vehicles outside. The area is an open community and does not have a particular entrance and exit. As the community is adjacent to several thoroughfares, many small cars and motorcycles cut through the surrounding alleys to avoid congestion in the thoroughfares at certain times of day. Environmental noise is considered a menace to public hygiene [55]. Research shows that noise has become the most serious form of environmental pollution in Europe, and road traffic noise is the main factor in noise pollution [66]. Epidemiological evidence over the last few decades shows that the disturbance of traffic noise in housing environments and unsatisfactory health have a direct mutual correlation [54]. Therefore, the local elderly can only respond by trying their best to adapt to the noise disturbance or shutting the windows to block the noise. However the doing the latter also reduces ventilation [54] and contradicts the present situation concerning C21 and its improvement as described above.
Therefore, looking once again at the Figure 6 for the relationship of influences for the INRM criteria, it can be seen that C21 and C23 are directly influenced by C22. Good indoor air quality is determined by the level of pollution of air indoors. The indoor air pollutants, such as VOCs, microorganisms, and particles, have a negative impact on the health of the residents. These pollutants come from sources such as building materials and furniture [38]. The control of emission sources, ventilation, and the assessment of indoor air quality are the three main approaches used in green building planning for the management of indoor air quality [67]. Hence, maintaining the natural ventilation of indoor space does not only help conserve energy and reduce carbon emissions but is also important for increasing the air quality of buildings and housing environments [68] and is a key to preventing health problems from worsening. However, the pre-condition is that the air for ventilation is clean. If the air quality is unsatisfactory, more ventilation would only result in further negative impact on health [52]. Unsatisfactory air quality has always been a major problem in urban areas, especially due to car and motorcycle emissions. The local government already has existing policies tackling air pollution, such as reducing suspended particles in the air by controlling pollution sources, eliminating and replacing old vehicles, and promoting the use of electrical cars (the Department of Environmental Protection of Taipei City Government). The residents are still concerned about air quality. Therefore, in addition to encouraging and regulating the use of environment-friendly and green building materials for the indoors, the overall air quality also relies on the government’s prioritization of the issue of vehicle emissions. It is only when the air quality is improved that natural ventilation can be used indoors and outdoors, the indoor temperature can be adjusted, and the noise disturbances from outdoors can be reduced, thus improving the quality of life of the elderly in terms of sensory comfort. In sum, to effectively resolve the issue of the elderly’s satisfaction with their quality of life, the VIKOR performance assessment method was used to propose an effective strategy for finding the root influences. Therefore, in terms of the sequence of improvement priorities, the first priority should be given to C22, which points to the relationship between air quality and controlling traffic and vehicles as its core solution.
C31 has the third largest gap value in the VIKOR performance assessment. However, in the IRNM model, C31 has the lowest influence in the D3 framework, and the improvement of all the criteria has an influence on the increase of C31, including the improvement of D2, which also has an impact on the spatial environment of C31. According to the guidelines for age-friendly cities proposed by the WHO in 2007, encouraging the elderly to actively participate in social and community activities and visit neighbors has a direct effect on the health and quality of life of the elderly. There are no outdoor activities space (e.g., parks) in the locality of the empirical case, and observation shows that the local elderly have to go to parks in their neighboring communities or nearby schools to engage in outdoor activities. They are able to get to know friends of their age, and these regular social activities become a focal point of their lives. However, there are no outdoor activities and social activities spaces in the locality of the empirical case. Thus, indoor social events is more important functions. The elderly people we interviewed did not often use the spaces in their housing as a socializing venue for several reasons: the space was too messy and small, they were wary about disturbing other family members, and they had not considered its functionality for socializing. Understanding and intervention by family members is needed here to improve the availability of socializing spaces in the family and increase the self-confidence of the elderly and their willingness to interact with others. This will compensate for the lack of outdoor spaces in the community and improve the elderly’s level of satisfaction with their health and life.
6. Conclusions
With the aim of improving the housing environment of the elderly to increase their quality of life, this study gathered and studied the relevant literature and explored the various dimensions of the improvement of the housing and the quality of life of the elderly. All these efforts point to the important correlation with the health of the elderly as the core solution. In 1948, the WHO defined health as the collective state of physical, spiritual, and social well being and not merely as the absence of diseases and weakness [63]. This is consistent with the present study. Various dimensions were combined, yielding relevant subject knowledge, establishing the framework and criteria for assessment, and systematically constructing mutual influences between the frameworks and criteria. The empirical case focused on the Wuchang United Building Community, and through the MCDM model formed by combining the investigations and studies using the DANP method, we proposed a clear and effective improvement strategy and improvement priority sequence for the elderly’s housing environment. As the results of the research indicate, D2 is the most influential among the three frameworks and therefore should be the first improvement priority. The results show that the elderly have the most concern for their physical and psychological sensory comfort in their living environment. The improvement of C22 in D2 will not only influence C21 and C23 but also indirectly impact C31 in the D3 framework.
Therefore, it is evident that factors affecting the impacts of housing improvement on old-age health are complicated, with non-linear cause-effect interrelations among themselves. A single factor in the system may influence changes in another part of the system [30]. In the aging society, to fulfill the increasing needs of the aging population requires effective and continual strategies for improving the housing and health of the elderly. It is necessary to understand the issues of the elderly’s adaptability to their housing and environment. When inadequacies in satisfying their health and socio-psychological needs arise from a lack of adaptability, service providers and decision-makers should work together to continuously improve the health conditions of the elderly by constantly implementing intervention measures for improvement, creating new resources, and maintaining existing services to enhance them [69]. Nevertheless, there are several limitations in this study. It is a cross-sectional study focusing on examining the improvement of the housing environment for the elderly for a specific housing setting. Its data and outcome cannot be used for the assessment and the improvement of other elderly housing environments. However, the research process can still be used as a point of reference for decision-makers responsible for the improvement of other housing environments. Issues related to the health of the elderly, such as community environment, social welfare, and medical and health care, can still be studied further. However, with the changing demographic patterns and users’ characteristics, users’ behaviors and preferences will change over time. Even over a defined period, housing environment characteristics may change following environmental interventions, and users’ degree of satisfaction may change [63]. We understand that geographical environments, climates, urban developments, and living habits of the elderly can vary, and there will therefore be different changes in the improvement assessments. Future research may extend the sample of this empirical case into various environmental conditions, generating mutual references, conclusions, and analyses between multiple case studies; such research outcomes will be worth working toward and looking forward to.
Acknowledgments
The authors are extremely grateful for the Sustainability journal editorial team’s valuable comments on improving the quality of this article.
Author Contributions:
Bo-Wei Zhu designed the research; I-Ming Feng and Jun-Hong Chen provided the research idea and collected the data; Bo-Wei Zhu and Lei Xiong analyzed the data and drafted the manuscript; Finally, Jun-Hong Chen revised the paper. All authors have read and approved the final manuscript.
Conflicts of Interest
The authors declare no conflicts of interest.
Appendix A
DANP (DEMATEL-based ANP) was used to develop the structure of influential relationships and analyze the relationship (interaction) and the influential degree of the three dimensions and 15 criteria. As mentioned in Appendix A, we used the results of the nine experts’ questionnaires to measure the total influence matrix T and the degrees of influence. Table A1 shows the initial influence matrix derived from the average value of the nine experts’ questionnaires. The consistency gaps of these nine questionnaires were 4.52% and were smaller than 5%, implying that the confidence level was 95.48%, which is more than 95%, as demonstrated by the following text.
Table A2, Table A3 and Table A4 show the relationship between the total influence matrix T and the degrees of influence. Table A2 illustrates the total relationships among the 15 criteria. Table A3 illustrates the two types of information, namely the relationships among the three dimensions and the degree of influence of each dimension. The degree of influence of each dimension combined with the INRM revealed that, based on experts’ judgment, the dimension of sensory comfort (D2) had the highest effect among all dimensions and was thus the most influential dimension. The degree of influence of functionalities of space (D3) was the lowest, personal safety (D1) had intermediate influence. Table A4 presents the sum of influences given or received from the degree of influence of each criterion within its own dimension.
The IWs of criteria were obtained from the ANP process in the DANP model. First, based on Equations (8)–(11), the unweighted supermatrix was obtained by transposing the normalized influence matrix , as shown in Table A5. The weighted supermatrix based on Equations (12) and (13) is shown in Table A6. Then, the IWs of DANP were obtained by limiting the power of the weighted supermatrix, as shown in Table A7. The criterion of availability of socializing space (C31) exhibited the highest IW value (0.11), whereas completeness of firefighting facilities (C12) exhibited the lowest value (0.038).

Table A1.
Initial influence matrix A.
| Criteria | C11 | C12 | C13 | C14 | C15 | C16 | C21 | C22 | C23 | C24 | C25 | C31 | C32 | C33 | C34 |
|---|---|---|---|---|---|---|---|---|---|---|---|---|---|---|---|
| C11 | 0.0 | 2.7 | 2.0 | 0.5 | 1.4 | 1.8 | 1.8 | 2.5 | 2.1 | 3.3 | 1.2 | 1.8 | 2.5 | 3.4 | 2.4 |
| C12 | 1.4 | 0.0 | 1.5 | 0.9 | 0.3 | 0.6 | 0.3 | 1.7 | 0.7 | 1.9 | 1.8 | 1.0 | 1.2 | 0.8 | 0.3 |
| C13 | 1.9 | 3.0 | 0.0 | 1.7 | 0.6 | 1.8 | 2.0 | 1.0 | 2.3 | 2.5 | 2.1 | 2.5 | 2.7 | 1.5 | 1.1 |
| C14 | 1.7 | 1.2 | 2.5 | 0.0 | 1.9 | 2.3 | 2.7 | 1.1 | 0.7 | 3.0 | 3.4 | 2.5 | 2.9 | 2.8 | 2.7 |
| C15 | 0.5 | 0.8 | 0.7 | 0.5 | 0.0 | 3.3 | 0.5 | 0.5 | 0.1 | 1.9 | 2.0 | 1.9 | 2.8 | 2.8 | 1.0 |
| C16 | 1.6 | 0.7 | 1.7 | 1.3 | 2.6 | 0.0 | 0.5 | 1.3 | 1.4 | 2.9 | 1.5 | 2.8 | 3.2 | 3.3 | 1.2 |
| C21 | 1.5 | 1.4 | 2.4 | 1.6 | 1.7 | 1.8 | 0.0 | 2.5 | 1.4 | 1.9 | 2.3 | 3.2 | 3.1 | 2.0 | 2.6 |
| C22 | 2.2 | 1.5 | 2.5 | 2.7 | 2.5 | 0.8 | 3.6 | 0.0 | 3.1 | 1.9 | 2.7 | 3.9 | 2.6 | 1.1 | 2.7 |
| C23 | 0.6 | 0.4 | 1.2 | 0.9 | 1.1 | 1.2 | 2.1 | 1.4 | 0.0 | 2.1 | 2.2 | 3.3 | 1.9 | 0.9 | 3.9 |
| C24 | 2.0 | 1.1 | 2.1 | 3.0 | 1.6 | 1.6 | 2.0 | 2.3 | 0.8 | 0.0 | 2.8 | 3.0 | 1.2 | 2.0 | 2.4 |
| C25 | 1.9 | 1.8 | 3.4 | 2.2 | 3.2 | 2.5 | 1.1 | 3.3 | 0.8 | 3.9 | 0.0 | 3.4 | 2.0 | 1.5 | 1.8 |
| C31 | 1.6 | 1.6 | 1.8 | 2.6 | 1.8 | 2.4 | 1.4 | 2.7 | 2.0 | 2.6 | 2.2 | 0.0 | 1.9 | 2.5 | 2.9 |
| C32 | 1.3 | 1.0 | 2.4 | 1.8 | 1.6 | 1.7 | 2.0 | 1.4 | 2.5 | 2.3 | 3.0 | 3.4 | 0.0 | 2.2 | 2.3 |
| C33 | 2.2 | 1.4 | 2.5 | 1.5 | 1.6 | 2.2 | 1.4 | 2.8 | 2.4 | 3.4 | 2.5 | 3.6 | 3.5 | 0.0 | 2.7 |
| C34 | 1.2 | 0.6 | 1.2 | 1.5 | 0.3 | 2.0 | 1.5 | 1.5 | 2.9 | 1.2 | 1.7 | 1.4 | 2.5 | 3.1 | 0.0 |
Note: , where n is the number of criteria (n = 15), H is the sample of nine experts (H = 10) whose practical experience and significant confidence reach 95.48% (more than 95%).
Table A2.
The total influence matrix of criteria TC.
| Criteria | C11 | C12 | C13 | C14 | C15 | C16 | C21 | C22 | C23 | C24 | C25 | C31 | C32 | C33 | C34 |
|---|---|---|---|---|---|---|---|---|---|---|---|---|---|---|---|
| C11 | 0.117 | 0.169 | 0.198 | 0.140 | 0.153 | 0.181 | 0.168 | 0.203 | 0.180 | 0.261 | 0.196 | 0.243 | 0.235 | 0.238 | 0.219 |
| C12 | 0.097 | 0.055 | 0.117 | 0.090 | 0.071 | 0.086 | 0.073 | 0.117 | 0.084 | 0.143 | 0.131 | 0.129 | 0.120 | 0.100 | 0.091 |
| C13 | 0.154 | 0.168 | 0.135 | 0.158 | 0.124 | 0.169 | 0.161 | 0.154 | 0.171 | 0.227 | 0.203 | 0.241 | 0.223 | 0.179 | 0.173 |
| C14 | 0.170 | 0.142 | 0.225 | 0.138 | 0.179 | 0.210 | 0.199 | 0.182 | 0.155 | 0.272 | 0.263 | 0.277 | 0.262 | 0.241 | 0.239 |
| C15 | 0.094 | 0.089 | 0.121 | 0.101 | 0.084 | 0.178 | 0.094 | 0.110 | 0.089 | 0.174 | 0.163 | 0.184 | 0.190 | 0.179 | 0.133 |
| C16 | 0.146 | 0.110 | 0.177 | 0.148 | 0.174 | 0.127 | 0.124 | 0.160 | 0.150 | 0.237 | 0.189 | 0.250 | 0.237 | 0.225 | 0.176 |
| C21 | 0.157 | 0.140 | 0.211 | 0.170 | 0.165 | 0.186 | 0.125 | 0.204 | 0.165 | 0.231 | 0.226 | 0.280 | 0.254 | 0.209 | 0.227 |
| C22 | 0.187 | 0.155 | 0.232 | 0.212 | 0.199 | 0.181 | 0.231 | 0.161 | 0.221 | 0.255 | 0.257 | 0.322 | 0.265 | 0.208 | 0.252 |
| C23 | 0.109 | 0.092 | 0.150 | 0.128 | 0.125 | 0.144 | 0.152 | 0.150 | 0.103 | 0.197 | 0.188 | 0.240 | 0.188 | 0.151 | 0.227 |
| C24 | 0.165 | 0.130 | 0.199 | 0.199 | 0.159 | 0.177 | 0.171 | 0.195 | 0.144 | 0.178 | 0.231 | 0.267 | 0.203 | 0.205 | 0.216 |
| C25 | 0.179 | 0.161 | 0.249 | 0.198 | 0.214 | 0.217 | 0.166 | 0.236 | 0.160 | 0.297 | 0.185 | 0.303 | 0.244 | 0.214 | 0.221 |
| C31 | 0.161 | 0.145 | 0.198 | 0.195 | 0.169 | 0.202 | 0.163 | 0.211 | 0.180 | 0.251 | 0.226 | 0.204 | 0.228 | 0.224 | 0.236 |
| C32 | 0.150 | 0.128 | 0.208 | 0.173 | 0.161 | 0.183 | 0.172 | 0.177 | 0.188 | 0.239 | 0.239 | 0.282 | 0.174 | 0.211 | 0.218 |
| C33 | 0.190 | 0.154 | 0.234 | 0.186 | 0.179 | 0.214 | 0.179 | 0.232 | 0.207 | 0.293 | 0.254 | 0.317 | 0.286 | 0.181 | 0.253 |
| C34 | 0.124 | 0.096 | 0.151 | 0.139 | 0.105 | 0.160 | 0.138 | 0.151 | 0.176 | 0.177 | 0.176 | 0.197 | 0.203 | 0.202 | 0.131 |
Table A3.
The total influence matrix of criteria TD and sum of influences given/received on dimensions.
Table A3.
The total influence matrix of criteria TD and sum of influences given/received on dimensions.
| Dimensions | D1 | D2 | D3 | ||||
|---|---|---|---|---|---|---|---|
| Personal safety (D1) | 0.139 | 0.168 | 0.199 | 0.506 | 0.479 | 0.985 | 0.027 |
| Sensory comfort (D2) | 0.173 | 0.193 | 0.235 | 0.601 | 0.562 | 1.163 | 0.039 |
| Functionalities of space (D3) | 0.167 | 0.201 | 0.222 | 0.590 | 0.656 | 1.246 | −0.066 |
Table A4.
Sum of influences given/received on criteria.
| Criteria | ||||
|---|---|---|---|---|
| Safety of building structures (C11) | 0.957 | 0.778 | 1.736 | 0.179 |
| Completeness of firefighting facilities (C12) | 0.517 | 0.733 | 1.250 | −0.217 |
| Safe use of electricity (C13) | 0.908 | 0.973 | 1.880 | −0.065 |
| Sufficient illumination (C14) | 1.065 | 0.776 | 1.841 | 0.289 |
| Skid resistance of floors (C15) | 0.668 | 0.785 | 1.454 | −0.117 |
| Accessible facilities (C16) | 0.883 | 0.952 | 1.835 | −0.069 |
| Proper temperature adjustment (C21) | 0.952 | 0.844 | 1.796 | 0.108 |
| Good ventilation and air quality (C22) | 1.124 | 0.946 | 2.070 | 0.178 |
| Control of noise disturbances (C23) | 0.790 | 0.794 | 1.584 | −0.004 |
| Spatial visual esthetics (C24) | 0.920 | 1.158 | 2.078 | −0.238 |
| Environmental cleanliness (C25) | 1.044 | 1.087 | 2.132 | −0.043 |
| Availability of Socializing Space (C31) | 0.893 | 1.000 | 1.893 | −0.107 |
| Convenience of Facilities for Living (C32) | 0.885 | 0.892 | 1.778 | −0.007 |
| Rationality and Accessibility of Space (C33) | 1.037 | 0.818 | 1.855 | 0.219 |
| Non-Interference of Private Space (C34) | 0.734 | 0.838 | 1.572 | −0.105 |
Table A5.
The unweighted supermatrix .
| Criteria | C11 | C12 | C13 | C14 | C15 | C16 | C21 | C22 | C23 | C24 | C25 | C31 | C32 | C33 | C34 |
|---|---|---|---|---|---|---|---|---|---|---|---|---|---|---|---|
| C11 | 0.122 | 0.188 | 0.169 | 0.160 | 0.141 | 0.165 | 0.152 | 0.160 | 0.147 | 0.161 | 0.147 | 0.150 | 0.149 | 0.164 | 0.160 |
| C12 | 0.176 | 0.106 | 0.185 | 0.134 | 0.134 | 0.125 | 0.136 | 0.133 | 0.123 | 0.126 | 0.132 | 0.135 | 0.128 | 0.133 | 0.124 |
| C13 | 0.206 | 0.226 | 0.149 | 0.211 | 0.181 | 0.201 | 0.205 | 0.199 | 0.201 | 0.193 | 0.204 | 0.185 | 0.208 | 0.202 | 0.194 |
| C14 | 0.147 | 0.175 | 0.174 | 0.130 | 0.151 | 0.168 | 0.166 | 0.182 | 0.171 | 0.194 | 0.163 | 0.183 | 0.173 | 0.161 | 0.179 |
| C15 | 0.160 | 0.138 | 0.137 | 0.168 | 0.126 | 0.197 | 0.160 | 0.170 | 0.167 | 0.154 | 0.175 | 0.158 | 0.160 | 0.155 | 0.136 |
| C16 | 0.189 | 0.167 | 0.186 | 0.197 | 0.267 | 0.144 | 0.181 | 0.155 | 0.192 | 0.172 | 0.179 | 0.189 | 0.182 | 0.185 | 0.207 |
| C21 | 0.166 | 0.134 | 0.175 | 0.185 | 0.149 | 0.144 | 0.131 | 0.205 | 0.192 | 0.186 | 0.159 | 0.158 | 0.170 | 0.154 | 0.168 |
| C22 | 0.201 | 0.213 | 0.169 | 0.170 | 0.175 | 0.186 | 0.215 | 0.143 | 0.189 | 0.212 | 0.226 | 0.204 | 0.174 | 0.199 | 0.185 |
| C23 | 0.179 | 0.152 | 0.186 | 0.144 | 0.142 | 0.174 | 0.174 | 0.196 | 0.131 | 0.157 | 0.154 | 0.175 | 0.185 | 0.178 | 0.215 |
| C24 | 0.259 | 0.261 | 0.248 | 0.254 | 0.276 | 0.276 | 0.243 | 0.227 | 0.249 | 0.194 | 0.285 | 0.244 | 0.235 | 0.251 | 0.217 |
| C25 | 0.194 | 0.240 | 0.222 | 0.246 | 0.259 | 0.220 | 0.237 | 0.229 | 0.238 | 0.251 | 0.177 | 0.219 | 0.236 | 0.218 | 0.215 |
| C31 | 0.260 | 0.293 | 0.295 | 0.272 | 0.269 | 0.281 | 0.289 | 0.307 | 0.298 | 0.300 | 0.309 | 0.228 | 0.318 | 0.306 | 0.269 |
| C32 | 0.252 | 0.272 | 0.274 | 0.257 | 0.277 | 0.267 | 0.262 | 0.253 | 0.233 | 0.228 | 0.249 | 0.256 | 0.197 | 0.276 | 0.277 |
| C33 | 0.255 | 0.228 | 0.219 | 0.237 | 0.261 | 0.253 | 0.216 | 0.199 | 0.188 | 0.230 | 0.218 | 0.251 | 0.239 | 0.174 | 0.275 |
| C34 | 0.234 | 0.207 | 0.212 | 0.234 | 0.194 | 0.198 | 0.234 | 0.241 | 0.281 | 0.242 | 0.225 | 0.265 | 0.246 | 0.244 | 0.179 |
Table A6.
The weighted supermatrix .
| Criteria | C11 | C12 | C13 | C14 | C15 | C16 | C21 | C22 | C23 | C24 | C25 | C31 | C32 | C33 | C34 |
|---|---|---|---|---|---|---|---|---|---|---|---|---|---|---|---|
| C11 | 0.033 | 0.052 | 0.046 | 0.044 | 0.039 | 0.045 | 0.044 | 0.046 | 0.042 | 0.046 | 0.042 | 0.043 | 0.042 | 0.046 | 0.045 |
| C12 | 0.048 | 0.029 | 0.051 | 0.037 | 0.037 | 0.034 | 0.039 | 0.038 | 0.035 | 0.036 | 0.038 | 0.038 | 0.036 | 0.038 | 0.035 |
| C13 | 0.057 | 0.062 | 0.041 | 0.058 | 0.050 | 0.055 | 0.059 | 0.057 | 0.058 | 0.056 | 0.059 | 0.052 | 0.059 | 0.057 | 0.055 |
| C14 | 0.040 | 0.048 | 0.048 | 0.036 | 0.041 | 0.046 | 0.048 | 0.052 | 0.049 | 0.056 | 0.047 | 0.052 | 0.049 | 0.046 | 0.051 |
| C15 | 0.044 | 0.038 | 0.037 | 0.046 | 0.035 | 0.054 | 0.046 | 0.049 | 0.048 | 0.044 | 0.050 | 0.045 | 0.045 | 0.044 | 0.038 |
| C16 | 0.052 | 0.046 | 0.051 | 0.054 | 0.073 | 0.040 | 0.052 | 0.045 | 0.055 | 0.050 | 0.051 | 0.053 | 0.052 | 0.052 | 0.058 |
| C21 | 0.055 | 0.044 | 0.058 | 0.061 | 0.049 | 0.048 | 0.042 | 0.066 | 0.062 | 0.060 | 0.051 | 0.054 | 0.058 | 0.052 | 0.057 |
| C22 | 0.067 | 0.071 | 0.056 | 0.056 | 0.058 | 0.062 | 0.069 | 0.046 | 0.061 | 0.068 | 0.073 | 0.070 | 0.059 | 0.068 | 0.063 |
| C23 | 0.059 | 0.051 | 0.062 | 0.048 | 0.047 | 0.058 | 0.056 | 0.063 | 0.042 | 0.050 | 0.049 | 0.060 | 0.063 | 0.061 | 0.073 |
| C24 | 0.086 | 0.086 | 0.082 | 0.084 | 0.091 | 0.091 | 0.078 | 0.073 | 0.080 | 0.062 | 0.092 | 0.083 | 0.080 | 0.086 | 0.074 |
| C25 | 0.064 | 0.080 | 0.073 | 0.082 | 0.086 | 0.073 | 0.076 | 0.074 | 0.077 | 0.081 | 0.057 | 0.075 | 0.080 | 0.074 | 0.074 |
| C31 | 0.102 | 0.115 | 0.116 | 0.107 | 0.106 | 0.111 | 0.113 | 0.120 | 0.116 | 0.117 | 0.121 | 0.086 | 0.120 | 0.115 | 0.101 |
| C32 | 0.099 | 0.107 | 0.108 | 0.101 | 0.109 | 0.105 | 0.102 | 0.099 | 0.091 | 0.089 | 0.097 | 0.096 | 0.074 | 0.104 | 0.104 |
| C33 | 0.100 | 0.090 | 0.086 | 0.093 | 0.103 | 0.100 | 0.084 | 0.078 | 0.073 | 0.090 | 0.085 | 0.094 | 0.090 | 0.066 | 0.103 |
| C34 | 0.092 | 0.081 | 0.084 | 0.092 | 0.076 | 0.078 | 0.091 | 0.094 | 0.110 | 0.095 | 0.088 | 0.100 | 0.093 | 0.092 | 0.067 |
Table A7.
The influential weights of DANP when .
| Criteria | C11 | C12 | C13 | C14 | C15 | C16 | C21 | C22 | C23 | C24 | C25 | C31 | C32 | C33 | C34 |
|---|---|---|---|---|---|---|---|---|---|---|---|---|---|---|---|
| IWs | 0.044 | 0.038 | 0.056 | 0.048 | 0.044 | 0.052 | 0.055 | 0.064 | 0.057 | 0.081 | 0.075 | 0.110 | 0.098 | 0.089 | 0.089 |
Appendix B
Various Types of Questionnaire Sample
References
- Oyebanji, A.O.; Liyanage, C.; Akintoye, A. Critical Success Factors (CSFs) for achieving sustainable social housing (SSH). Int. J. Sustain. Built Environ. 2017, 6, 216–227. [Google Scholar] [CrossRef]
- Li, J.; Ng, S.T.; Skitmore, M. Review of low-carbon refurbishment solutions for residential buildings with particular reference to multi-story buildings in Hong Kong. Renew. Sustain. Energy Rev. 2017, 73, 393–407. [Google Scholar] [CrossRef]
- Buffel, T.; Phillipson, C. Can global cities be ‘age-friendly cities’? Urban development and ageing populations. Cities 2016, 55, 94–100. [Google Scholar] [CrossRef]
- Steels, S. Key characteristics of age-friendly cities and communities: A review. Cities 2015, 47, 45–52. [Google Scholar] [CrossRef]
- Nations, U. World Population Ageing 2013; Department of Economic and Social Affairs: New York, NY, USA, 2013. [Google Scholar]
- World Health Organization. Global Age-Friendly Cities: A Guide; World Health Organization: Geneva, Switzerland, 2007. [Google Scholar]
- Keall, M.; Baker, M.G.; Howden-Chapman, P.; Cunningham, M.; Ormandy, D. Assessing housing quality and its impact on health, safety and sustainability. J. Epidemiol. Community Health 2010, 64, 765–771. [Google Scholar] [CrossRef] [PubMed]
- Wahl, H.W.; Iwarsson, S.; Oswald, F. Aging well and the environment: Toward an integrative model and research agenda for the future. Gerontologist 2012, 52, 306–316. [Google Scholar] [CrossRef] [PubMed]
- Ottoni, C.A.; Sims-Gould, J.; Winters, M.; Heijnen, M.; McKay, H.A. “Benches become like porches”: Built and social environment influences on older adults’ experiences of mobility and well-being. Soc. Sci. Med. 2016, 169, 33–41. [Google Scholar] [CrossRef] [PubMed]
- Leibing, A.; Guberman, N.; Wiles, J. Liminal homes: Older people, loss of capacities, and the present future of living spaces. J. Aging Stud. 2016, 37, 10–19. [Google Scholar] [CrossRef] [PubMed]
- Fernández-Portero, C.; Alarcón, D.; Padura, Á.B. Dwelling conditions and life satisfaction of older people through residential satisfaction. J. Environ. Psychol. 2017, 49, 1–7. [Google Scholar] [CrossRef]
- Leith, K.H. “Home is where the heart is… or is it?”: A phenomenological exploration of the meaning of home for older women in congregate housing. J. Aging Stud. 2016, 20, 317–333. [Google Scholar] [CrossRef]
- Fänge, A.; Ivanoff, S.D. The home is the hub of health in very old age: Findings from the enable-age Project. Arch. Gerontol. Geriatr. 2009, 48, 340–345. [Google Scholar] [CrossRef] [PubMed]
- Wiles, J.L.; Leibing, A.; Guberman, N.; Reeve, J.; Allen, R.E. The meaning of “aging in place” to older people. Gerontologist 2012, 52, 357–366. [Google Scholar] [CrossRef] [PubMed]
- Kerr, J.; Rosenberg, D.; Frank, L. The role of the built environment in healthy aging: Community design, physical activity, and health among older adults. J. Plan. Lit. 2012, 27, 43–60. [Google Scholar] [CrossRef]
- Vasara, P. Not ageing in place: Negotiating meanings of residency in age-related housing. J. Aging Stud. 2015, 35, 55–64. [Google Scholar] [CrossRef] [PubMed]
- Minami, K. The Efforts to Develop Longer Life Housing with Adaptability in Japan. Energy Procedia 2016, 96, 662–673. [Google Scholar] [CrossRef]
- Rioux, L. The well-being of aging people living in their own homes. J. Environ. Psychol. 2005, 25, 231–243. [Google Scholar] [CrossRef]
- Oswald, F.; Wahl, H.W.; Schilling, O.; Nygren, C.; Fänge, A.; Sixsmith, A.; Sixsmith, J.; Széman, Z.; Tomsone, S.; Iwarsson, S.; et al. Relationships between housing and healthy aging in very old age. Gerontologist 2007, 47, 96–107. [Google Scholar] [CrossRef] [PubMed]
- Tyrovolas, S.; Haro, J.M.; Mariolis, A.; Piscopo, S.; Valacchi, G.; Tsakountakis, N.; Zeimbekis, A.; Tyrovola, D.; Bountziouka, V.; Gotsis, E.; et al. Successful aging, dietary habits and health status of elderly individuals: A k-dimensional approach within the multi-national MEDIS study. Exp. Gerontol. 2014, 60, 57–63. [Google Scholar] [CrossRef] [PubMed]
- Kahana, E.; Lovegreen, L.; Kahana, B.; Kahana, M. Person, environment, and person-environment fit as influences on residential satisfaction of elders. Environ. Behav. 2003, 35, 434–453. [Google Scholar] [CrossRef]
- Song, Y.; Knaap, G.J. New urbanism and housing values: A disaggregate assessment. J. Urban Econ. 2003, 54, 218–238. [Google Scholar] [CrossRef]
- Crews, D.E.; Zavotka, S. Aging, disability, and frailty: Implications for universal design. J. Physiol. Anthropol. 2006, 25, 113–118. [Google Scholar] [CrossRef] [PubMed]
- Phillips, J.; Walford, N.; Hockey, A.; Foreman, N.; Lewis, M. Older people and outdoor environments: Pedestrian anxieties and barriers in the use of familiar and unfamiliar spaces. Geoforum 2013, 47, 113–124. [Google Scholar] [CrossRef]
- Srichuae, S.; Nitivattananon, V.; Perera, R. Aging society in Bangkok and the factors affecting mobility of elderly in urban public spaces and transportation facilities. IATSS Res. 2016, 40, 26–34. [Google Scholar] [CrossRef]
- Iwarsson, S.; Wahl, H.W.; Nygren, C.; Oswald, F.; Sixsmith, A.; Sixsmith, J.; Széman, Z.; Tomsone, S. Importance of the home environment for healthy aging: Conceptual and methodological background of the European ENABLE-AGE Project. Gerontologist 2007, 47, 78–84. [Google Scholar] [CrossRef] [PubMed]
- Bowling, A.; Dieppe, P. What is successful ageing and who should define it? BMJ 2005, 331, 1548–1551. [Google Scholar] [CrossRef] [PubMed]
- Stahl, A.; Horstmann, V.; Iwarsson, S. A five-year follow-up among older people after an outdoor environment intervention. Transp. Policy 2013, 27, 134–141. [Google Scholar] [CrossRef]
- Yung, E.H.; Conejos, S.; Chan, E.H. Social needs of the elderly and active aging in public open spaces in urban renewal. Cities 2016, 52, 114–122. [Google Scholar] [CrossRef]
- Lawrence, R.J. Constancy and Change: Key Issues in Housing and Health Research, 1987–2017. Int. J. Environ. Res. Public Health 2017, 14, 763. [Google Scholar] [CrossRef] [PubMed]
- Ping, Y.; Xiaohua, W. Risk factors for accidental falls in the elderly and intervention strategy. J. Med. Coll. 2012, 27, 299–305. [Google Scholar] [CrossRef]
- Eriksen, M.D.; Greenhalgh-Stanley, N.; Engelhardt, G.V. Home safety, accessibility, and elderly health: Evidence from falls. J. Urban Econ. 2015, 87, 14–24. [Google Scholar] [CrossRef]
- Leszczyńska, A.; Daniszewska, B.; Pruszyńska, M.; Przedborska, A.; Hadała, M.; Raczkowski, J.W. Effects of a health improvement programme on quality of life in elderly people after falls. Pol. Ann. Med. 2016, 23, 129–134. [Google Scholar] [CrossRef]
- Nriagu, J.; Smith, P.; Socier, D. A rating scale for housing-based health hazards. Sci. Total Environ. 2011, 409, 5423–5431. [Google Scholar] [CrossRef] [PubMed]
- Grenier, A.; Barken, R.; McGrath, C. Homelessness and aging: The contradictory ordering of ‘house’ and ‘home’. J. Aging Stud. 2016, 39, 73–80. [Google Scholar] [CrossRef] [PubMed]
- Mohammad, S.A.; Dom, M.M.; Ahmad, S.S. Inclusion of Social Realm within Elderly Facilities to Promote their Wellbeing. Procedia Soc. Behav. Sci. 2016, 234, 114–124. [Google Scholar] [CrossRef]
- Weenig, M.W.; Staats, H. The impact of a refurbishment of two communal spaces in a care home on residents’ subjective well-being. J. Environ. Psychol. 2010, 30, 542–552. [Google Scholar] [CrossRef]
- Frontczak, M.; Andersen, R.V.; Wargocki, P. Questionnaire survey on factors influencing comfort with indoor environmental quality in Danish housing. Build. Environ. 2012, 50, 56–64. [Google Scholar] [CrossRef] [Green Version]
- Frontczak, M.; Wargocki, P. Literature survey on how different factors influence human comfort in indoor environments. Build. Environ. 2011, 46, 922–937. [Google Scholar] [CrossRef]
- Ormandy, D.; Ezratty, V. Health and thermal comfort: From WHO guidance to housing strategies. Energy Policy 2012, 49, 116–121. [Google Scholar] [CrossRef]
- Henshaw, V.; Guy, S. Embodied thermal environments: An examination of older-people’s sensory experiences in a variety of residential types. Energy Policy 2015, 84, 233–240. [Google Scholar] [CrossRef]
- Ambrose, A.F.; Paul, G.; Hausdorff, J.M. Risk factors for falls among older adults: A review of the literature. Maturitas 2013, 75, 51–61. [Google Scholar] [CrossRef] [PubMed]
- Haans, A. The natural preference in people’s appraisal of light. J. Environ. Psychol. 2014, 39, 51–61. [Google Scholar] [CrossRef]
- Kinnane, O.; Sinnott, D.; Turner, W.J. Evaluation of passive ventilation provision in domestic housing retrofit. Build. Environ. 2016, 106, 205–218. [Google Scholar] [CrossRef]
- Tzivian, L.; Winkler, A.; Dlugaj, M.; Schikowski, T.; Vossoughi, M.; Fuks, K.; Weinmayr, G.; Hoffmann, B. Effect of long-term outdoor air pollution and noise on cognitive and psychological functions in adults. Int. J. Hyg. Environ. Health 2015, 218, 1–11. [Google Scholar] [CrossRef] [PubMed]
- Behm, L.; Wilhelmson, K.; Falk, K.; Eklund, K.; Zidén, L.; Dahlin-Ivanoff, S. Positive health outcomes following health-promoting and disease-preventive interventions for independent very old persons: Long-term results of the three-armed RCT Elderly Persons in the Risk Zone. Arch. Gerontol. Geriatr. 2014, 58, 376–383. [Google Scholar] [CrossRef] [PubMed] [Green Version]
- Johansson, M.; Pedersen, E.; Maleetipwan-Mattsson, P.; Kuhn, L.; Laike, T. Perceived outdoor lighting quality (POLQ): A lighting assessment tool. J. Environ. Psychol. 2014, 39, 14–21. [Google Scholar] [CrossRef]
- Lehna, C.; Merrell, J.; Furmanek, S.; Twyman, S. Home fire safety intervention pilot with urban older adults living in Wales. Burns 2017, 43, 69–75. [Google Scholar] [CrossRef] [PubMed]
- Smolders, K.C.; de Kort, Y.A. Bright light and mental fatigue: Effects on alertness, vitality, performance and physiological arousal. J. Environ. Psychol. 2014, 39, 77–91. [Google Scholar] [CrossRef]
- Froehlich-Grobe, K.; Regan, G.; Reese-Smith, J.Y.; Heinrich, K.M.; Lee, R.E. Physical access in urban public housing facilities. Disabil. Health J. 2008, 1, 25–29. [Google Scholar] [CrossRef] [PubMed]
- Oiamo, T.H.; Luginaah, I.N.; Baxter, J. Cumulative effects of noise and odour annoyances on environmental and health related quality of life. Soc. Sci. Med. 2015, 146, 191–203. [Google Scholar] [CrossRef] [PubMed]
- Carrer, P.; Wargocki, P.; Fanetti, A.; Bischof, W.; Fernandes, D.O.; Hartmann, T.; Kephalopoulos, S.; Palkonen, S.; Seppänenet, O. What does the scientific literature tell us about the ventilation–health relationship in public and residential buildings? Build. Environ. 2015, 94, 273–286. [Google Scholar] [CrossRef]
- Min, K.B.; Min, J.Y. Exposure to environmental noise and risk for male infertility: A population-based cohort study. Environ. Pollut. 2017, 226, 118–124. [Google Scholar] [CrossRef] [PubMed]
- Brink, M. Parameters of well-being and subjective health and their relationship with residential traffic noise exposure—A representative evaluation in Switzerland. Environ. Int. 2011, 37, 723–733. [Google Scholar] [CrossRef] [PubMed]
- Dreger, S.; Meyer, N.; Fromme, H.; Bolte, G. Environmental noise and incident mental health problems: A prospective cohort study among school children in Germany. Environ. Res. 2015, 143, 49–54. [Google Scholar] [CrossRef] [PubMed]
- Park, S.H.; Lee, P.J.; Lee, B.K. Levels and sources of neighbour noise in heavyweight residential buildings in Korea. Appl. Acoust. 2017, 120, 148–157. [Google Scholar] [CrossRef]
- Exner, M.; Hartemann, P.; Kistemann, T. Hygiene and health—The need for a holistic approach. Am. J. Infect. Control 2001, 29, 228–231. [Google Scholar] [CrossRef] [PubMed]
- Wen, M.; Hawkley, L.C.; Cacioppo, J.T. Objective and perceived neighborhood environment, individual SES and psychosocial factors, and self-rated health: An analysis of older adults in Cook County, Illinois. Soc. Sci. Med. 2006, 63, 2575–2590. [Google Scholar] [CrossRef] [PubMed]
- Sugiyama, T.; Thompson, C.W. Older people’s health, outdoor activity and supportiveness of neighbourhood environments. Landsc. Urban Plan. 2007, 83, 168–175. [Google Scholar] [CrossRef]
- Windle, G.S.; Burholt, V.; Edwards, R.T. Housing related difficulties, housing tenure and variations in health status: Evidence from older people in Wales. Health Place. 2006, 12, 267–278. [Google Scholar] [CrossRef] [PubMed]
- Loo, B.P.; Mahendran, R.; Katagiri, K.; Lam, W.W. Walking, neighbourhood environment and quality of life among older people. Curr. Opin. Environ. Sustain. 2017, 25, 8–13. [Google Scholar] [CrossRef]
- Tzeng, G.H.; Huang, J.J. Multiple Attribute Decision Making: Methods and Applications; Taylor & Francis Group: Abingdon, OX, USA, 2011. [Google Scholar]
- Zhu, B.W.; Zhang, J.R.; Tzeng, G.H.; Huang, S.L.; Xiong, L. Public open space development for elderly people by using the danp-v model to establish continuous improvement strategies towards a sustainable and healthy aging society. Sustainability 2017, 9, 420. [Google Scholar] [CrossRef]
- Nomura, M.; Hiyama, K. A review: Natural ventilation performance of office buildings in Japan. Renew. Sustain. Energy Rev. 2017, 74, 746–754. [Google Scholar] [CrossRef]
- Sorgato, M.J.; Melo, A.P.; Lamberts, R. The effect of window opening ventilation control on residential building energy consumption. Energy Build. 2016, 133, 1–13. [Google Scholar] [CrossRef]
- Pirrera, S.; De Valck, E.; Cluydts, R. Nocturnal road traffic noise: A review on its assessment and consequences on sleep and health. Environ. Int. 2010, 36, 492–498. [Google Scholar] [CrossRef] [PubMed]
- Wei, W.; Ramalho, O.; Mandin, C. Indoor air quality requirements in green building certifications. Build. Environ. 2015, 92, 10–19. [Google Scholar] [CrossRef]
- Guo, W.; Liu, X.; Yuan, X. Study on Natural Ventilation Design Optimization Based on CFD Simulation for Green Buildings. Procedia Eng. 2015, 121, 573–581. [Google Scholar] [CrossRef]
- Ewen, H.H.; Washington, T.R.; Emerson, K.G.; Carswell, A.T.; Smith, M.L. Variation in Older Adult Characteristics by Residence Type and Use of Home-and Community-Based Services. Int. J. Environ. Res. Public Health 2017, 14, 330. [Google Scholar] [CrossRef] [PubMed]
Figure 1.
Housing environment improvement framework: Guidelines and objectives.
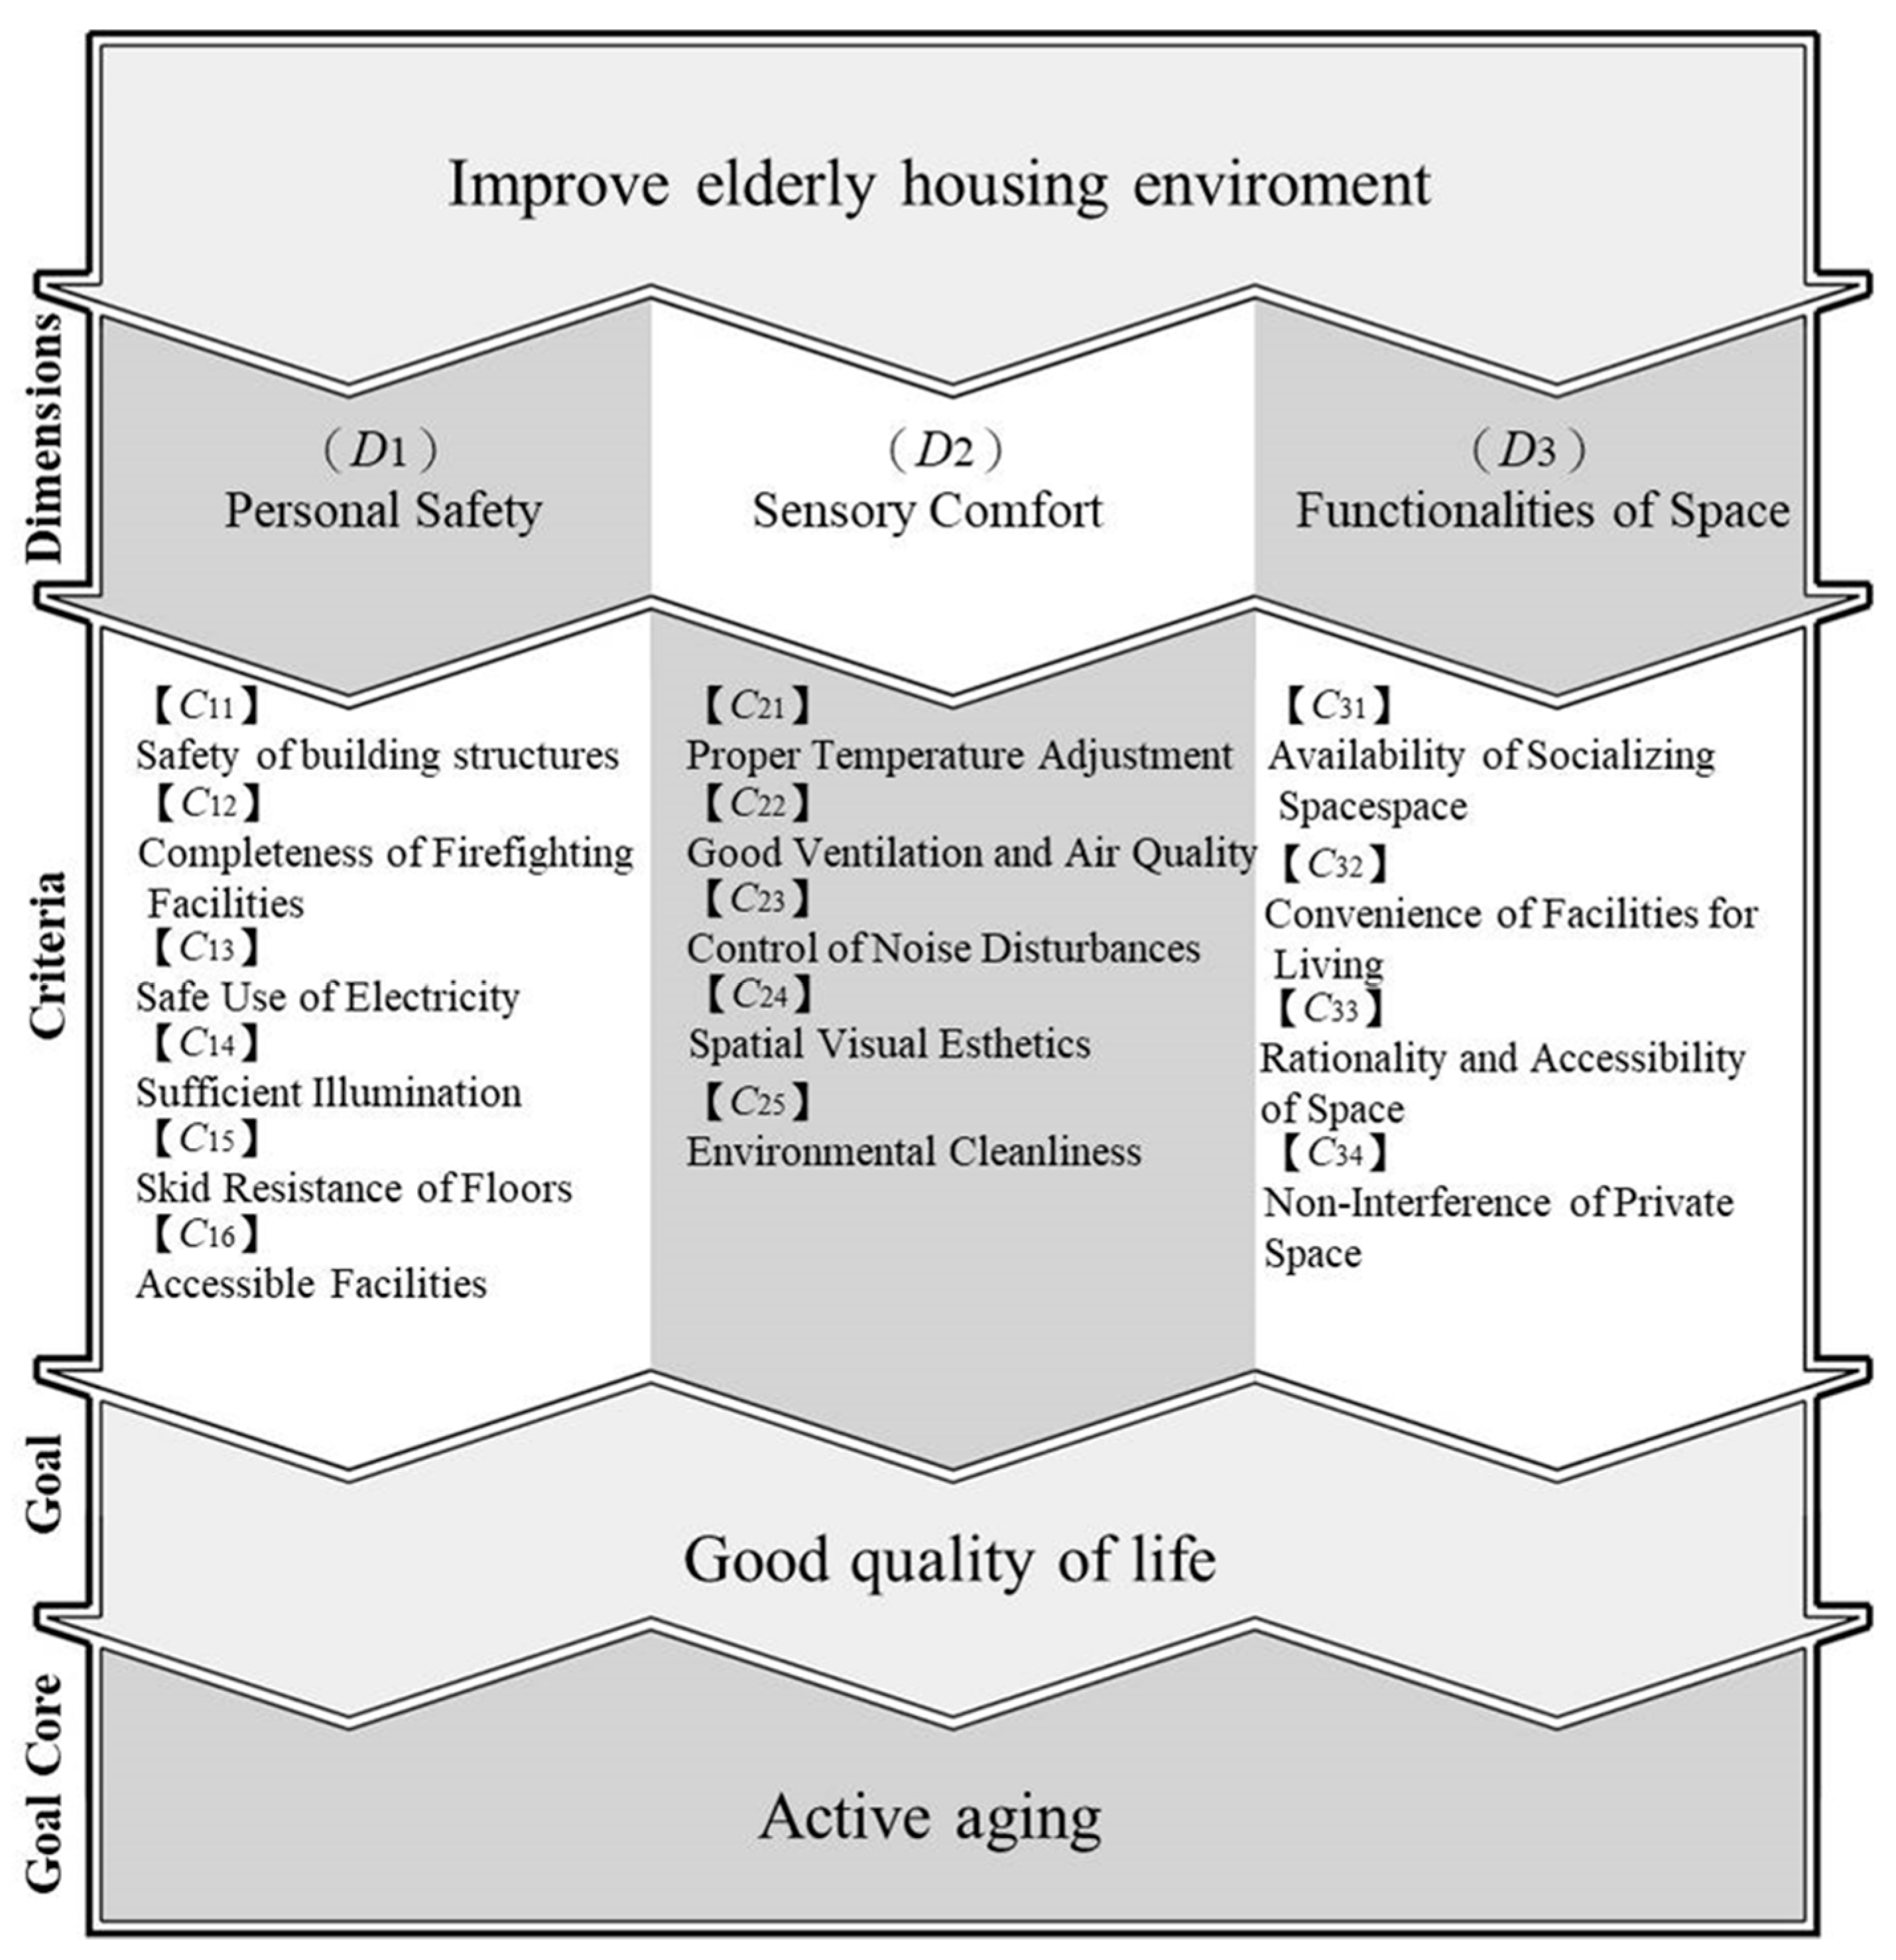
Figure 2.
Model procedure for new multiple criteria decision making for creating the best sustainable improvement strategies.
Figure 2.
Model procedure for new multiple criteria decision making for creating the best sustainable improvement strategies.

Figure 3.
Calculation Steps of the decision-making trial and evaluation laboratory (DEMATEL).
Figure 4.
Calculation Steps of DEMATEL-based analytic network process (DANP).

Figure 5.
Calculation Steps of Modified VIKOR.

Figure 6.
The INRM (influential network relation map) of total influence relationships.

Table 1.
Evaluation factors for the pretest.
| No. | Criteria | Descriptions | Authors |
|---|---|---|---|
| Ec1 | Safety of building structures | Examining the structural durability of the building and housing; the strength of doors, windows, and other relevant parts; the housing’s protection against natural disasters | [18,47] |
| Ec2 | Completeness of Firefighting Facilities | Installing and improving emergency response measures for fire accidents, such as firefighting facilities, alarm systems, evacuation instructions, and emergency lighting | [48] |
| Ec3 | Safe Use of Electricity | The biggest reasons for fire accidents are improper use of electrical appliances, electrical overload from excessive power use indoors, and damage and exposure of gas connections. | [47] |
| Ec4 | Sufficient Illumination | Sufficient indoor and outdoor lighting during day and night will not only provide a pleasant mood both emotionally and perceptively but also increases alertness and vigilance. | [49] |
| Ec5 | Skid Resistance of Floors | Wet and slippery floors are the most dangerous causes for falling, so flooring materials must be reconsidered in terms of their skid resistance. | [4,32,36] |
| Ec6 | Accessible Facilities | Apart from accessible, even flooring, safe and accessible facilities are also important to the elderly, for instance handrails with support features and railings. | [31,32,42,50] |
| En1 | Proper temperature adjustment | Heat refers to the perception of thermal comfort, which means the level of satisfaction in a warm environment, but it should also be interpreted as the level of satisfaction with indoor temperatures, where people can adjust the environmental temperature through their behavior. | [37] |
| En2 | Good Ventilation and Air Quality | Good ventilation provided in indoor environment and diluting or replacing the indoor air with fresh air is the key to cooperating good air quality indoors. | [44] |
| En3 | Control of Noise Disturbances | Environmental noise is regarded a major threat to public hygiene. The main sources of noise disturbance are from outdoors and not indoors and are mainly concentrated in environmental noises such as road traffic, neighbors, and airplanes. | [54,55,56] |
| En4 | Spatial Visual Esthetics | Pleasant, neat, and comfortable indoor environment is the main factor contributing to visual health. | [37] |
| En5 | Environmental Cleanliness | Unsatisfactory hygiene and cleanliness directly affects the health of the elderly. The improvement of housing environment is important for creating a hygienic and clean living environment for the elderly. | [36] |
| So1 | Availability of Socializing Space | The community and neighbourhood provide the elderly with the socializing opportunities and place to meet with others and socialize. Proper and suitable personal housing space can also be a good place for interactions and visits among neighbors. | [58,59] |
| So2 | Convenience of Facilities for Living | The most important purpose of the improvement measures for old housing is to solve the problems of the elderly, including them not being able to satisfy their functions of living, i.e., the elderly’s independence in their daily activities, and the convenience for them to carry out work and carry on personal behaviors. | [4,10,20,42,50,60] |
| So3 | Rationality and Accessibility of Space | Intervention measures for housing improvement can help realign space and eliminate impediments, for instance, furniture and decorations that impede walking and mobility. | [11,61] |
| So4 | Non-Interference of Private Space | Privacy signifies the power of determination over space and self-autonomy. The elderly care equally about their personal private space (e.g., bedrooms) and do not like external interference from outside, such as noise, while also not wishing to interfere with the outside space to preserve their own privacy. | [10,17] |
Table 2.
The performance evaluation of the case study using VIKOR.
| Wuchang United Building Community Housing | ||||
|---|---|---|---|---|
| Dimensions/Criteria | InfluentialWeights (IWs) | Performance | Unweighted (Gap) | Weighted (Gap) |
| (D1) Personal Safety | 0.280 | 7.071 | 0.293 | |
| (C11) Safety of Building Structures | 0.155 | 8.057 | 0.194 | 0.030 |
| (C12) Completeness of Firefighting Facilities | 0.134 | 4.143 | 0.586 | 0.079 |
| (C13) Safe Use of Electricity | 0.197 | 7.829 | 0.217 | 0.043 |
| (C14) Sufficient Illumination | 0.170 | 8.200 | 0.180 | 0.031 |
| (C15) Skid Resistance of Floors | 0.158 | 7.114 | 0.289 | 0.045 |
| (C16) Accessible Facilities | 0.185 | 6.486 | 0.351 | 0.065 |
| (D2) Sensory Comfort | 0.330 | 5.849 | 0.415 | |
| (C21) Proper Temperature Adjustment | 0.166 | 2.914 | 0.709 | 0.118 |
| (C22) Good Ventilation and Air Quality | 0.191 | 6.486 | 0.351 | 0.067 |
| (C23) Control of Noise Disturbances | 0.173 | 3.571 | 0.643 | 0.280 |
| (C24) Spatial Visual Esthetics | 0.244 | 7.257 | 0.274 | 0.111 |
| (C25) Environmental Cleanliness | 0.225 | 7.686 | 0.231 | 0.067 |
| (D3) Functionalities of Space | 0.390 | 7.372 | 0.263 | |
| (C31) Availability of Socializing Space | 0.286 | 6.571 | 0.343 | 0.098 |
| (C32) Convenience of Facilities for Living | 0.253 | 7.914 | 0.209 | 0.053 |
| (C33) Rationality and Accessibility of Space | 0.230 | 7.429 | 0.257 | 0.059 |
| (C34) Non-Interference of Private Space | 0.232 | 7.714 | 0.229 | 0.053 |
| Total Performance | 6.782 | |||
| Total Gap | 0.322 | |||
© 2018 by the authors. Licensee MDPI, Basel, Switzerland. This article is an open access article distributed under the terms and conditions of the Creative Commons Attribution (CC BY) license (http://creativecommons.org/licenses/by/4.0/).
Share and Cite
MDPI and ACS Style
Feng, I.-M.; Chen, J.-H.; Zhu, B.-W.; Xiong, L. Assessment of and Improvement Strategies for the Housing of Healthy Elderly: Improving Quality of Life. Sustainability 2018, 10, 722. https://doi.org/10.3390/su10030722
AMA Style
Feng I-M, Chen J-H, Zhu B-W, Xiong L. Assessment of and Improvement Strategies for the Housing of Healthy Elderly: Improving Quality of Life. Sustainability. 2018; 10(3):722. https://doi.org/10.3390/su10030722
Chicago/Turabian StyleFeng, I-Ming, Jun-Hong Chen, Bo-Wei Zhu, and Lei Xiong. 2018. "Assessment of and Improvement Strategies for the Housing of Healthy Elderly: Improving Quality of Life" Sustainability 10, no. 3: 722. https://doi.org/10.3390/su10030722
Note that from the first issue of 2016, this journal uses article numbers instead of page numbers. See further details here.