Comparison of Carbon-Use Efficiency Among Different Land-Use Patterns of the Temperate Steppe in the Northern China Pastoral Farming Ecotone

1
Key Laboratory of Land Surface Pattern and Simulation, Institute of Geographical Sciences and Natural Resources Research, Chinese Academy of Sciences, Beijing 100101, China
2
School of Geography, South China Normal University, Guangzhou 510631, China
*
Author to whom correspondence should be addressed.
Sustainability 2018, 10(2), 487; https://doi.org/10.3390/su10020487
Submission received: 3 January 2018
/
Revised: 7 February 2018
/
Accepted: 8 February 2018
/
Published: 12 February 2018
(This article belongs to the Section Sustainable Agriculture)
Abstract
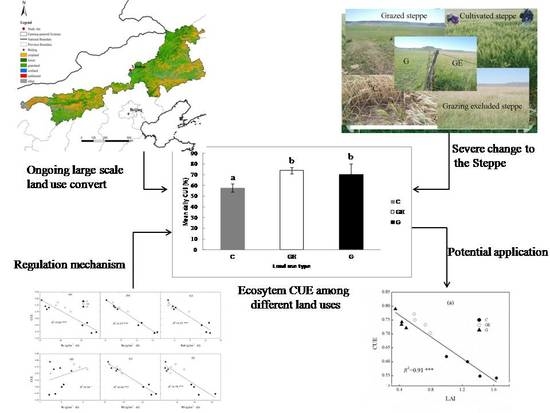
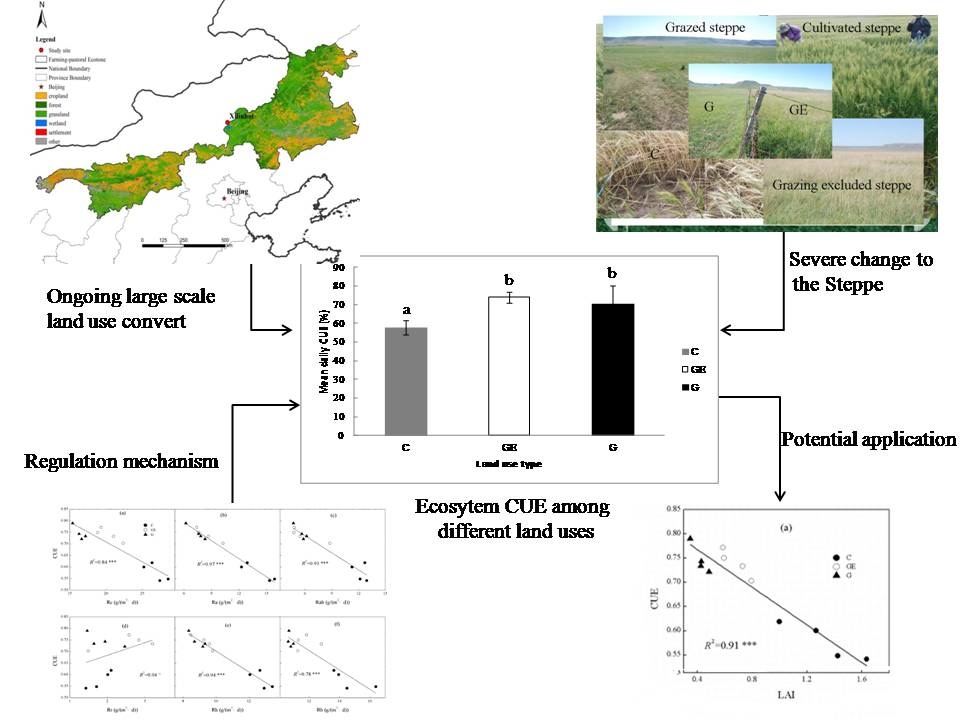
:Carbon-use efficiency (CUE) is the proportion of gross primary production converted to net primary production. Changes to CUE strongly influence ecosystem carbon budgets and turnover. Little is known about the response of ecosystem CUE to human-induced land-use change, which limits the accurate evaluation of the environmental influence of large-scale steppe-use changes in northern China. We investigated the components of ecosystem carbon exchange and CUE under three typical steppe-use patterns in Xilinhot, Inner Mongolia. The results showed that CUE in grazing and grazing-excluded steppe were not significantly different (both over 0.7) but were significantly higher than in cultivated steppe (0.57). Ecosystem respiration and its components, including autotrophic respiration (Ra), aboveground respiration, heterotrophic respiration and belowground respiration showed significant negative correlation with CUE. Ra is the most important factor explaining the variation of CUE between different steppe-use patterns (p < 0.001, 97%); Ra change may be the primary factor driving CUE variation between steppe-use patterns. Leaf area index of different grassland-use patterns also showed a significant negative correlation with CUE (p < 0.001, 91%). These findings may help to improve accurate prediction of the environmental and climatic consequences of large-scale land-use change.
1. Introduction
Human-induced, large-scale land-use and cover change may bring severe ecological and climatic consequences [1,2]. Regional water and energy balances, as well as ecosystem carbon budgets, have been shown to be significantly influenced by large-scale land-use change [3,4,5]. Balancing regional energy and carbon budgets concerns not only regional and global climate stability, but also the well-being of local residents and regional sustainable development. The pastoral farming ecotone of the temperate steppe in Inner Mongolia is a typical area with intense land-use and cover change in China. Naturally grazed steppe used to be the dominant land-use type in this area but is now being rapidly and extensively replaced by other land uses, particularly steppe cultivation and grazing exclusion [6]. In response to global climate change, the cultivation boundary in the Northern Hemisphere is moving gradually north [7,8,9,10]. Moreover, a large portion of the typical temperate steppe in central and eastern Inner Mongolia is situated in the pastoral farming ecotone in northern China, which is under increasing cultivation pressure driven by growing economic and food demand [11]. By 2000, the new cultivation area in the eastern Inner Mongolia steppe had surpassed 1000 km2 [11]. Moreover, the integrity and stability of ecological functions of this area are critically important, as the Inner Mongolia temperate steppe constitutes an important ecological protective barrier for most of the developed area of northern China. In particular, the area serves to protect Beijing from devastating sand storms. Arid and semi-arid ecosystems have also been shown to be easily damaged by overgrazing [12,13,14]. As a consequence, the government has invested great efforts in local ecological construction and restoration, and large areas of steppe in this region have been involved in related projects. By 2006, the grazing exclusion area implemented in the Beijing and Tianjing sand-source control project reached 66.93 × 10⁴ ha [15].
With an area of 3.55 × 10⁸ ha, steppe in China represents 41.7% of the national territory and 7.2% of the total area of steppe in the world, ranking second globally [16]. The biomass carbon pool of China steppe is 3.32 PgC, and the soil carbon pool also accumulates a considerable amount of carbon [17]. The potential large-scale land-use and cover change of the vast steppe in northern China may have major impacts on the budget of this huge carbon pool, which could have a correspondingly substantial impact on the regional environment, and even on the global climate [18,19].
The vegetation carbon-use efficiency (CUE) is the proportion of total primary production (GPP) fixed to net primary production (NPP) and can be used quantitatively to describe the ability of vegetation to fix atmospheric CO2 in the surface ecosystem [20]. The CUE of different vegetation is considered a constant value close to 0.5 [21,22]. However, it has been noted in studies that CUE varies widely from 0.23 to 0.83, even within forest ecosystems alone [20]. Understanding the mechanism of the regulation of CUE under different land-use and management patterns is essential to enhance understanding of the influence of human activities on the carbon budget of ecosystems. These key parameters and the relationships obtained would substantially help to increase the accuracy of related models.
The GPP is the sum of NPP and autotrophic respiration (Ra), while Ra together with heterotrophic respiration (Rh) comprise the ecosystem respiration (Re) [23]. Therefore, the key to measuring the ecosystem CUE accurately during experimental determinations is the accurate division of Re into Ra and Rh [24,25]. In addition, Re also can be roughly divided into two parts: belowground respiration (Rb) and aboveground respiration (Rab), according to the location in which the respiration takes place [26]. Based on the CUE definition and Re composition mentioned above, it likely that the Ra intensity and its proportion of Re play a critical role in ecosystem CUE regulation. Meanwhile, it has already been determined that the vegetation structure and characteristics, biomass and respiration and their composition are usually substantially changed under different management patterns [6,27]. However, it remains uncertain how and to what extent the grassland-use patterns changes would influence the regional ecosystems CUE in the North China steppes.
In this study, we focused on three typical land-use patterns (grazed steppe, grazing-excluded steppe, and steppe cultivated to cropland). These land uses represent those most extensively involved in land-use and management changes in the pastoral farming ecotone of the northern China temperate steppe. Based on previously applied treatments of clipping and vegetation removal, and the initiation of a novel treatment of herbicide application and control plots, we measured and calculated the refined carbon budget including several accurate components which were difficult to obtain in past measurements (e.g., Ra, Rh, Rab, Rb and Rr). Based on these subdivided ecosystem carbon-exchange components, we accurately calculated the ecosystem CUE under the three typical grassland-use patterns. All the three steppe uses were located adjacent to each other, and 12 observation days were distributed alternately among the different land uses (4 days per land use) to ensure comparable results. Furthermore, combined with the simultaneously observed plant community traits, we investigated the response of steppe ecosystem CUE to the changes of use and management of steppe, and explored the primary driving factors that could enhance our mechanistic understanding of ecosystem CUE regulation processes.
A deeper understanding of the ecosystem CUE and carbon exchanges regulated by land-use patterns would help to develop novel models to accurately predict the future regional carbon cycle under various land-use scenarios and assess their impact on climate. Such research is ultimately intended to help formulate scientific land-use policies in order to aid critical regions such as the pastoral farming ecotone mitigate and adapt to climate change by accurately managing the regional carbon budget with visionary land use and management, thereby supporting local residents in achieving sustainable development. To help achieve this aim, we addressed specifically the questions as follows: (1) In what way do the components of ecosystem CO2 exchanges respond to different use patterns of temperate steppe? (2) How does ecosystem CUE respond to the grassland-use pattern changes and what are the potential factors regulating these responses? (3) What are the primary factors and the relations between these factors? We tested the hypotheses that: (1) the ongoing large scale of land-use and management change would largely change the carbon budget of the steppe ecosystem; (2) the CUE among different land uses may be varied and influenced by the changed ecosystem respiration and its components; (3) the ecosystem CUE changing with land uses may be correlated with their leaf-area index, due to the underlying relation between respiration and leaf-area index.
2. Materials and Methods
2.1. Study Area
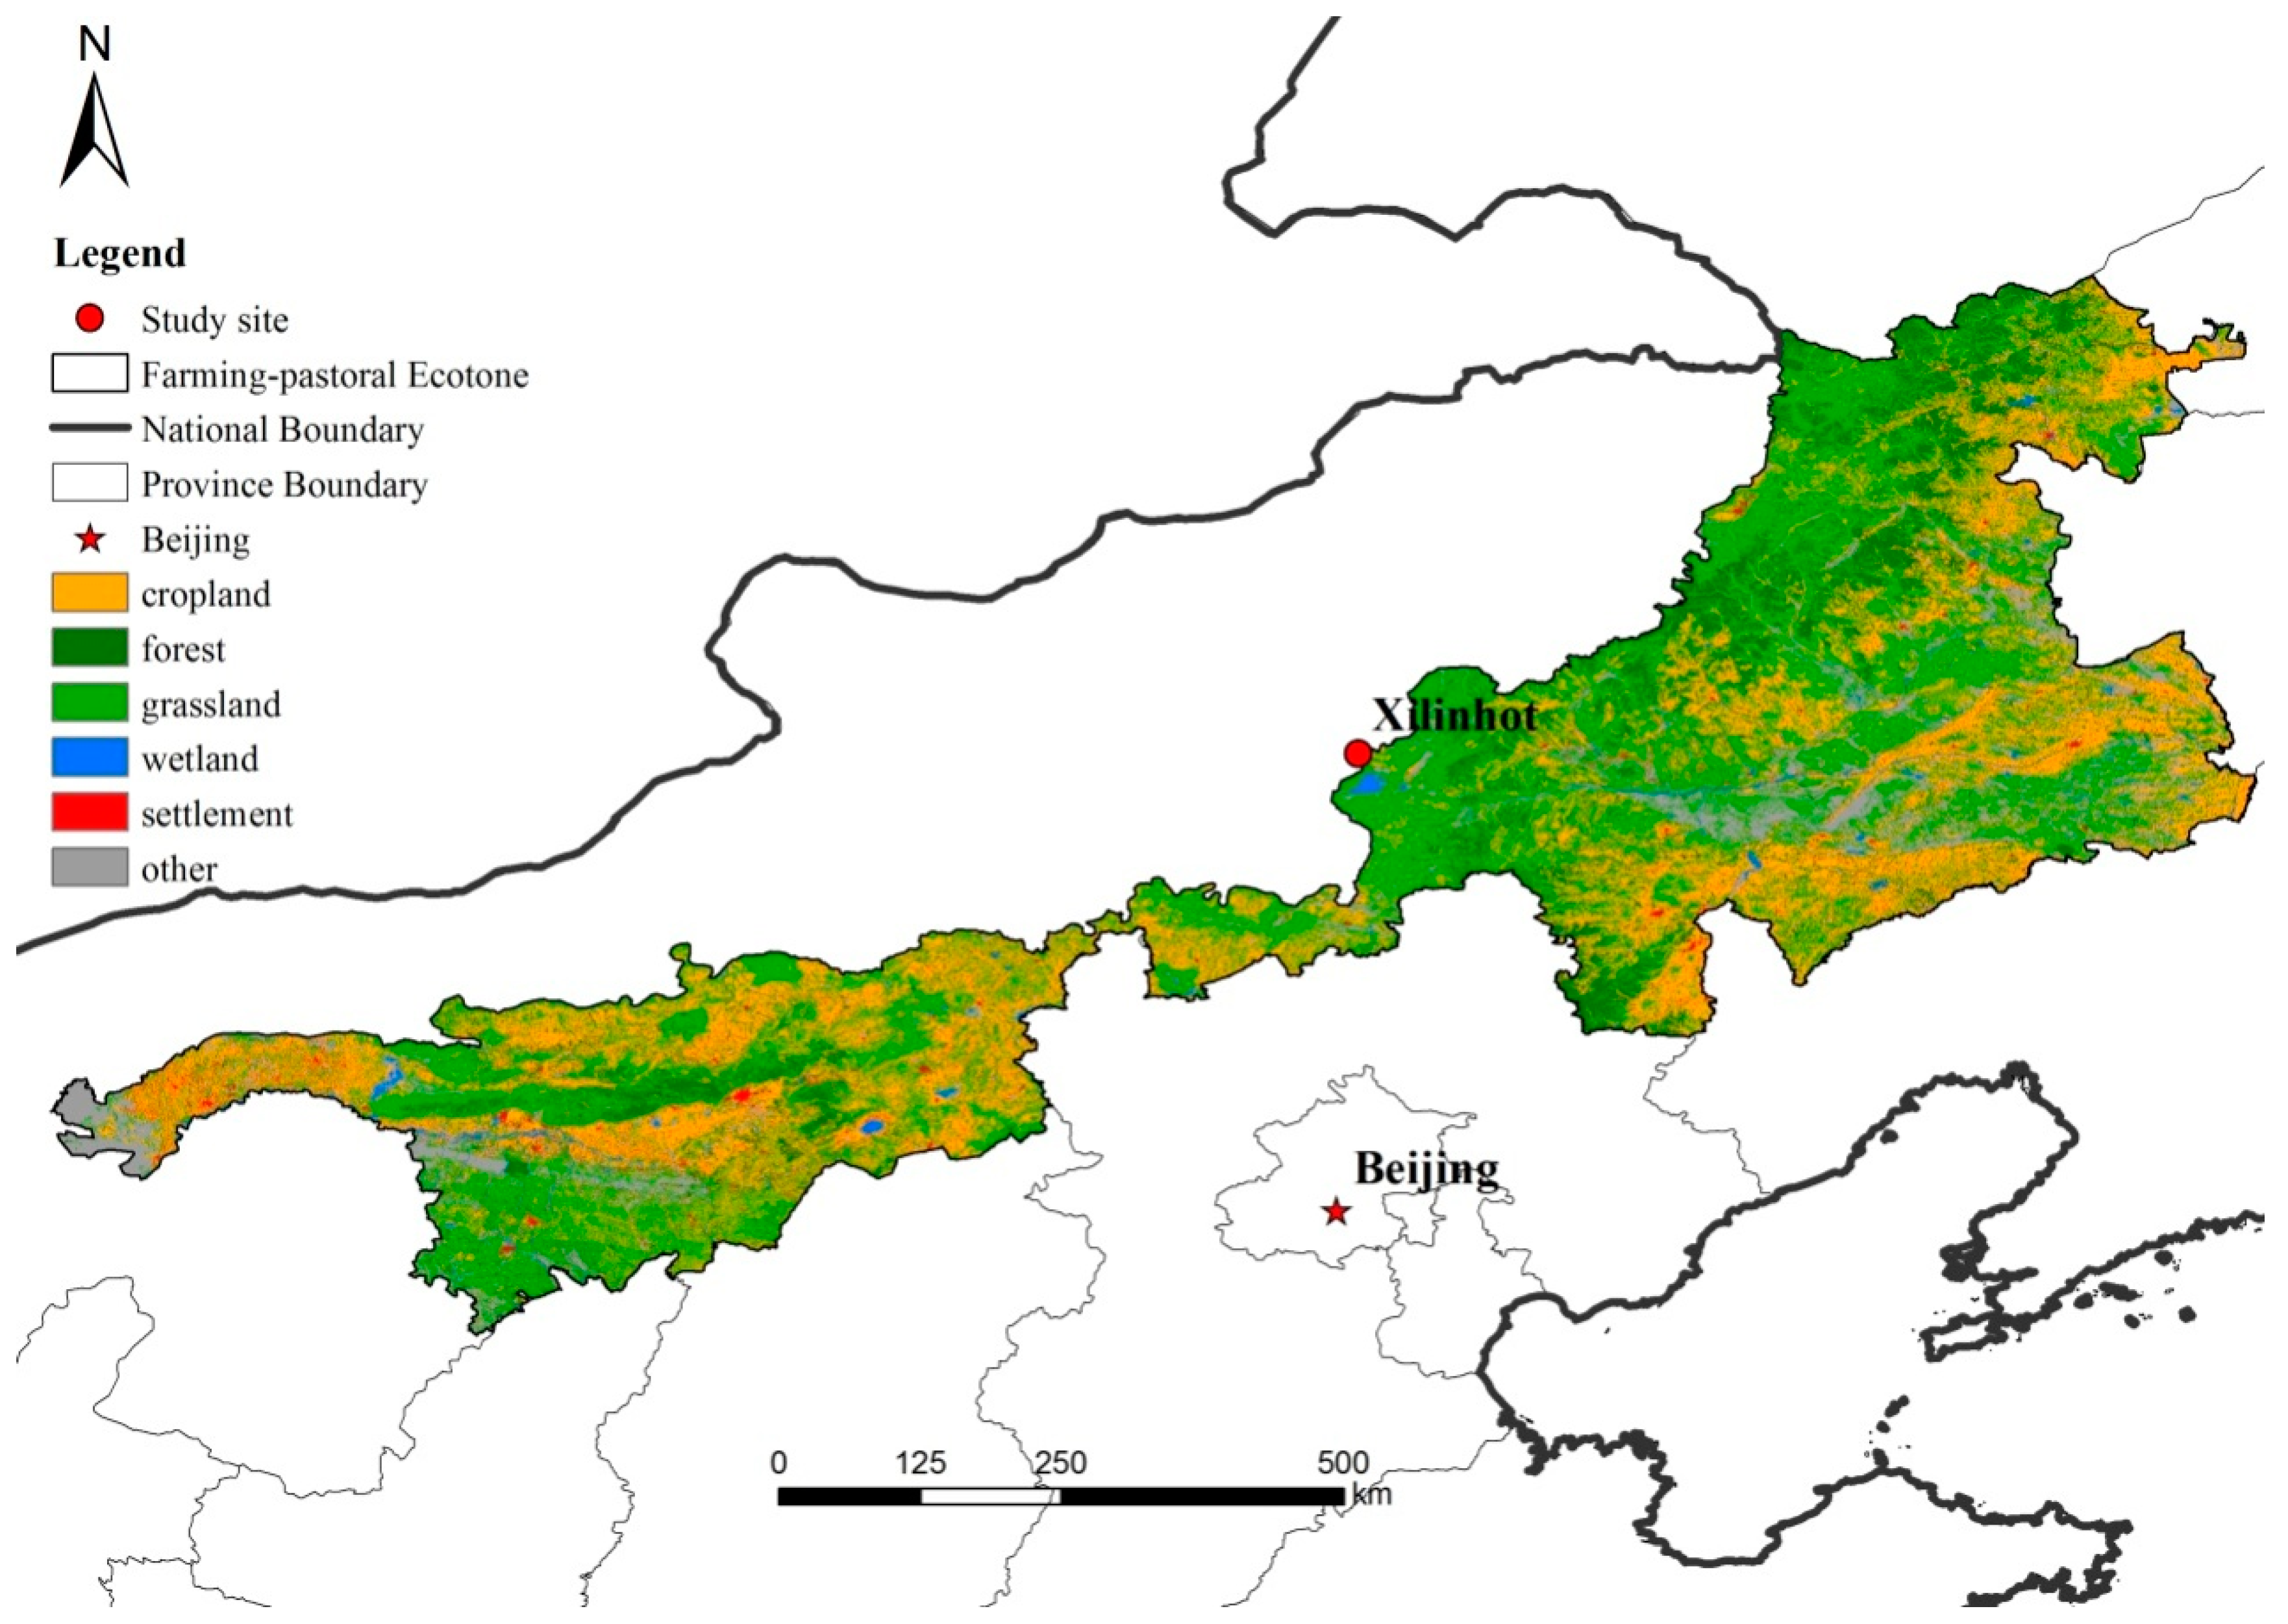
The study was conducted on typical Stipa grandis-dominant temperate steppe (43°32′24.06′′ N, 116°33′41.76′′ E, elevation 1250 m) at Xilinhot, Inner Mongolia, northern China (Figure 1). Based on local climate data (1982–2004), the average annual temperature is 0.6 °C, and the mean daily temperature is −18.5 °C in the coldest month (January) and 21.5 °C in the warmest month (July). Mean annual precipitation is 350 mm, mainly falling in June and August, coinciding with the main growth period. The peak growing month (August) in the steppe area is the second warmest month of the year. The accumulated precipitation in this period was 80.6 mm, and this value contributed more than one fourth of the annual precipitation.
Soils of the study site are divided into chestnut or chernozem soil, according to the UN Food and Agriculture Organization (FAO) classification. In Xilinhot, which is located at the northern edge of the Chinese pastoral farming ecotone, grazing is the primary land-use pattern [27,28]. There are also two alternative land uses of the steppe in the region: grazing-exclusion steppe and steppe reclaimed to cropland. The Hunshandake desert, located to the south of Xilinhot, is believed to be an important sand source for sandstorms affecting Beijing. In order to improve environmental conditions in Beijing, the central government of China launched an array of grassland restoration projects to reduce and even forbid/abolish grazing in the Xilinhot region to curb sandstorms [15]. In these areas, grazing-exclusion is the most widely applied practice. To the contrary, as the local environment is considered to be suitable for cropping in some areas of the region, cultivation of the steppe is practiced for crop production with economic considerations.
Three different land-use patterns which were located adjacent were selected for the study: grazed steppe (G), grazing-excluded steppe (GE), and steppe cultivated to cropland (C). Of these, G is a typical type of steppe that has been grazed by sheep and horses for over 20 years, and GE is steppe in which grazing has been forbidden since 1979, resulting in a a large amount of litter remains on the ground. For C, its original land use and community structure were similar to G until 5 years before the study, when the land was cultivated for wheat cropping. No irrigation was applied to the cropped area. Organic manure was applied before the crop was planted, and 240 kg ha−1 inorganic fertilizer (N 110 kg ha−1, P2O5 70 kg ha−1, K2O 60 kg ha−1) was applied in two applications during crop growth.
2.2. Experimental Design
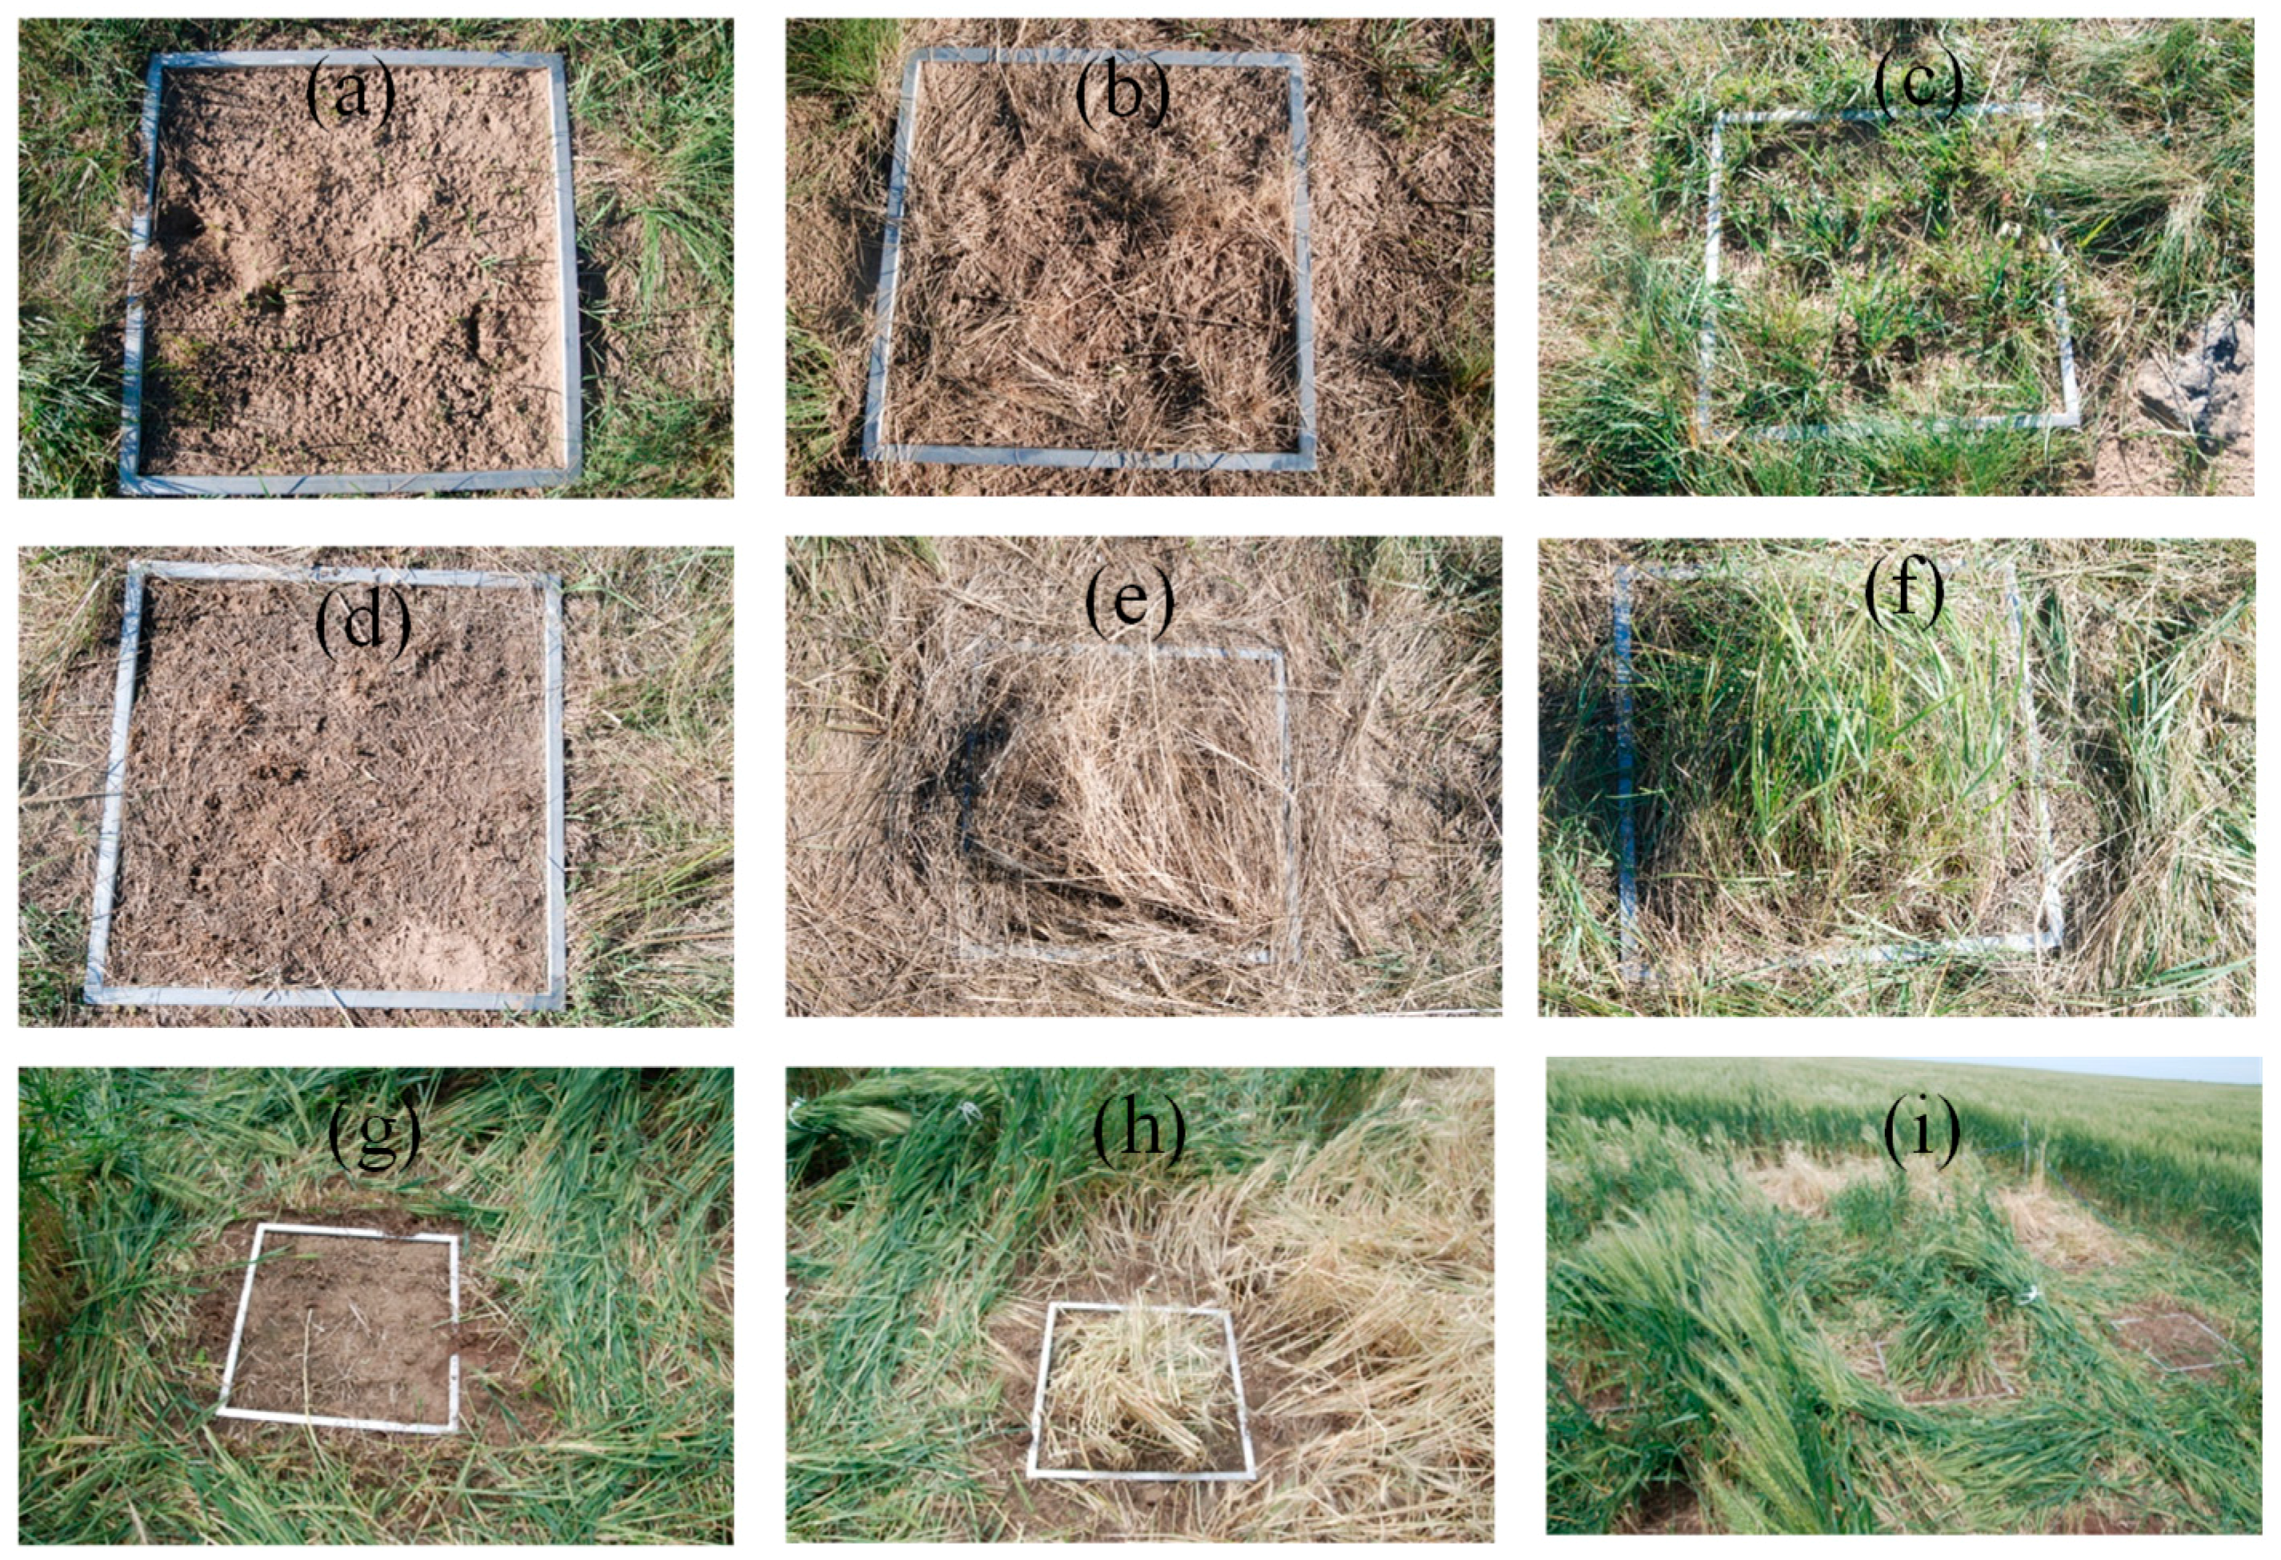
A randomized block design was applied with a scale of 48 plots in total. Every land-use pattern included four replicate blocks (3.5 m × 3.5 m, 5 m space between blocks). In each block, four 1 m × 1 m plots were randomly arranged with a space of 1.5 m between them. One plot (DS) in every block was selected randomly, and herbicide (41% glyphosate, diluted 150 times with water) was applied two weeks prior to the observation period. All the plants in the plot fell within two days and the canopy of this treatment remained standing and dry during the observation period. The aboveground tissue of another plot (CL) in each block was removed by clipping according to the procedure used in previous studies [27,29]. The third plot was the control plot (CK), to which no treatment was applied. Destructive sampling was applied to the fourth plot to determine the community features of the block, including aboveground and belowground biomass, leaf-area index (LAI), and soil properties. Figure 2 shows the different treatments in the plots of all three land-use patterns.
2.3. Community Characteristics and Composition of Biomass
Percentage cover of each species and the entire vegetation cover were visually estimated in the destructive sampling plots of each block with a 1 m × 1 m gridded quadrat frame. Afterwards, the aboveground tissue of each species in every destructive sampling plot was clipped to ground level and the living fraction was separated. Litter was collected with no regard to species. The 0–30 cm belowground biomass was collected with the root-drill method, which has been described in previous research [30]. Leaves were selected and their area was determined with a planimeter (LI-3000, Li-Cor, Lincoln, NE, USA) before measuring the aboveground biomass. All the aboveground biomass (leaves and non-leaf parts) and belowground biomass were dried in an oven at 70 °C for 48 h, and weighed.
2.4. Flux Measurements
Two weeks before the observations, a square metal base rim (50 cm × 50 cm in area, 10 cm in height with 3 cm left aboveground) was set up in each observed plot (CK, CL and DS) to measure the components of ecosystem CO2 exchanges, which are essential for calculating ecosystem CUE. The carbon exchange rates were measured using a cubic chamber (50 cm × 50 cm × 50 cm) attached to an infrared gas analyzer (LI-6400, LiCor, Lincoln, NE, USA). Two small fans were attached inside, at the top of the chamber, for air mixing during the measurements. Two temperature probes were used: one was inserted into the chamber to record the air temperature (AT), and the other one into the surrounding earth to the depth of 5 cm to record the soil temperature (ST). A portable soil-moisture device (TDR100, Spectrum, Plainfield, IL, USA) was introduced to record the soil-moisture (SM) content (0–10 cm) simultaneously. During the measurements, the transparent chamber was set on the metal base rim and two rings of seal pads were installed on the bottom edge of the chamber to prevent gas leakage. When measurements commenced, 30 consecutive recordings of CO2 concentrations were taken for each chamber at 1 s intervals for 30 s. The CO2 fluxes were calculated from the time series of changing concentrations.
In the DS treatment plots, all roots were killed using glyphosate; this kind of herbicide can be transported from leaf tissues to the whole plant [30,31], enabling the Rh to be directly determined for these plots. In contrast, in CL treatments, the roots would remain alive for some time [26] and the directly determined CO2 exchanges were considered as belowground respiration (Rb), including Rh, root respiration, and soil animal respiration. The net ecosystem exchange (NEE) was determined in the CK plots. The calculation procedure in the LI-6400 manual (LiCor Inc., Lincoln, NE, USA, 2004) gives detailed instructions for these static chamber flux calculations. Following the measurement of NEE in the CK treatment plots, the chamber was vented, replaced on each frame, and covered with a piece of opaque cloth. The CO2 exchange measurements were repeated, excluding light (therefore no photosynthesis), so as to obtain values representing Re. The difference between NEE and Re was considered to represent instantaneous gross ecosystem productivity (GEP) for the ecosystem in previous research [32].
Measurements were conducted on clear sunny days when standing live grassland biomass reached its peak (August). The observations were conducted continuously throughout the daytime at 1 h intervals. Observations were conducted on all the four blocks of each land-use pattern for 12 days and, therefore, there were 4 replicate days for every land-use pattern. The observation days were distributed alternatively among different ecosystems to ensure the comparability of data measured in similar weather conditions. As mentioned above, NEE, Re, Rh and Rb were directly determined in plots using standard methods [26,29].
In our study, GEP was calculated with the sum of NEE and Re:
where GEP is the gross ecosystem productivity, Re is the respiration of the ecosystem, and NEE represents the net ecosystem exchange.
GEP = −Re + NEE
Moreover, Re is the sum of Rab and Rb in vertical spatial sources. Alternatively, Re could be divided into the Ra and the Rh components to differentiate autotrophic and heterotrophic respiration sources. Since we directly determined Rb and Rh, we calculated Rab and Ra as follows:
where Rab is the aboveground respiration, Rb is the belowground respiration, Ra is the autotrophic respiration, and Rh is the heterotrophic respiration.
Rab = Re − Rb
Ra = Re − Rh
The belowground respiration represents the total soil microbial, plant root and soil animal respiration. Since the respiration contribution of soil animals is generally considered to be low [33,34], we regard the gap between Rb and Rh as root respiration (Rr):
Rr = Rb − Rh
Daily net ecosystem exchange (gC) and its components were accumulated from the above data as follows:
where Fc is the CO2 exchange rate (μmol m−2 s−1). For NEE and GEP, a positive Fc represents ecosystem carbon uptake; whereas, for Re, Ra, Rh, Rab, Rb and Rr, positive Fc represents ecosystem carbon release.
2.5. Ecosystem CUE
The CUE, defined as the ratio of NPP to GPP, describes the capacity of vegetation to transfer carbon from the atmosphere to terrestrial biomass:
where CUE represents the ecosystem carbon-use efficiency, GPP is the gross primary productivity.
CUE = NPP/GPP
Since in short temporal scales there was little difference between GEP and GPP, and to better and more easily demonstrate the ratio of the amount of carbon allocated for growth to actual ecosystem carbon uptake, we applied GPP instead of GEP. We used the calculation of ecosystem CUE as follows:
where GPP is the net primary productivity.
CUE = NPP/GEP
Daily CUE was calculated with the daily carbon exchange accumulations, which were obtained from daily flux rates.
2.6. Data Analysis
One-way analysis of variance (ANOVA) with Tukey’s honest significant difference (HSD) test was used to determine the differences of the microclimates of the ecosystem and community and soil features of the three land uses. The paired t-test was used to make a comparison of the diurnal dynamics of ecosystem carbon exchanges in the different land-use patterns. One-way ANOVA with Tukey’s HSD test analyzed the average daily accumulated CO2 exchanges, as well as the ecosystem CUE of the land-use patterns. Linear regression analysis was used to assess the relationships between the Re components and CUE, as well as between LAI and CUE or the Re components. All the statistical analyses were conducted using SPSS 12.0 (SPSS Inc., Chicago, IL, USA).
3. Results
3.1. Photosynthetic and Carbon-Uptake Characteristics
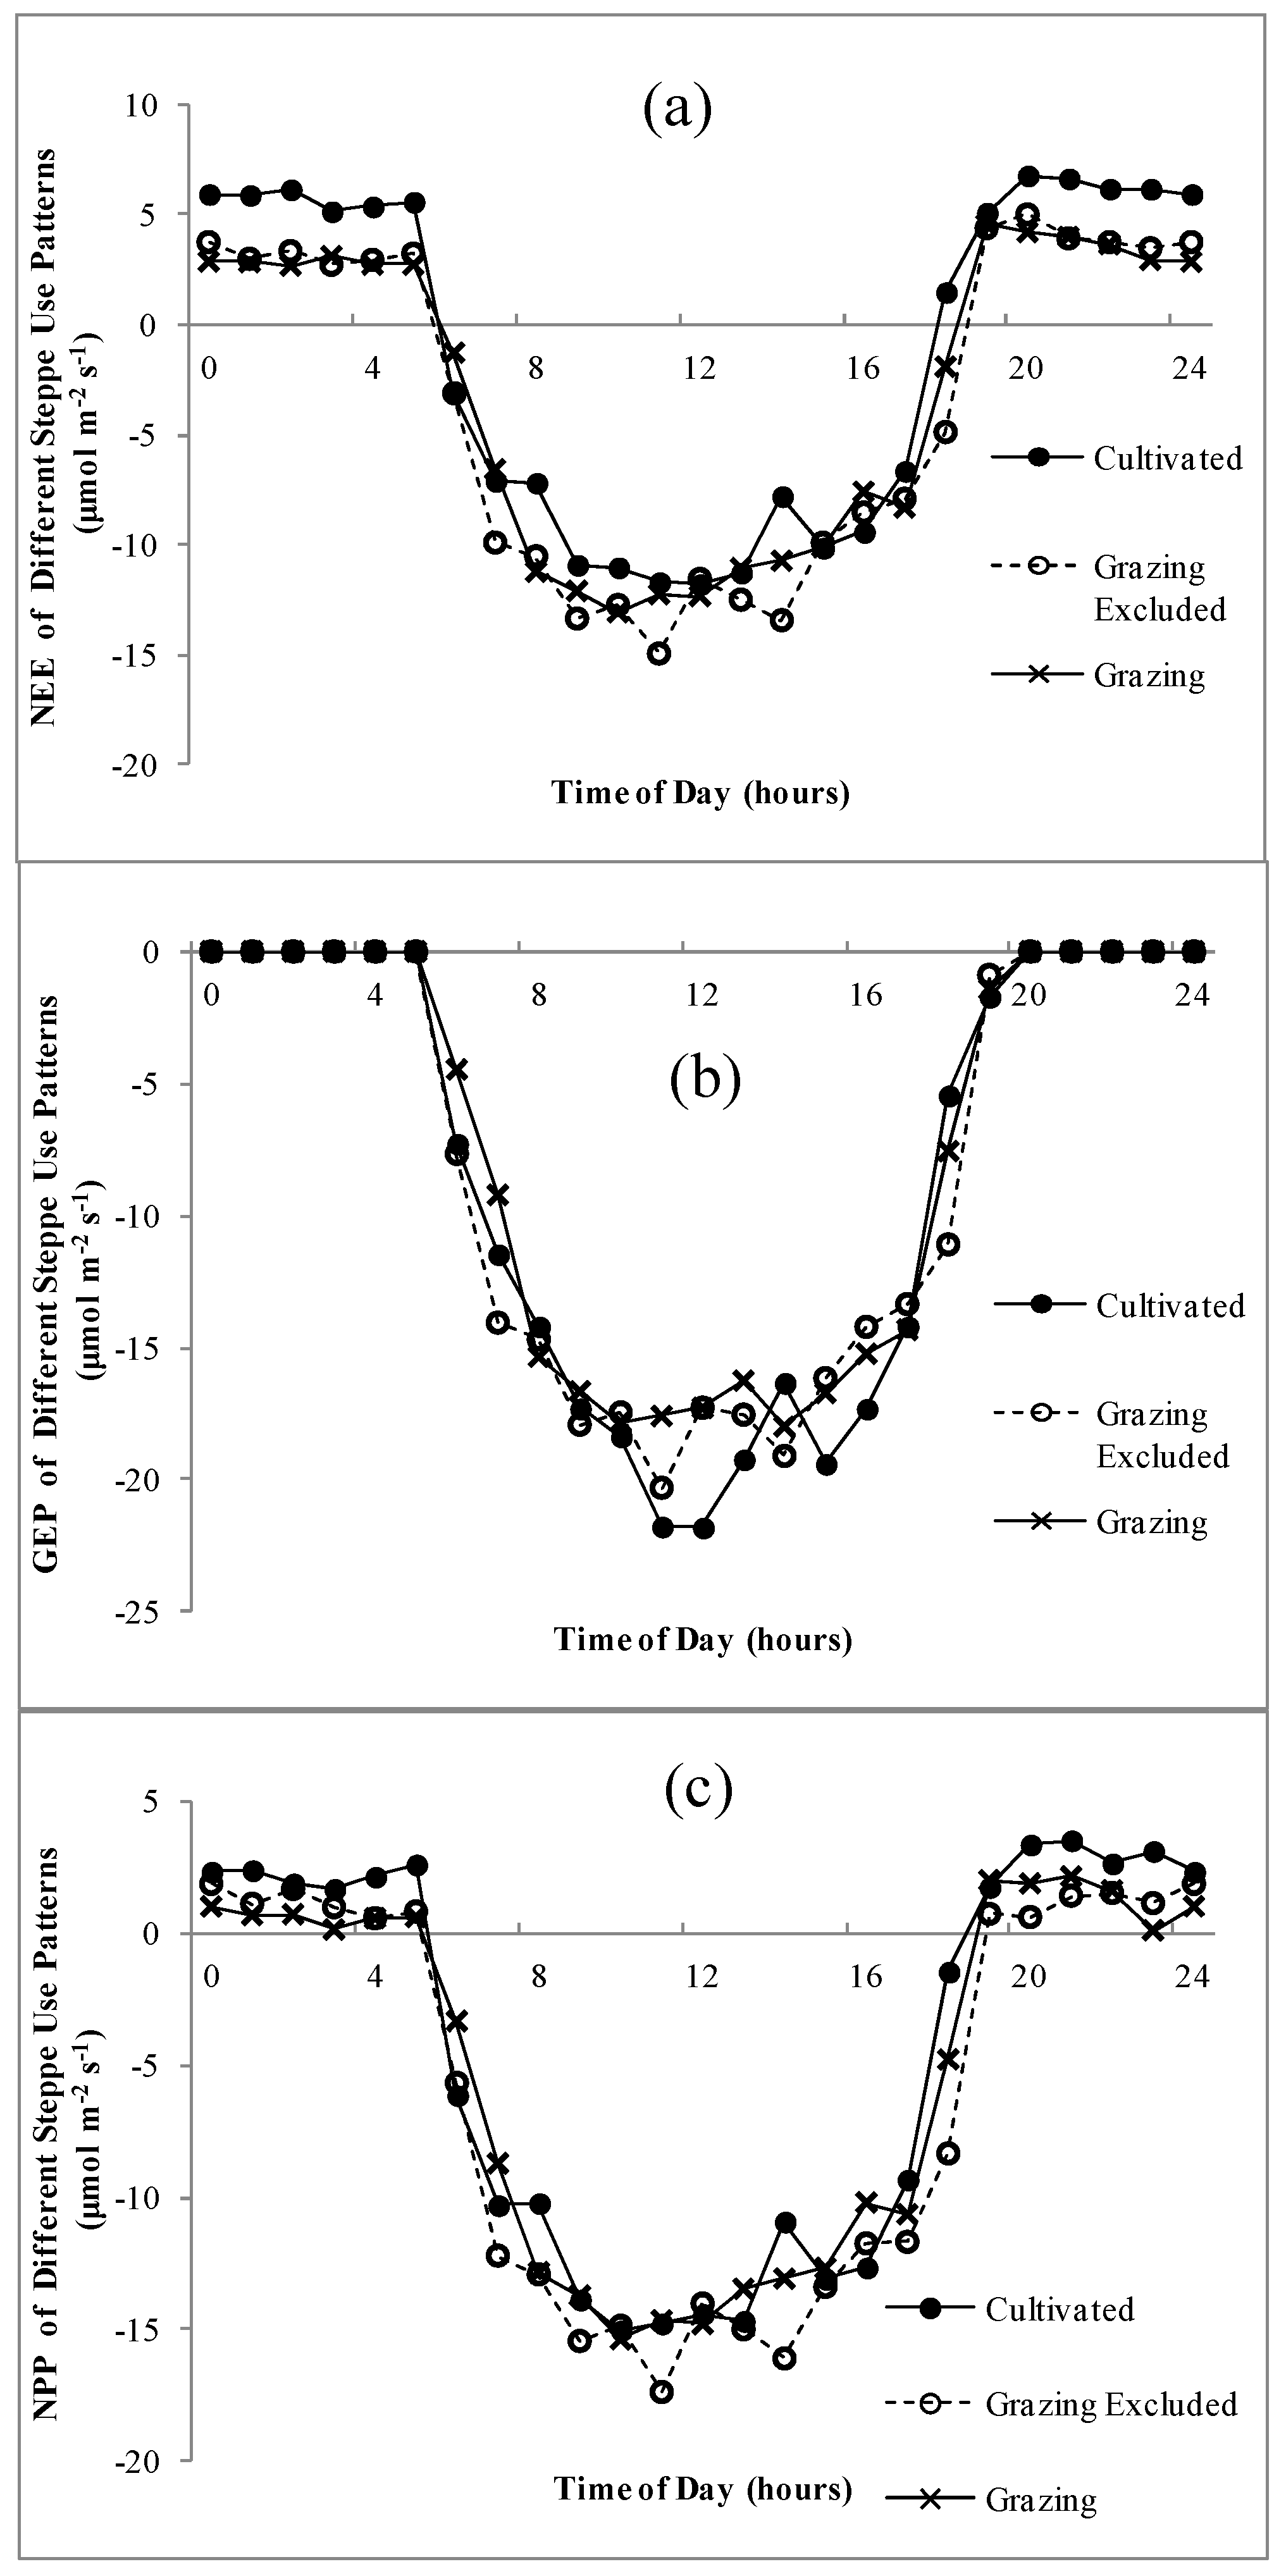
The diurnal dynamics of NEE, GEP and NPP were similar and sharp “u” curves were predominant for all land uses (Figure 3). The ecosystem NEE of the three use patterns showed little difference in daytime, whereas during the night, the NEE of the cultivated ecosystem was significantly higher than that of grazed steppe and grazing-excluded steppe (Figure 3a). The GEP showed a noon break under three different uses between 12:00 and 1:00 and the GEP peak before noon was slightly higher than that in the afternoon (Figure 3b). The noon break was most evident in the cultivated land-use treatment.
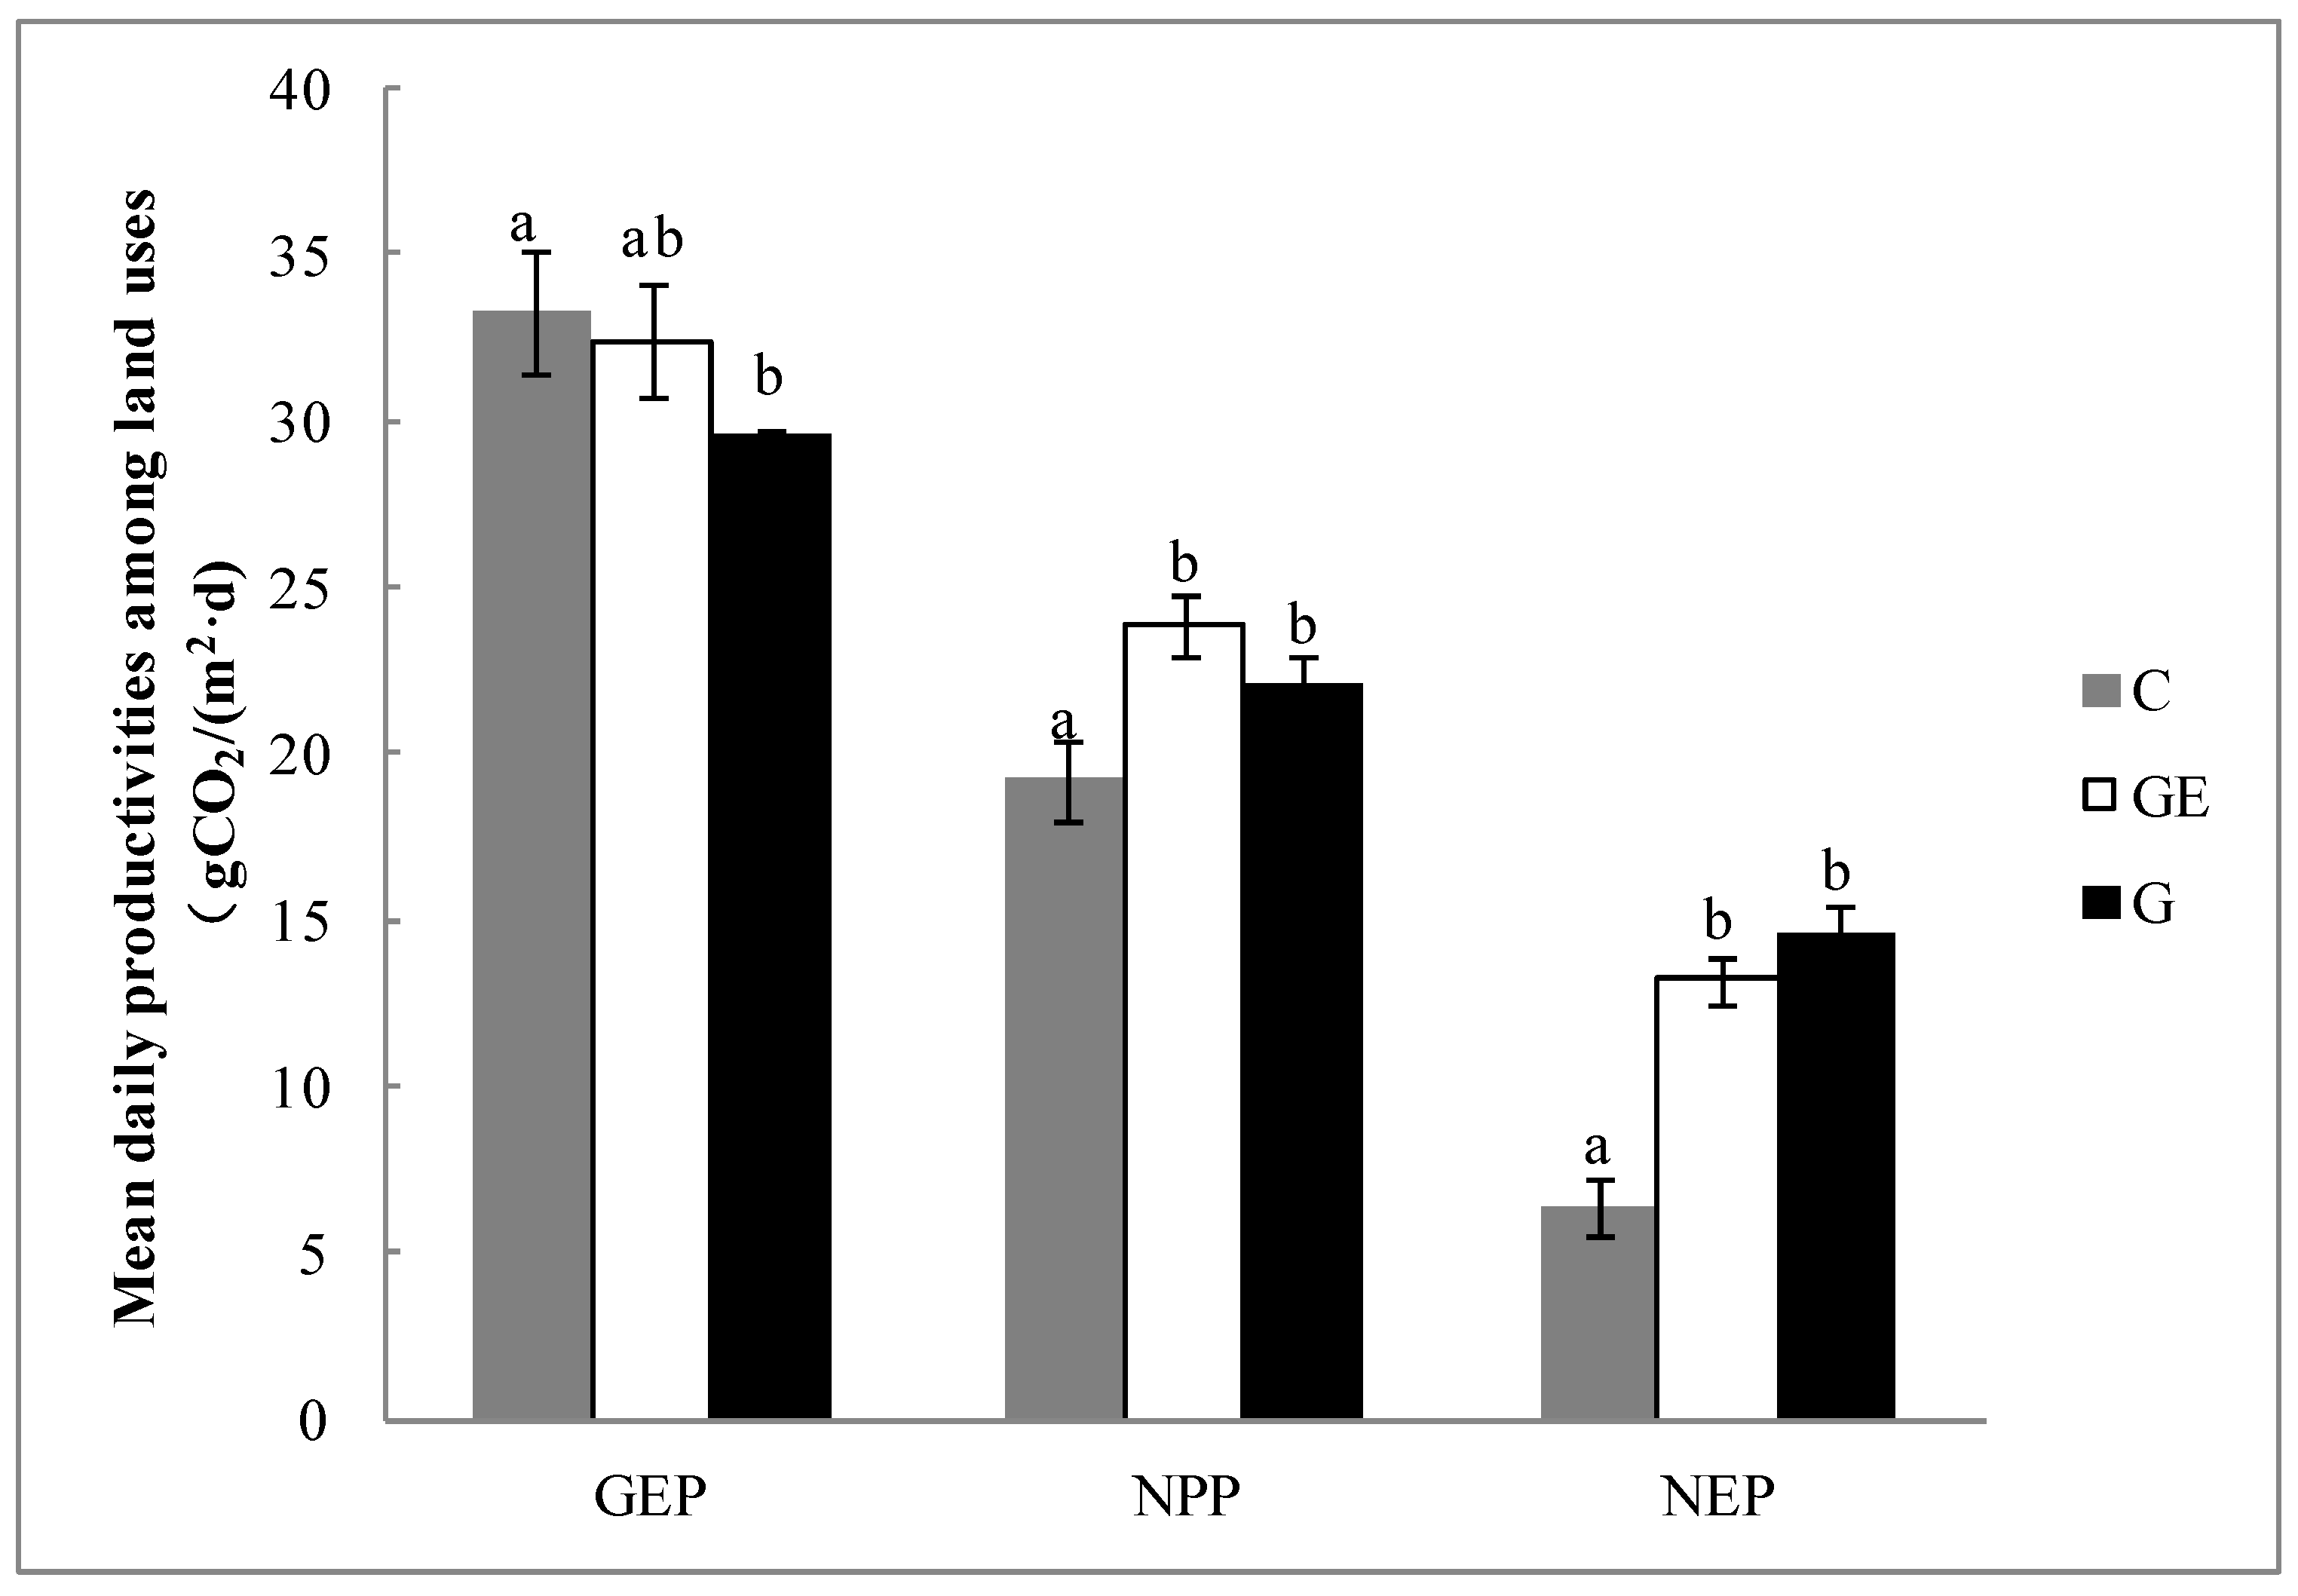
The accumulated daily GEP of the three use patterns of steppe varied between approximately 30−35 g CO2 m−2 d−1. In comparison with the grazing steppe, the cropping and grazing-excluded steppes tended to increase GEP; in particular, the cropping significantly increased by 12.7% (Figure 4, p < 0.05). However, cropping also significantly decreased the ecosystem NPP compared with grazed steppe by 13.0% (Figure 4, p < 0.05). There was no significant difference between the grazing-excluded steppe and the grazed steppe (Figure 4, p > 0.05). The impact of steppe-use patterns on net ecosystem productivity (NEP) was similar to that on NPP; cultivated steppe was significantly lower than grazing and grazing-excluded steppe (Figure 4, p < 0.05). The 51.2% decrease of NEP on the cultivated steppe was larger than the decrease of NPP (19.7%).
3.2. Ecosystem Respiration and Its Components
The ecosystem respiration in our study turned out to be a single-peak curve, which peaked between 13:00–16:00 depending on the different land uses of the steppe. The difference of Re between grazed and grazing-excluded steppes was not significant, but they were both significantly lower than the cultivated steppe in every hour (Figure 5a). The Re was divided into Ra and Rh, Rab and Rb according to the different division methods. The Ra of the cultivated steppe, which peaked at 12:00, was substantially higher than that of the grazed and grazing-excluded steppes, which peaked at 14:00 (Figure 5c). The daily variation of the Rh was relatively even, and the difference of Rh between the three use patterns was less distinct than that of Ra (Figure 5d). In addition, the aboveground and belowground respiration of the cultivated steppe was both higher than that of grazed and grazing-excluded steppes (Figure 5e,f). Moreover, the maximum root respiration was occurred in the cultivated steppe at 13:00, reaching 2 μmol m−2 s−1).
The Re of the grazed steppe and the grazing-excluded steppe, both at approximately 17 g CO2 m−2 d−1, was not significantly different (p > 0.05), while Re of the cultivated steppe reached 26.9 g CO2 m−2 d−1, with a significant increase by 64.3% (p < 0.05) relative to the grazed steppe (Figure 6). The Ra of the grazed steppe and the grazing-excluded steppe, both at approximately 8 g CO2 m−2 d−1, were not significantly different (p > 0.05). However, Ra of the cultivated steppe reached 14.1 g CO2 m−2 d−1, which was a significant increase by 88.8% (p < 0.05) relative to the grazed steppe. The Rh of the grazed steppe and the grazing-excluded steppe, both at approximately 9 g CO2 m−2 d−1, were not significantly different (p > 0.05). However, Rh of the cultivated steppe reached 12.8 g CO2 m−2 d−1, which was a significant increase by 43.7% (p < 0.05) in comparison with the grazed steppe. The difference in Rab between the grazed steppe and the grazing-excluded steppe was not significant (p > 0.05), whereas Rab of the cultivated steppe was twice that of the grazed steppe (p < 0.05). The Rb of the grazed steppe and the grazing-excluded steppe, both at approximately 11 g CO2 m−2 d−1, were not significantly different; however, Rb of the cultivated steppe increased to 14.6 g CO2 m−2 d−1, which was a significant increase by 35.6% (p < 0.05) relative to the grazed steppe. The Rr of the three grassland-use patterns, all at approximately 2 g CO2 m−2 d−1, were not significantly different between treatments (p > 0.05).
3.3. Carbon-Use Efficiency (CUE) among Steppe-Use Patterns
Following the changes to the photosynthetic and respiration processes, the ecosystem showed a different CUE under different steppe-use patterns. The ratio of CUE was lowest on the cultivated steppe (57.7%), which was significantly lower (Figure 7, p < 0.05) than the grazed steppe (70.6%) and the grazing-excluded steppe (73.9%). It was decreased 18.2% (p < 0.05) relative to the grazed steppe. Compared with the grazed steppe, the grazing exclusion of steppe tended to increase the ecosystem CUE (1.0%), but the difference between the two patterns was not significant (p > 0.05).
3.4. Correlations of CUE and Re Components
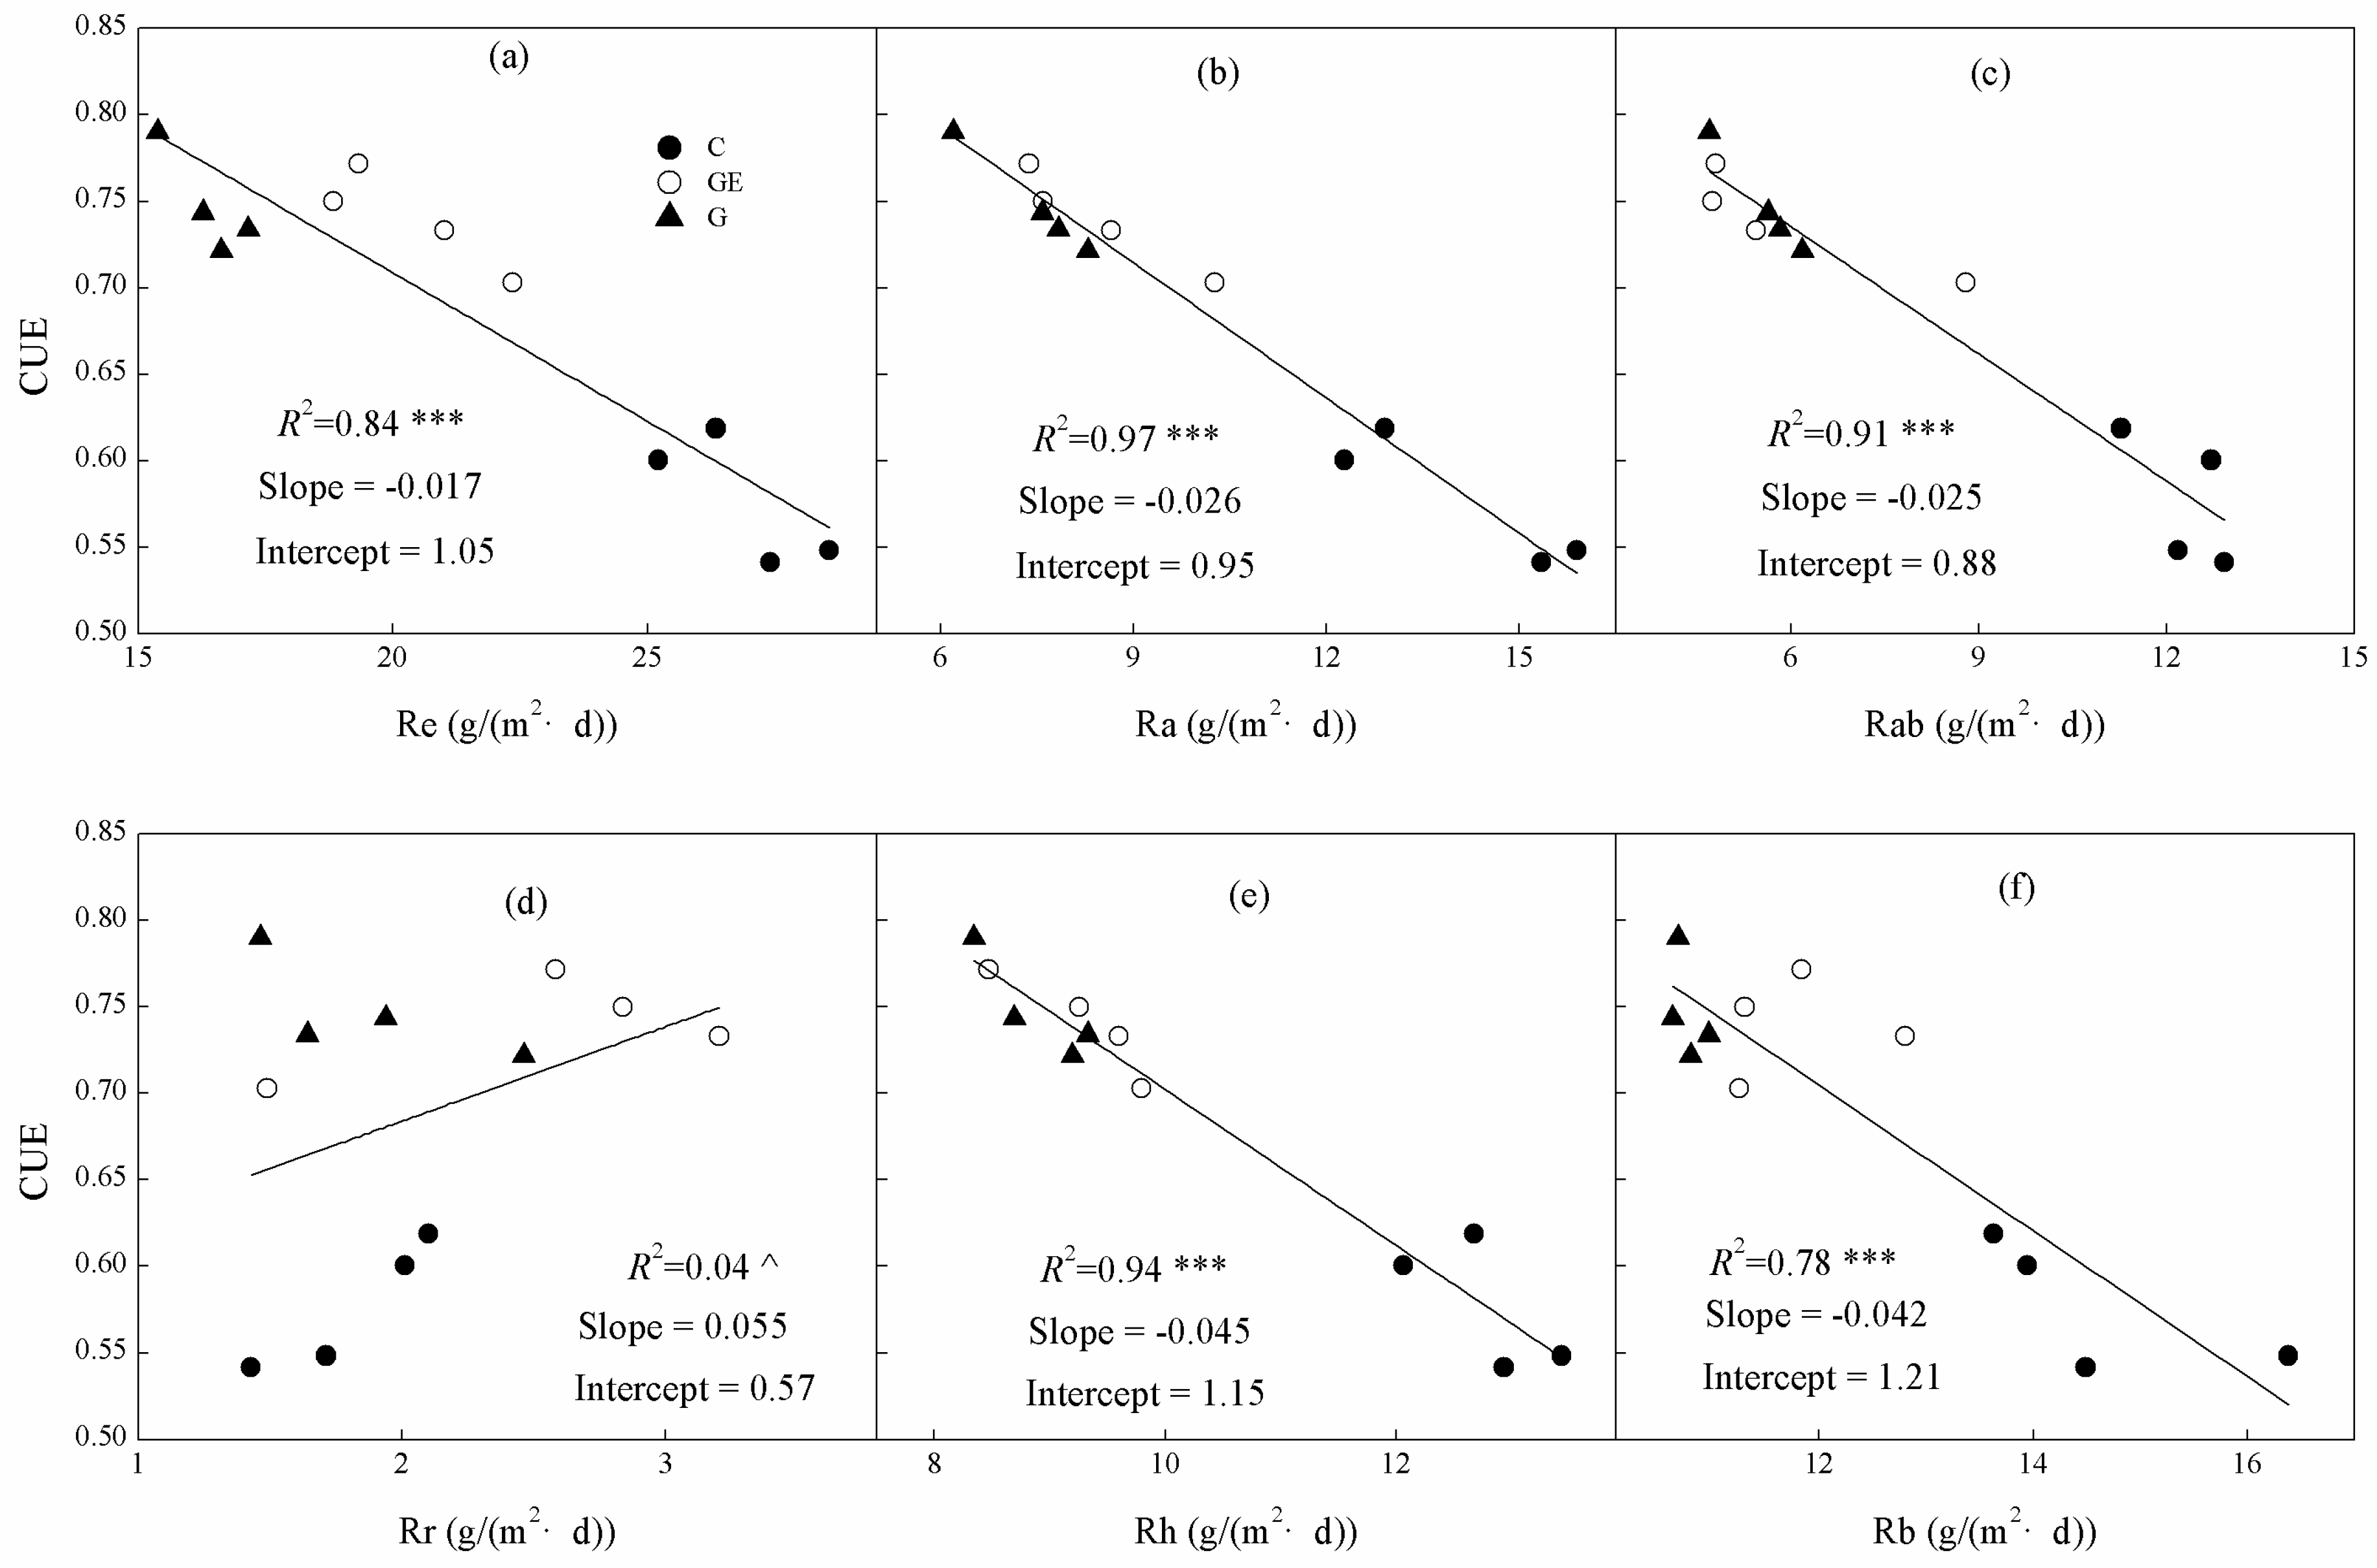
Linear correlations between the components of mean daily Re and mean daily ecosystem CUE were significant for Re (Figure 8a) and almost all the components of Re (Ra, Rh, Rab and Rb, p < 0.001), but the smallest component was not significantly related to CUE (Figure 8d, p > 0.05). Additionally, among all the components of Re, the variation of Ra explained 97% in CUE variation between different steppe land uses, higher than all other components and Re itself (Figure 8a, 84%). Similarly, the Rab could explain 94% of the CUE variation. These two components could explain the CUE variation better than Rh (91%), and substantially more than Rb (78%). The Re division method of Ra and Rh could better explain the CUE variation among the different land uses than the Re division method of Rab and Rb.
3.5. Correlations of CUE, Re Components and Leaf-Area Index (LAI)
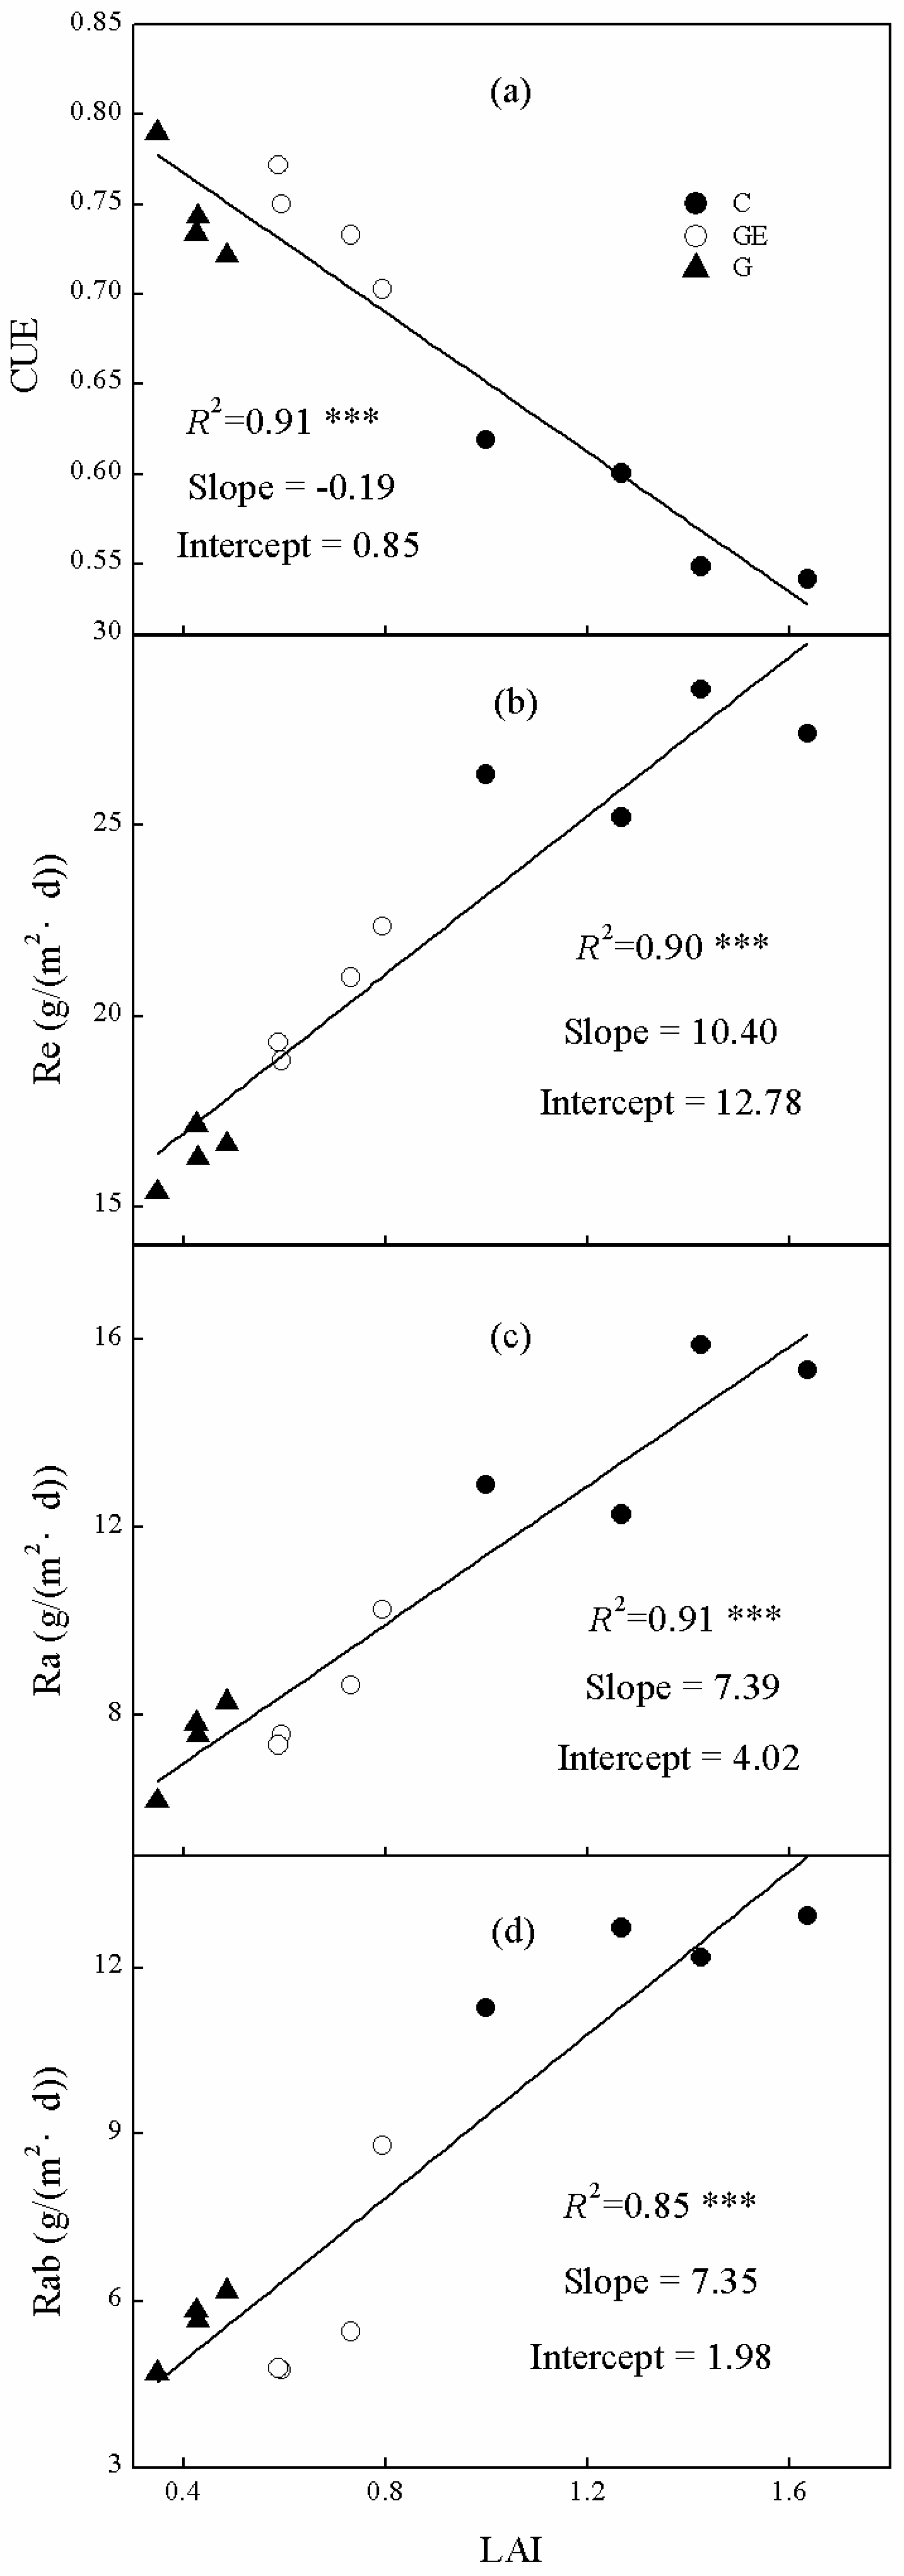
Ecosystem CUE, Re and Ra and Rab were all significantly linearly correlated with community LAI (Figure 9). However, the trends differed as Re, Ra and Rab were all positively related to LAI (Figure 9b–d), whereas the trend for CUE was negative (Figure 9a). The LAI explained 91% of the changes of ecosystem CUE (Figure 9a). Furthermore, changes of LAI also explained 91% of the Ra variation among steppe land uses (Figure 9c), which was higher than that of Re (Figure 9c, 90%). Additionally, LAI showed a positive linear relationship with Rab (Figure 9d), and explained 85% of its variation.
4. Discussion
4.1. Effect of Different Land-Use Patterns on Ecosystem CUE
Previous research has shown that the ecosystem CUE varies from 0.23 to 0.83, with an average CUE of 0.53 among 60 different vegetation types [20,35], most of which were forest. For the three land-use patterns in our study, the lowest CUE occurred in cultivated steppe (0.57) and the highest was the grazing-excluded steppe (0.74), which were within the range of previous studies, but were higher than average. We suggest that the CUE of steppe ecosystems, although under different management patterns, is typically higher than forest ecosystems, which may be attributed to their lower proportion of non-photosynthetic biomass [36]. The non-photosynthetic tissues of plant increased the ratio of respiration to gross production [21], which would finally decrease the CUE. It was previously believed that the CUE of different vegetation types varied around 0.5 [20]; however, in recent years, with the development and accumulation of observation data of ecosystem fluxes, numerous results have indicated that CUE varies considerably among different ecosystems [20,36]. Nevertheless, models developed in the late 20th century were based on the presumption that the ecosystem CUE was a relatively stable value around 0.4–0.6, resulting in the inconsistence between modeled and observed CUE [37].
There was no significant difference between the CUE of Stipa grandis-dominant ecosystems (grazed steppe, 0.70 and grazing-excluded steppe, 0.74), while both of them are significantly higher than the wheat-dominant ecosystem (cultivated steppe, 0.57, Figure 7). These results verified the following two assumptions proposed in previous studies. First, Delucia et al. [17] showed that ecosystem CUE in forests is influenced by the biomass allocation difference among different vegetation types. The ecosystems with higher biomass proportion in leaves would have a higher CUE than ecosystems with a greater belowground biomass or other non-photosynthetic proportion. Previous findings also indicated that Stipa grandis-dominant steppe had a higher biomass proportion in leaves [12,16]. Moreover, Reichstein et al. [36,37] indicated that, compared with traditional biome differences, the differences of plant traits may better explain ecosystem functional variations, including CUE. In our study, the land-use pattern change in natural steppe was its transformation to domesticated crops, substantially altering community composition and plant traits, and consequently influencing the inherent ecosystem CUE and potential other key ecosystem functional characteristics [38]. Thus, we confirmed that the changes of ecosystem species composition and, especially, dominant plant inherent traits caused by human land-use or management patterns could have a major influence on ecosystem functional properties, and such large-scale land-use and management change may influence regional or even global carbon balance and climate [39,40].
4.2. Underlying Mechanism Explaining the Effects of Land-Use Pattern on Ecosystem CUE
The relationships between CUE and biological or non-biological environmental factors have been extensively studied at various temporal and spatial scales. Previous research has already promoted deep understanding of how artificial experimental temperature increases change the ecosystem CUE by influencing soil organic carbon release [24,34,36]. Also, using an experimental approach, Metcalfe et al. [41] studied the influence of drought on CUE, which suggested that severe drought restrained the respiration of plants and soil microbial of ecosystems, causing the decrease of Re, and finally decreased the ecosystem CUE. This finding indicated that the CUE decrease of the ecosystem was caused by a water shortage. These studies have already promoted the construction of more accurate models, which has helped to advance the discussion and prediction of the influence of climate change on ecosystem CUE and the carbon budget in different future scenarios. However, it remains difficult to summarize the influence of community plant functional type and biome type change on CUE [42,43], as traditional vegetation type variations are barely correlated with their different CUE at large spatial scale. This situation suggests that we may achieve novel findings from different vegetation categories [44], such as land-management and -use patterns. In our study, we also focused on the environmental factors that influenced ecosystem CUE and the regulation mechanisms. With reference to Metcalfe et al. [41] on the influence of drought on CUE, and other research on the influence of microbial biomass, diversity or forest age on CUE, it has generally been indicated that the Re variation correlates with CUE change [34,36,45]. This helps us to focus on revealing the process governing the influence of Re on CUE, and analyzing how the relationship between Re composition changes with CUE variation under different steppe land-use patterns.
Our results indicated that, even though the GPP of grazed and grazing-excluded ecosystems showed no significant difference (Figure 4), CUE and NPP significantly varied between the two ecosystems (Figure 4 and Figure 7). This phenomenon may be attributed to the significant gap of respiration between grazed and grazing-excluded ecosystems (Figure 6), which suggests that a substantial change of respiration may be the key influence on ecosystem CUE, correspondingly causing a severe impact on carbon fixation and productivity [23,46,47]. The linear regression analysis between CUE and Re or the Re components also supported this assumption, since our results showed that Re and its components (Ra, Rab, Rb and Rh) were extremely significantly correlated with CUE (Figure 8, p < 0.001). The change of Re explained 84% of CUE change, which is consistent with previous studies [34,36]. It is more noteworthy that the changes of Ra were able to explain a large proportion (97%) of the variation of ecosystem CUE (Figure 8b). This may be because NPP represents the remainder after Ra is consumed from GPP, while ecosystem CUE is the ratio between NPP and GPP. Consequently, the accurate estimation of Ra and its change should inherently be highly related to the change of CUE. According to our results, the variation of ecosystem CUE may be primarily influenced by the change of the Ra consumption of plants themselves. The high correlation of Rab to CUE (91%, Figure 8c) was assumed to rely on the Ra regulation mechanism mentioned above, as in steppe ecosystems, Rab was the major part of Ra and the intensity (Figure 6) and proportion of Rr to Ra [24,48] were both low. Though Rh and Rb were both significantly correlated with CUE (Figure 8e,f), we contend that this correlation is not a universal phenomenon. This is because we surmised the stronger Rh and Rb in grazing-excluded steppe and cultivated steppe had different causes. The higher Rh and Rb of long-term grazing-excluded steppe might come from the long-term accumulation of litter and soil organic carbon, and similar results have been previously observed [45,49]. The high level of microbe activity and Rh of cultivated area in our research could be attributed to the application of large amounts of farm manure (approximately 240 kg ha−1). Therefore, the correlation between Rh and Rb and CUE in our case might be occasional. The root respiration, as a component of Ra and Re, showed no significant correlation with CUE (Figure 8d). Previous studies have rarely considered Rr, because it is a very small proportion of Re and is hard to accurately determine [24,50]. Similarly, we did not find a comparable conclusion on the relation between Rr and CUE. This insignificant correlation result may be attributed to the low proportion of Rr in Re and Ra, at around 6% to 20% respectively. Therefore, the mild variation of Rr could not change Ra and Re sufficiently to have a notable impact on ecosystem CUE.
The change of respiration and its components mechanically explained variation of CUE under different land-use patterns. These impacts on CUE would further regulate the carbon budget and vegetation productivity of the ecosystems [51]. Moreover, a significant negative relationship existed between the LAI variation among land uses and CUE (Figure 9a, p < 0.001). The LAI is a major explanatory factor for CUE changes under different land uses of steppe (91%, Figure 9a). Although it was slightly lower than Ra (Figure 8b, 97%), LAI still explained more of the CUE variation than Re (Figure 8a, 84%), whereas previous research has mostly focused on the contribution of Re [20,24,52]. The relation between LAI and productivity has been proven repeatedly and applied in biomass modeling with remote-sensing data [53,54]. In addition, the positive relationship between productivity or biomass with Ra in ecosystems has been widely reported [55]. Consequently, higher LAI is commonly related to a higher productivity and biomass level, a higher Ra level, and the strong negative relationship between Ra and CUE (Figure 8b). This series of associated correlations could mechanistically explain the significant negative relationship between LAI and CUE. Our further analysis indicated that LAI was significantly positively correlated with Re, Ra and Rab (Figure 8, p < 0.001) and the LAI change explained more than 90% of the variation of Re and Ra among different steppe uses. This suggests that the negative relationship between LAI and ecosystem CUE may be a general rule in the situation of land use-induced vegetation-cover change. However, it should be realized that this regulation may only be applied to specific situations (e.g., land-use change of steppe) or varied vegetation in adjacent areas. As with the conclusion of Reichstein et al. [39], we suggest that consistent relations between varied vegetation types and their ecosystem functional traits may rarely exist across distant regions or across a traditional vegetation biome. The regulatory mechanism and our understanding of how land use and management influence ecosystem CUE must be examined over a greater range of ecosystems. This will improve the simulation of the CUE change with different land-use scenarios, thus promoting the accurate prediction and modeling of the variation of carbon budget and productivity caused by potential land-use change. Thereby, through scientific management of land use, sustainable land-use plans could be applied to optimize the regional carbon budget, which would contribute to the adaptation to and mitigation of climate change.
Acknowledgments
We thank Jiyuan Liu and Quanqin Shao for their discussion and helpful suggestions on the early version of the manuscript. This research was jointly funded by the National Key R&D Program of China (grant no. 2017YFA0604801) and Natural Sciences Foundation of China (41601615). In addition, the authors thank Fan Yang for his help in improving the quality of the figures. The authors are grateful to the anonymous reviewers and editor for their insightful and helpful comments to improve the manuscript.
Author Contributions
Y.L. analyzed data and wrote the article. Y.L. and Z.H. conducted the measurements. J.F. designed the study.
Conflicts of Interest
The authors declare that there are no conflicts of interest regarding the publication of this paper.
References
- Intergovernmental Panel on Climate Change (IPCC). Climate Change 2013: The Physical Science Basis. In Contribution of Working Group I to the Fourth Assessment Report of the Intergovernmental Panel on Climate Change; Solomon, S., Qin, D., Manning, M., Chen, Z., Marquis, M., Averyt, K.B., Tignor, M., Miller, H.L., Eds.; Cambridge University Press: Cambridge, UK; New York, NY, USA, 2013. [Google Scholar]
- Change, I.C. The Physical Science Basis. Working Group I Contribution to the Fifth Assessment Report of the Intergovernmental Panel on Climate Change; Cambridge University Press: Cambridge, UK; New York, NY, USA, 2013. [Google Scholar]
- Novara, A.; Gristina, L.; Sala, G.; Galati, A.; Crescimanno, M.; Cerdà, A.; Badalamenti, E.; Mantia, T.L. Agricultural land abandonment in Mediterranean environment provides ecosystem services via soil carbon sequestration. Sci. Total Environ. 2017, 576, 420–429. [Google Scholar] [CrossRef] [PubMed]
- Yanai, A.M.; Nogueira, E.M.; Pm, D.A.G.; Fearnside, P.M. Deforestation and Carbon Stock Loss in Brazil’s Amazonian Settlements. Environ. Manag. 2016, 59, 1–17. [Google Scholar] [CrossRef] [PubMed]
- Sun, J.; Twine, T.E.; Hill, J.; Noe, R.; Shi, J.; Li, M. Effects of Land Use Change for Crops on Water and Carbon Budgets in the Midwest USA. Sustainability 2017, 9, 225. [Google Scholar] [CrossRef]
- Li, Y.; Fan, J.; Zhang, L.; Zhai, J.; Liu, G.; Li, J. The impact of different land use and management on community composition, species diversity and productivity in a typical temperate grassland. Acta Pratacult. Sin. 2013, 22, 1–9. [Google Scholar]
- Wang, J.; Xiao, X.; Qin, Y.; Dong, J.; Zhang, G.; Kou, W.; Jin, C.; Zhou, Y.; Zhang, Y. Mapping paddy rice planting area in wheat-rice double-cropped areas through integration of Landsat-8 OLI, MODIS, and PALSAR images. Sci. Rep. 2015, 5. [Google Scholar] [CrossRef] [PubMed]
- Tao, F.; Yokozawa, M.; Liu, J.; Zhang, Z. Climate change, land use change, and China’s food security in the twenty-first century: An integrated perspective. Clim. Chang. 2009, 93, 433–445. [Google Scholar] [CrossRef]
- Tao, F.; Zhang, S.; Zhang, Z. Changes in rice disasters across China in recent decades and the meteorological and agronomic causes. Reg. Environ. Chang. 2013, 13, 743–759. [Google Scholar] [CrossRef]
- Zhou, Y.; Xiao, X.; Qin, Y.; Dong, J.; Zhang, G.; Kou, W.; Jin, C.; Wang, J.; Li, X. Mapping paddy rice planting area in rice-wetland coexistent areas through analysis of Landsat 8 OLI and MODIS images. Int. J. Appl. Earth Observ. Geoinf. 2016, 46, 1–12. [Google Scholar] [CrossRef] [PubMed]
- Liu, J.; Liu, M.; Zhuang, D.; Zhang, Z.; Deng, X. Study on spatial pattern of land-use change in China during 1995–2000. Sci. China Ser. D Earth Sci. 2003, 46, 373–384. [Google Scholar]
- Fan, J.; Wang, K.; Harris, W.; Zhong, H.; Hu, Z.; Han, B.; Zhang, W.; Wang, J. Allocation of vegetation biomass across a climate-related gradient in the grasslands of Inner Mongolia. J. Arid Environ. 2009, 73, 521–528. [Google Scholar] [CrossRef]
- Hu, Z.; Yu, G.; Fan, J.; Zhong, H.; Wang, S.; Li, S. Precipitation-use efficiency along a 4500-km grassland transect. Glob. Ecol. Biogeogr. 2010, 19, 842–851. [Google Scholar]
- Oles, K.M.; Weixelman, D.A.; Lile, D.F.; Tate, K.W.; Snell, L.K.; Roche, L.M. Riparian Meadow Response to Modern Conservation Grazing Management. Environ. Manag. 2017, 60, 383–395. [Google Scholar] [CrossRef] [PubMed]
- Zhang, L.; Cao, W.; Fan, J. Soil organic carbon dynamics in Xilingol grassland of northern China induced by the Beijing-Tianjin Sand Source Control Program. Front. Earth Sci. 2016, 11, 407–415. [Google Scholar] [CrossRef]
- Fan, J.; Zhong, H.; Harris, W.; Yu, G.; Wang, S.; Hu, Z.; Yue, Y. Carbon storage in the grasslands of China based on field measurements of above-and below-ground biomass. Clim. Chang. 2008, 86, 375–396. [Google Scholar] [CrossRef]
- Egan, G.; Crawley, M.J.; Fornara, D.A. Effects of long-term grassland management on the carbon and nitrogen pools of different soil aggregate fractions. Sci. Total Environ. 2017, 613–614, 810–819. [Google Scholar] [CrossRef] [PubMed]
- Scurlock, J.; Hall, D. The global carbon sink: A grassland perspective. Glob. Chang. Biol. 1998, 4, 229–233. [Google Scholar] [CrossRef]
- Rindfuss, R.R.; Walsh, S.J.; Turner Ii, B.; Fox, J.; Mishra, V. Developing a science of land change: Challenges and methodological issues. Proc. Natl. Acad. Sci. USA 2004, 101, 13976–13981. [Google Scholar] [CrossRef] [PubMed]
- DeLucia, E.H.; Drake, J.E.; Thomas, R.B.; Gonzalez-Meler, M. Forest carbon use efficiency: Is respiration a constant fraction of gross primary production? Glob. Chang. Biol. 2007, 13, 1157–1167. [Google Scholar] [CrossRef]
- Dewar, R.C.; Medlyn, B.E.; McMurtrie, R.E. Acclimation of the respiration photosynthesis ratio to temperature: Insights from a model. Glob. Chang. Biol. 1999, 5, 615–622. [Google Scholar] [CrossRef]
- Dewar, R.C.; Medlyn, B.E.; McMurtrie, R.E. A mechanistic analysis of light and carbon use efficiencies. Plant Cell Environ. 1998, 21, 573–588. [Google Scholar] [CrossRef]
- Valentini, R.; Matteucci, G.; Dolman, A.; Schulze, E.D.; Rebmann, C.; Moors, E.; Granier, A.; Gross, P.; Jensen, N.; Pilegaard, K. Respiration as the main determinant of carbon balance in European forests. Nature 2000, 404, 861–865. [Google Scholar] [CrossRef] [PubMed]
- Chen, J.; Luo, Y.; Xia, J.; Shi, Z.; Jiang, L.; Niu, S. Differential responses of ecosystem respiration components to experimental warming in a meadow grassland on the Tibetan Plateau. Agric. For. Meteorol. 2016, 220, 21–29. [Google Scholar] [CrossRef]
- Zhao, C.; Miao, Y.; Yu, C.; Zhu, L.; Wang, F.; Jiang, L.; Hui, D.; Wan, S. Soil microbial community composition and respiration along an experimental precipitation gradient in a semiarid steppe. Sci. Rep. 2016. [Google Scholar] [CrossRef] [PubMed]
- Chen, S.; Lin, G.; Huang, J.; Jenerette, G.D. Dependence of carbon sequestration on the differential responses of ecosystem photosynthesis and respiration to rain pulses in a semiarid steppe. Glob. Chang. Biol. 2009, 15, 2450–2461. [Google Scholar] [CrossRef]
- Chen, S.; Chen, J.; Lin, G.; Zhang, W.; Miao, H.; Wei, L.; Huang, J.; Han, X. Energy balance and partition in Inner Mongolia steppe ecosystems with different land use types. Agric. For. Meteorol. 2009, 149, 1800–1809. [Google Scholar] [CrossRef]
- Miao, H.; Chen, S.; Chen, J.; Zhang, W.; Zhang, P.; Wei, L.; Han, X.; Lin, G. Cultivation and grazing altered evapotranspiration and dynamics in Inner Mongolia steppes. Agric. For. Meteorol. 2009, 149, 1810–1819. [Google Scholar] [CrossRef]
- Liu, H.; Zang, R.; Chen, H.Y. Effects of grazing on photosynthetic features and soil respiration of rangelands in the Tianshan Mountains of Northwest China. Sci. Rep. 2016. [Google Scholar] [CrossRef]
- Li, Y.; Fan, J.; Hu, Z.; Shao, Q.; Harris, W. Comparison of evapotranspiration components and water-use efficiency among different land use patterns of temperate steppe in the Northern China pastoral-farming ecotone. Int. J. Biometeorol. 2015, 60, 827–841. [Google Scholar] [CrossRef] [PubMed]
- Newman, M.M.; Hoilett, N.; Lorenz, N.; Dick, R.P.; Liles, M.R.; Ramsier, C.; Kloepper, J.W. Glyphosate effects on soil rhizosphere-associated bacterial communities. Sci. Total Environ. 2016, 543, 155–160. [Google Scholar] [CrossRef] [PubMed]
- Niu, S.; Sherry, R.A.; Zhou, X.; Luo, Y. Ecosystem carbon fluxes in response to warming and clipping in a tallgrass prairie. Ecosystems 2013, 16, 948–961. [Google Scholar] [CrossRef]
- Raich, J.; Schlesinger, W. The global carbon dioxide flux in soil respiration and its relationship to vegetation and climate. Tellus B 1992, 44, 81–99. [Google Scholar] [CrossRef]
- Li, J.; Wang, G.; Allison, S.D.; Mayes, M.A.; Luo, Y. Soil carbon sensitivity to temperature and carbon use efficiency compared across microbial-ecosystem models of varying complexity. Biogeochemistry 2014, 119, 67–84. [Google Scholar] [CrossRef]
- DeLucia, E.H.; Schlesinger, W.H. Resource—Use efficiency and drought tolerance in adjacent Great Basin and sierran plants. Ecology 1991, 72, 51–58. [Google Scholar] [CrossRef]
- Chambers, J.Q.; Tribuzy, E.S.; Toledo, L.C.; Crispim, B.F.; Higuchi, N.; dos Santos, J.; Araujo, A.C.; Kruijt, B.; Nobre, A.D.; Trumbore, S.E. Respiration from a tropical forest ecosystem: Partitioning of sources and low carbon use efficiency. Ecol. Appl. 2004, 14, S72–S88. [Google Scholar] [CrossRef]
- Marthews, T.R.; Malhi, Y.; Girardin, C.A.; Silva Espejo, J.E.; Aragão, L.E.; Metcalfe, D.B.; Rapp, J.M.; Mercado, L.M.; Fisher, R.A.; Galbraith, D.R. Simulating forest productivity along a neotropical elevational transect: Temperature variation and carbon use efficiency. Glob. Chang. Biol. 2012, 18, 2882–2898. [Google Scholar] [CrossRef] [PubMed] [Green Version]
- Hirel, B.; Tétu, T.; Lea, P.J.; Dubois, F. Improving nitrogen use efficiency in crops for sustainable agriculture. Sustainability 2011, 3, 1452–1485. [Google Scholar] [CrossRef]
- Mu, J.E.; Wein, A.M.; McCarl, B.A. Land use and management change under climate change adaptation and mitigation strategies: A US case study. Mitig. Adapt. Strateg. Glob. Chang. 2015, 20, 1041–1054. [Google Scholar] [CrossRef]
- Jilani, T.; Hasegawa, T.; Matsuoka, Y. The future role of agriculture and land use change for climate change mitigation in Bangladesh. Mitig. Adapt. Strateg. Glob. Chang. 2015, 20, 1289–1304. [Google Scholar] [CrossRef]
- Metcalfe, D.B.; Meir, P.; Aragão, L.E.; Lobo-do-Vale, R.; Galbraith, D.; Fisher, R.; Chaves, M.M.; Maroco, J.; da Costa, A.C.L.; de Almeida, S.S. Shifts in plant respiration and carbon use efficiency at a large-scale drought experiment in the eastern Amazon. New Phytol. 2010, 187, 608–621. [Google Scholar] [CrossRef] [PubMed]
- Reichstein, M.; Tenhunen, J.; Roupsard, O.; Ourcival, J.M.; Rambal, S.; Dore, S.; Valentini, R. Ecosystem respiration in two Mediterranean evergreen Holm Oak forests: Drought effects and decomposition dynamics. Funct. Ecol. 2002, 16, 27–39. [Google Scholar] [CrossRef]
- Reichstein, M.; Falge, E.; Baldocchi, D.; Papale, D.; Aubinet, M.; Berbigier, P.; Bernhofer, C.; Buchmann, N.; Gilmanov, T.; Granier, A. On the separation of net ecosystem exchange into assimilation and ecosystem respiration: Review and improved algorithm. Glob. Chang. Biol. 2005, 11, 1424–1439. [Google Scholar] [CrossRef]
- Reichstein, M.; Bahn, M.; Mahecha, M.D.; Kattge, J.; Baldocchi, D.D. Linking plant and ecosystem functional biogeography. Proc. Natl. Acad. Sci. USA 2014, 111, 13697–13702. [Google Scholar] [CrossRef] [PubMed]
- Tucker, C.L.; Bell, J.; Pendall, E.; Ogle, K. Does declining carbon—Use efficiency explain thermal acclimation of soil respiration with warming? Glob. Chang. Biol. 2013, 19, 252–263. [Google Scholar] [CrossRef] [PubMed]
- Luo, Y.; Wan, S.; Hui, D.; Wallace, L.L. Acclimatization of soil respiration to warming in a tall grass prairie. Nature 2001, 413, 622–625. [Google Scholar] [CrossRef] [PubMed]
- Liu, Y.Y.; van Dijk, A.I.; de Jeu, R.A.; Canadell, J.G.; McCabe, M.F.; Evans, J.P.; Wang, G. Recent reversal in loss of global terrestrial biomass. Nat. Clim. Chang. 2015, 5, 470–474. [Google Scholar] [CrossRef]
- Lloyd, J.; Taylor, J. On the temperature dependence of soil respiration. Funct. Ecol. 1994, 8, 315–323. [Google Scholar] [CrossRef]
- Suyker, A.E.; Verma, S.B. Gross primary production and ecosystem respiration of irrigated and rainfed maize–soybean cropping systems over 8 years. Agric. For. Meteorol. 2012, 165, 12–24. [Google Scholar] [CrossRef]
- Piao, S.; Friedlingstein, P.; Ciais, P.; de Noblet-Ducoudré, N.; Labat, D.; Zaehle, S. Changes in climate and land use have a larger direct impact than rising CO2 on global river runoff trends. Proc. Natl. Acad. Sci. USA 2007, 104, 15242–15247. [Google Scholar] [CrossRef] [PubMed]
- Regina, K.; Sheehy, J.; Myllys, M. Mitigating greenhouse gas fluxes from cultivated organic soils with raised water table. Mitig. Adapt. Strateg. Glob. Chang. 2015, 20, 1529–1544. [Google Scholar] [CrossRef]
- Franzluebbers, K.; Franzluebbers, A.; Jawson, M. Environmental controls on soil and whole-ecosystem respiration from a tallgrass prairie. Soil Sci. Soc. Am. J. 2002, 66, 254–262. [Google Scholar] [CrossRef]
- Dong, J.; Liu, J.; Tao, F.; Xu, X.; Wang, J. Spatio-temporal changes in annual accumulated temperature in China and the effects on cropping systems, 1980s to 2000. Clim. Res. 2009, 40, 37–48. [Google Scholar] [CrossRef]
- Dong, J.; Xiao, X.; Chen, B.; Torbick, N.; Jin, C.; Zhang, G.; Biradar, C. Mapping deciduous rubber plantations through integration of PALSAR and multi-temporal Landsat imagery. Remote Sens. Environ. 2013, 134, 392–402. [Google Scholar] [CrossRef]
- Niu, S.; Wu, M.; Han, Y.; Xia, J.; Li, L.; Wan, S. Water—Mediated responses of ecosystem carbon fluxes to climatic change in a temperate steppe. New Phytol. 2008, 177, 209–219. [Google Scholar] [CrossRef] [PubMed]
Figure 1.
The location of the study area and the land use of the pastoral farming ecotone in North China. Map was created using ArcMap 10.2 (ESRI, Inc., Redlands, CA, USA. http://desktop.arcgis.com/en/arcmap/).
Figure 1.
The location of the study area and the land use of the pastoral farming ecotone in North China. Map was created using ArcMap 10.2 (ESRI, Inc., Redlands, CA, USA. http://desktop.arcgis.com/en/arcmap/).

Figure 2.
Treatments of the three land-use types. (a–c) plots with clipping (a), herbicide (b), and control (c) at the grazing site; (d–f) plots with clipping (d), herbicide (e), and control (f) at the grazing exclusion site; (g–i) plots with clipping (g); herbicide (h); and control (i) at the cropland site.

Figure 3.
Daily variations of net ecosystem exchange (NEE), gross ecosystem productivity (GEP) and net primary production (NPP) on the steppes under different use patterns during the peak growing period. (a) NEE; (b) GEP; (c) NPP.
Figure 3.
Daily variations of net ecosystem exchange (NEE), gross ecosystem productivity (GEP) and net primary production (NPP) on the steppes under different use patterns during the peak growing period. (a) NEE; (b) GEP; (c) NPP.

Figure 4.
Daily average GEP, NPP and NEP on steppes under different land uses during the peak growing period. Vertical bars represent ± 1SD of the mean. Different letters in each bar group indicate significant difference (p < 0.05). G, grazed steppe; GE, grazing-excluded steppe; C, cultivated steppe.

Figure 5.
Changes of daily dynamics of ecosystem respiration compositions in different grassland-use patterns during the peak growing period. (a) ecosystem respiration (Re); (b) root respiration (Rr); (c) autotrophic respiration (Ra); (d) heterotrophic respiration (Rh); (e) aboveground respiration (Rab); (f) belowground respiration (Rb). G, grazing; GE, grazing-excluded; C, cultivated steppe.
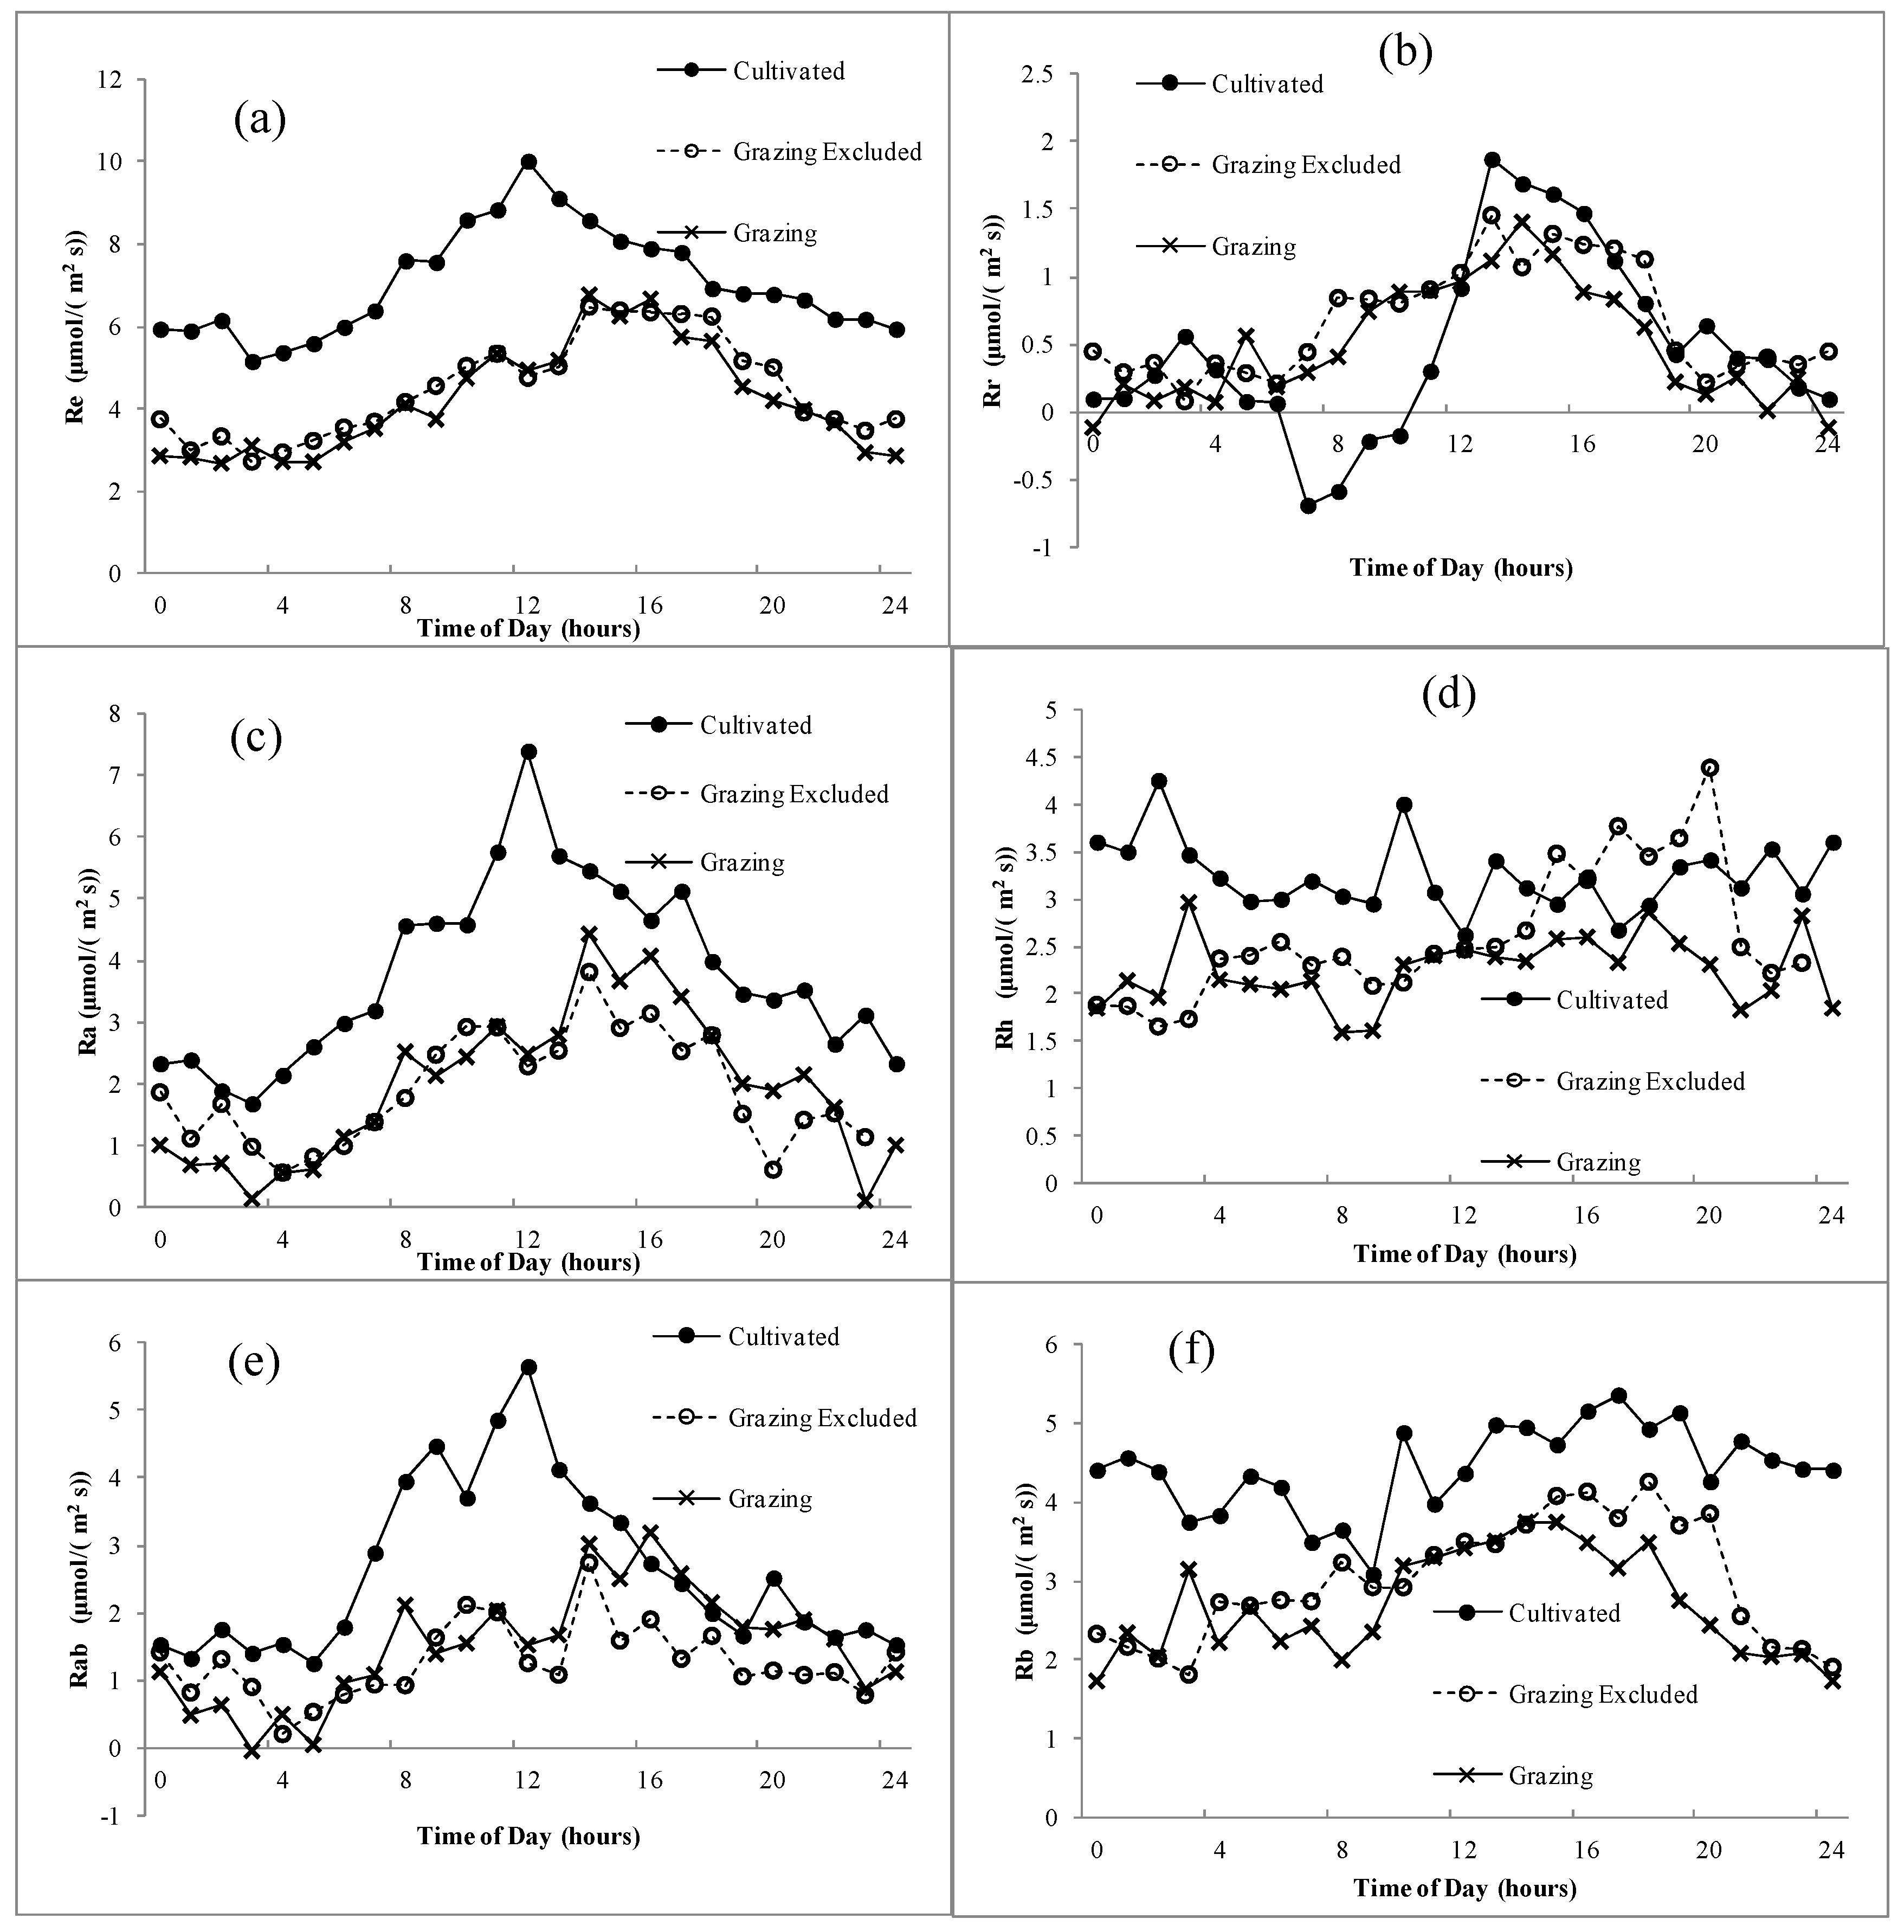
Figure 6.
Mean daily ecosystem respiration and its components in different grassland-use and management patterns during the peak growing period. Vertical bars represent ± 1SD of the mean. Different letters in each group indicate significant differences (p < 0.05). G, grazing; GE, grazing-excluded; C, cultivated steppe.
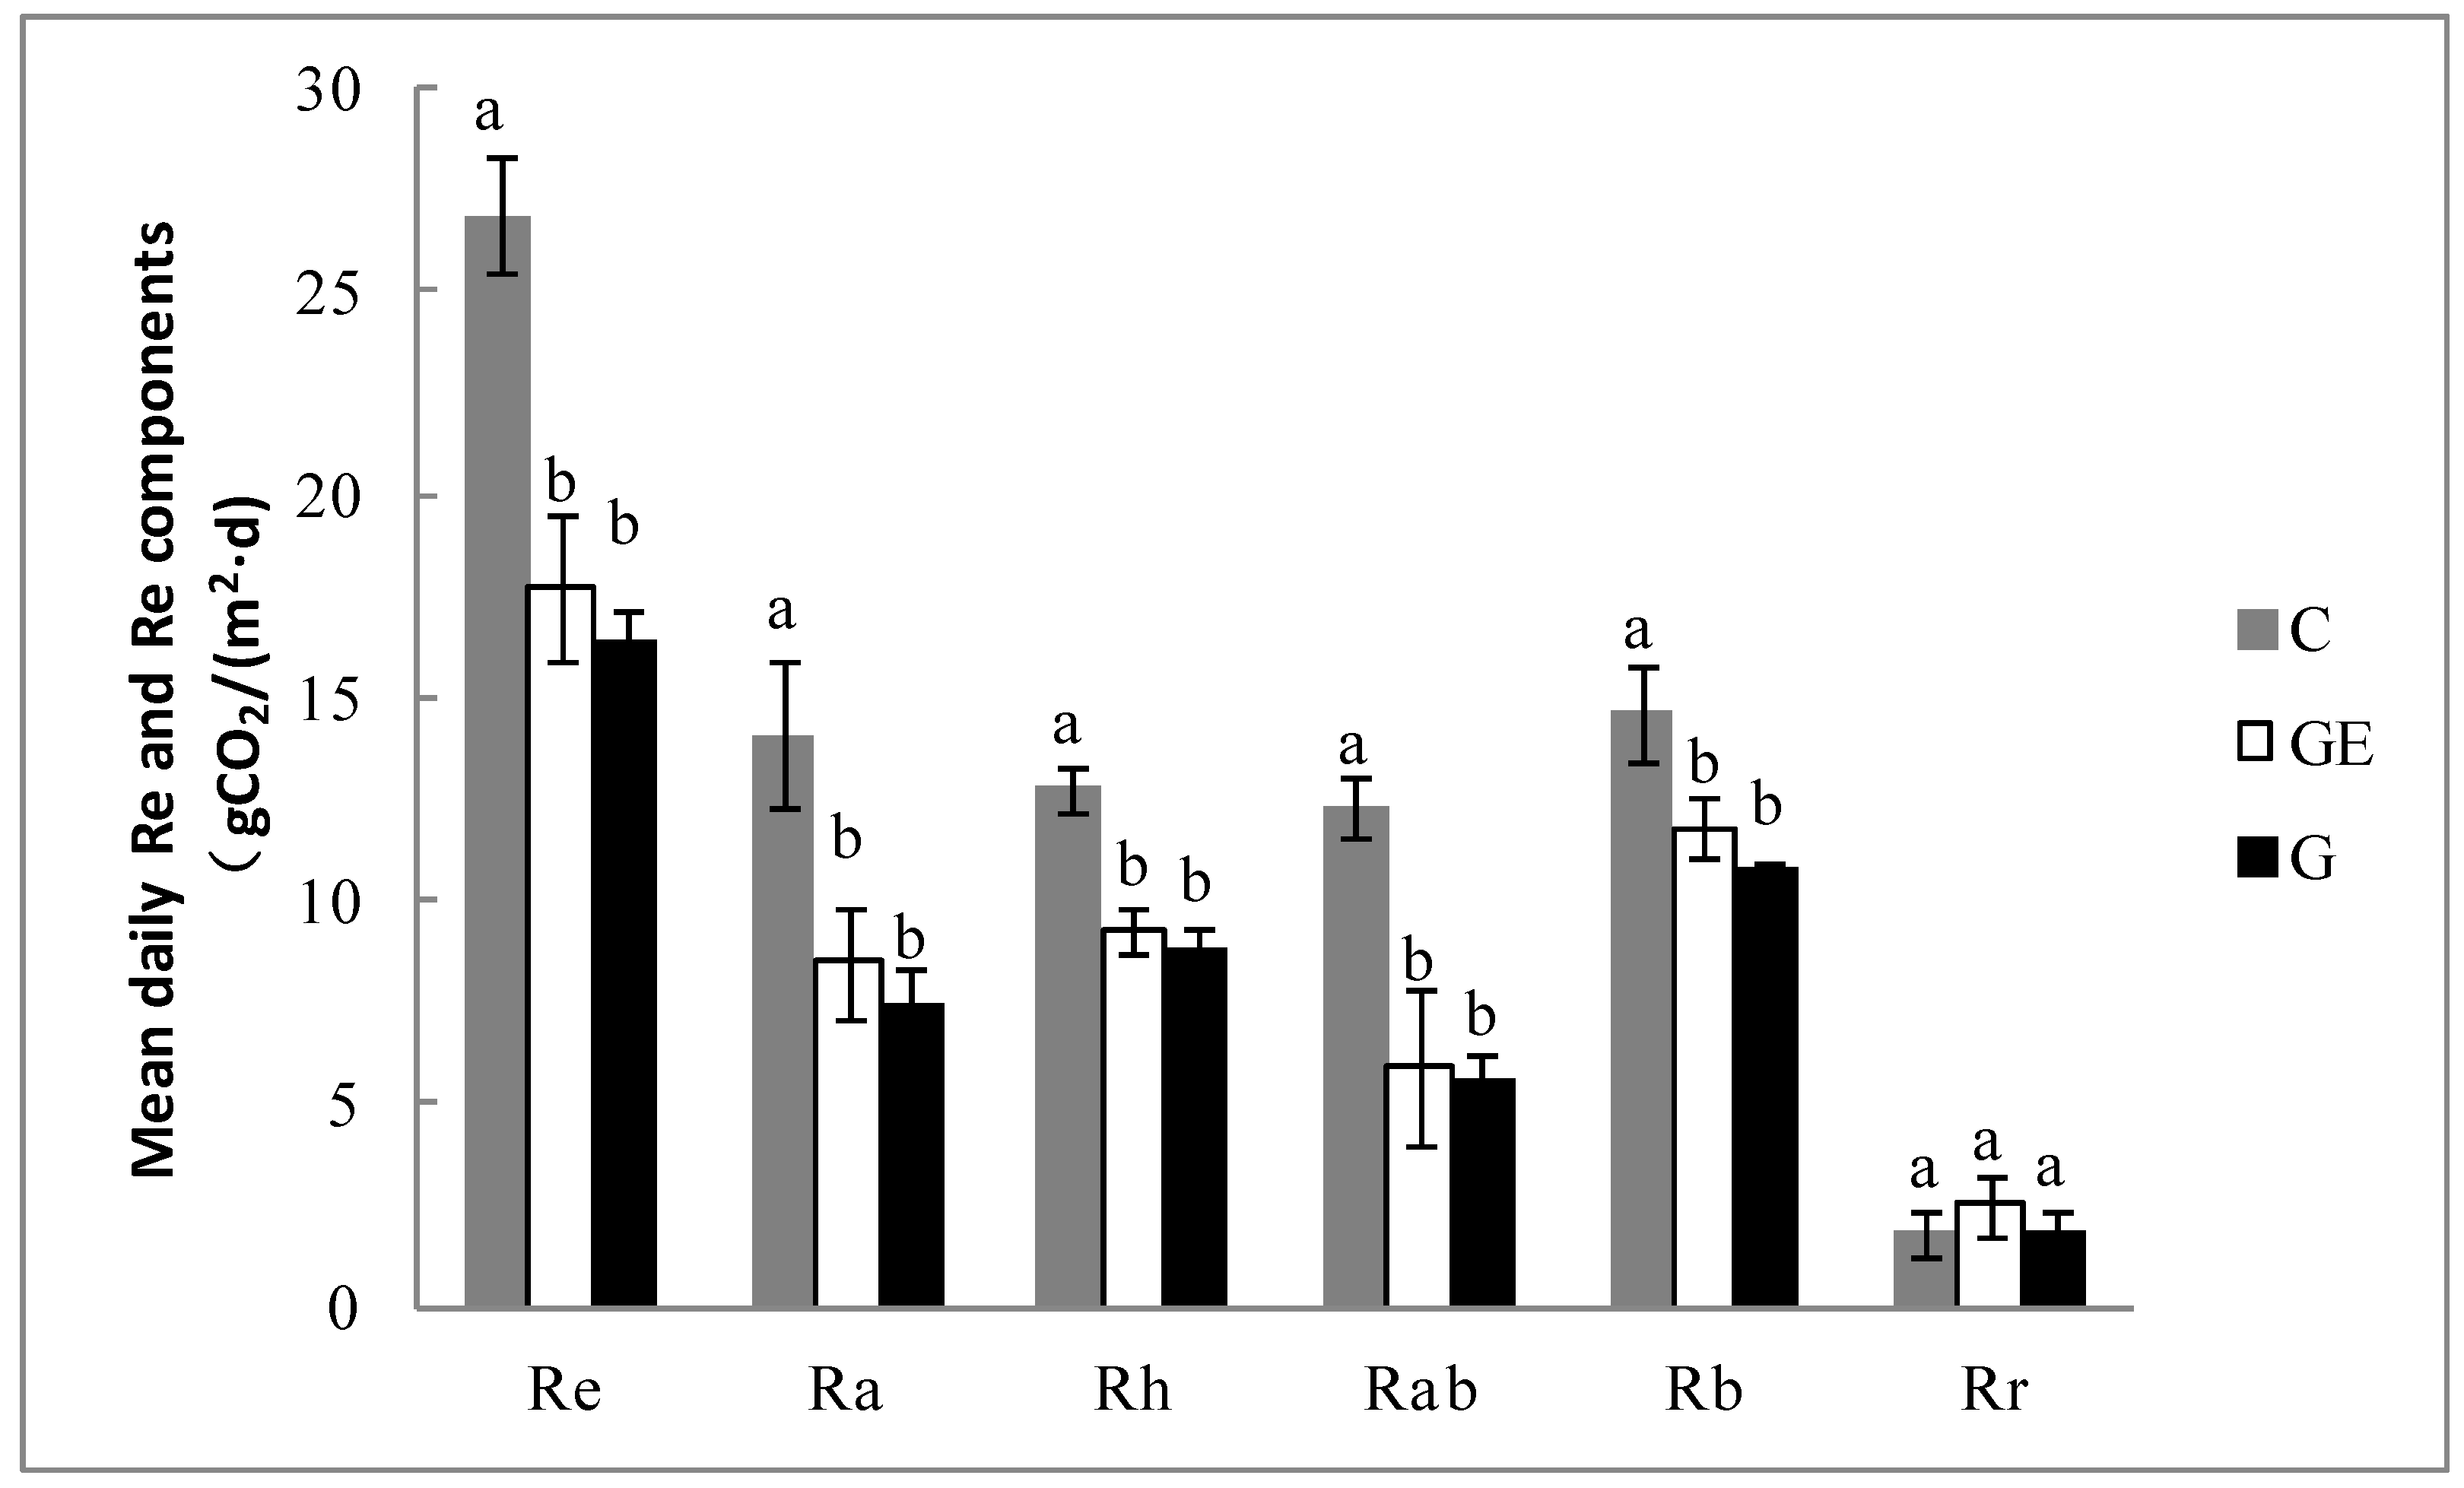
Figure 7.
Mean daily carbon-use efficiency (CUE) in different grassland-use and management patterns during the peak growing period. Vertical bars represent ± 1SD of the mean. Different letters indicate significant differences (p < 0.05). G, grazing; GE, grazing-excluded; C, cultivated steppe.
Figure 7.
Mean daily carbon-use efficiency (CUE) in different grassland-use and management patterns during the peak growing period. Vertical bars represent ± 1SD of the mean. Different letters indicate significant differences (p < 0.05). G, grazing; GE, grazing-excluded; C, cultivated steppe.
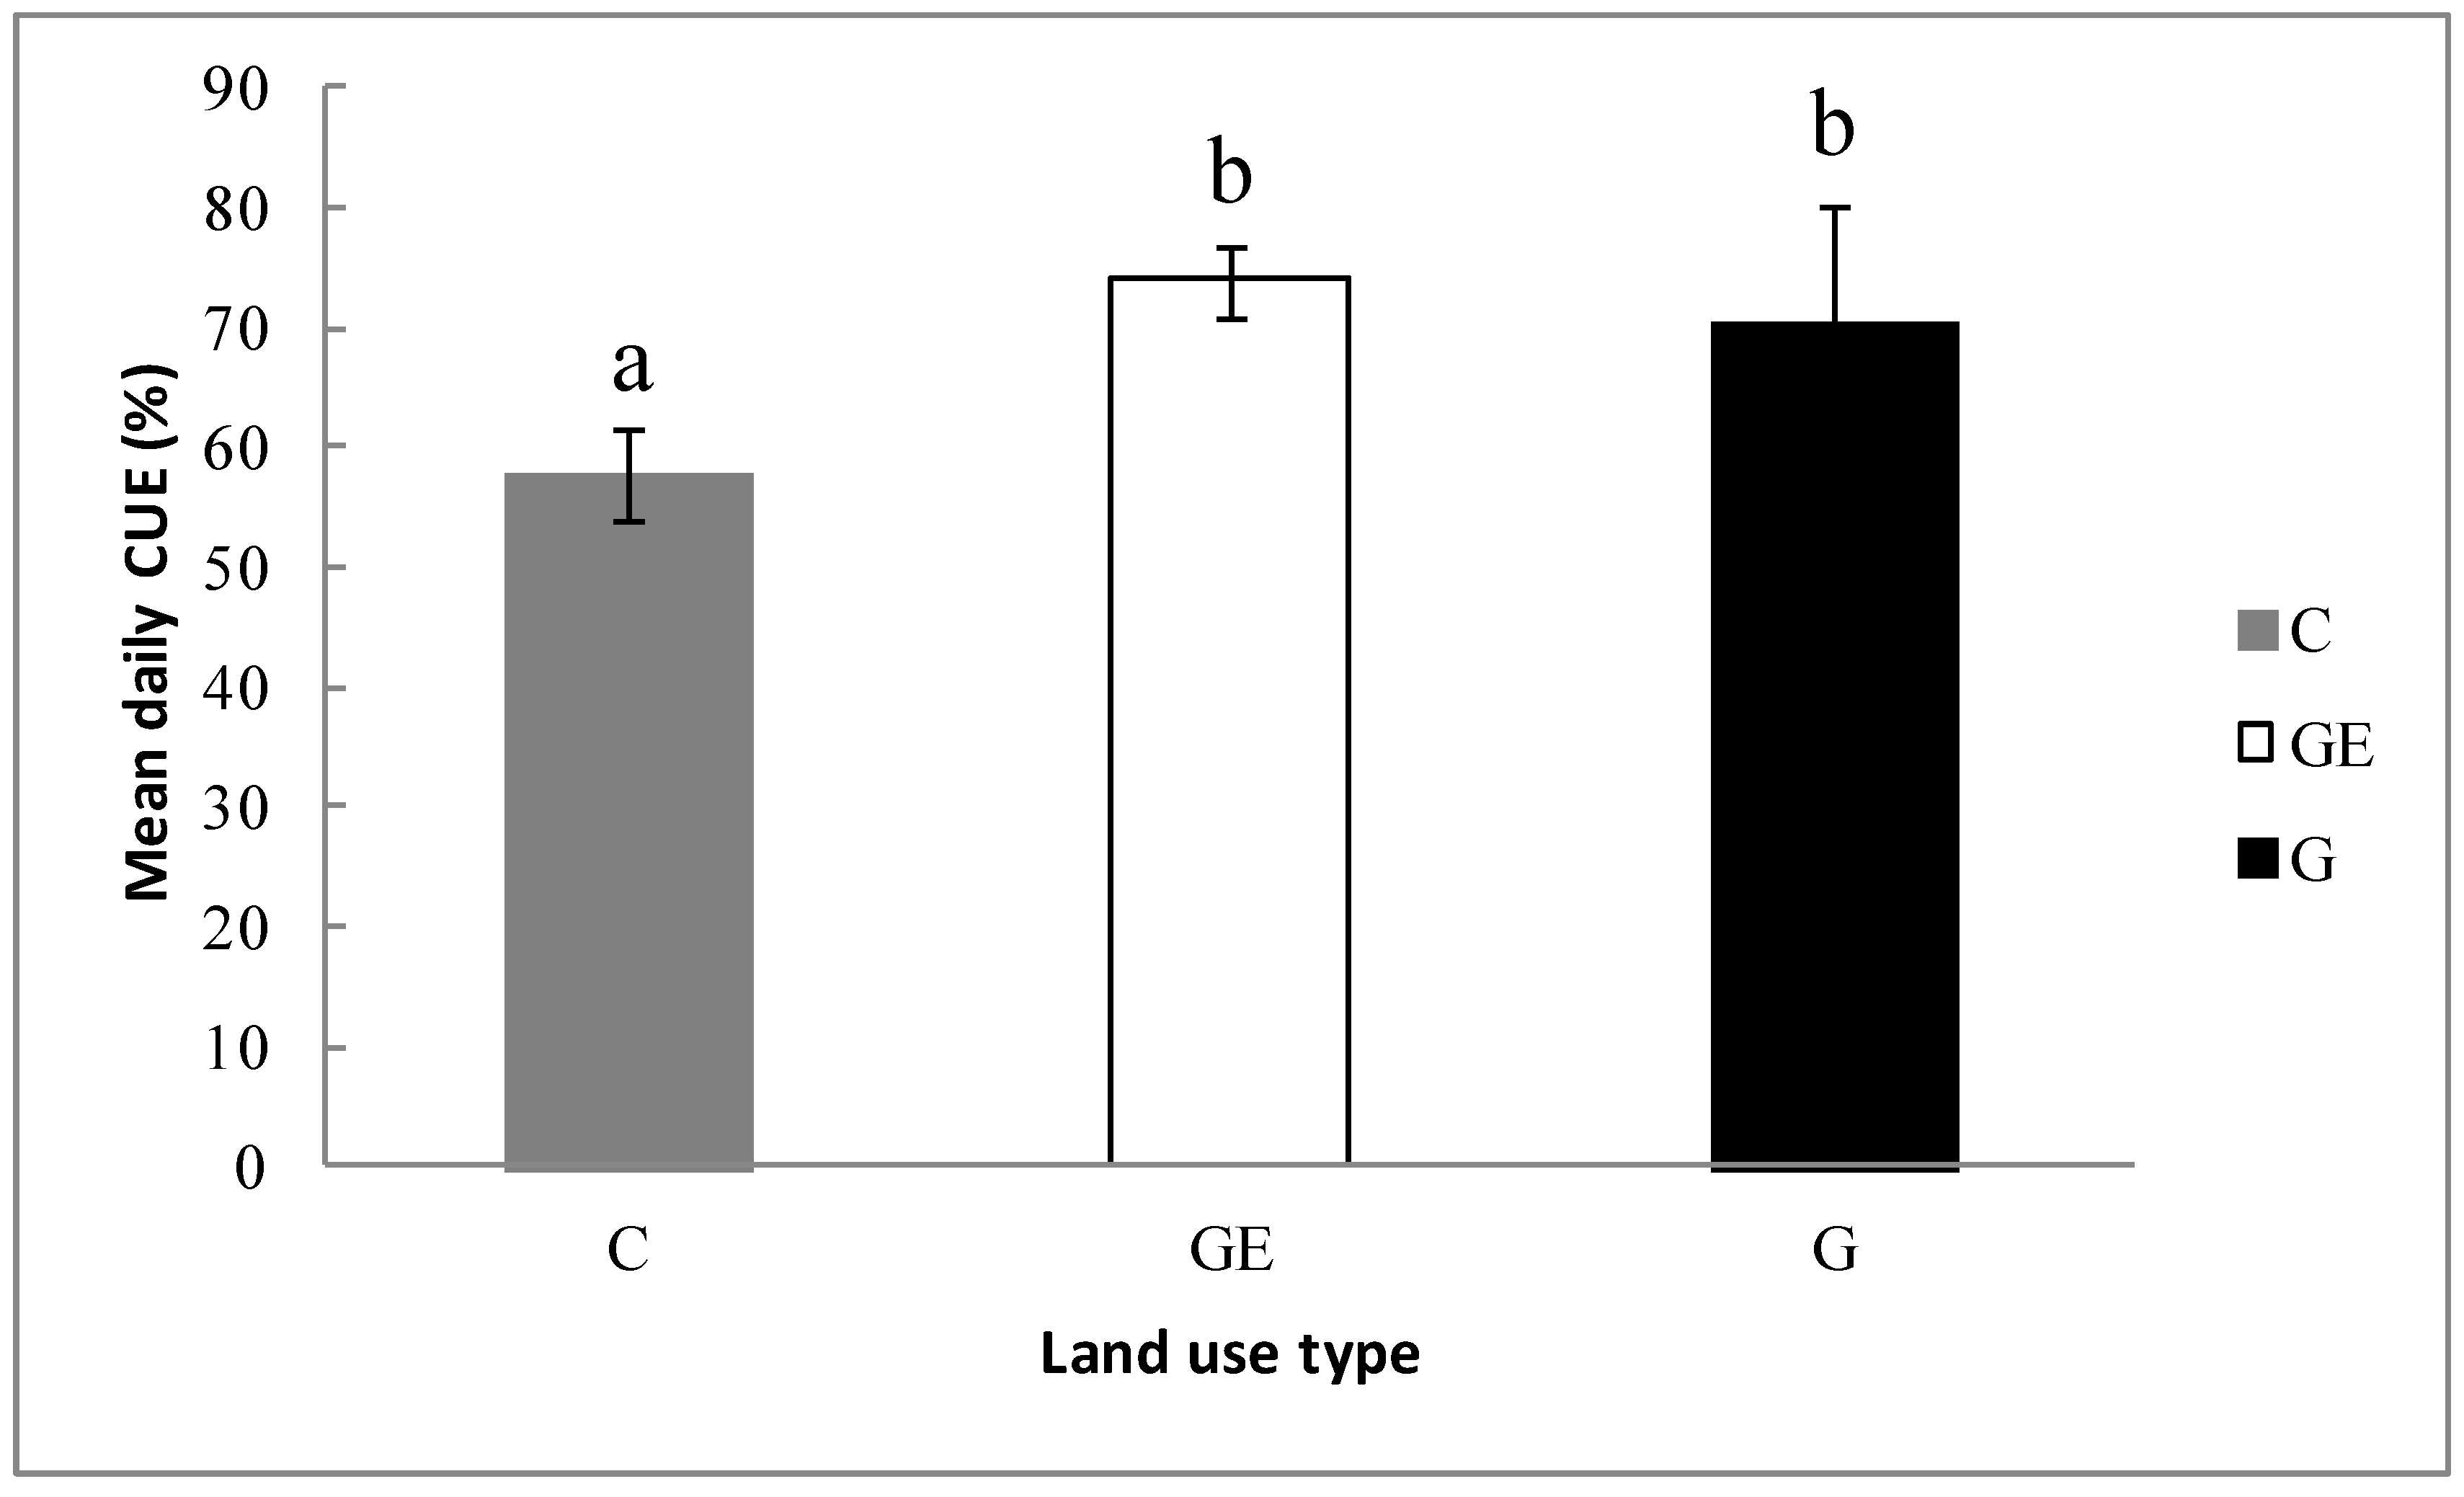
Figure 8.
Relationships between ecosystem carbon-use efficiency on (a) Re, (b) Ra, (c) Rab, (d) Rr, (e) Rh and (f) Rb across the three different grassland-use and management patterns. G, grazing; GE, grazing-excluded; C, cultivated steppe. R2 and probabilities of regressions are shown; ^ p > 0.05; *** p < 0.001.

Figure 9.
Relationships between ecosystem (a) CUE, (b) Re, (c) Ra and (d) Rab on leaf-area index (LAI). The R2 and significance levels of the regressions are shown; *** p < 0.001.
Figure 9.
Relationships between ecosystem (a) CUE, (b) Re, (c) Ra and (d) Rab on leaf-area index (LAI). The R2 and significance levels of the regressions are shown; *** p < 0.001.
© 2018 by the authors. Licensee MDPI, Basel, Switzerland. This article is an open access article distributed under the terms and conditions of the Creative Commons Attribution (CC BY) license (http://creativecommons.org/licenses/by/4.0/).
Share and Cite
MDPI and ACS Style
Li, Y.; Fan, J.; Hu, Z. Comparison of Carbon-Use Efficiency Among Different Land-Use Patterns of the Temperate Steppe in the Northern China Pastoral Farming Ecotone. Sustainability 2018, 10, 487. https://doi.org/10.3390/su10020487
AMA Style
Li Y, Fan J, Hu Z. Comparison of Carbon-Use Efficiency Among Different Land-Use Patterns of the Temperate Steppe in the Northern China Pastoral Farming Ecotone. Sustainability. 2018; 10(2):487. https://doi.org/10.3390/su10020487
Chicago/Turabian StyleLi, Yuzhe, Jiangwen Fan, and Zhongmin Hu. 2018. "Comparison of Carbon-Use Efficiency Among Different Land-Use Patterns of the Temperate Steppe in the Northern China Pastoral Farming Ecotone" Sustainability 10, no. 2: 487. https://doi.org/10.3390/su10020487
Note that from the first issue of 2016, this journal uses article numbers instead of page numbers. See further details here.