Simulation of Weak Signals of Nanotechnology Innovation in Complex System

Seoul Branch Office, Korea Institute of Science and Technology Information (KISTI), Seoul 02456, Korea
*
Author to whom correspondence should be addressed.
Sustainability 2018, 10(2), 486; https://doi.org/10.3390/su10020486
Submission received: 24 December 2017
/
Revised: 1 February 2018
/
Accepted: 7 February 2018
/
Published: 12 February 2018
(This article belongs to the Special Issue Sustainability of Economic Growth: Combining Technology, Market and Society)
Abstract
:It is especially indispensable for new businesses or industries to predict the innovation of new technologies. This requires an understanding of how the complex process of innovation, which is accomplished through more efficient products, processes, services, technologies, or ideas, is adopted and diffused in the market, government, and society. Furthermore, detecting “weak signals” (signs) of change in science and technology (S&T) is also important to foretell events associated with innovations in technology. Thus, we explore the dynamic behavior of weak signals of a specific technological innovation using the agent-based simulating tool NetLogo. This study provides a deeper understanding of the early stages of complex technology innovation, and the models are capable of analyzing initial complex interaction structures between components of technologies and between agents engaged in collective invention.
1. Introduction
Predicting the innovation of new technologies is important when exploring a new business or new industry. Moreover, technological innovation increasingly involves the complex process of innovation, which is accomplished through more efficient products, processes, services, technologies, or ideas that are readily available to markets, governments, and society. Thus, the trend toward complexity increases over time.
Modelling has been an important part of research on technological innovation. In particular, evolutionary economists developed a family of models to address technology adoption, diffusion, and increasing returns [1,2,3,4,5], and the role of technical change in industrial dynamics and economic growth [6,7,8,9,10]. Although these models were important in establishing an evolutionary understanding of technical change, their contribution to the understanding of the innovation process has been less significant.
Models deal either with technology adoption given a set of technologies or with innovation as a simple stochastic process. This research strategy is legitimate if the main interest is to understand the role of technical change in the economy. Recently, a group of models has been developed that focus on technological innovation as a complex phenomenon using modelling techniques from complex sciences.
The important contribution of the complexity theory is its ability to model more complex interaction structures with less parameters. In this way, realism can be added to previous models without sacrificing analytical rigor. Regarding technological innovation, two frames of reference are relevant: (i) complexity can refer to complex interaction structures of components in a technological system, and (ii) complexity can refer to structures of interactions between agents in innovation networks. The complexity theory proves to be applicable in both domains.
Here, we use the second frame to explore the structures of interactions between agents with weak signals (signs) of technological innovation. There have been numerous recent reviews on the complexity model subsets, including Cowan (2004) [11] on network models of innovation, Dawid (2004) [12] and Pyka and Fagiolo (2005) [13] on agent-based models of innovation, Llerena and Lorentz (2004) [14] on technical change and evolutionary macroeconomics, Silverberg (2003) [15] on long waves in technical change, and Windrum (2004) [16] on neo-Schumpeterian models of industrial dynamics.
Early detection of emerging issues (signs) is the first important indication of a change. These indicators of change can be advanced, somewhat noisy, and generally socially situated trends and systems that constitute raw information to enable anticipatory action. Often, such indicators can be difficult to detect because they represent an unknown, unexpected, or rare change, which makes them hard to distinguish as relevant. Therefore, they are usually referred at as “faint” or “weak” signals.
The purpose of policy makers scanning for weak signals is to enhance resilient policy-making, address new issues, identify business opportunities by anticipating consumer and societal needs, and to prepare society for these unexpected and rapid changes.
Recently, the interest in future business and the demand for forecasting future trends in science and technology (S&T), especially by exploring weak signals of potential change, has increased. Although weak signals are uncertain and irregular, they may indicate future trends. Ansoff (1982) [17] described weak signals as “… warnings (external or internal), events and developments which are still too incomplete to permit an accurate estimation of their impact and/or to determine their full-fledged responses.”
The impact of weak signals cannot be estimated accurately [18], as new or existing events can have unknown impacts on a target in the future. For strategic planning, it is difficult to identify weak signals from the large number of existing signals. Literature proposes methodologies for weak signal identification that can be used to identify the future impact of weak signals on strategic directions. Specifically, weak signals cannot be found in the core area of an organization because strategic decision makers already know the internal events of an organization and their impacts. Thus, Ansoff shows that weak signals can be found in an organization’s environment by first using an environmental scanning procedure to identify signals. Second, a clustering approach can be used to group the large number of identified signals and identify clusters of weak signals [19].
Generally, the procedure for forecasting or early warning scanning consists of four steps: (1) exploring weak signals, (2) assessing weak signals, (3) transforming the signals into issues, and (4) interpreting the issues for new futures [20]. Among the steps, exploring weak signals is a prerequisite for analyzing alternative futures.
However, scanning for weak signals is possible because of the intuitive insight of experts, whose services are often costly and not widely available. Further, their findings can be subjective and contradictory.
Weak signals are current oddities that are key to anticipating future changes in organizational environments. Scanning for and using them in scenario work is considered a successful way to look towards the future. However, defining weak signals is problematic, and various authors term the concept differently.
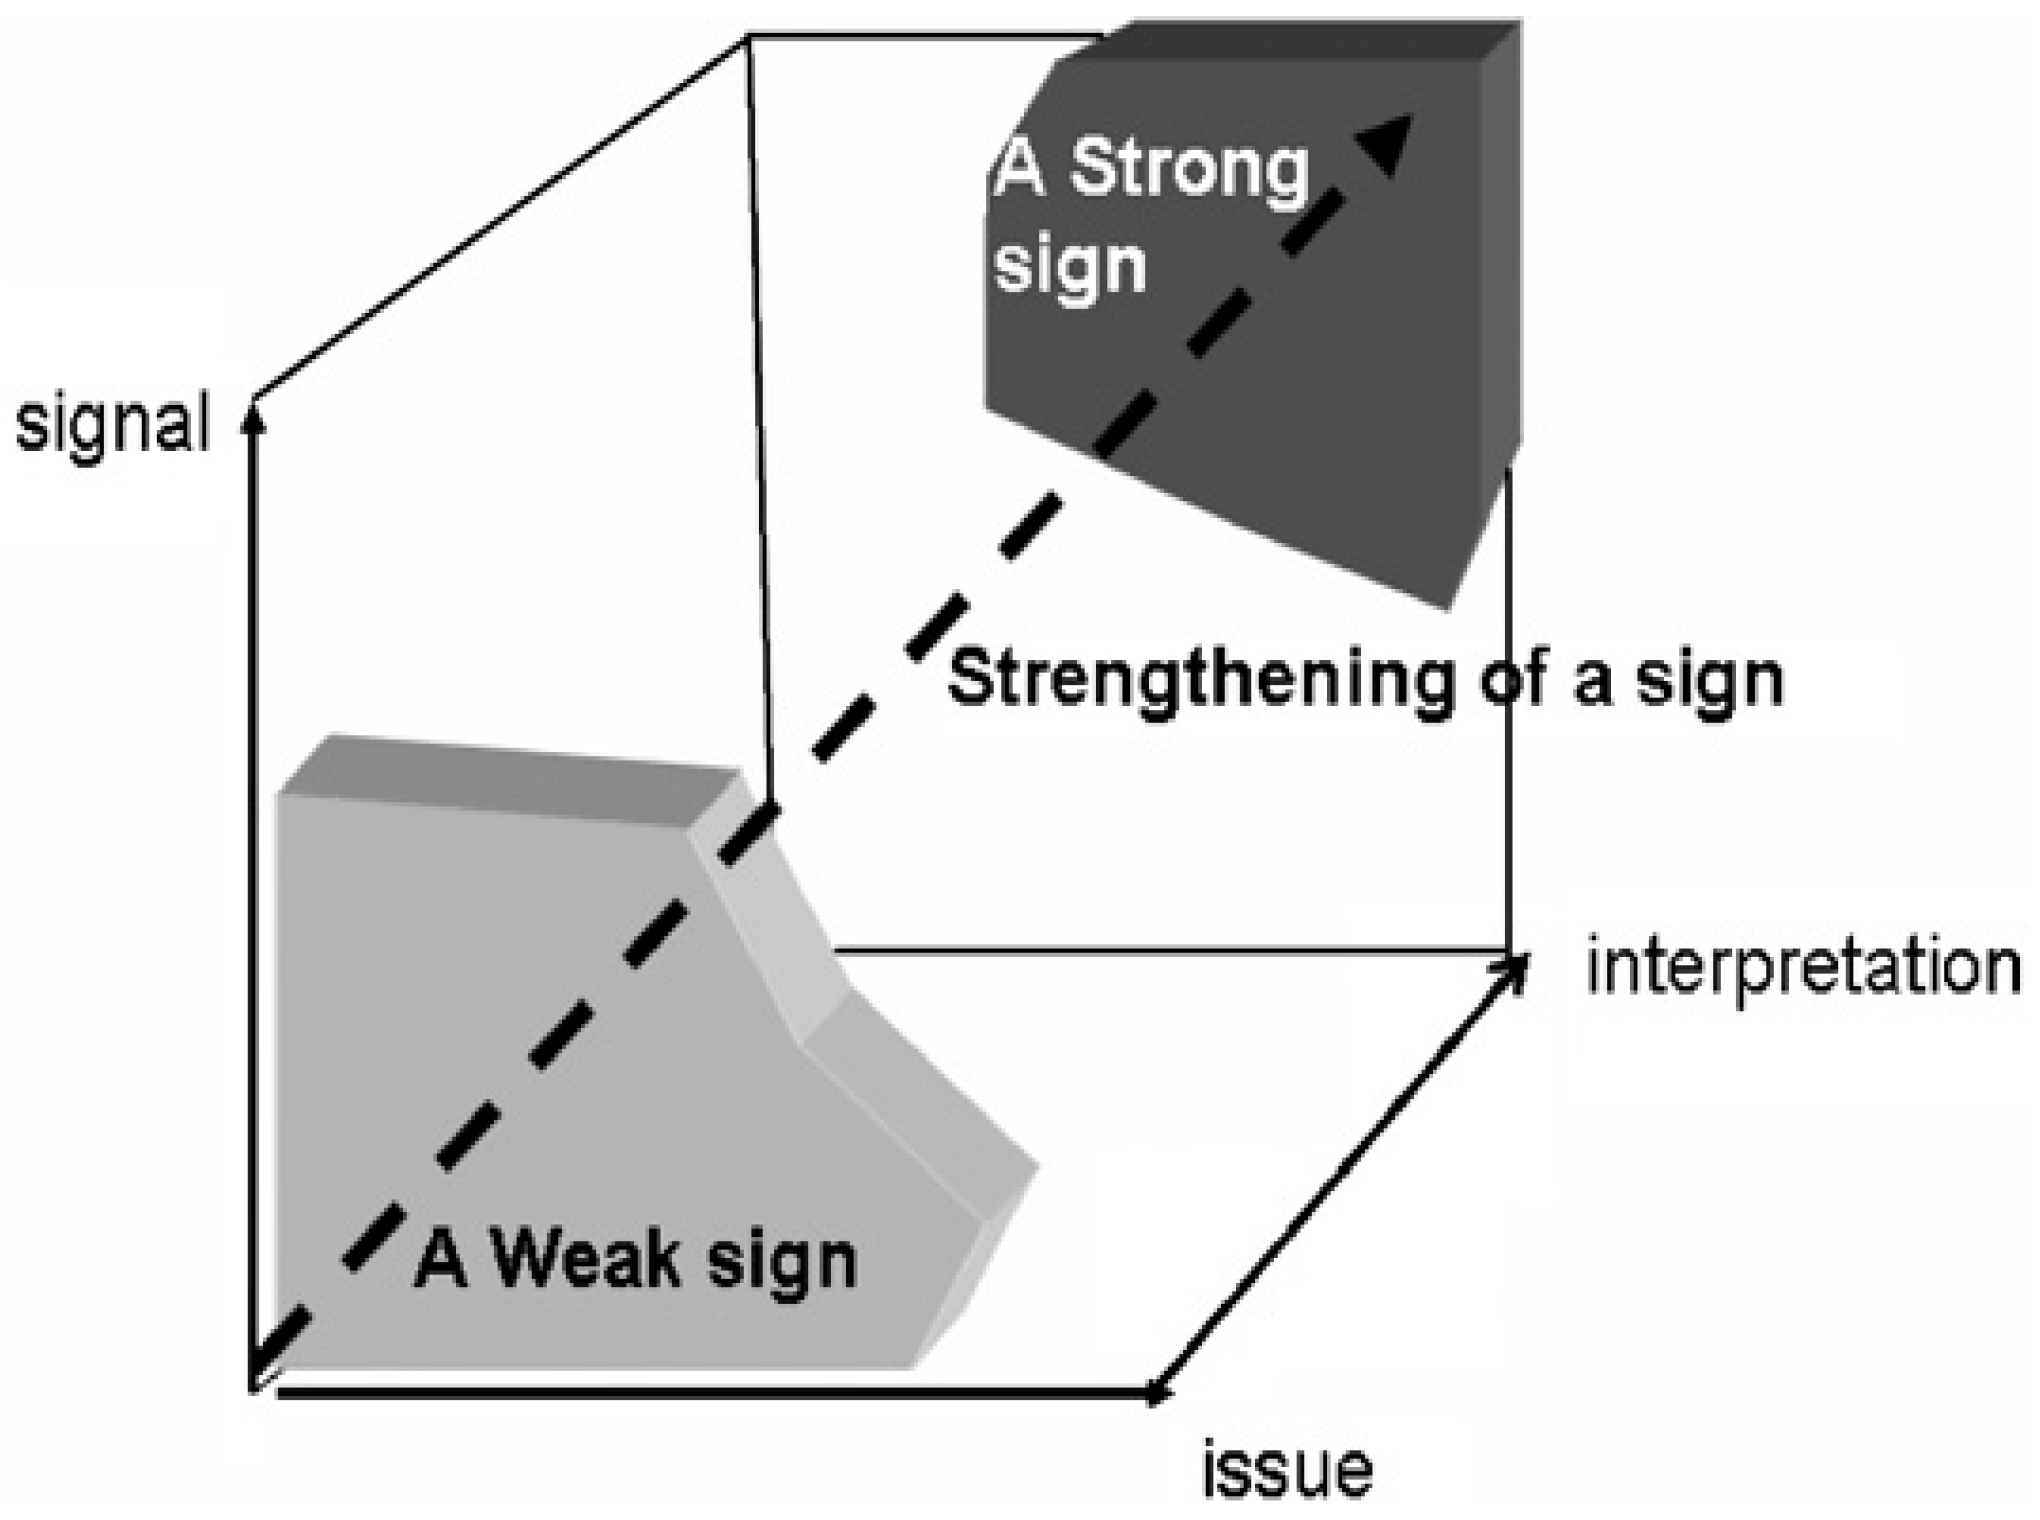
There is an active debate about the characteristics of weak signals, especially in Finland. Hiltunen (2008) [21] aims to develop a deeper theoretical understanding of weak signals. For this purpose, a semiotic approach, Peirce’s triadic model of sign in particular, is used as a new starting point for defining weak signals by using the novel concept of future sign, which consists of three dimensions: the signal, the issue, and the interpretation.
In Figure 1, the axes (i.e., the dimensions of the future sign) are the signal, the issue, and the interpretation. The units of these dimensions are as follows:
The signal: the number and/or visibility of signals.
The issue: a variety of units that describe the diffusion of the phenomenon are possible (e.g., the number of events, the percentage of net sales, the percentage of internal sales, the amount of employees abroad).
The interpretation: the receiver’s understanding of the meaning of the future sign. An organizational point of view considers the future importance of the sign for an organization.
The Internet is a valuable source of information [22] where many signals occur and can represent an organization’s environment. Additionally, most of the data available on the Internet are textual data, such as websites or blogs. As a result, existing weak signal identification approaches use environmental scanning of textual information from the Internet [22,23].
With Internet-based environmental scanning, documents such as webpages can be identified. This scanning normally has a wide scope and, thus, leads to a large number of extracted Internet documents. This makes a (semi-) automatic approach more appropriate than a manual approach. Furthermore, the documents can contain text related to several different topics, and a document as a whole normally does not represent a signal. Rather, the specific textual patterns that occur within the document probably represent the signal [23]. Therefore, text mining can be used to extract textual patterns from the full text of documents. A specific clustering approach can then be applied to identify groups of textual patterns that represent weak signals [24,25,26].
Literature describes approaches that use Internet-based environmental scanning for weak signal identification [22,23,27]. Schwarz (2005) [27] aims to identify arising technologies relevant to high tech companies in Europe. Unfortunately, this approach has not been applied in practice, as it requires much manual effort because an automated environmental scanning tool was not available. Further, the results of the clustering approach are of low quality. In contrast, the approaches of Decker et al. (2005) [22] and Uskali (2005) [23] have been applied successfully.
However, to avoid high levels of manual effort, these approaches restrict the number of retrieved documents to a small value and are thus not considered wide scope Internet-based environmental scanning approaches. Yoo (2009) [24] provides an automated approach for Internet-based environmental scanning and clustering, and a further knowledge structure-based approach is provided by Yoon (2012) [28] to detect weak signals from Internet news related to solar cells.
In this paper, we propose a longitudinal analysis, particularly a time series analysis of words and/or co-word occurrences, based on the word frequencies extracted from full text S&T news articles. In this study, we provide a deeper understanding of the early stages of complex technology innovation. For technological innovation, we detected weak signals through text mining, assumed them to be technological innovation terms (TI-terms), and categorized them as emerging issues following a simulation period. These weak signals can grow to be strong signals, such as events.
2. Background
2.1. Complexity Models of Innovation
2.1.1. Fitness Landscapes
Interpreting technologies as complex systems requires defining the elements and their interactions, by letting N be the number of elements in a system and i be the index for each element (i = 1, …, N). For example, a car can be described by the number of elements, including the engine, brakes, transmission, and steering device. When designing a technological system, there is generally more than one option for each element. Assuming, without a loss of generality, that there are two options for each element, the total number of possible designs is 2N.
Thus, even for systems with a small number of elements, the total number of possible designs is large. The space (hypercube) of possible designs is the design space of a technology. Technological innovation can then be understood as the movement of an agent (the designer) from its current location in the design space to a new location. Formally, this is equivalent to the mutation in biological organisms, which involves a move from one string (e.g., 00110) to another string (e.g., 10110) in genotype space.
Generally, technological innovation involves a move in design space and an improvement in performance. Thus, a designer searches the design space of a technology for strings with high performance or “fitness.” A trial-and-error search is an algorithm that randomly changes one or more elements (from 0 to 1, or vice versa), evaluates whether the fitness of the newly found string exceeds the fitness of the old string, and moves the element to the new string if the fitness can be improved. If the designer searches myopically [29], the innovation involves the mutation of only one element at the time. In other words, in a myopic search, a designer searches only in the direct neighborhood of the present design, where the neighborhood is the subset of strings that can be reached by a mutation in one element. A trial-and-error search will stop once a designer finds a string with a fitness that exceeds the value of its neighboring strings. Using the metaphor of a fitness landscape that maps the fitness values onto the strings in the design space, a myopic search stops at a peak in the landscape, which may only be locally optimal and not globally optimal, and requires a string to have the highest fitness of all strings in the design space [30].
2.1.2. Complex Networks
A second body of recent literature addresses how and to what extent network relations between innovating agents affect the rate of innovation and diffusion (for an extended survey, see Cowan, 2004 [11]). As with fitness landscape models, one can distinguish between models of exogenous networks and models of endogenous formation of network structures. More generally, the economics of networks has become an important topic of research as it relaxes some of the crude assumptions underlying mainstream economics.
In the context of technological innovation, for example, studies have been conducted on coalitions, research and development (R&D) alliances, and innovation networks [31,32,33,34,35,36].
Apart from networks defined at the level of agents, such as firms, the concept of networks is also applicable to technologies, referred to as network technologies, in particular, information and transportation infrastructures (e.g., airports, railways, Internet). We will discuss a model of complex network technologies when discussing endogenous network formation.
2.1.3. Percolation
2.2. Identification of Weak Signals and Signal Tracing
A well-known concept for implementing an early warning system used in strategic planning that focuses on the identification of signals, specifically weak signals, was introduced by Ansoff (1975) [40]. Signals are defined as events, such as future trends, changes, or further emerging phenomena, that have a specific impact on a given target [28]. This can be used to distinguish between strong signals and weak signals. A strong signal influences a target at present above a specific threshold and is also expected to influence the target in the future [41]. In contrast to this, a weak signal has a small to nonexistent impact on a target at present but will possibly influence the target in the future [25].
Thus, the identification of weak signals helps decision makers be aware of events in advance that may influence future decisions [42]. A further definition of weak signals describes them as unstructured information that have low content value at present but do have aspects of being an opportunity or threat without a specific target [43]. If the content information becomes more concrete by determining the impact of the opportunity or threat on a specific target, then a weak signal becomes a strong signal [44].
Many websites, news articles, and blogs mention strong signals because their impact on a specific target is already known. Thus, strong signals that influence a specific target occur frequently on the Internet. In contrast to this, weak signals occur less frequently on the Internet because they do not influence a target and, thus, are not attractive for discussion. However, this might be due to the small number of authors who recognize the future influence of a weak signal and describe it, and these few documents are among the large amount of information available on the Internet. The identification of these documents and, thus, the identification of weak signals is difficult and many practical approaches fail because of this information retrieval problem [27].
Literature introduces two approaches specifically built to identify weak signals within the large amount of Internet information. A knowledge structure clustering approach is introduced by Tabatabei (2011) [25], and a semantic clustering approach is introduced by Thorleuchter and Van den Poel (2013) [26]. Both approaches use document collection from the Internet at a specific point in time. However, they do not use a time series. A time series is defined as sequences of data chronologically arranged [45]. Several methodologies exist for analyzing time series, such as the use of regression analysis for time series forecasting [46] and the use of pattern recognition for time series clustering [47]. These methodologies are applied in several fields, including statistics, signal processing, and weather forecasting. The advantage of a time series is that events can be traced over time and, thus, event changes can be identified. This may also be useful for tracing weak signals on the Internet.
In today’s competitive business environment, the “future” is more important because it can be directly connected with the identification of promising long-term business opportunities [24]. Various methods for identifying future business opportunities exist, such as customary approaches [48] and weak signal analysis [42,49,50]. Among these approaches, weak signal analysis has received much attention as a method for analyzing businesses with an uncertain future. In studies about the future, it has been concluded that the future cannot be forecasted by past inertia and is transformed discontinuously by interrupting events [51].
However, scanning weak signals has relied heavily on the intuitive insight of experienced experts, whose services may be costly, not widely available, and subjective. Furthermore, information sources, including scientific articles, news, and blogs, are increasing exponentially, so it is unreasonable to rely only on experts to scan weak signal topics for business intelligence.
3. Methodology
In previous studies, the three-dimensional model by Hiltunen (2008) [21] that conceptually describes the conditions of weak signals by combining signal, issue, and interpretation in the concept of the “future sign” was adopted to detect signals quantitatively. Building on this model, we consider weak signals as emerging topics related to words that were not selected as the keywords for articles. For example, if the growth rate of the frequency of a word is odd, then the word relates strongly to future unfamiliar and unusual issues.
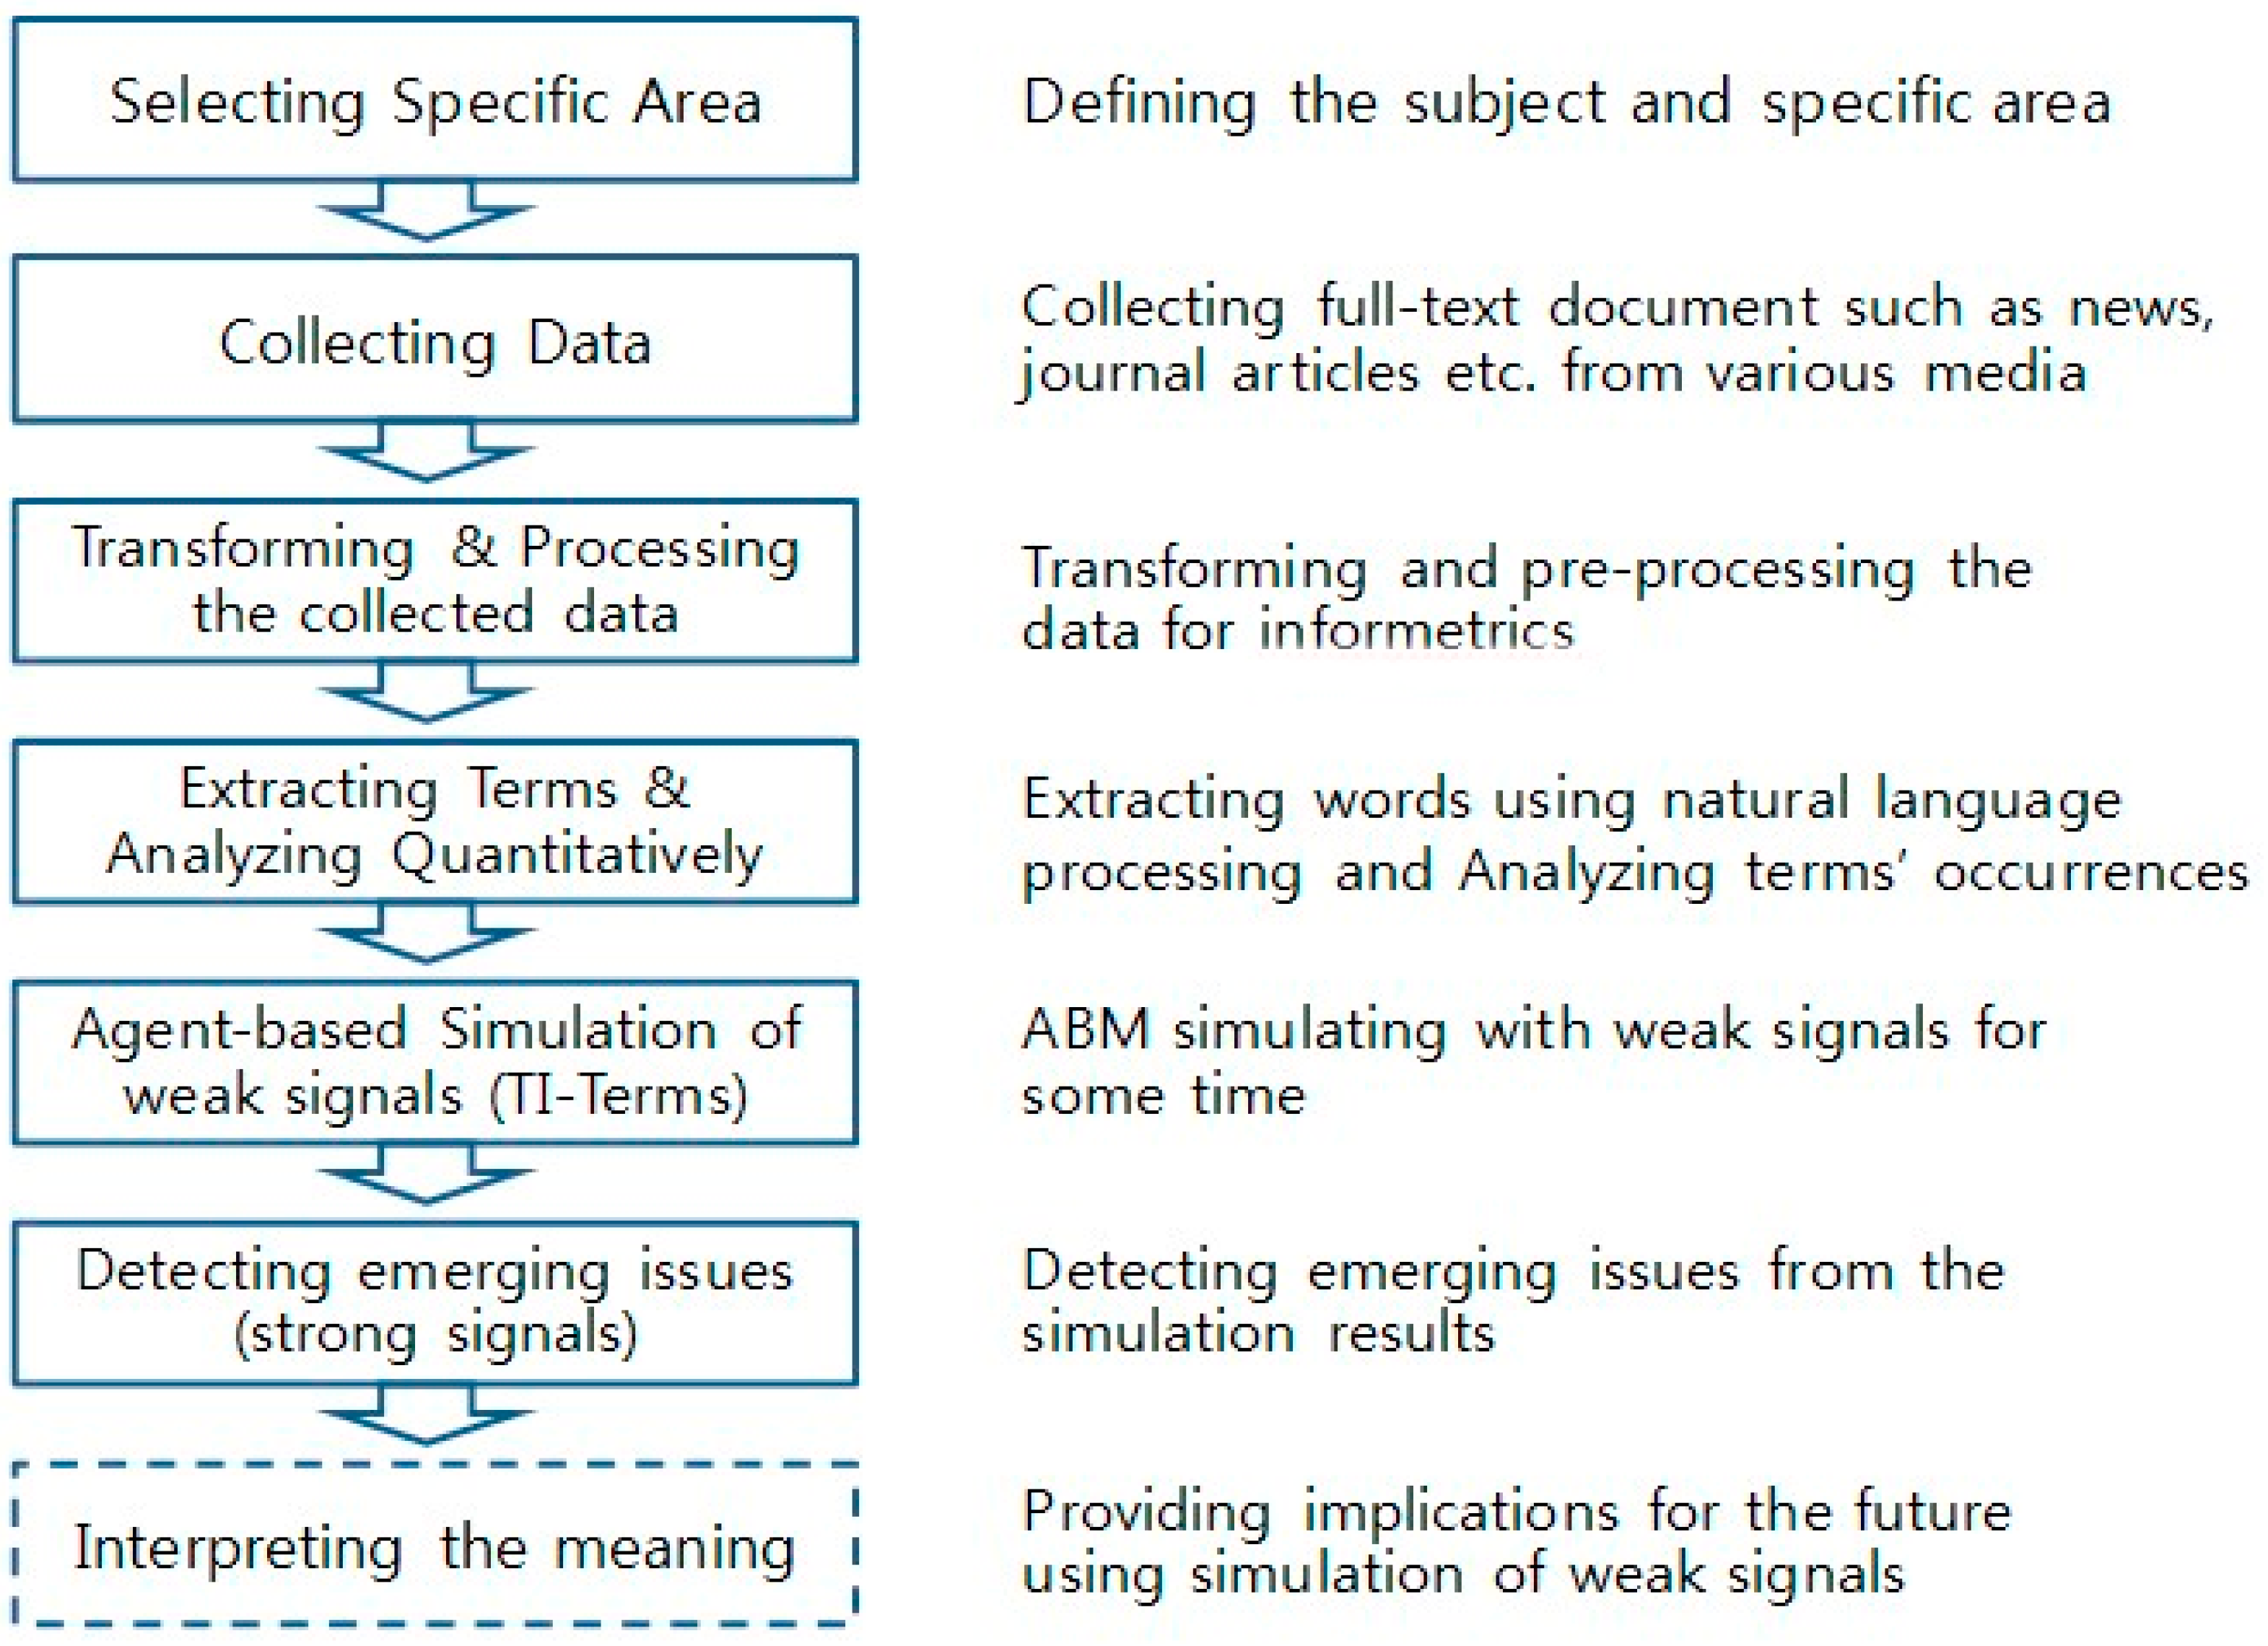
The method proposed in this paper (Figure 2) identifies concepts that have a strong possibility of being weak signals, both quantitatively and automatically. Therefore, this paper describes the text-mining procedure “informetrics” for exploring weak signals. This proposed quantitative procedure generates the criteria of the growth rate of the occurrence of terms. This automated method is expected to complement the expert-based approaches. Further, it can be used to analyze large amounts of information (e.g., unstructured web data).
In this study, we use the agent-based model of the cultural dissemination model [52], and culture is regarded as a group of weak signals of TI-terms. We define weak signals as TI-terms, which are then categorized as emerging issues after a given period of simulation.
The culture dissemination model has the following three principles [52].
- Agent-based modeling: Mechanisms of change are specified for local actors, and the consequences of these mechanisms are examined to discover the emergent properties of the system when many actors interact. Computer simulation is especially helpful for this bottom-up approach, but its use predates the availability of personal computers.
- No central authority: Consistent with the agent-based approach is the lack of a central coordinating agent in the model. Although important aspects of cultures can be standardized, canonized, and disseminated by powerful authorities, the present model deals with the process of social influence before or alongside the actions of such authorities. It seeks to understand how much culture emergence and stability can be explained without resorting to the coordinating influence of centralized authority.
- Adaptive rather than rational agents: The individuals are assumed to follow simple rules about giving and receiving influence. These rules are not necessarily derivable from any principle of rational calculation based on costs and benefits, or forward-looking strategic analysis typical of the game theory. Instead, the agents simply adapt to their environment.
Culture is considered to have social influence. For our purpose, the emphasis is not on the content of a specific culture but rather on the way in which a culture is likely to emerge and spread. Thus, the model assumes that an individual’s culture can be described in terms of their attributes, such as language, religion, technology, and style of dress [53]. Similarly, in this study, an individual’s TI-terms (pre-weak signals) have agent actor attributes, such as factors from the technological innovation process.
Axelrod (1997) [52] showed how tendencies toward the local convergence of cultural influence can preserve cultural diversity if the influence is combined with homophilly, the principle that “likes attract.” We argue that the central implications of this model may change profoundly if integrated with social influence, as assumed by earlier generations of modelers who did not consider homophilly.
The ABM (agent-based model) for market needs management is based on a partial correlation between each factor signal. At each time step, the probability of each needs signal is calculated, which depends on the total activation of neighboring nodes in the previous period as well as the specific parameters [54].
4. Text Mining Analysis of Technological Innovation: Case Study
4.1. Data Collection
Nanotechnology (NT) was selected as our specific subject area, which concerns “technological convergence.” Nanotechnology is more appropriately described as the “nanotechnology-converged industry,” a combination of traditional and high-tech industries categorized according to specific applications, such as Information Technology (IT), Bio Technology (BT), Environment Technology (ET), Space Technology (ST), and Culture Technology (CT).
For this study, full-text information from articles from the specialized Journal of the Korean Ceramic Society were used to explore weak signals of nano-materials in the nanotechnology area. The journal has a long history (50+ years) of publishing information relevant to this field.
There were 130 article titles between 2008 and 2012 with references to nanotechnology, and 50 were extracted for analysis. As mentioned, it is useful to rely on a broad amount of recent information to explore weak signals for predicting the future. Especially in technology, articles, proceedings, letters, and conference materials are relevant sources of information; however, this study’s research regarding weak signals focused on findings published by specialized academic journals [55].
4.2. Processing Data
Using a morphological analyzer (morpheme analyzer), terms were extracted for quantitative analysis based on the full texts that focused on nano-materials. Since extracted words included those with general meanings, these were deleted from the data selected for analysis. Then, terms with similar meanings were refined and pre-arranged.
The occurrences of the extracted and refined words were shown in a matrix and the growth rate for the occurrence of each word (grade) were measured. A weak signal appears rarely and becomes stronger when merged with surrounding environments. Thus, the growth rates of the terms can be significant indicators of future forecasting because the more occurrence of terms are likely to evolve into more important concepts.
4.3. Quantitative Analysis of Searching Weak Signals
Most of the terms used in the full-text articles focused on nano-materials, not the author’s keywords, and were divided, extracted, and the occurrence were measured. General terms were eliminated and terms with similar meanings were classified into groups with representative names.
Using the occurrences generated by this process, the annual growth rates of the occurrences of the terms were measured. For reference, the annual occurrences were measured by the total counts of the extracted terms annually. To recognize the changes in nano-material fields, the number of occurrences of the extracted terms were divided by the total number of annually published articles and then normalized into the occurrences per article.
Strictly speaking, the annual growth rates of the normalized occurrences reflect the changes in the average occurrences of terms per article. Numerous gaps between the measured and normalized figures can be indicative of future change. Certain findings from the measured results are shown in Table 1.
5. Structure of the Simulation Model
5.1. Innovation Indicators
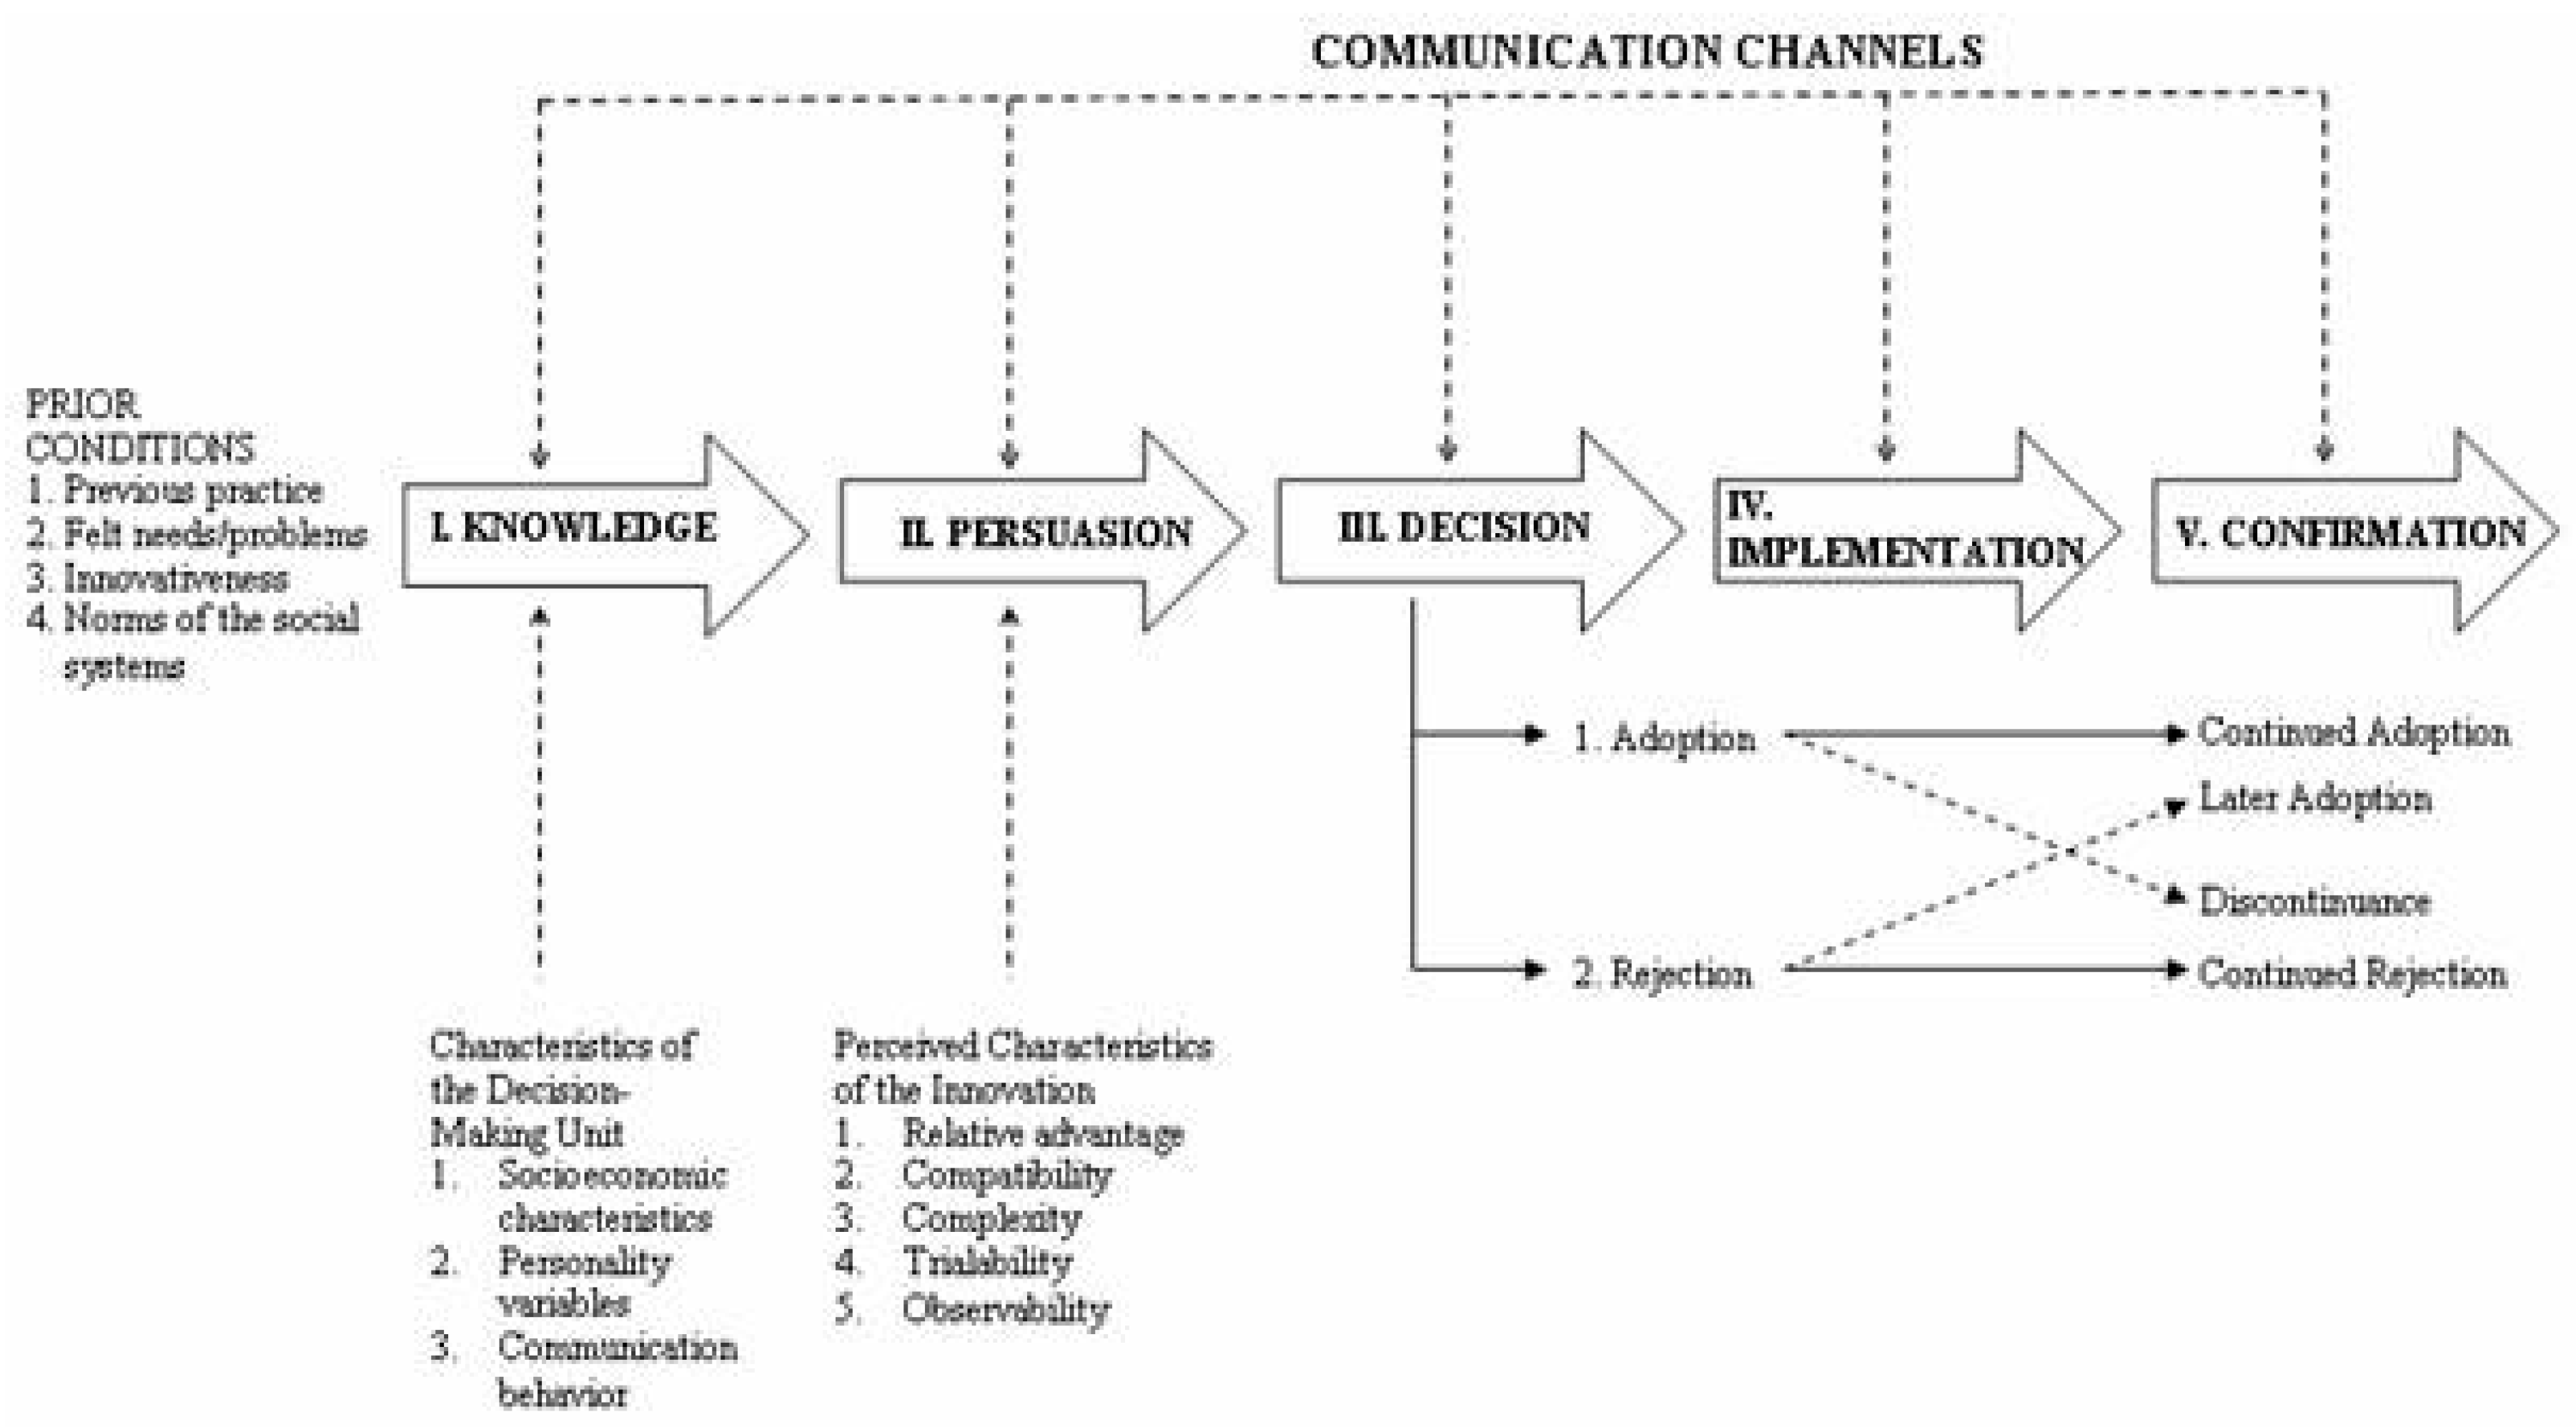
The study of new media adoption is based on the innovation diffusion theory [56]. The innovation diffusion theory has been used as a framework to analyze innovation diffusion in society and innovation adoption at the individual level. The innovation diffusion theory analyzes the causes of differences in the time of employment and the rate of innovation diffusion of new ideas. Empirical studies based on the innovation diffusion theory reveal that the characteristics needed to recognize innovation are the most influential factor concerning innovation adoption [56]. In other words, the characteristics needed to recognize innovation have higher explanatory power than consumer-related characteristics. Various studies based on the innovation diffusion theory have results showing five typical characteristics concerning the adoption of innovation, as shown in Figure 3 [57,58,59].
First, relative advantage describes innovations that provide benefits and value superior to existing products and services. Second, compatibility refers to the degree recognized to meet needs, experience, and existing values. Third, trialability means the ability to experience products and services prior to the adoption of the innovation. Fourth, observability means the degree of the results of adopting the innovation can be confirmed. Fifth, complexity refers to the degree to which the technological innovation can be understood. These five characteristics are used to determine the most important factors that can explain about 50 percent of the diffusion rate of an innovation.
Rogers (2003) [56], among others, explained that relative advantage and compatibility are particularly important in describing the adoption of innovations. The results of a meta-study on innovation characteristics and innovation adoption show that relative advantage, compatibility, and complexity exhibit a high degree of explanatory power concerning innovation adoption.
5.2. Design of the Simulation Model
5.2.1. Netlogo Model: Axelrod’s Cultural Dissemination
The Axelrod model of cultural dissemination is an agent-model designed to investigate the dissemination of culture among interacting agents on a society. The Axelrod model consists of a population of agents, each occupying a single node of a square network the size L. The culture of an agent is described by the vector of F integer variables called “features.” Each feature can assume q values between 0 and q − 1. In the original Axelrod model, the interaction topology is regular bounded (non-toroidal) and each agent can interact only with its four neighbors (von Neumann neighborhood).
The dynamics of the model are based on two main mechanisms: (1) agents tend to choose culturally similar neighbors as interaction partners (homophilly), and (2) during interaction, agents influence each other such that they become more similar. The interplay of these mechanisms either leads to cultural homogeneity where all agents are perfectly similar, or to the development of a multicultural society with culturally distinct regions. The model allows for studying the likelihood of these two outcomes depending on the size of the population, the number of features of the agents, the number of traits (values) each feature can adopt, and the neighborhood size (interaction range).
5.2.2. Description of Simulation
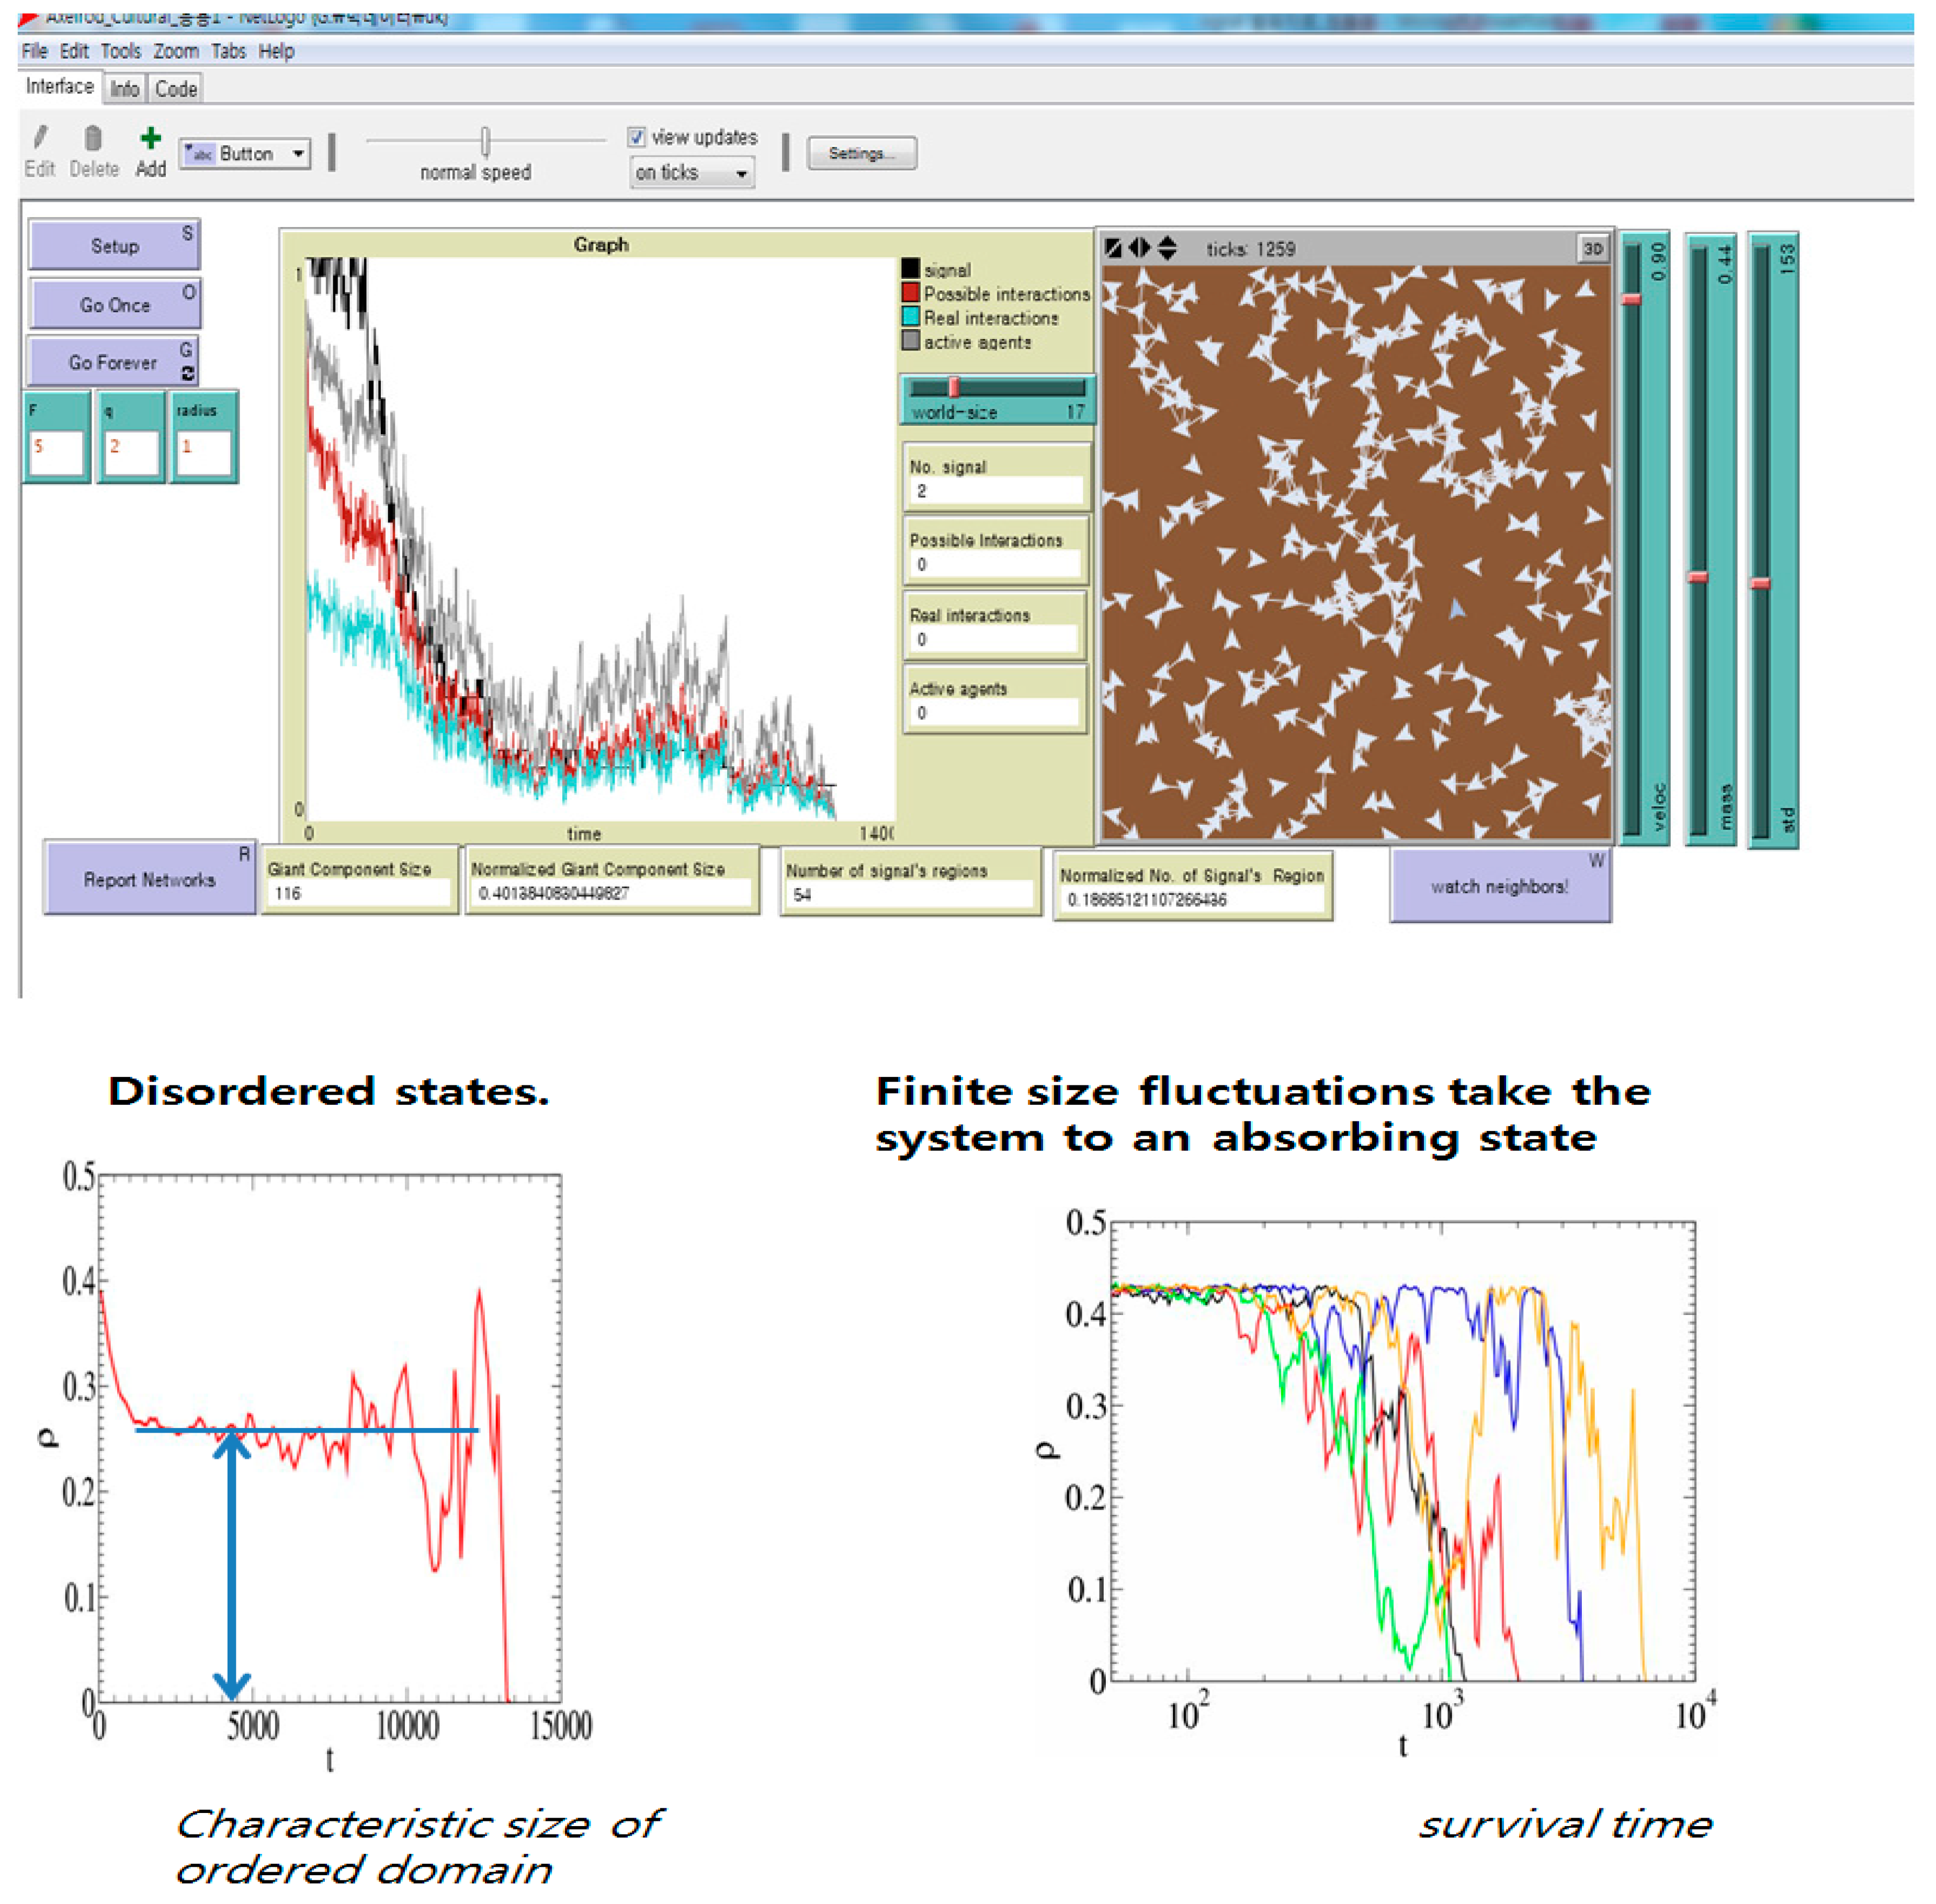
Each agent is located at a patch of the grid with a default shape (Figure 4). Agents have an F number of features, and each feature is a nominal variable that can adopt a certain number of values (called traits) from 0 to q − 1. Initially, agents adopt randomly chosen traits. However, we can modify randomly chosen traits to become given traits based on the extracted value of the text mining.
At each time step (tick), agents update their cultural value by asynchronous-random updating such that the computer makes a list where all agents are included in a random order and the list is followed until all agents are chosen. Each agent then becomes a focal agent and one of the focal agent’s neighbors is selected at random. Neighbor agents are those who are within a distance less than the value of the parameter “radius.” If the radius is equal to one, then it is von Neumann neighborhood. The cultural overlap between these two agents is computed, which is equal to the percentage of similar features. When the probability is similar to the overlap, the two agents interact. Otherwise, the program continues to the next agent until the list is exhausted and it follows the next time step.
An interaction consists of randomly selecting one feature where the two agents differ and changing the focal agent’s feature to the interaction partner’s trait. If the overlap is zero, an interaction is not possible, and the respective agents refuse to influence each other.
Each agent adopts a color to represent its culture. Once these parameters are set, we can begin the simulation and changes to the agent’s culture can be detected according to the color. Furthermore, a graph reports the number of cultures in the society and the number of possible and real interactions. A possible interaction occurs when agents share features, and a real interaction occurs when focal agents actually change the value of one of its features. The simulation stops when the number of possible interactions reaches zero, indicating that each agent shared trait values with its neighbors.
Upon completion of the simulation, the number of cultural regions in the population and the number of agents in the largest population (also normalized) are calculated. A region is a set of agents that have similar features. We included an extension of the Axelrod model and allowed the agents to move.
5.3. Simulation of Weak Signals
The attribute values of the terms by text mining can be derived from the term occurrences and its annual growth rate and standard deviation, such as Table 1. These attribute values are matched 1: 1 to the simulation agent and applied as the input values of radius, steplength, and angle for each agent, which affects the movement related to the interaction of the agent. Therefore, during the simulation, each agent operates on the input attribute value and changes each culture (features, traits) by the interaction to derive the final results (Table 2).
Although we set toroidal boundaries, the simulation can also function with the original non-toroidal boundaries. In this case, the four von Neumann neighbors have a radius distance of one, and the model permits changes to the value of the radius to explore the implications of other neighborhood sizes. The agents are also permitted to move. At the absorbing final state when calculating for the number of regions, the model creates different visible networks that include all neighbors with the same culture. When counting the number of cultural domains, two domains are considered different if they are not connected, even if agents in both domains share the same culture. It is important to note that two agents could have similar cultural values with zero overlap, causing the corresponding colors to be similar. Thus, it is important to verify whether the cultural values are the same.
5.4. Weak Signal Search and Interpretation
In the nano-material field, a weak signal search was conducted to investigate an indistinct signal, and this type of investigation differs from megatrends. Table 2 shows the set of terms that make up the stable culture regions derived by simulations. By analyzing the terms that make up the different stable culture regions in the end result, we can gain insight into which terms will develop in future, and analyzing the terms constituting the different stable culture region in the final result. It is thought that it will gain insight into whether or not it will evolve.
It was necessary to confirm the original sentences from the articles to discover the meanings of terms extracted from the full text. This also allowed us to verify the extracted terms with high growth rates and interpret their meanings.
This paper describes knowledge from the nanotechnology field, especially nano-materials, as being highly dynamic and representative of an increasing number of new fields. Such growth is coupled with a strong interrelationship among fields. Our results facilitate gathering insights, mainly from a scientific perspective, into the array of capabilities and competencies underpinning the R&D associated with the future generation of nanotechnology.
6. Conclusions
We explored the dynamic behavior of a weak signal of a specific technological innovation using the agent-based simulating tool NetLogo to provide a deeper understanding of the early stages of complex technology innovation.
We explored weak signals in the nano-material field, as such signals are insignificant but may be predictive of megatrends in support of R&D decision making for nano-material technologies. By searching weak signals to perceive future technology trends, the terms with high occurrence rates were extracted using informetric analysis to reinforce the prevailing expert-based detection method. It is likely that more meaningful interpretations of these extracted terms can be obtained through comparisons with the full texts. In addition, by applying the occurrency-related values of these terms to the attribute values of each agent of ABM, we gained insight into the future strong signals by dynamically understanding the resulting sets of terms through simulation.
For more realistic and evidence-based predictions of the future and a deeper understanding of technology innovation, it is necessary to aggregate weak signals in markets and surrounding environments, to simulate various innovation models, and to develop objective indicators for detecting weak signals based on unstructured S&T information from various sources, such as web information.
Acknowledgments
This research was supported by Korea Institute of Science and Technology Information (KISTI).
Author Contributions
Sun Hi Yoo developed the original idea for exploring and simulating weak signals of nanotechnology innovation and performed text mining. DongKyu Won made contribution in ABM simulations.
Conflicts of Interest
The authors declare no conflict of interest.
References
- Fisher, J.C.; Pry, R.H. A simple substitution model of technical change. Technol. Forecast. Soc. Chang. 1971, 3, 75–81. [Google Scholar] [CrossRef]
- Arthur, W.B. Competing technologies, increasing returns, and lock-in by historical events. Econ. J. 1989, 99, 116–131. [Google Scholar] [CrossRef]
- Bruckner, E.; Ebeling, W.; Jiménez Montãno, M.A.; Scharnhorst, A. Nonlinear stochastic effects of substitution—An evolutionary approach. J. Evolut. Econ. 1996, 6, 1–30. [Google Scholar] [CrossRef]
- Dalle, J.M. Heterogeneity vs. externalities in technological competition: A tale of possible technological landscapes. J. Evolu. Econ. 1997, 7, 395–413. [Google Scholar] [CrossRef]
- Bikhchandani, S.; Hirshleifer, D.; Welch, I. Learning from the behavior of others: Conformity, fads, and informational cascades. J. Econ. Perspect. 1998, 12, 151–170. [Google Scholar] [CrossRef]
- Winter, S.G. Schumpeterian competition in alternative technological regimes. J. Econ. Behav. Org. 1984, 5, 287–320. [Google Scholar] [CrossRef]
- Silverberg, G.; Verspagen, B. Learning, innovation and economic growth: A long-run model of industrial dynamics. Ind. Corp. Chang. 1994, 3, 199–223. [Google Scholar] [CrossRef]
- Klepper, S. Entry, exit, growth and innovation in the product life cycle. Am. Econ. Rev. 1996, 86, 562–583. [Google Scholar]
- Malerba, F.; Nelson, R.R.; Orsenigo, L.; Winter, S.G. History friendly models of industry evolution: The case of the computer industry. Ind. Corp. Chang. 1999, 8, 3–40. [Google Scholar] [CrossRef]
- Fagiolo, G.; Dosi, G. Exploitation, exploration and innovation in a model of endogenous growth with locally interacting agents. Struct. Chang. Econ. Dyn. 2003, 14, 237–273. [Google Scholar] [CrossRef]
- Cowan, R. Network Models of Innovation and Knowledge Diffusion, MERIT Research Memorandum RM2004-016. 2004. Available online: www.merit.unu.edu (accessed on 2 May 2013).
- Dawid, H. Agent-based models of innovation and technological change. In Handbook of Computational Economics II: Agent-Based Computational Economics; Tesfatsion, L., Judd, K., Eds.; 2004; in press. [Google Scholar]
- Pyka, A.; Fagiolo, G. Agent-Based Modelling: A Methodology for Neo-Schumpeterian Economics; Discussion Paper Series 272; Department of Economics, University of Augsburg: Augsburg, Germany, 2005. [Google Scholar]
- Llerena, P.; Lorentz, A. Alternative Theories on Economic Growth and the Co-Evolution of Macro-Dynamics and Technological Change: A Survey; LEM Working Paper 2003/28; Laboratory of Economics and Management (LEM): Pisa, Italy, 2004. [Google Scholar]
- Silverberg, G. Long waves: Conceptual, empirical and modelling issues. In The Elgar Companion to Neo-Schumpeterian Economics; Hanusch, H., Pyka, A., Eds.; Edward Elgar: Cheltenham, UK, 2003; Available online: www.merit.unu.edu (accessed on 2 May 2013).
- Windrum, P. Neo-Schumpeterian simulation models. In The Elgar Companion to Neo-Schumpeterian Economics; Hanusch, H., Pyka, A., Eds.; Edward Elgar: Cheltenham, UK, 2004; Available online: www.merit. unu.edu (accessed on 2 May 2013).
- Ansoff, I.H. Strategic Response in Turbulent Environments; Working Paper No. 82–35; European Institute for Advanced Studies in Management: Brussels, Belgium, 1982. [Google Scholar]
- Ansoff, I.H. Implanting Strategic Management; Prentice Hall: Englewood Cliffs, NJ, USA, 1984. [Google Scholar]
- Thorleuchter, D.; Scheja, T.; Van den Poel, D. Semantic weak signal tracing. Expert Syst. Appl. 2014, 41, 5009–5016. [Google Scholar] [CrossRef]
- Ansoff, I.H. Contrib Title: Strategic issues management. Strateg. Manag. J. 1980, 1, 131–148. [Google Scholar] [CrossRef]
- Hiltunen, E. The future sign and its three dimensions. Futures 2008, 40, 247–260. [Google Scholar] [CrossRef]
- Decker, R.; Wagner, R.; Scholz, S.W. An internet-based approach to environmental scanning in marketing planning. Mark. Intell. Plan. 2005, 23, 189–200. [Google Scholar] [CrossRef]
- Uskali, T. Paying attention to weak signals: The key concept for innovation journalism. Innov. J. 2005, 2, 19. [Google Scholar]
- Yoo, S.H.; Park, H.W.; Kim, K.H. A study on exploring weak signals of technology innovation using informetrics. J. Technol. Innov. 2009, 17, 109–130. [Google Scholar]
- Tabatabei, N. Detecting Weak Signals by Internet-Based Environmental Scanning. Master’s Thesis, Waterloo University, Waterloo, Belgium, 2011. [Google Scholar]
- Thorleuchter, D.; Van den Poel, D. Weak signal identification with semantic web mining. Expert Syst. Appl. 2013, 40, 4978–4985. [Google Scholar] [CrossRef] [Green Version]
- Schwarz, J.O. Pitfalls in implementing a strategic early warning system. Futures Stud. 2005, 7, 22–31. [Google Scholar]
- Yoon, J. Detecting weak signals for long-term business opportunities using text mining of web news. Expert Syst. Appl. 2012, 39, 12543–12550. [Google Scholar] [CrossRef]
- Atkinson, A.B.; Stiglitz, J.E. A new view of technological change. Econ. J. 1969, 79, 573–578. [Google Scholar] [CrossRef]
- Frenken, K. Technological Innovation and Complexity Theory. Econ. Innov. New Technol. 2006, 15, 137–155. [Google Scholar] [CrossRef]
- Axelrod, R.; Mitchell, W.; Thomas, R.E.; Bennett, D.S.; Bruderer, E. Coalition formation in standard-setting alliances. Manag. Sci. 1995, 41, 1493–1508. [Google Scholar] [CrossRef]
- Duysters, G.; Hagedoorn, J. Internationalization of corporate technology through strategic partnering: An empirical investigation. Res. Policy 1996, 25, 1–12. [Google Scholar] [CrossRef]
- Powell, W.W.; Koput, K.W.; Smith-Doerr, L. Interorganizational collaboration and the locus of innovation: Networks of learning in biotechnology. Adm. Sci. Quart. 1996, 41, 116–145. [Google Scholar] [CrossRef]
- Hagedoorn, J. Inter-firm R&D partnerships: An overview of major trends and patterns since 1960. Res. Policy 2002, 31, 477–492. [Google Scholar]
- Pyka, A.; Kuppers, G. (Eds.) Innovation Networks: Theory and Practice; Edward Elgar: Cheltenham, UK, 2002. [Google Scholar]
- Breschi, S.; Lissoni, F. Mobility and Social Networks: Localised Knowledge Spillovers Revisited; Working Paper 142; Comercial University of Luigi Bocconi: Milano, Italy, 2003. [Google Scholar]
- Stauffer, D.; Aharony, A. Introduction to Percolation Theory; Taylor and Francis: London, UK, 1994. [Google Scholar]
- Grebel, T. Entrepreneurship: A New Perspective; Routledge: London, UK; New York, NY, USA, 2004. [Google Scholar]
- Silverberg, G.; Verspagen, B. A percolation model of innovation in complex technology spaces. J. Econ. Dyn. Control 2005, 29, 225–244. [Google Scholar] [CrossRef]
- Ansoff, I.H. Managing strategic surprise by response to weak signals. Calif. Manag. Rev. 1975, 18, 21–33. [Google Scholar] [CrossRef]
- Mendonca, S.; Cardoso, G.; Caraca, J. The strategic strength of weak signal analysis. Futures 2012, 44, 218–228. [Google Scholar] [CrossRef]
- Kuosa, T. Futures signals sense-making framework (FSSF): A start-up tool to analyse and categorise weak signals, wild cards, drivers, trends, and other types of information. Futures 2010, 42, 42–48. [Google Scholar] [CrossRef]
- Mendonca, S.; Pina e Cunha, M.; Kaivo-oja, J.; Ruff, F. Wild cards, weak signals and organisational improvisation. Futures 2004, 36, 201–218. [Google Scholar] [CrossRef]
- Holopainen, M.; Toivonen, M. Weak signals: Ansoff today. Futures 2012, 44, 198–205. [Google Scholar] [CrossRef]
- Hamilton, J.D. Time Series Analysis; Princeton University Press: Princeton, NJ, USA, 1994. [Google Scholar]
- Graff, M.; Escalante, H.J.; Cerda-Jacobo, J.; Gonzalez, A.A. Models of performance of time series forecasters. Neurocomputing 2013, 122, 375–385. [Google Scholar] [CrossRef]
- Rodpongpung, S.; Niennattrakul, V.; Ratanamahatana, C.A. Selective subsequence time series clustering. Knowl.-Based Syst. 2012, 35, 361–368. [Google Scholar] [CrossRef]
- Seol, H.; Lee, S.; Kim, C. Identifying new business areas using patent information: A DEA and text mining approach. Expert Syst. Appl. 2011, 38, 2933–2941. [Google Scholar] [CrossRef]
- Ilmola, L.; Kuusi, O. Filters of weak signals hinder foresight: Monitoring weak signals efficiently in corporate decision-making. Futures 2006, 38, 908–924. [Google Scholar] [CrossRef]
- Kerr, C.; Mortara, L.; Phaal, R.; Probert, D. A conceptual model for technology intelligence. Int. J. Technol. Intell. Plan. 2006, 2, 73–93. [Google Scholar] [CrossRef]
- Dator, J.A. Advancing Futures: Futures Studies in Higher Education; Praeger Publishers: Santa Barbara, CA, USA, 2002. [Google Scholar]
- Axelrod, R. The Dissemination of Culture: A Model with Local Convergence and Global Polarization. J. Confl. Resolut. 1997, 41, 203–226. [Google Scholar] [CrossRef]
- Flache, A.; Macy, M.W. Local Convergence and Global Diversity: From Interpersonal to Social Influence. J. Confl. Resolut. 2011, 55, 970–995. [Google Scholar] [CrossRef]
- Lim, J.Y.; Yoo, S.H.; Won, D.K. A Human-Needs-Based Dynamics to Simulate Technology Policy and Its Effects on Both Business Success and Human Happiness. Sustainability 2016, 8, 1225. [Google Scholar] [CrossRef]
- Yoo, S.H.; Won, D.K. Exploring Weak Signals of Technology Innovation of a Specific Area Using Informetrics. J. Next Gener. Inf. Technol. 2013, 4, 174–178. [Google Scholar]
- Rogers, E.M. Diffusion of Innovations, 5th ed.; Communication Books; Free Press: New York, NY, USA, 2003. [Google Scholar]
- Won, D.K.; Lim, J.Y.; Yoo, S.H. Study of an Agent-Based Model of Imagination and Development (I&D) for Innovation in the Creative Economy. Asia Pac. J. Innov. Entrep. 2013, 7, 93–111. [Google Scholar]
- Won, D.K.; Yoo, S.H.; Yoo, H.S.; Lim, J.Y. Complex adaptive systems approach to Sewol ferry disaster in Korea. J. Open Innov. Technol. Mark. Compl. 2015, 1, 22. [Google Scholar] [CrossRef]
- Yun, J.H.J.; Won, D.K.; Park, K.B. Dynamics from open innovation to evolutionary change. J. Open Innov. Technol. Mark. Compl. 2016, 2, 7. [Google Scholar] [CrossRef]
Figure 1.
Strengthening the future sign (Hiltunen, 2008) [21].
Figure 1.
Strengthening the future sign (Hiltunen, 2008) [21].

Figure 2.
Procedure for exploring weak signals.

Figure 3.
Innovation-decision process; Source: Rogers (2003) [56].
Figure 3.
Innovation-decision process; Source: Rogers (2003) [56].

Figure 4.
Agent-based Model simulation of weak signals.


Table 1.
Annual growth rates of the occurrences for extracted terms.
| Term | Annual Occurrences | Annual Occurrences (Normalization) | Annual Growth Rate | ||||||
|---|---|---|---|---|---|---|---|---|---|
| 09 | 10 | 11 | 12 | 09 | 10 | 11 | 12 | ||
| Carbon | 2 | 0 | 0 | 99 | 0.22 | 0.00 | 0.00 | 8.25 | 2.34 |
| Composite | 1 | 0 | 35 | 40 | 0.11 | 0.00 | 3.18 | 3.33 | 2.11 |
| Filler | 1 | 0 | 0 | 28 | 0.11 | 0.00 | 0.00 | 2.33 | 1.76 |
| Adsorption | 1 | 6 | 0 | 24 | 0.11 | 0.46 | 0.00 | 2.00 | 1.62 |
| Coating film | 3 | 0 | 38 | 70 | 0.33 | 0.00 | 3.45 | 5.83 | 1.60 |
| Calcination | 1 | 0 | 1 | 18 | 0.11 | 0.00 | 0.09 | 1.50 | 1.38 |
| Nanoparticles | 2 | 7 | 48 | 34 | 0.22 | 1.31 | 4.36 | 2.83 | 1.34 |
| Powder | 1 | 0 | 0 | 16 | 0.11 | 0.00 | 0.00 | 1.33 | 1.29 |
| Dispersion stability | 1 | 0 | 0 | 15 | 0.11 | 0.00 | 0.00 | 1.25 | 1.24 |
| Grain growth | 2 | 4 | 0 | 21 | 0.22 | 0.31 | 0.00 | 1.75 | 0.99 |
| Decomposition | 3 | 20 | 6 | 27 | 0.33 | 1.54 | 0.55 | 2.25 | 0.89 |
| Catalyst | 2 | 23 | 1 | 18 | 0.22 | 1.77 | 0.09 | 1.50 | 0.89 |
| Crystal grain | 4 | 13 | 14 | 34 | 0.44 | 1.00 | 1.27 | 2.83 | 0.85 |
| Low temperature | 1 | 7 | 0 | 8 | 0.11 | 0.54 | 0.00 | 0.67 | 0.82 |
| Chain | 1 | 2 | 1 | 8 | 0.11 | 0.15 | 0.09 | 0.67 | 0.82 |
| Microsphere | 1 | 1 | 0 | 7 | 0.11 | 0.08 | 0.00 | 0.58 | 0.74 |
| Liquid phase | 1 | 3 | 1 | 7 | 0.11 | 0.23 | 0.09 | 0.58 | 0.74 |
| Nanotube | 3 | 0 | 0 | 18 | 0.33 | 0.00 | 0.00 | 1.50 | 0.65 |
| Densification | 3 | 1 | 4 | 18 | 0.33 | 0.08 | 0.36 | 1.50 | 0.65 |
| Resin | 1 | 0 | 2 | 6 | 0.11 | 0.00 | 0.18 | 0.50 | 0.65 |
| Insulation | 1 | 0 | 0 | 6 | 0.11 | 0.00 | 0.00 | 0.50 | 0.65 |
| Chamber | 1 | 1 | 8 | 6 | 0.11 | 0.08 | 0.73 | 0.50 | 0.65 |
| Remain | 1 | 5 | 1 | 5 | 0.11 | 0.38 | 0.09 | 0.42 | 0.55 |
| Mass ratio | 1 | 0 | 1 | 5 | 0.11 | 0.00 | 0.09 | 0.42 | 0.55 |
| Penetration | 1 | 6 | 4 | 5 | 0.11 | 0.46 | 0.36 | 0.42 | 0.55 |
| Chemicals | 1 | 0 | 4 | 5 | 0.11 | 0.00 | 0.36 | 0.42 | 0.55 |
| Strength | 8 | 31 | 24 | 39 | 0.89 | 2.38 | 2.18 | 3.25 | 0.54 |
| Precipitate | 4 | 4 | 0 | 19 | 0.44 | 0.31 | 0.00 | 1.58 | 0.53 |
| Plasma | 16 | 48 | 14 | 65 | 1.78 | 3.69 | 1.27 | 5.42 | 0.45 |
| Gas | 1 | 5 | 4 | 4 | 0.11 | 0.38 | 0.36 | 0.33 | 0.44 |
| Bulk | 1 | 1 | 4 | 4 | 0.11 | 0.08 | 0.36 | 0.33 | 0.44 |
| Amorphous | 1 | 0 | 1 | 4 | 0.11 | 0.00 | 0.09 | 0.33 | 0.44 |
| Relative density | 1 | 1 | 0 | 4 | 0.11 | 0.08 | 0.00 | 0.33 | 0.44 |
| Biological | 1 | 0 | 0 | 4 | 0.11 | 0.00 | 0.00 | 0.33 | 0.44 |
| Fiber | 1 | 90 | 26 | 4 | 0.11 | 6.92 | 2.36 | 0.33 | 0.44 |
Note: Original terms were in Korean.
Table 2.
Words with possible strong signals.
| Category | Words * |
|---|---|
| 1 | low-temperature, insulation, plasma, mass ratio |
| 2 | Chain, precipitation, amorphous |
| 3 | Mass, filler, gas, biology, carbon, densification, absorption, spectrum, crystal |
| 4 | Bulk, process, induction, insulation, grain |
* Original terms were in Korean.
© 2018 by the authors. Licensee MDPI, Basel, Switzerland. This article is an open access article distributed under the terms and conditions of the Creative Commons Attribution (CC BY) license (http://creativecommons.org/licenses/by/4.0/).
Share and Cite
MDPI and ACS Style
Yoo, S.H.; Won, D. Simulation of Weak Signals of Nanotechnology Innovation in Complex System. Sustainability 2018, 10, 486. https://doi.org/10.3390/su10020486
AMA Style
Yoo SH, Won D. Simulation of Weak Signals of Nanotechnology Innovation in Complex System. Sustainability. 2018; 10(2):486. https://doi.org/10.3390/su10020486
Chicago/Turabian StyleYoo, Sun Hi, and DongKyu Won. 2018. "Simulation of Weak Signals of Nanotechnology Innovation in Complex System" Sustainability 10, no. 2: 486. https://doi.org/10.3390/su10020486
Note that from the first issue of 2016, this journal uses article numbers instead of page numbers. See further details here.