Article

Reducing Mobile Air Conditioner (MAC) Power Consumption Using Active Cabin-Air-Recirculation in A Plug-In Hybrid Electric Vehicle (PHEV)

1
University of California Riverside (UCR), Department of Mechanical Engineering, Riverside, CA 92521, USA
2
University of California Riverside, College of Engineering, Center for Environmental Research and Technology (CE-CERT), Riverside, CA 92521, USA
*
Author to whom correspondence should be addressed.
World Electr. Veh. J. 2018, 9(4), 51; https://doi.org/10.3390/wevj9040051
Submission received: 13 November 2018 / Revised: 11 December 2018 / Accepted: 12 December 2018 / Published: 19 December 2018

Abstract

:
Air conditioner power consumption accounts for a large fraction of the total power used by hybrid and electric vehicles. This study examined the effects of three different cabin air ventilation settings on mobile air conditioner (MAC) power consumption, such as fresh mode with air conditioner on (ACF), fresh mode with air conditioner off (ACO), and air recirculation mode with air conditioner on (ACR). Tests were carried out for both indoor chassis dynamometer and on-road tests using a 2012 Toyota Prius plug-in hybrid electric vehicle. Real-time power consumption and fuel economy were calculated from On-Board Diagnostic-II (OBD-II) data and compared with results from the carbon balance method. MAC consumed 28.4% of the total vehicle power in ACR mode when tested with the Supplemental Federal Test Procedure (SFTP) SC03 driving cycle on the dynamometer, which was 6.1% less than in ACF mode. On the other hand, ACR and ACF mode did not show significant differences for the less aggressive on-road tests. This is likely due to the significantly lower driving loads experienced in the local driving route compared to the SC03 driving cycle. On-road and SC03 test results suggested that more aggressive driving tends to magnify the effects of the vehicle HVAC (heating, ventilation, and air conditioning) system settings. ACR conditions improved relative fuel economy (or vehicle energy efficiency) to that of ACO conditions by ~20% and ~8% compared to ACF conditions for SC03 and on-road tests, respectively. Furthermore, vehicle cabin air quality was measured and analyzed for the on-road tests. ACR conditions significantly reduced in-cabin particle concentrations, in terms of aerosol diffusion charger signal, by 92% compared to outside ambient conditions. These results indicate that cabin air recirculation is a promising method to improve vehicle fuel economy and improve cabin air quality.

Graphical Abstract

1. Introduction

New government regulations have demanded an increase in automotive fuel economy (MPG—miles per gallon) to reduce dependency on imported oil for transportation [1,2]. This not only pushed automotive manufacturers to improve the efficiency of the powertrain design, but they also had to consider improving other components and systems in the vehicle. According to the U.S. Environmental Protection Agency (EPA), an increase of a fraction of a percent in vehicle fuel economy can have a significant impact on climate change [1]. The mobile air conditioner (MAC) is the largest consumer of accessory vehicle power. The compressors consume a significant portion of power from the engine, especially for automobiles with smaller engines, because the expectation for cooling rates are similar for vehicles with larger engines, assuming a similar cabin volume and number of passengers.
Reducing MAC power consumption is important for all types of cars, namely ICE (internal combustion engine) vehicles, HEVs (hybrid electric vehicles), PHEVs (plug-in hybrid electric vehicles), and BEVs (battery electric vehicles) to improve vehicle fuel economy and driving range per full fuel tank or charge. BEVs and PHEVs are more significantly influenced by MAC power consumption on vehicle fuel economy and driving range due to relatively smaller power capacity. MAC usage decreases fuel economy, increases tailpipe CO2 emissions per miles driven, and can drastically reduce battery electric vehicle (BEV) driving range. MAC operation can reduce BEV fuel economy by up to 35% [3].
Increasing MAC efficiency has become a priority for automotive manufacturers to improve overall fuel economy [4]. While automotive fuel economy ratings are now considering the MAC consumption in the SC03 and AC17 Federal Test Procedures (FTP), the standard FTP cycle does not account for any accessory power consumptions [5,6]. The SC03 cycle is the “air conditioning” cycle, which is part of the vehicle certification requirements for the Supplemental FTP [7].
Significant improvements have been made by automotive manufacturers in many parts of the MAC system. Modern vehicles are designed with thermostats, which allow passengers to set a desired cabin temperature and theoretically preventing over-cooling. Another improvement is by using variable electric AC compressors that can adjust for a partial load [8]. These steps help reduce the MAC power consumption once the temperature reaches set values. MAC power consumption can also be reduced by reducing AC pipe lengths, downsizing the compressor, and increasing the size of the condenser [9,10]. In addition, research by Farrington et al. and Shete proposed to minimize thermal loads for air conditioning by reducing the amount of fresh air brought in for ventilation [11,12]. The results show that by increasing the air recirculation ratio and a specific operating period, the cabin air temperature was 14% lower than that with fresh air mode. Unfortunately, most previous studies were carried out for conventional ICE vehicles, the results of which can be difficult to apply to PHEVs and BEVs.
Several researchers proposed to improve cabin air quality using cabin air recirculation systems by reducing the pollutant particle number concentrations [13,14,15,16,17]. Cabin air recirculation reduces the work that the MAC needs to do to extract the total heat from the air. Therefore, it can reduce the MAC power consumption and improve the vehicle’s fuel economy. Despite a number of papers reporting reduction of the MAC power consumption in various ways, there have not been any experimental attempts to quantify the effects of active cabin-air recirculation on the reduction of MAC power consumption. Monforte et al. predicted fuel savings of ACR using numerical simulations for the Fiat Punto, but they did not conduct any experiments [18]. It is also noteworthy that a few automobile manufacturers have already implemented some of the advantages of ACR ventilation settings described in this study in their production car. BMW had implemented automatic air recirculation to prevent passengers from exposure to outside air pollutants at high concentrations [19]. More recently, Toyota had implemented active air recirculation conditions to increase fuel economy in their 2017 Prius ECO driving mode [20].
Southern California and the majority of the Pacific Southwest region are typically hot, dry, and sunny, which leads to more widespread MAC usage. Nearly half of all PHEVs sold in the U.S. in 2014 were in California [21]. A recent report found that drivers in California use MAC 29% of the time [22]. Due to a hotter climate, drivers in Nevada, Arizona, and Hawaii have higher MAC usage of 38%, 54%, and 70% of the time, respectively [23]. Lighter and smaller BEVs optimized for better city fuel economy may consume larger fractions of battery power for MAC [24]. In this study, reduction of MAC power consumption by using active cabin air recirculation was investigated. A PHEV was chosen as the test vehicle because it gave insights into both charge depletion mode and charge sustaining mode.
The goal of this study is to evaluate the impact of cabin air recirculation on the power consumption of the MAC during the operation of the AC automatic cooling mode, that is, climate control, for a PHEV. The current study will also present the benefits of using recirculation during on-road highway driving conditions by the reduction of in-cabin particle concentrations.

2. Experiment

2.1. Instruments

The primary instrument used to monitor the vehicle’s status was an OBDII scan tool (OBD PROS, Smart Switch) that queries 16 different parameters per second. The data from the OBDII scan tool were recorded with software developed by UC Riverside College of Engineering Center for Environmental Research and Technology (CE-CERT), called Mobile Energy Emission Telematics System, or M.E.E.T.S [25]. The current version of the software was optimized to reduce computer CPU load and increase battery life. Parameter identifications (PIDs) were queried and recorded at 0.5 to 1 Hz. For the tests, several SAE Standard J1979 defined PIDs were used along with several Toyota defined PIDs (Table 1). The primary parameters monitored were the voltages of the battery block, battery amperage, vehicle speed, battery state of charge (SOC), and AC power consumption. Other studies have shown that OBDII PIDs can effectively measure fuel economy [26]. The current study was done using a Prius model year 2012. Toyota defined PIDs are no longer available for the model year 2016 and 2017. It is expected that more PIDs will be available for BEVs and HEVs by 2020 as OBD-II regulations evolve.
An electrical aerosol detector (EAD) (TSI, model 3070A) was used to measure active particle surface area concentration of the in-cabin on a series of highway tests. This instrument gives a quantitative measurement of in-cabin air quality. Most previous studies conducted on-road particle measurements using a condensational particle counter (CPC). While the CPC conducts a very sensitive measurement, it often saturates and fails to report high concentrations of the particles on-road. An additional dilution is required to use a CPC, and the wet operation of using working fluid makes it disadvantageous compared to an EAD, which operates in dry conditions. The EAD measures aerosol concentration based on diffusion charging. Particles are charged by a diffusion charger and charges carried by the particles are quantified by an electrometer. The EAD response can be expressed in femtoampere (fA) as raw signals or particle concentrations in mm/cm3. EAD is known to measure diameter concentrations because of the length unit in particle concentrations. However, that is an incorrect statement in a rigorous term. The unit should have been mm1.13/cm3, as the response of EAD correlates with electrical mobility diameter to the power of 1.13 instead of 1 for the size range of 0.01–1 µm [28,29].

2.2. Vehicles

A 2012 Prius PHEV was used in this study, which had an Atkinson cycle gasoline engine (1.8 L, I-4, and 73 kW) that can produce 142 N·m torque. It also had a 60 kW permanent magnet AC synchronous motor that can produce 59.7 kW and 207 N·m torque. The combination of the internal combustion engine and the electric motor can produce a total of 100 kW with an estimated combined fuel economy of 50 MPG with gas only, and 95 MPGe with gas and a plug-in battery [30]. Electrical energy is stored in a 4.4 kWh lithium-ion battery pack. The Prius was selected because it was the top-selling hybrid vehicle in the U.S. market at the time. The plug-in model had both HEV and BEV modes, which had a BEV range of 27.8 km [31]. The Prius has been shown to perform more efficiently than other similar vehicles because of the Atkinson cycle engine and the electric scroll compressor [32]. The electric scroll compressor uses a compression mechanism that automatically adjusts the scroll pressure. This reduces the frictional resistance of the compression section and MAC power consumption by 8% over earlier models.

2.3. Tests

This study varied AC on/off, air recirculation on/off, and outside temperature. The AC and air recirculation were varied in three modes: ACO, ACR, and ACF. The fresh air setting is defined as when the ambient external air is blown directly into the cabin through a cabin air filter. While the ventilation was set as fresh air mode, the AC and blower were off in ACO mode. The AC was set to automatic mode at a temperature setting of 22.2 °C (72 F) and the cabin air ventilation was set to recirculate in ACR mode. The automatic mode controls the blower fan speed. ACF mode consisted of the AC being set to automatic mode at a temperature setting of 22.2 °C (72 F) and the air set to fresh air mode.

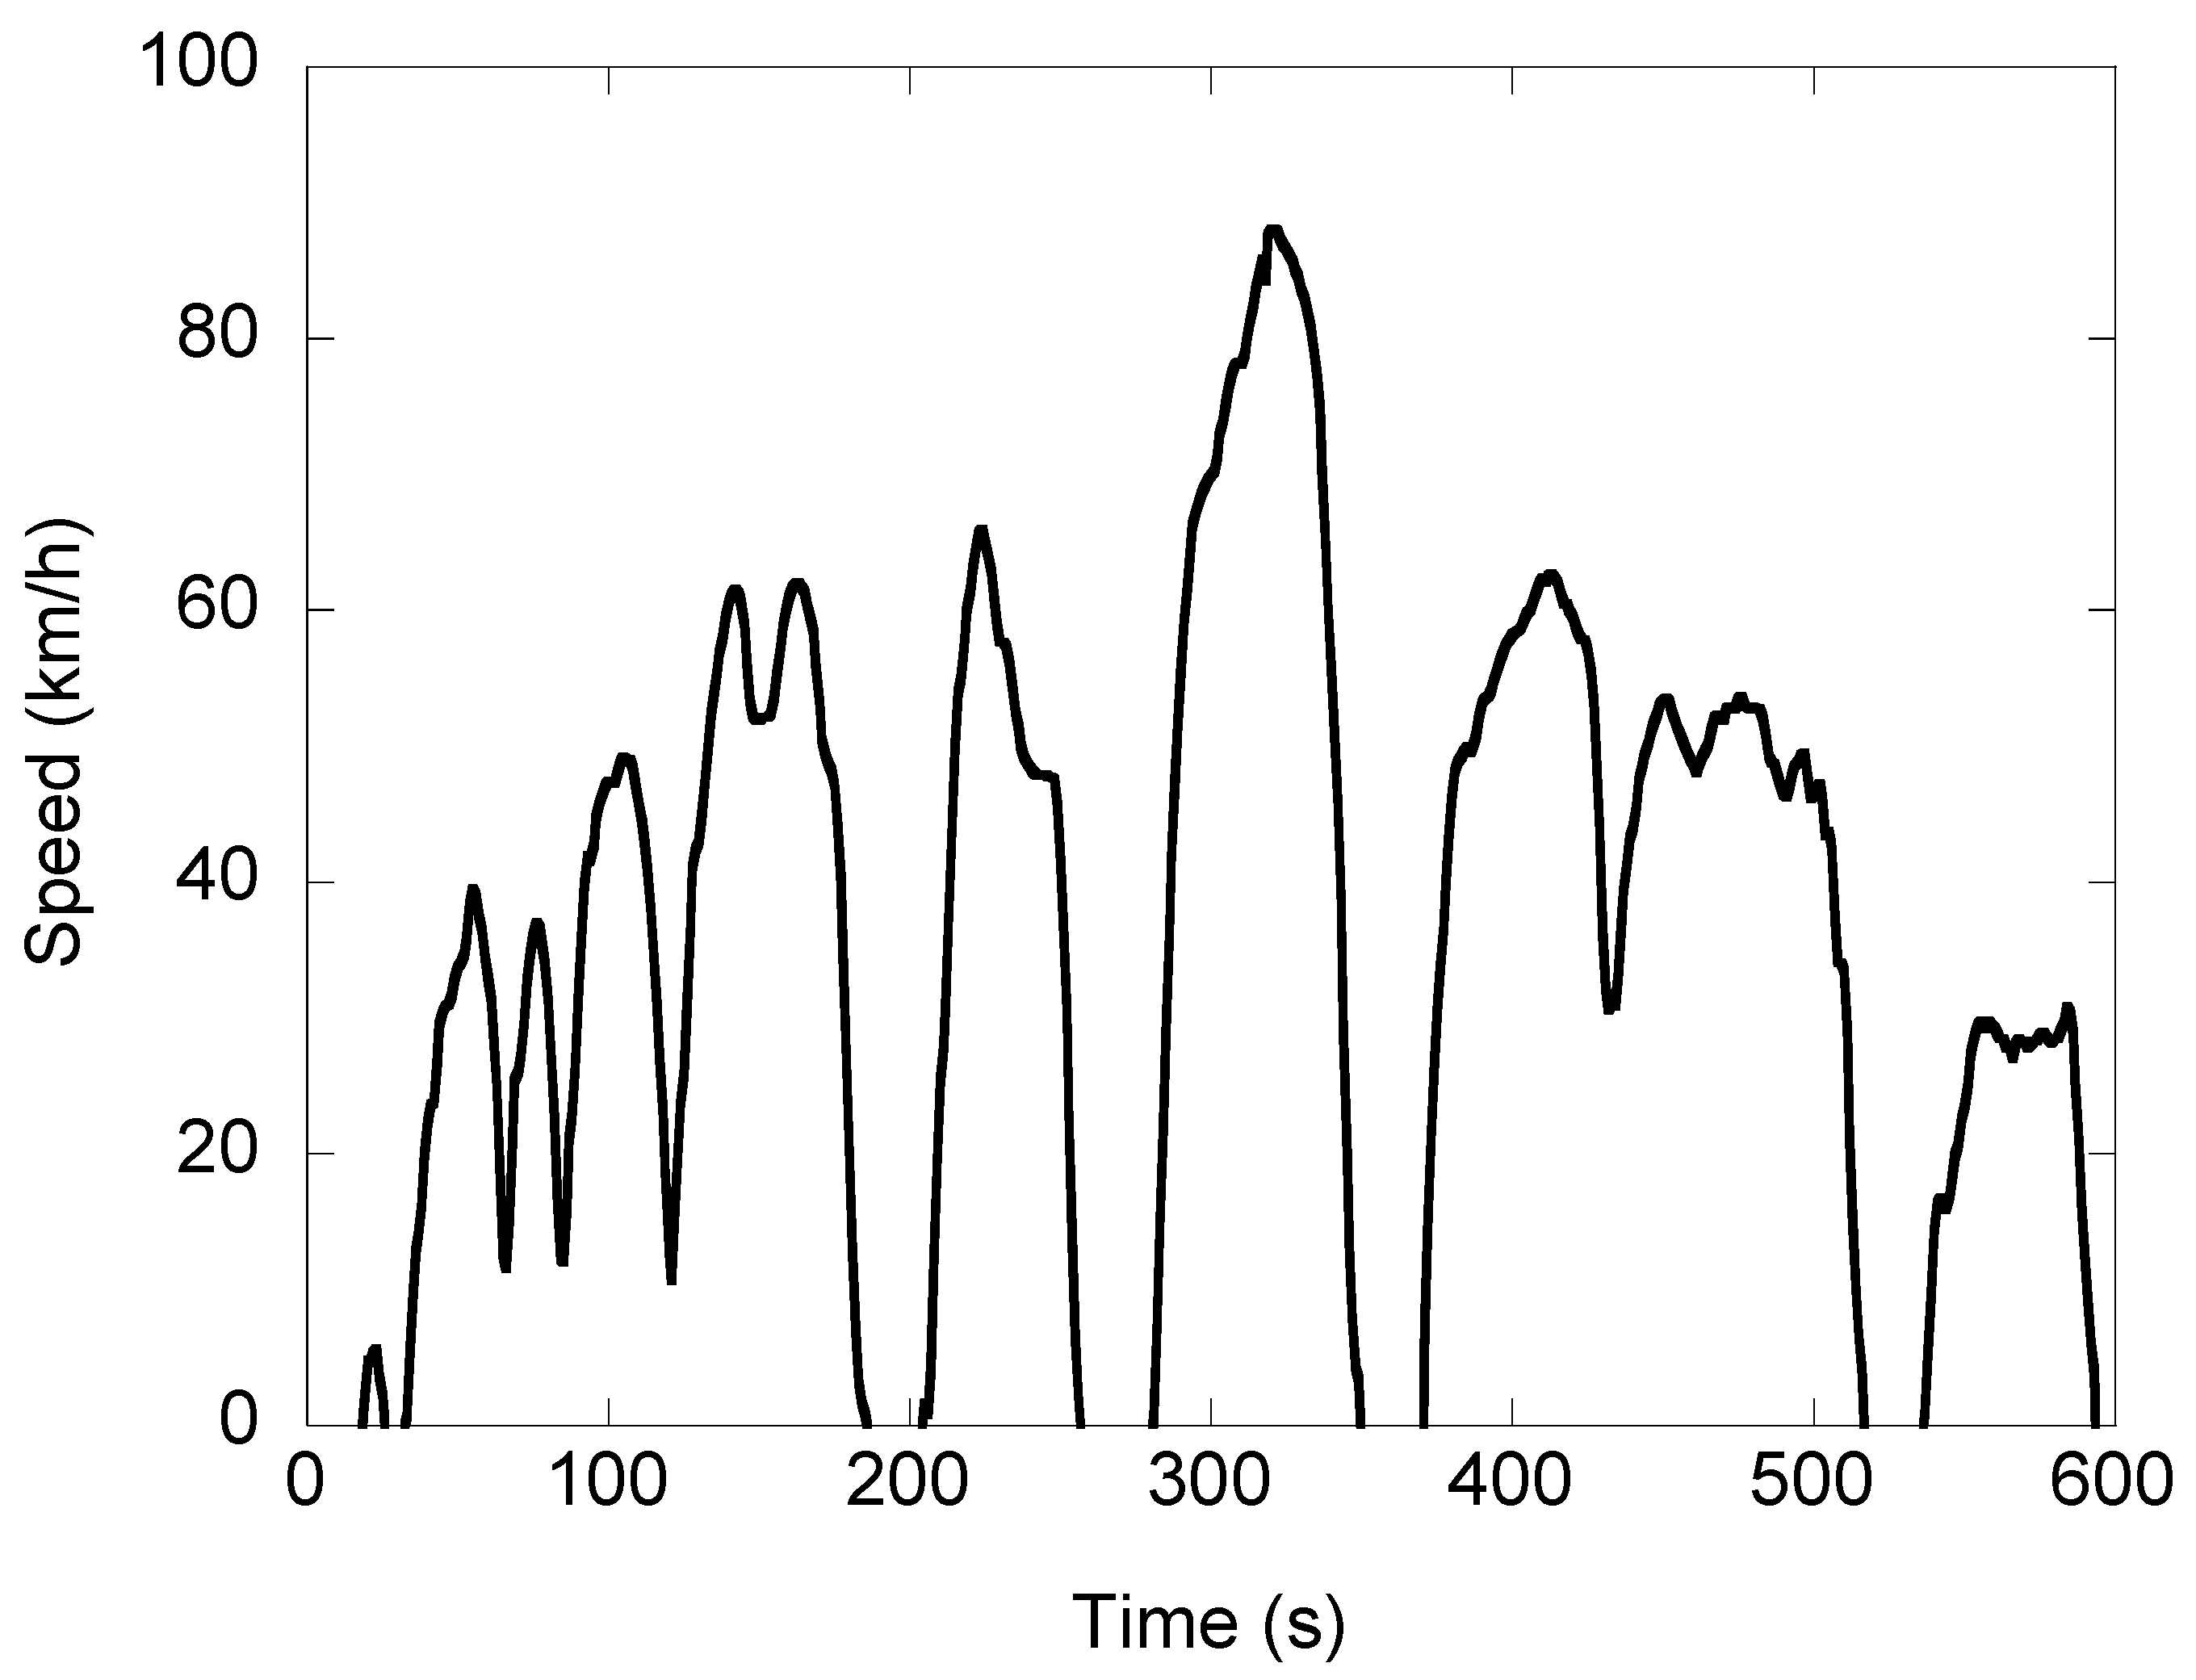
2.3.1. Fuel Economy and MAC Power Consumption Test in the Lab: SC03 cycle

SC03 (Figure 1) is a U.S. EPA driving cycle [33], which was used to test the Prius on a chassis dynamometer in UC Riverside’s Vehicle Emission Research Laboratory (VERL) at CE-CERT. VERL is equipped with a Burke E. Porter 48-inch single-roll electric dynamometer, a Constant Volume Sampling (CVS) tunnel, Pierburg AMA-2000 Exhaust Emissions Measuring System to measure gaseous species (CO2, NOx, THC), and CFR compliant PM sampling system. SC03 drive cycle was chosen because it has high accelerations, decelerations, and requires the use of the vehicle’s air conditioner.
The Federal Test Procedures provide detailed descriptions of all test conditions and methods [34]. The three general settings were closed windows, automatic air conditioning thermostat set to 22 °C, and recirculation flap adjusted between all recirculation and all fresh. The vehicle was soaked with a minimum of 12 h overnight inside the lab before testing. The vehicle was preconditioned by driving at 80.5 km/h (50 mph) for 20 min followed by three SC03 driving schedules on the dynamometer. The first set of three SC03 tests began immediately after the preconditioning. Each set of three SC03 driving cycles featured a random sequence of ACO, ACR, and ACF conditions to prevent possible systematic bias from lab air temperature control. In between the two sets of three SC03 driving schedules was a 30 min hot soak and a single SC03, which was used to warm the car back up and recharge the battery back to the initial SOC. Another set of three back-to-back SC03 driving schedules immediately followed the warm-up. While UC Riverside’s VERL meets the minimum test cell size and uses the appropriate cooling fan, it is not a climate-controlled facility. To approximate the required ambient temperature and humidity (35.0 ± 3.0 °C and 100 grains of water per pound of dry air or 27.4% RH), we manually controlled the ventilation of the lab AC system to maintain a temperature of 33.7 °C with a σ of 0.9 °C. Humidity could not be controlled, but had an average of 51.3% RH with a σ of 7.8% RH. VERL does not have any form of a simulated solar heating lamp, and SC03 requires a solar load of 850 ± 45 W/m2, so this specification was ignored. It should be noted that running a rigorous SC03 at an environmental chamber is costly even for auto manufacturers. They often use computer simulation and mimics cycles without using an environmental chamber to reduce cost [4,5]. We understand that accurate values should be re-assessed with more rigorous SC03 tests. Our results provide a qualitative picture on the impact of air recirculation on MAC power consumption and PHEV fuel economy.
The SC03 tests were performed with the Prius in Charge Sustaining (CS) mode, because of our interests in the hybrid fuel economy data. In CS mode, the SOC has to maintain at a certain level while driving, which forces the on-board computer to engage the gasoline engine during SC03 driving cycle hard accelerations. The test cycle represents a 5.8 km route and a total time of 596 s, with an average and maximum speed of 34.8 km/h and of 88.2 km/h, respectively. The SC03 was repeated three times with each AC/ventilation condition.
Three datasets were removed from the SC03 data due to instrument errors where there is a significant gap in the data (one from ACF and two from ACR). An additional test from each AC/ventilation condition was removed due to the Prius over-utilizing the battery, which was apparent with greater ΔSOC compared to the rest of the tests.

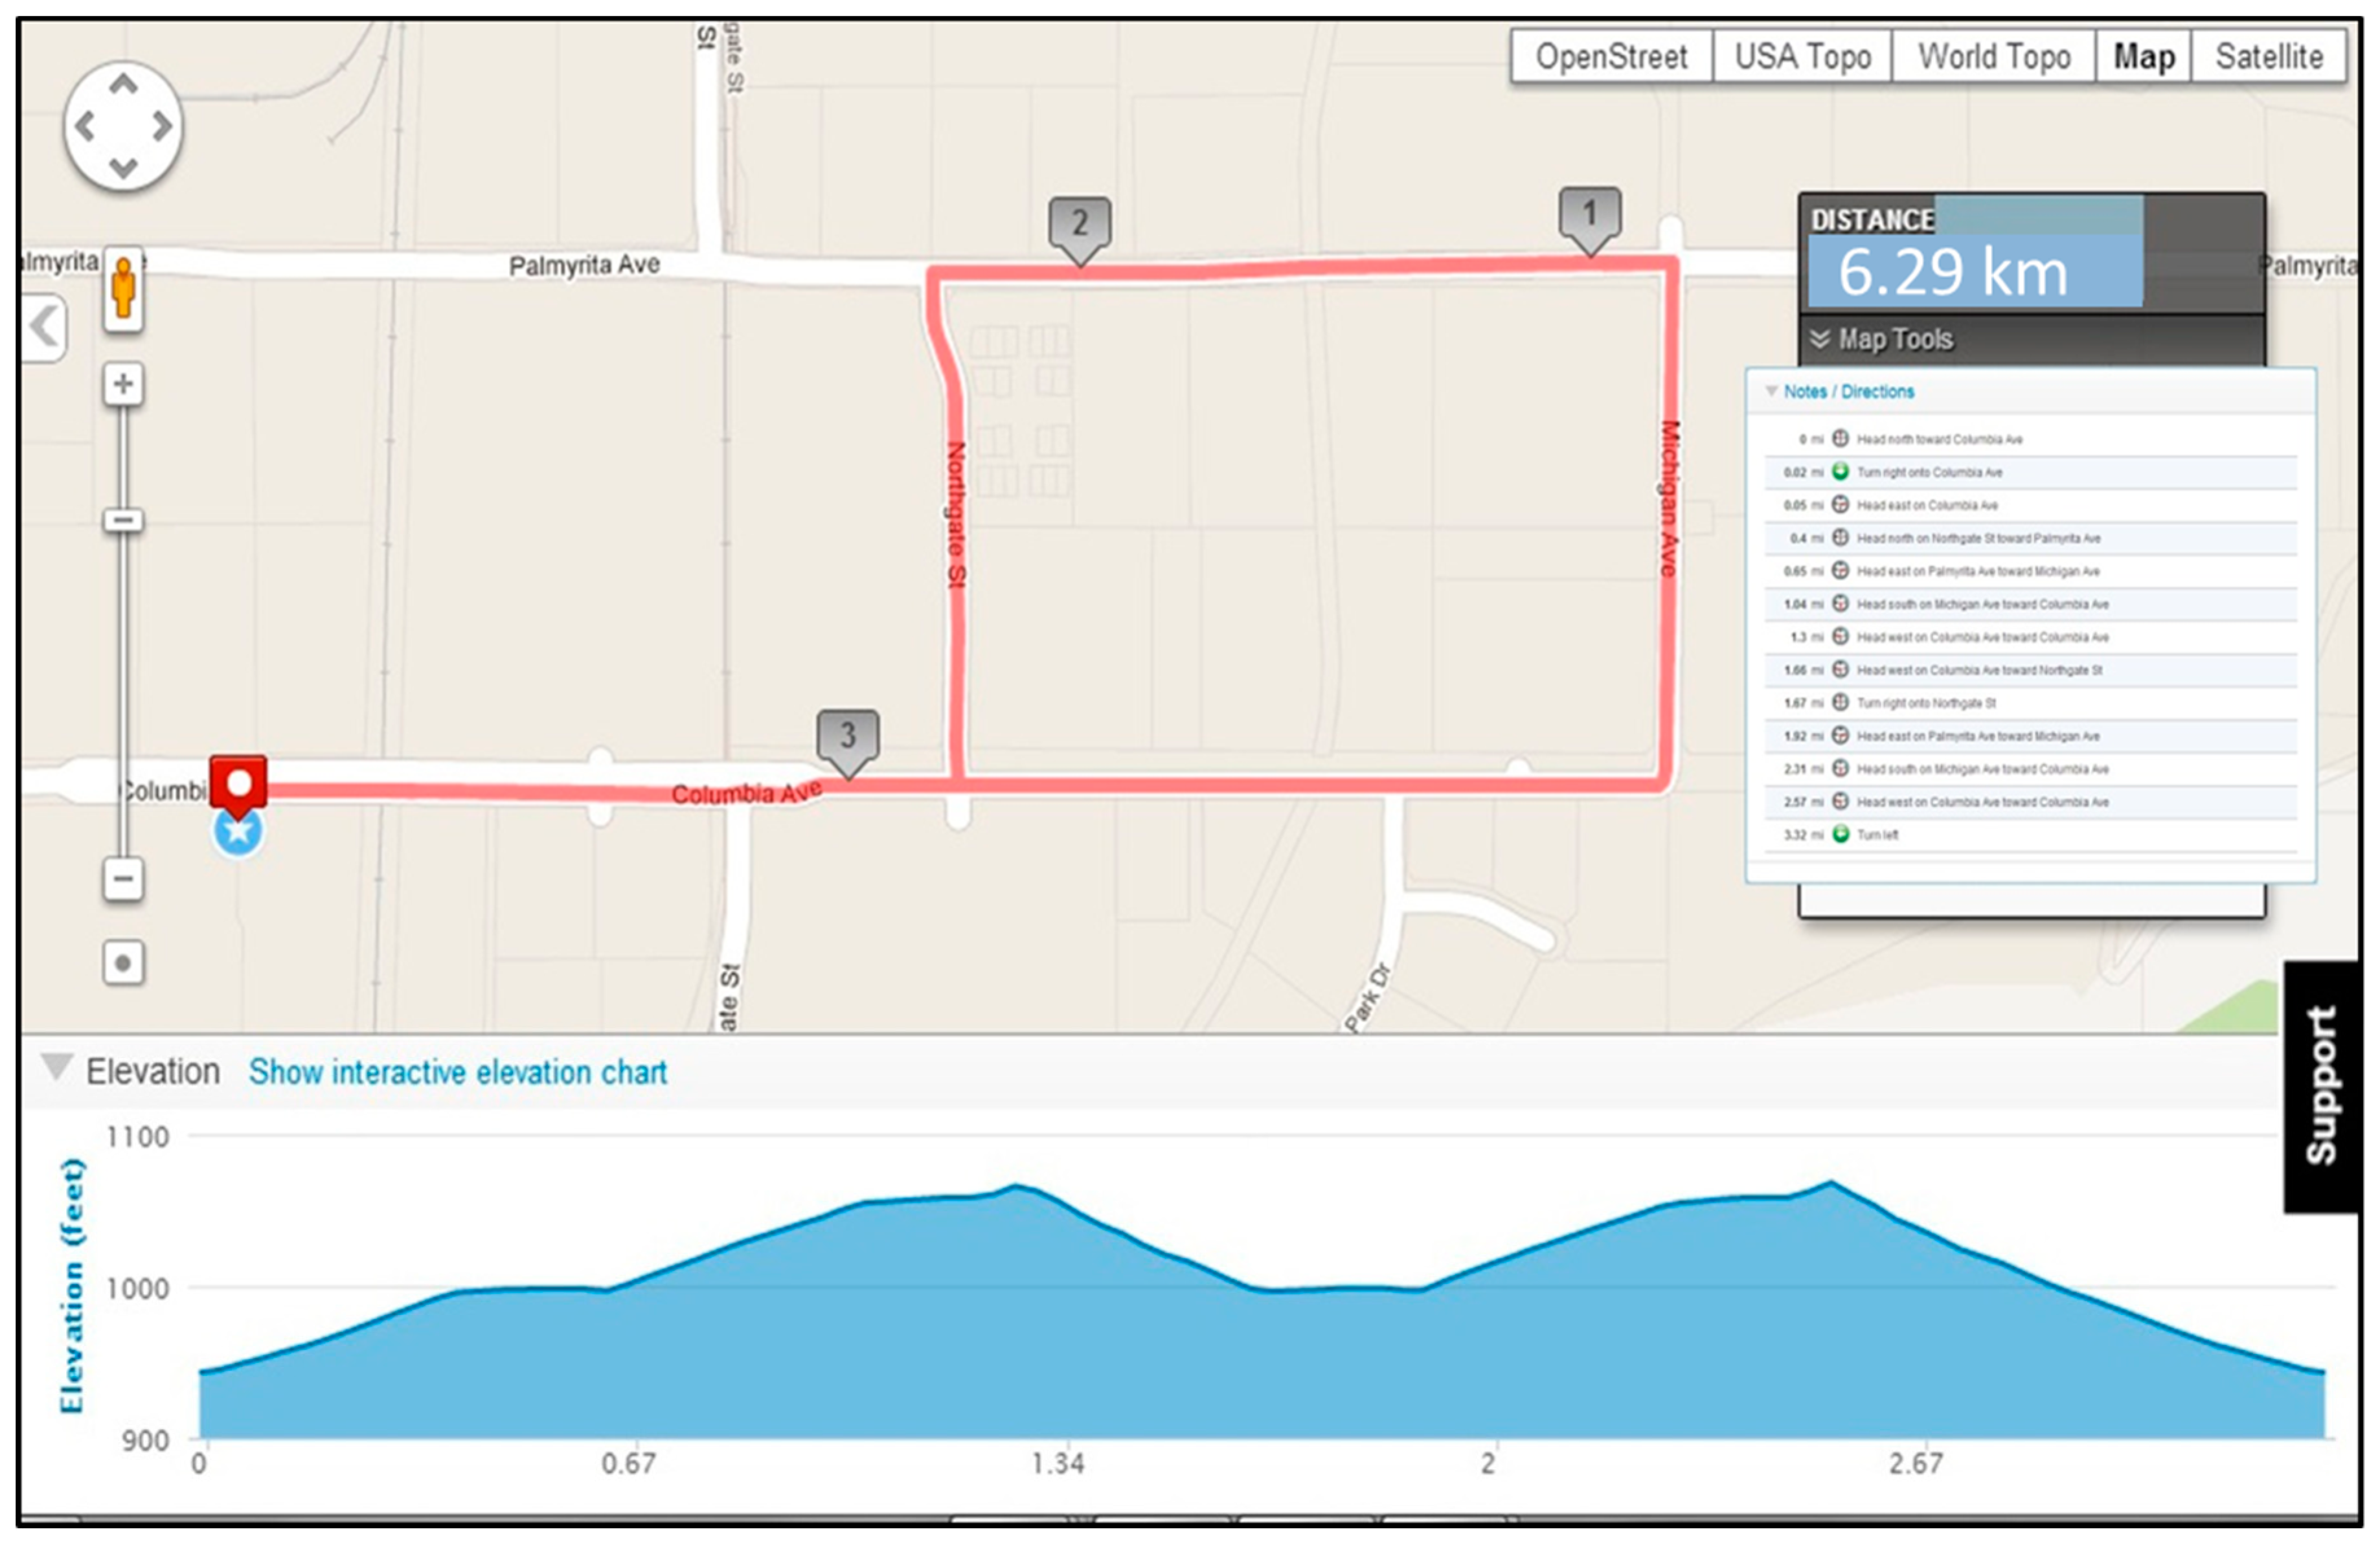
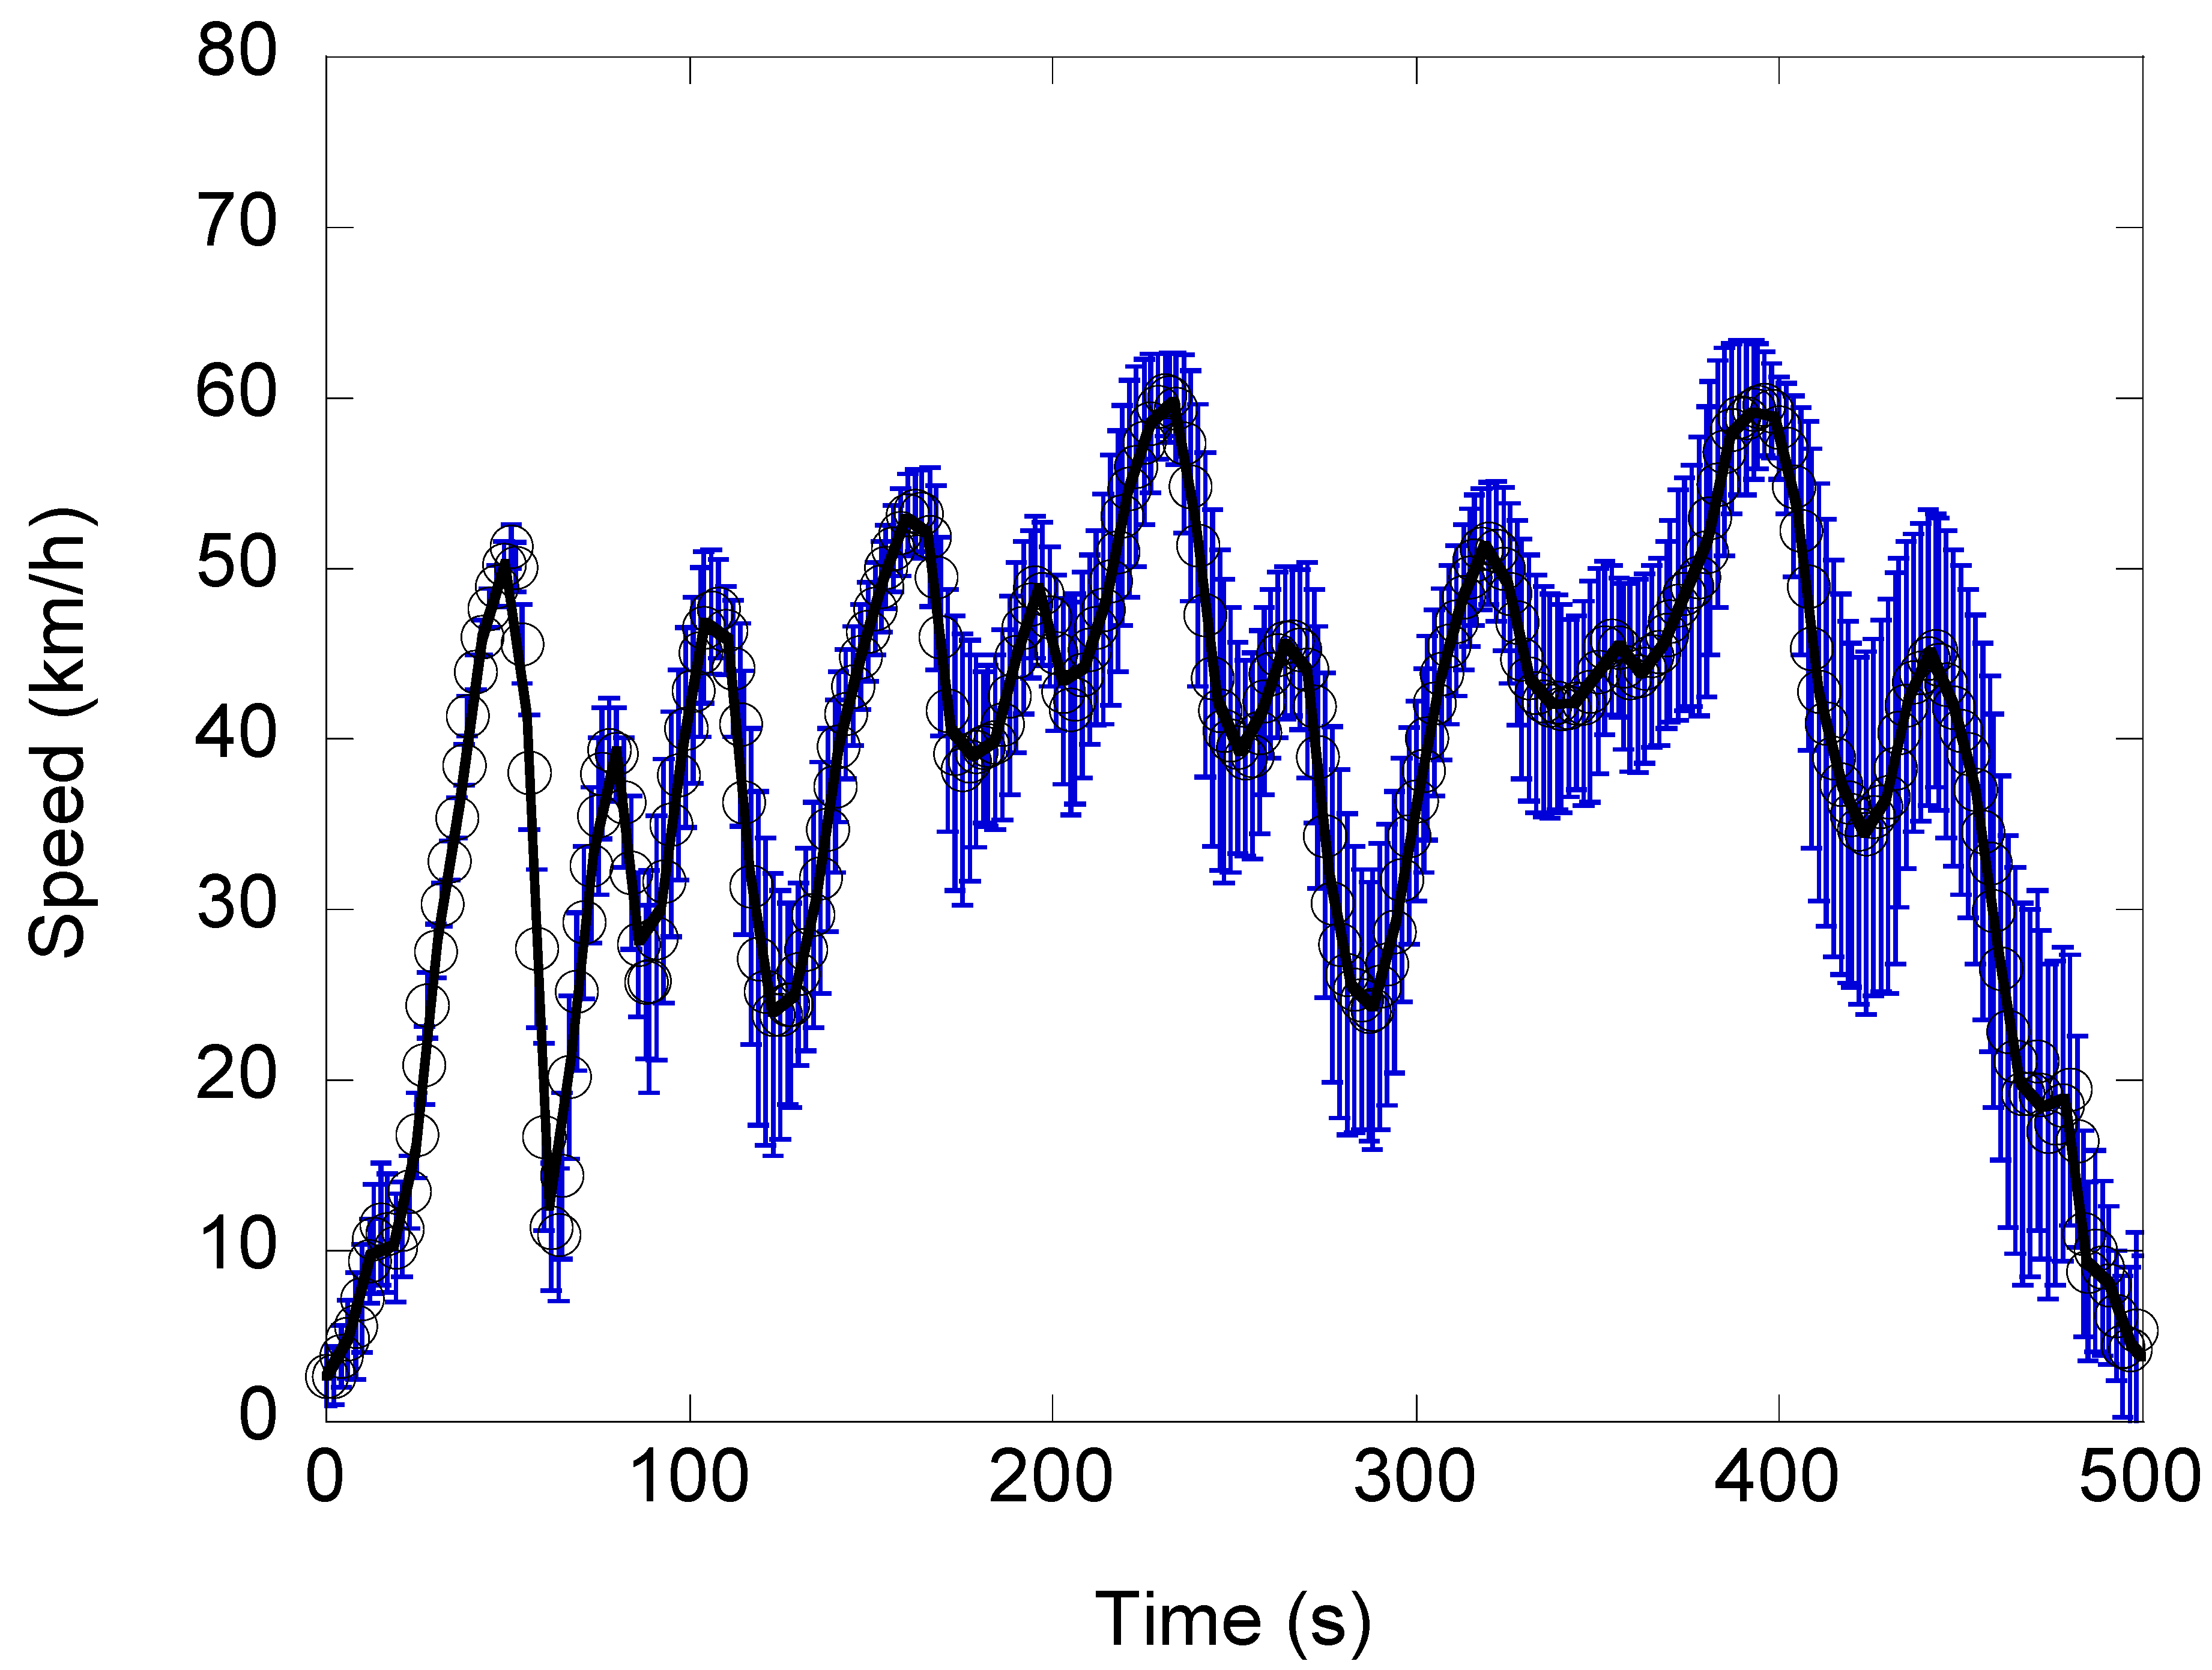
2.3.2. On-Road Fuel Economy and MAC Power Consumption Test: Charge Depletion (CD) Mode on Local Surface Streets

MAC power consumption was also tested on the road at CD mode. A route near the CE-CERT was chosen considering low traffic volume, no signal lights, and the route length of 3.9 miles that was similar to that (3.6 miles) of the SC03 route [33], with average and maximum speed of 34.8 and 88.2 km/h, respectively, as shown in Table 2. The test route and cycle we developed could not mimic the severity of the SC03 cycle because safety and repeatability of the test could not be achieved simultaneously for the on-road test if we were to mimic SC03 cycle. The purpose of the on-road tests was to provide additional data points at CD mode with a solar load and variable ambient temperatures. Figure 2 shows the map of the route with elevation and Figure 3 shows the average speed of the on-road tests. Real-world driving often presents the challenge of uncontrollable variables, such as the random nature of other drivers. Variations in the on-road tests are expected. However, this route was highly repeatable, as shown in Figure 3. To reduce error and improve repeatability, a single driver completed all trips. Testing was performed in sets of three consecutive trips (each with one of the three AC/ventilation conditions), and the order of AC/ventilation conditions were randomized. The on-road fuel economy and MAC power consumption tests were performed with the Prius in CD mode, which meant everything was battery powered.

2.3.3. On-Road Cabin-Air Quality Test: CS Mode on Highway

Three highway tests were performed along the 91 freeway (SR91) during heavy traffic hours from Riverside, CA to Yorba Linda, CA and back (96 km), to measure in-cabin air quality in heavy traffic conditions. AC conditions were the same as the previous on-road conditions with a repeated test for ACR and ACF, and one test for ACP (AC partial recirculation). The recirculation flap door was adjusted to provide roughly 20% recirculated and 80% fresh air. The test vehicle was operated in CS mode with two passengers. Every 20 to 30 min the cabin air was flushed with ambient air from the outside by opening the windows.

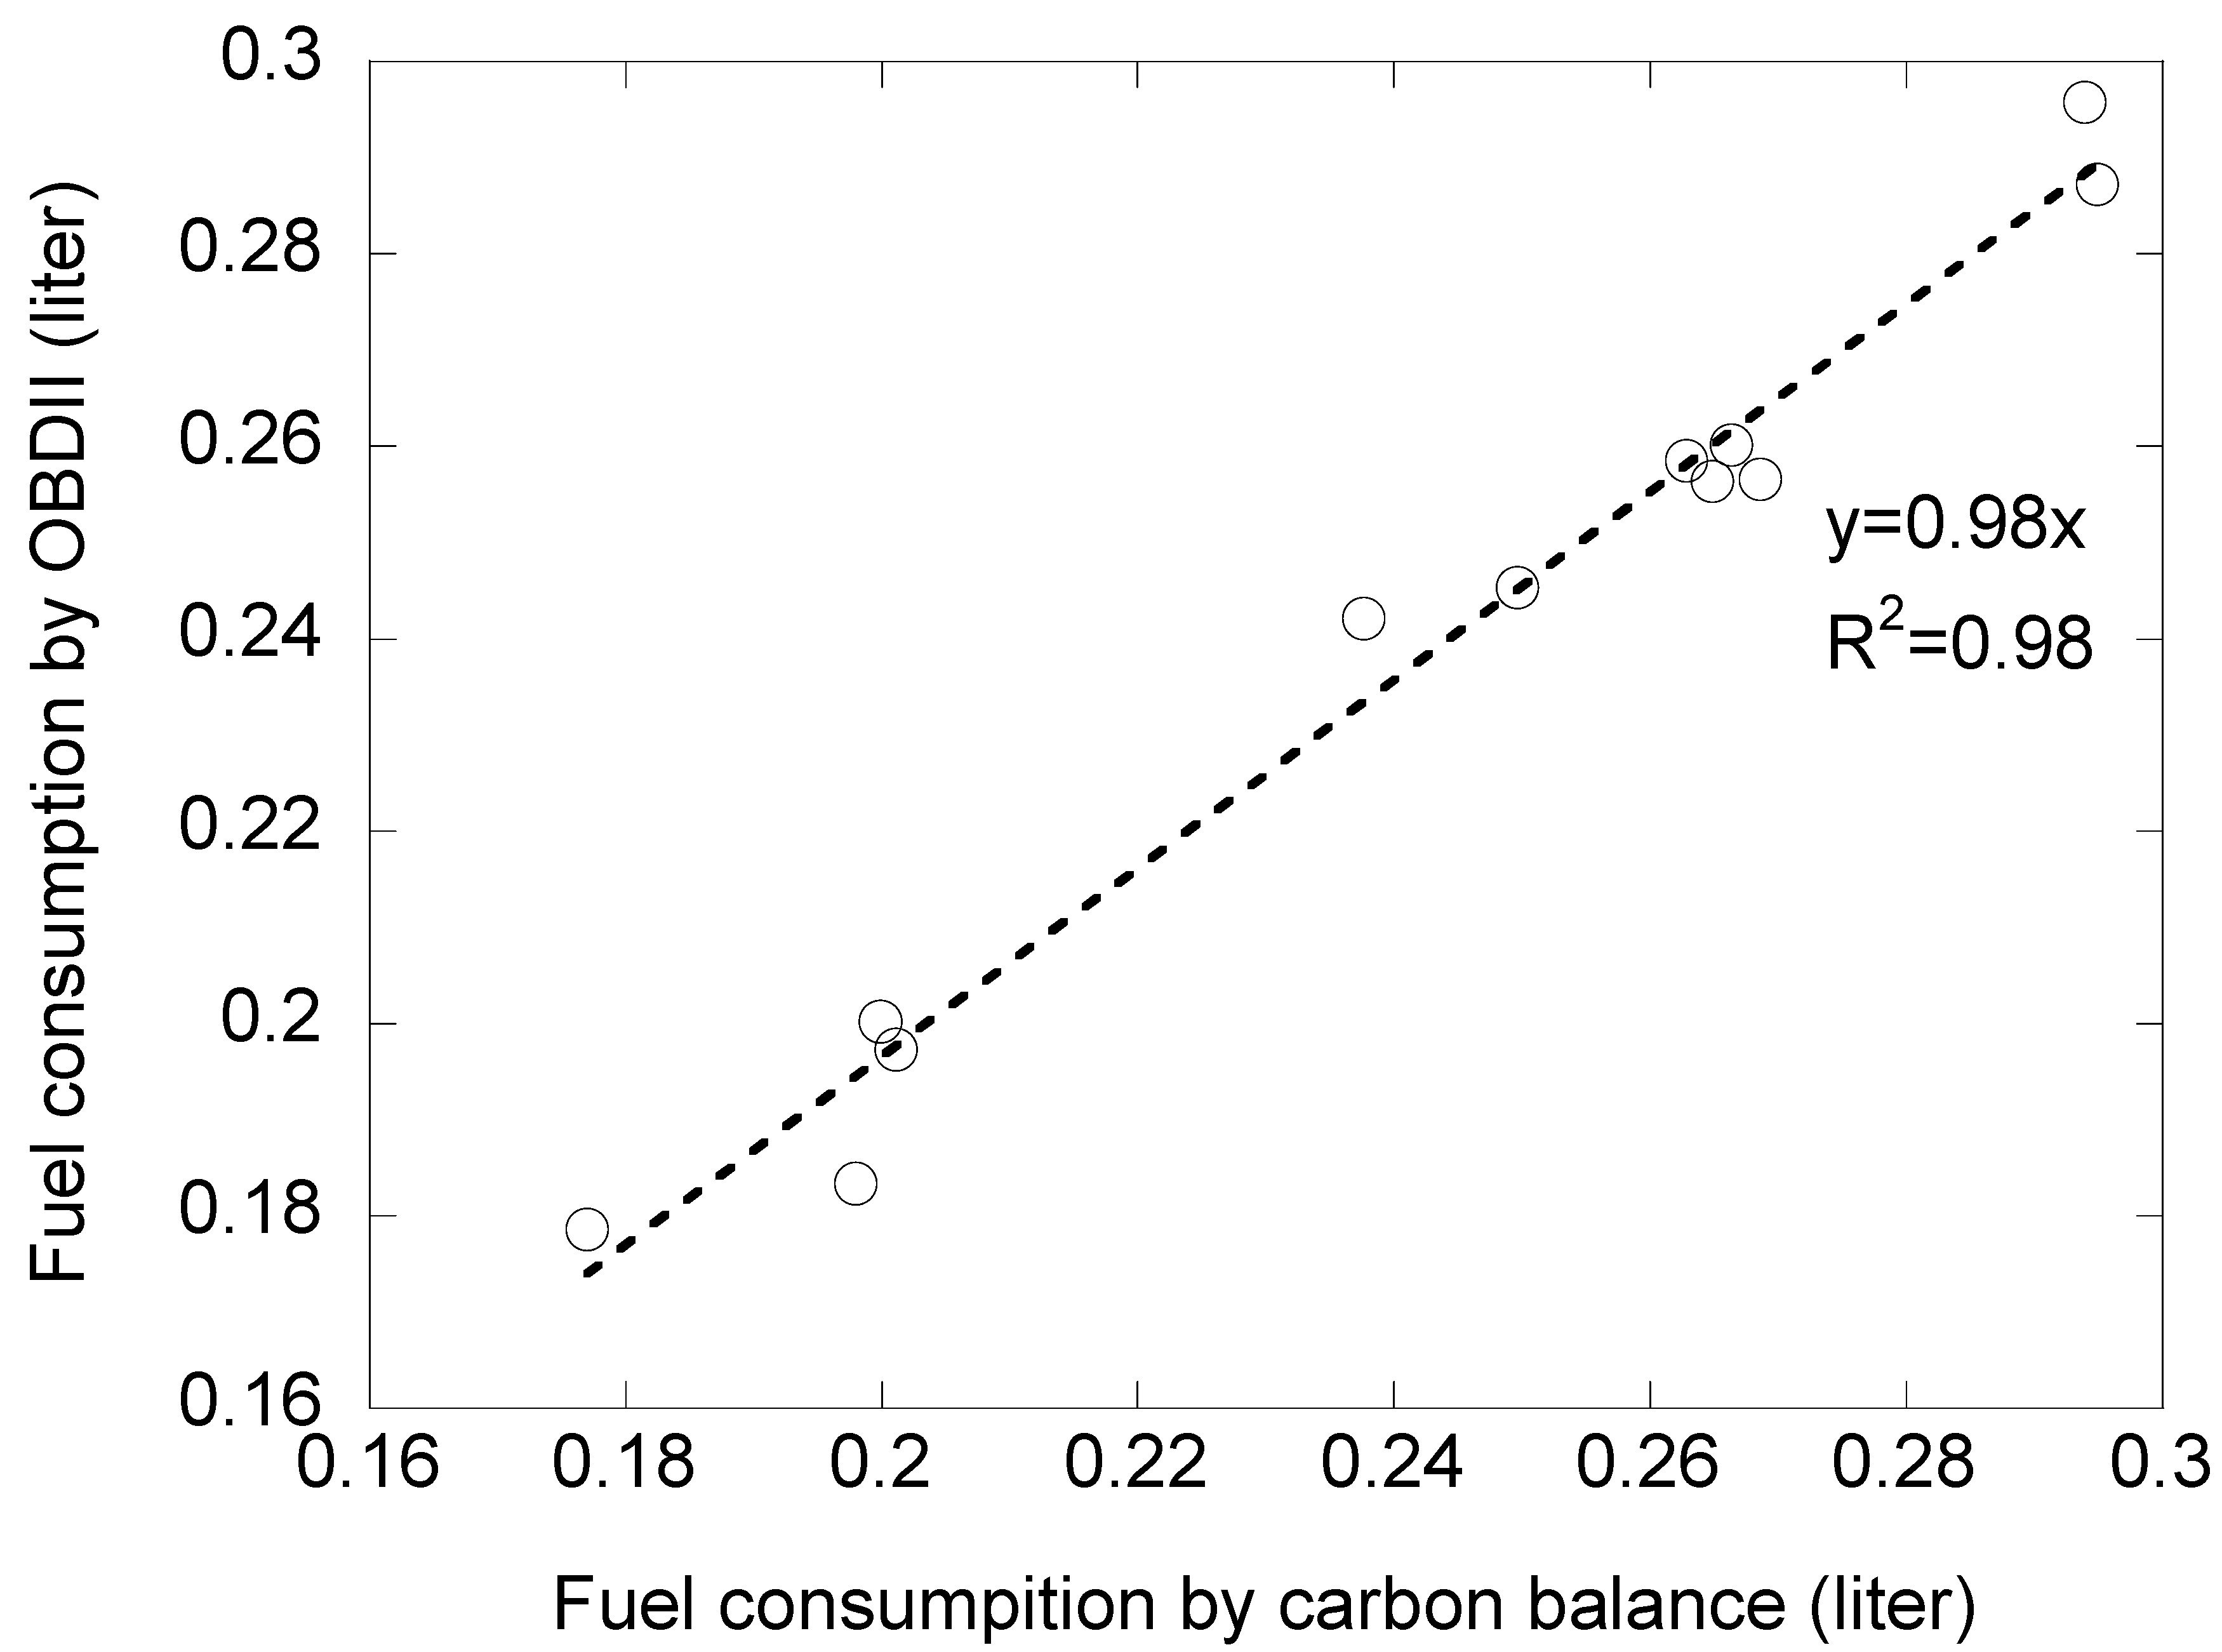
2.4. Calculation of Fuel Economy

Fuel Economy (in kWh/km) was calculated by the following equations [35]:
F u e l   E c o n o m y = W e + W g D k m   ×   100
where We is the electric work, Wg is gasoline work in kWh, and Dkm is the total distance of the trip. We is obtained from integrating the OBD-II’s battery current and voltage values. Gasoline work (i.e., the work from ICE) is calculated from the OBDII’s instantaneous measurements of mass air flow (MAF) through the engine. Calculating the work from the gasoline engine is described by the Equation (2):
W g = t = 0 t 0 ( M A F ( t ) / 1000 × 12.3 A F C 8 H 18 ) × Δ t  
where MAF(t) is in g/s, 1000 is for conversion to kg, AFC8H18 is the air:fuel ratio (e.g., 14.7), and 12.3 kWh/kg is a conversion factor from gasoline fuel mass to electric work. One gallon of gasoline is regarded equivalent to 33.7 kilowatt-hours (121 megajoules) of electricity when MPGe (miles per gallon equivalent) was introduced [36]. Assuming 2.75 kg per gallon of gasoline, this gives 12.3 kWh/kg (44.1 MJ/kg).
The electric work (We) was calculated by integrating the product of the battery pack voltage (in voltage) and the battery pack current (in amperes) at each measured time step. The battery pack voltage is the sum of the 8-battery voltages recorded via OBDII. Khoury et al. suggested a method to account for ΔSOC for the calculation of Pe [32]. However, the majority of the SC03 test results showed that ΔSOC were within ±2%. Therefore, we did not account for ΔSOC in our fuel economy calculation.
The gasoline power (Pg) was also determined from tailpipe emissions by using carbon balance method for laboratory chassis dynamometer test comparisons. The carbon balance method determines fuel economy by assuming each carbon atom, measured from the exhaust emissions by analytic instruments, is equal to the carbon burned in the fuel. The carbon balance method in Equation (3) is described in CFR, Title 40, Part 86 [34].
P g ( c a r b o n   b a l a n c e ) = ( C W F × S G × 998 ) ( 0.886 × T H C ) + ( 0.429 × C O ) + ( 0.273 × C O 2 )
where 998 is the density of water at 15.5 °C in kg/m3, THC is the total hydrocarbon emission rate in g/km, CO is the emission rate of carbon monoxide in g/km, CO2 is emission rate of carbon dioxide in g/km, CWF is the carbon weight fraction of the test fuel, and SG is the specific gravity of the test fuel [37]. The exhaust gas was captured by a bag sample taken during the entire SC03 cycle, and the concentration of carbon-containing gas was measured immediately after each test.

3. Results and Discussion

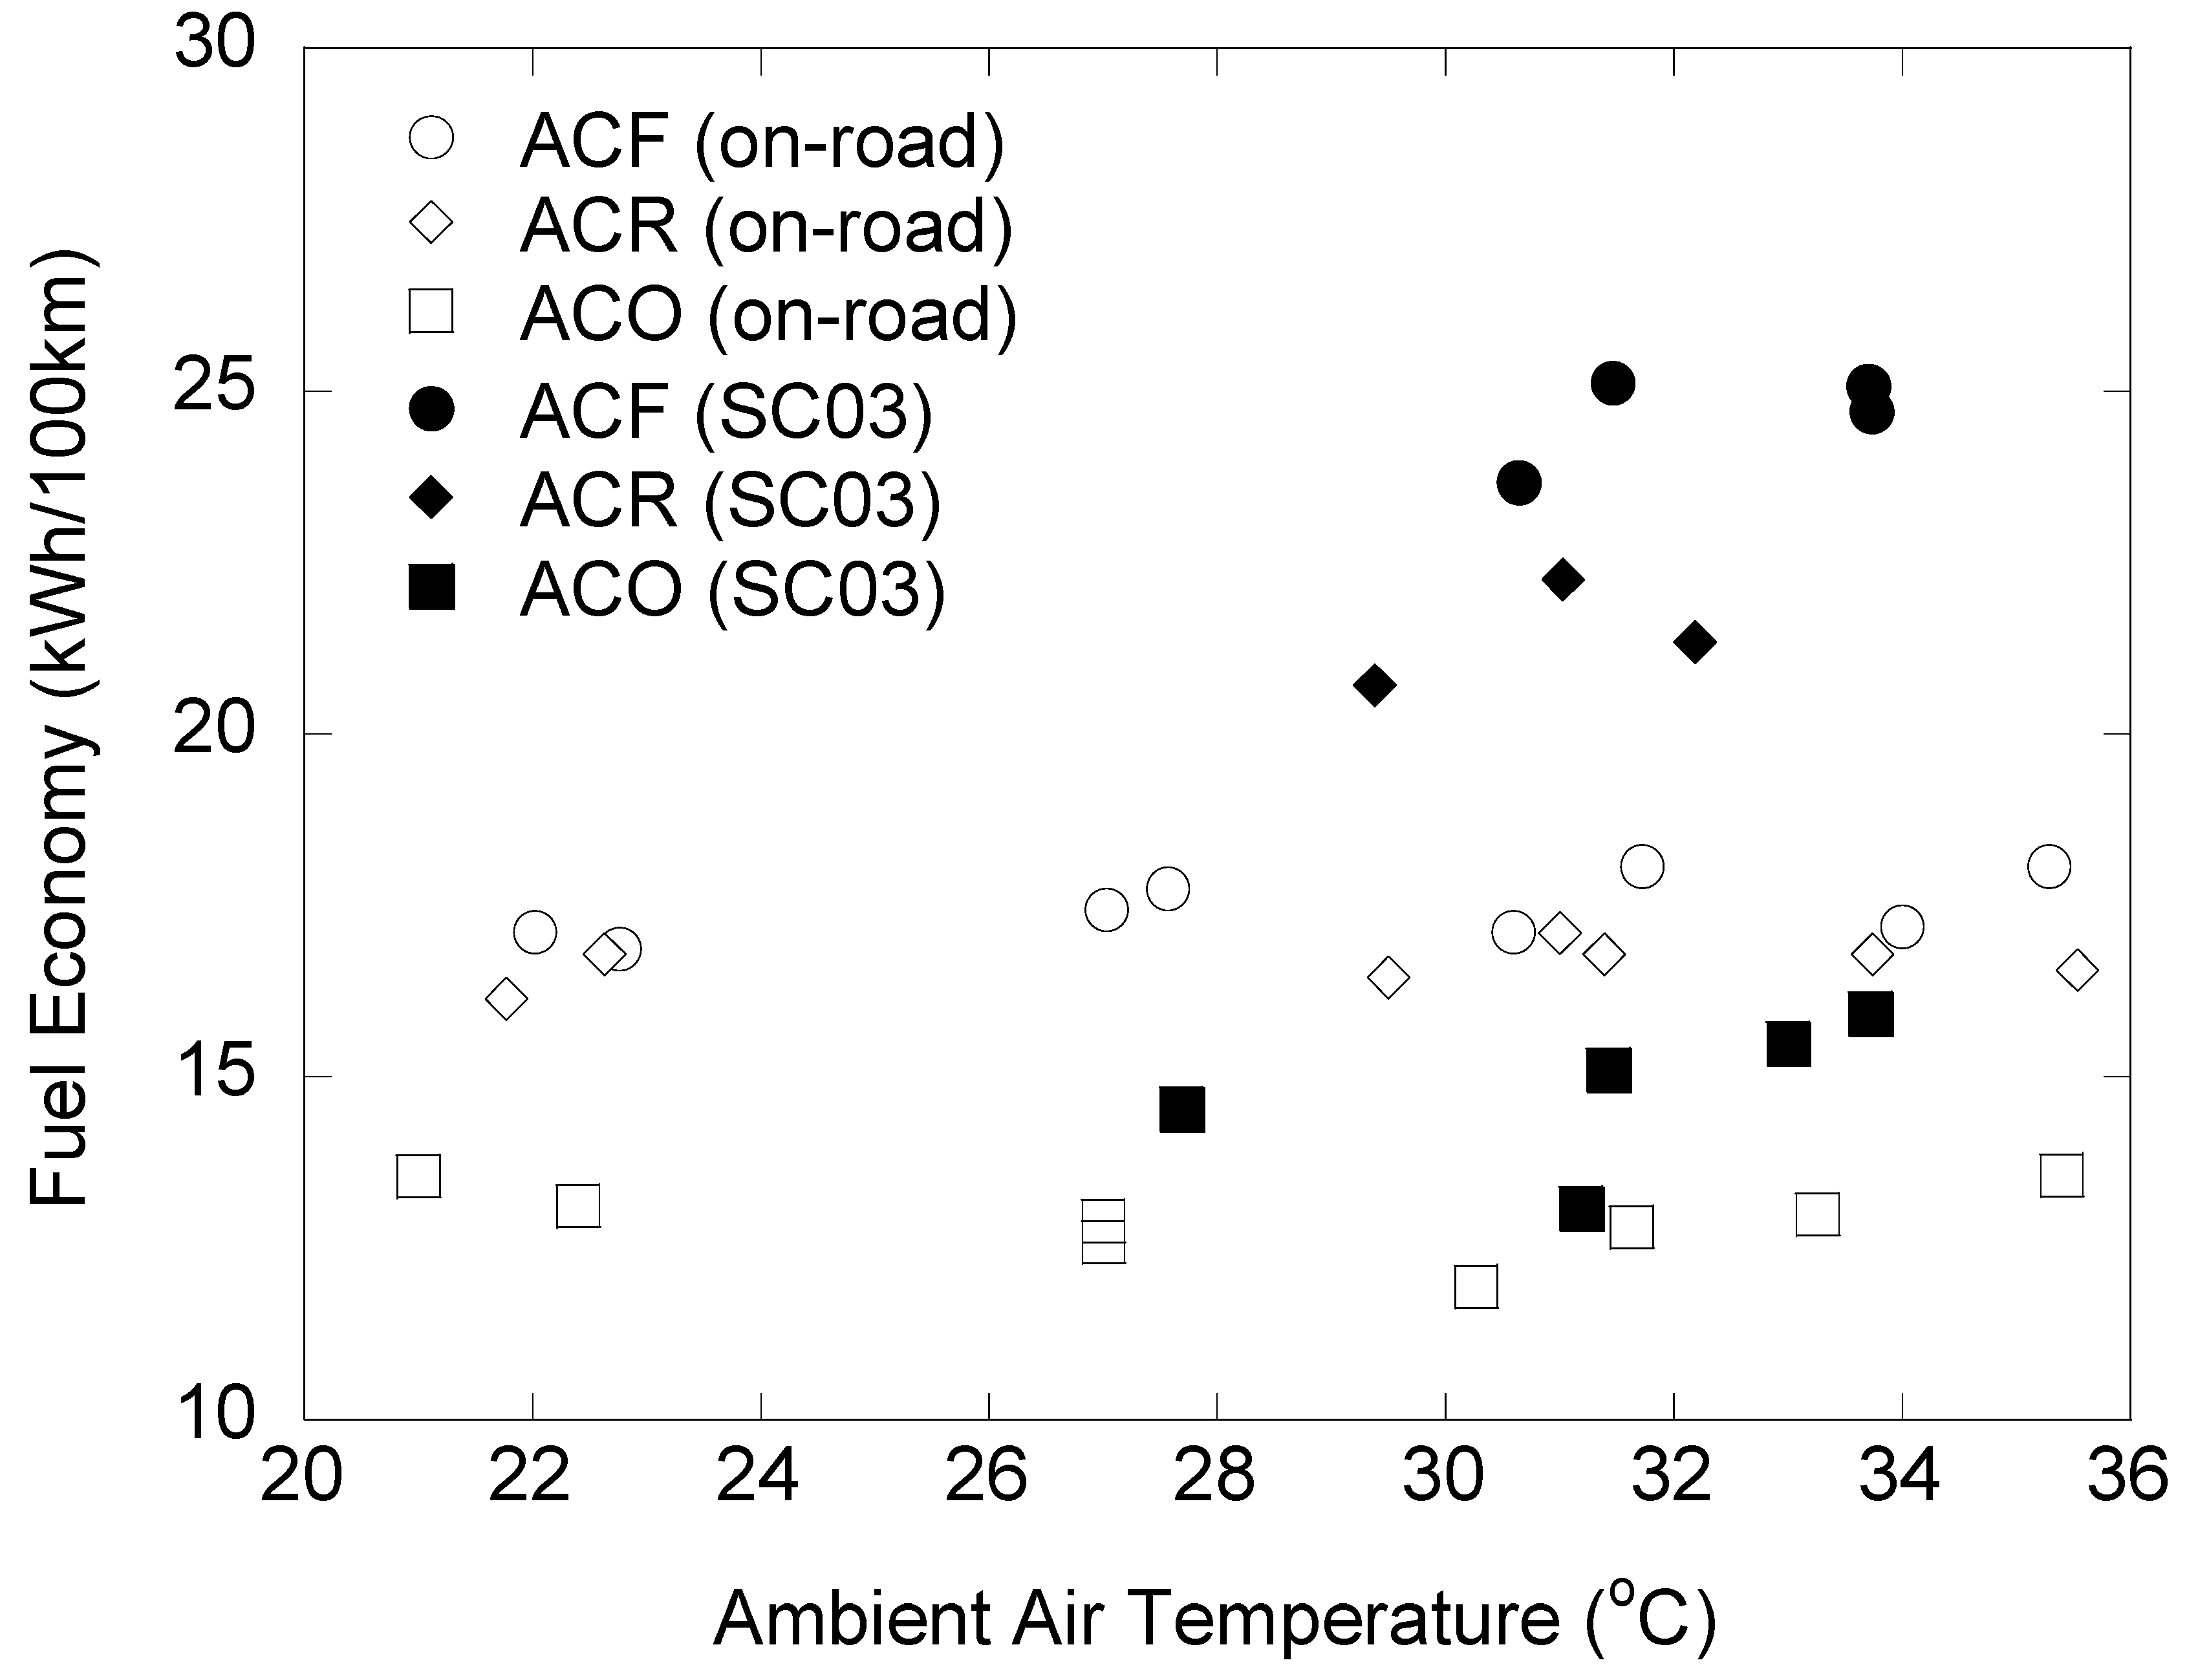
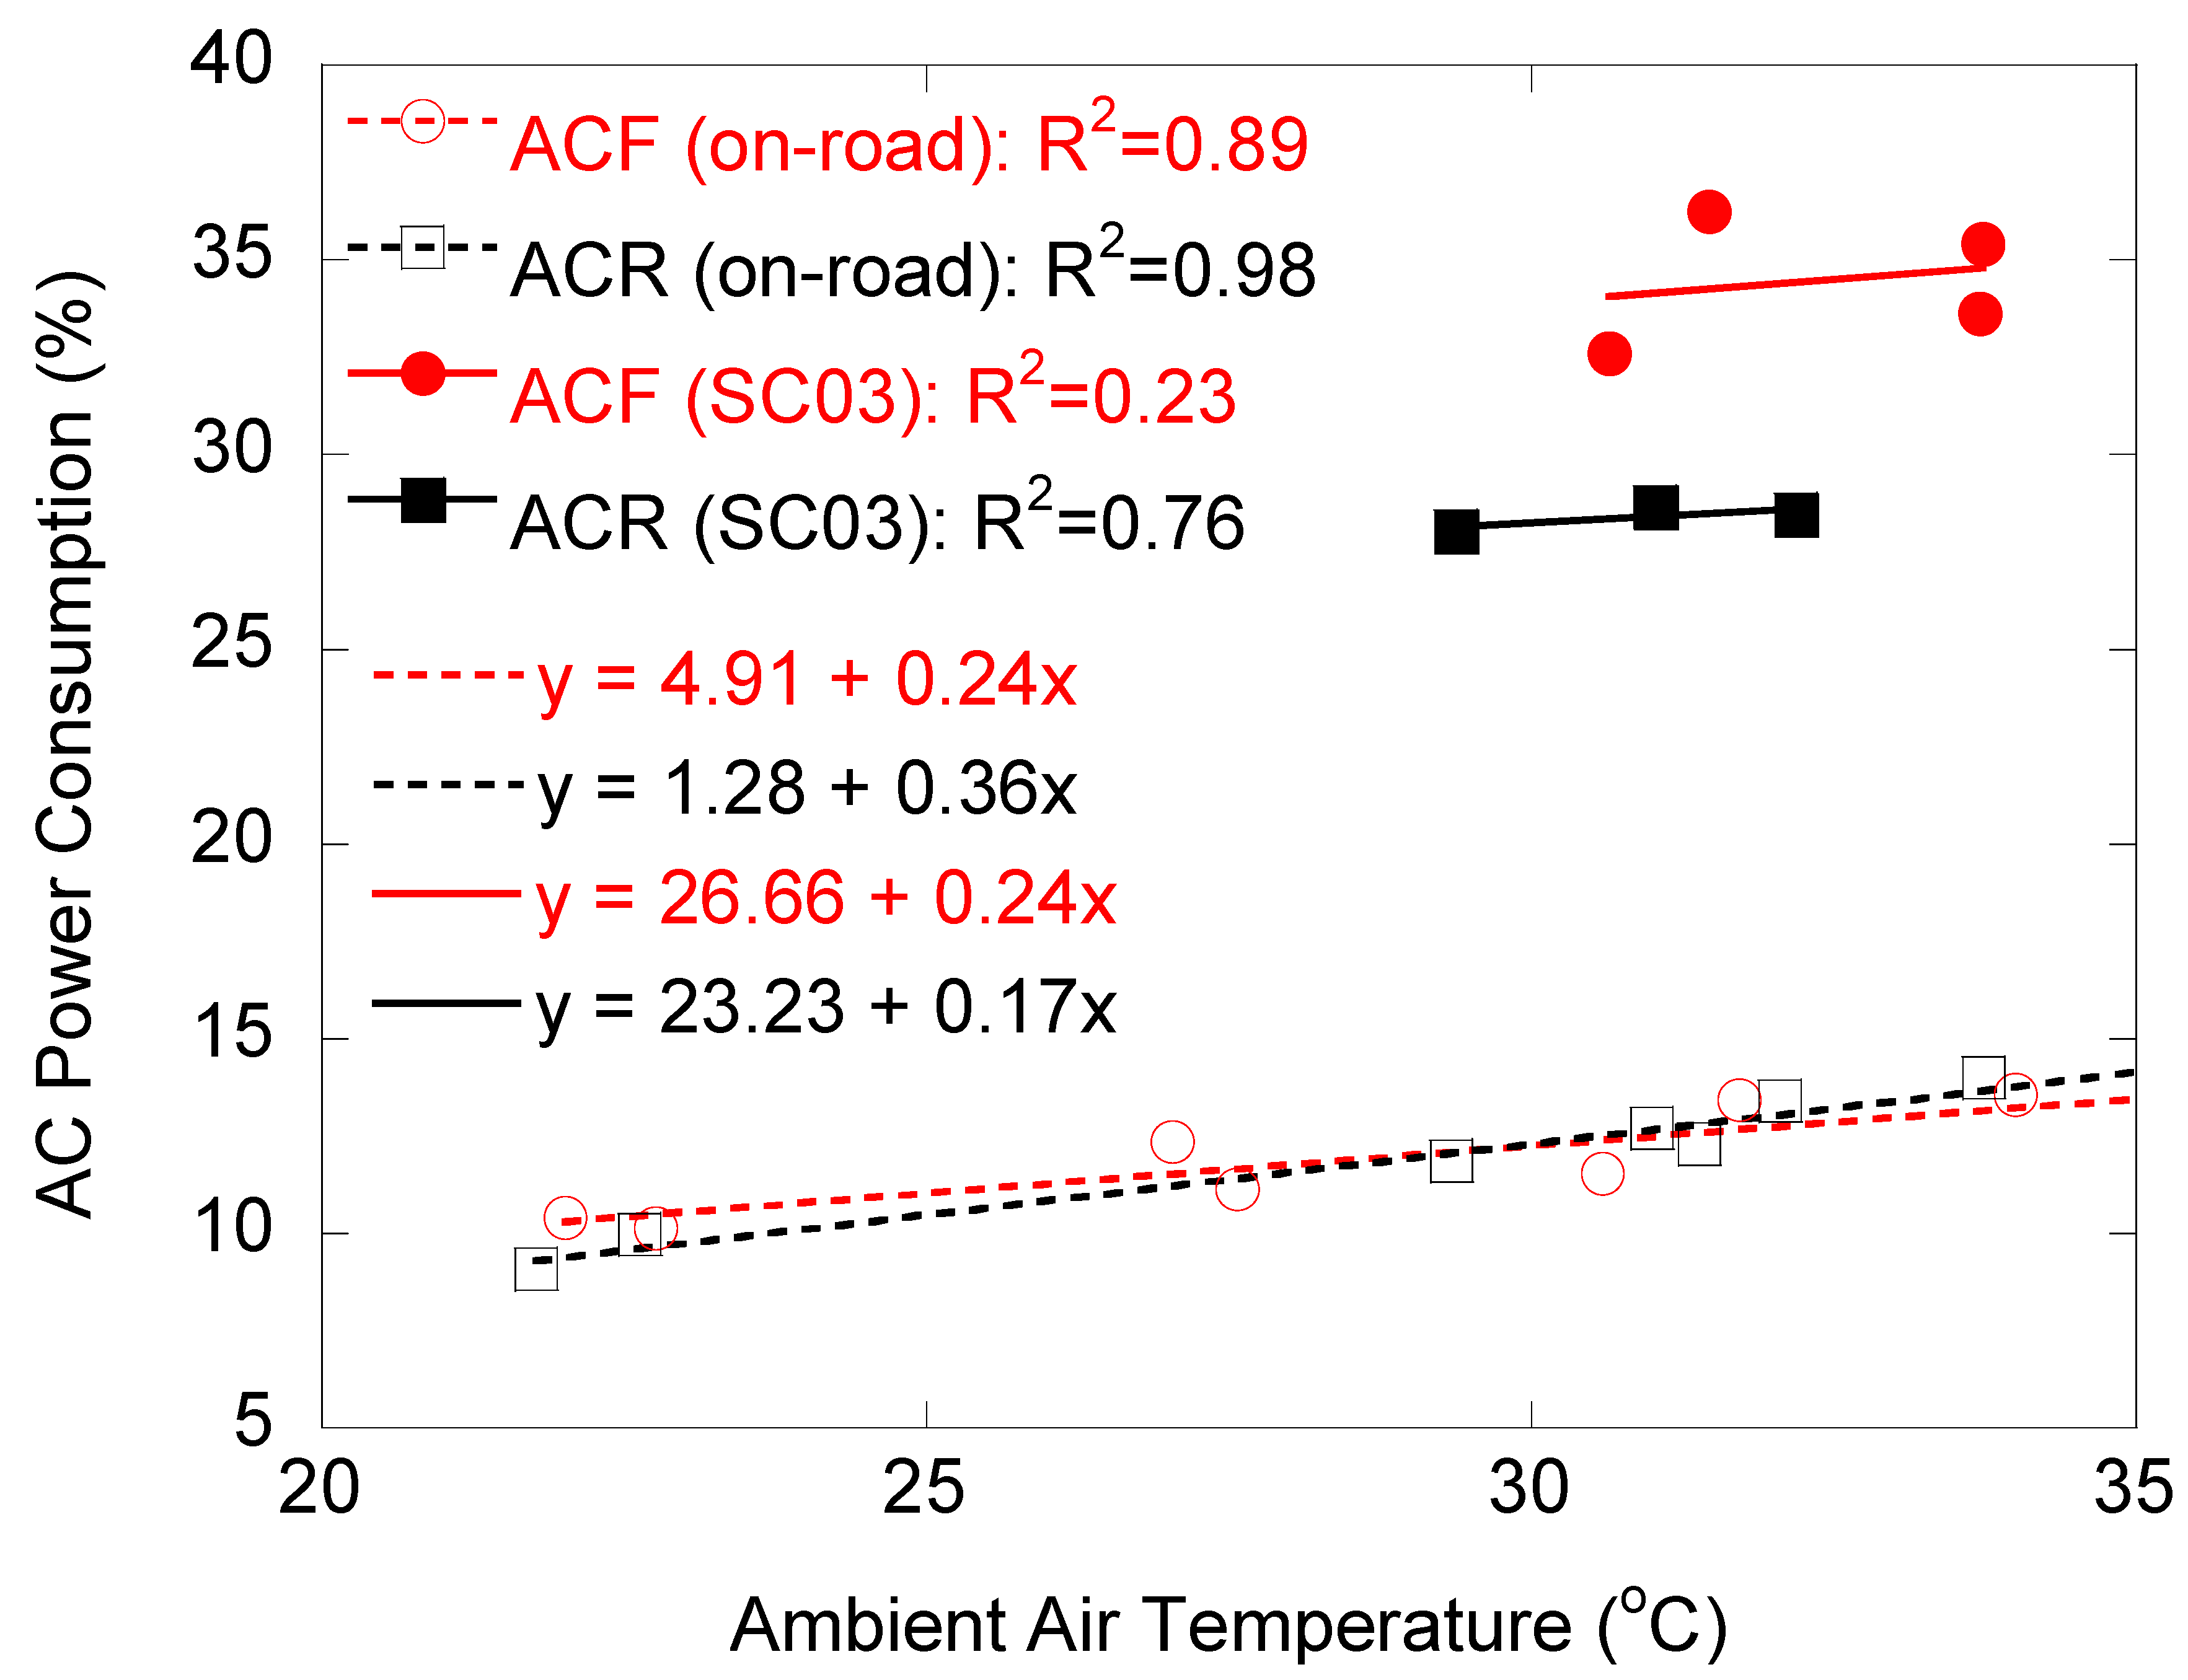
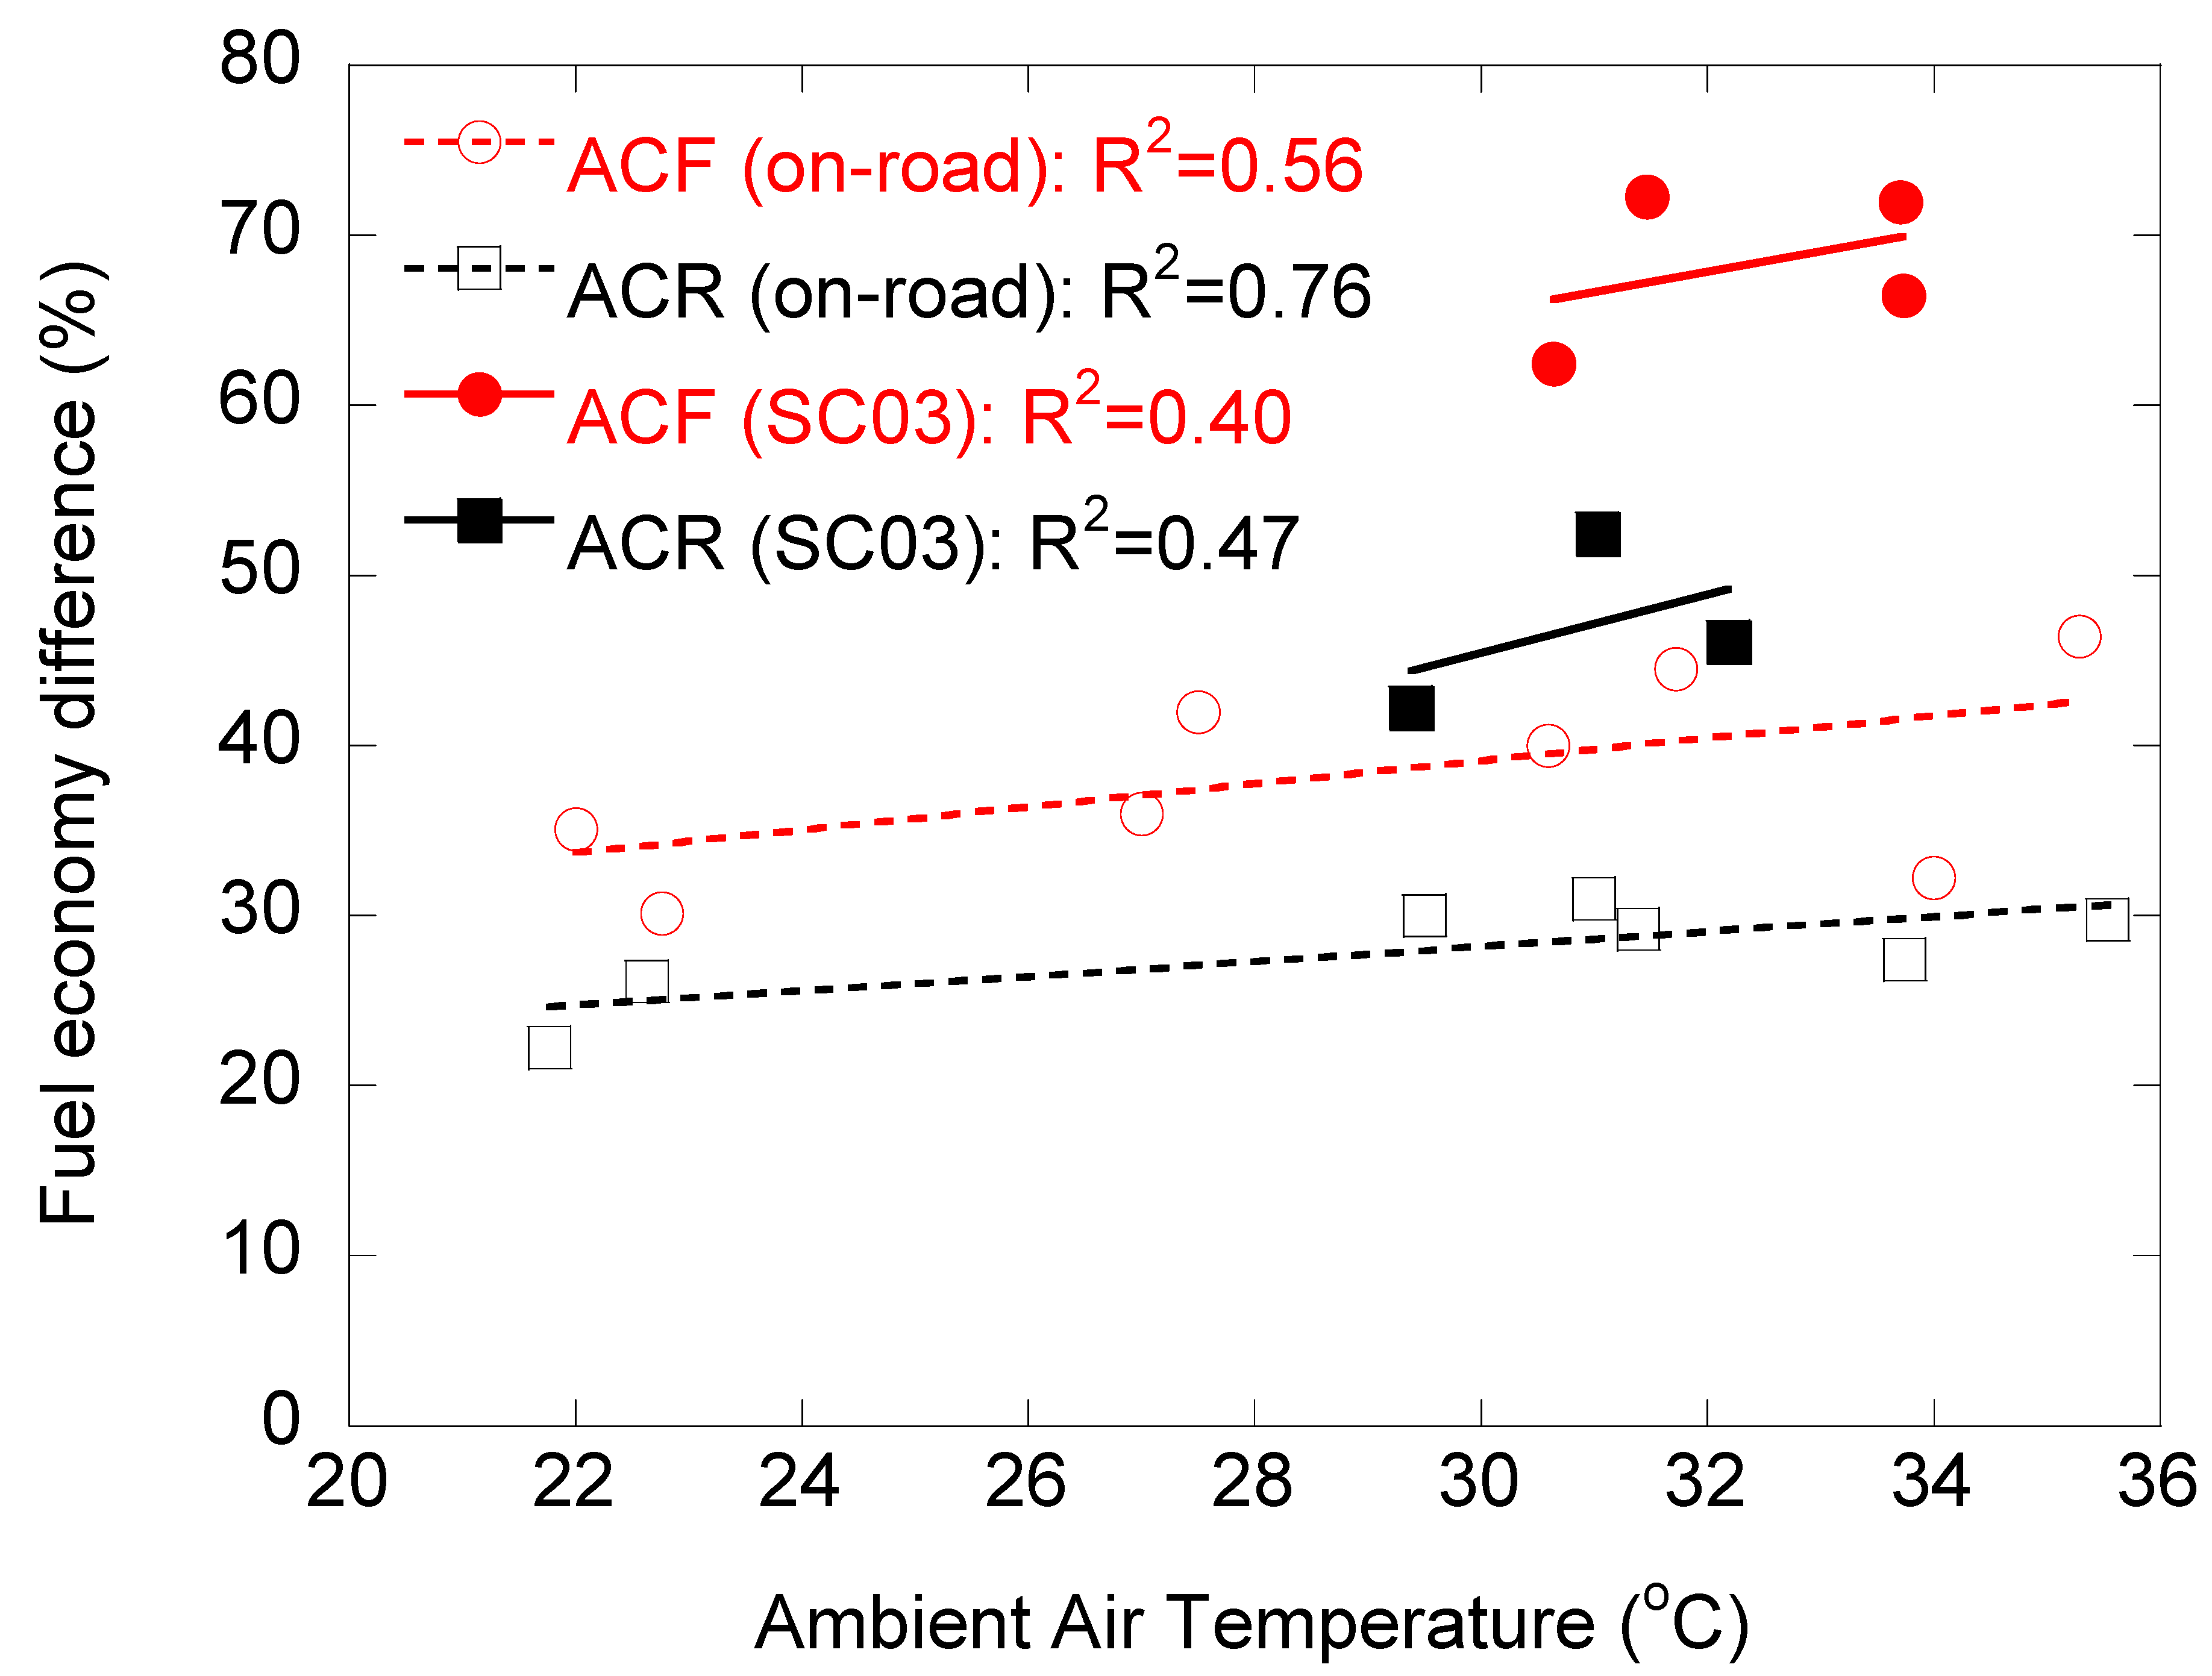
3.1. Laboratory Test: SC03

The gasoline power (Pg) was obtained from OBD-II data and carbon balance method. Pe was always determined by OBD-II data during the SC03 test to examine the accuracy of the fuel economy. Figure 4 shows that the gas fuel consumption determined by OBD-II data agrees very well with the carbon balance method. It has a linear regression of nearly one and R2 of 0.98. The good agreement during the SC03 test is a basis to rely on OBD-II data to determine fuel economy.
AC power consumption relative to the total power consumption is shown in Figure 5. SC03 test results showed the highest values of AC power consumption among all tests. The SC03 cycle is designed to simulate real-world driving conditions with AC usage, which can decrease the fuel economy by as much as 25% for conventional PFI powered vehicles [5]. For the SC03 cycle, the Prius AC consumed 34.5 ± 1.7% of all power when the MAC was set to fresh air. It consumed 28.4 ± 0.3% of all power when the AC was set to recirculated air. This suggested that ACR consumed 6.1% less AC power than ACF setting, which is a significant difference. Zhang et al. studied trade-offs between HEV AC performance and vehicle fuel economy [4]. They concluded that the improvement of AC system performance is marginal if the control strategies only allow the change in the compressor and fans. They suggested the trade-off between the AC system and vehicle fuel economy needs to be investigated in a broader context in the future. Normalized MAC power consumption also showed positive correlations with outside ambient temperature in Figure 5. This is expected, because the AC thermal load of the vehicle varies as a function of outside temperature at a fixed in-cabin temperature setting.
Fuel economy is plotted in Figure 6 as kWh/100 km, which is a common metric for hybrid electric vehicles. SCC03 test results showed the highest values in kWh/100 km, which meant the highest fuel consumption per km. The Prius averaged 24.7 kWh/100 km under ACF conditions, 21.4 kWh/100 km under ACR conditions, and 14.8 kWh/100 km under ACO conditions. This suggested that there was a 3.4 kWh/100 km saving by use of air recirculation and an additional 6.6 kWh/100 km saving by use of ACO. These findings stress the importance of using air recirculation or turning off the AC to reduce power consumption. Figure 7 shows fuel economy difference relative to the average ACO fuel economy as shown in Equation (4).
F u e l   e c o n o m y   d i f f e r e n c e   ( % )        = 100   ×   [ f u e l   e c o n o m y f u e l   e c o n o m y   ( A C O ) ] f u e l   e c o n o m y   ( A C O )
Compared to the ACF condition, the ACR setting improved the calculated fuel economy (Equations (1) and (3)) by ~20% for the SC03 test.

3.2. On-Road Fuel Economy and MAC Power Consumption Test

The MAC power consumption percentage in Figure 5 did not show a big difference between ACR and ACF conditions during the on-road test, which was somewhat different from the result of the SC03 in-lab test. This was likely due to the significantly lower driving loads experienced on the local driving route compared to the SC03 driving cycle. Regarding AC power consumption, the on-road and SC03 test results suggested that more aggressive driving tends to magnify the effects of the vehicle HVAC (heating, ventilation and air conditioning) system settings. The AC power consumption percentage increased as the outside temperature increased during the on-road testing, with the following regression equation for AC power consumption: AC power consumption (%) = 4.9 + 0.24x and 1.3 + 0.37x for ACR and ACF conditions, respectively, where x is outside temperature. These slopes are similar to those from the SC03 test: AC power consumption (%) = 23.2 + 0.17x for ACR and AC power consumption (%) = 26.7 + 0.24x for ACF.
The Prius had an average on-road fuel economy of 17.5 kWh/100 km when the AC was set to fresh air, 16.7 kWh/100 km with the AC set to recirculated air, and 12.9 kWh/100 km with the AC set to off. Despite the small differences between ACR and ACF conditions in the percentage of AC power consumption, the differences between ACR and ACF conditions in terms of fuel economy are slightly larger, as shown in Figure 6. Other than the different AC settings, there are no other parameters that could affect the fuel economy. We speculate that the OBD-II reported AC power consumption by only considering the compressor power consumption, which underestimated total AC power consumption. As a result, the fuel economy includes all actual AC power consumption and showed slightly larger differences between the two AC settings. This difference becomes even more evident when fuel economy is plotted relative to average ACO conditions, as shown in Figure 7. ACR conditions improved relative percent fuel economy by ~8% compared to ACF conditions for on-road tests, which meant ACR conditions consumed less energy than ACF conditions.

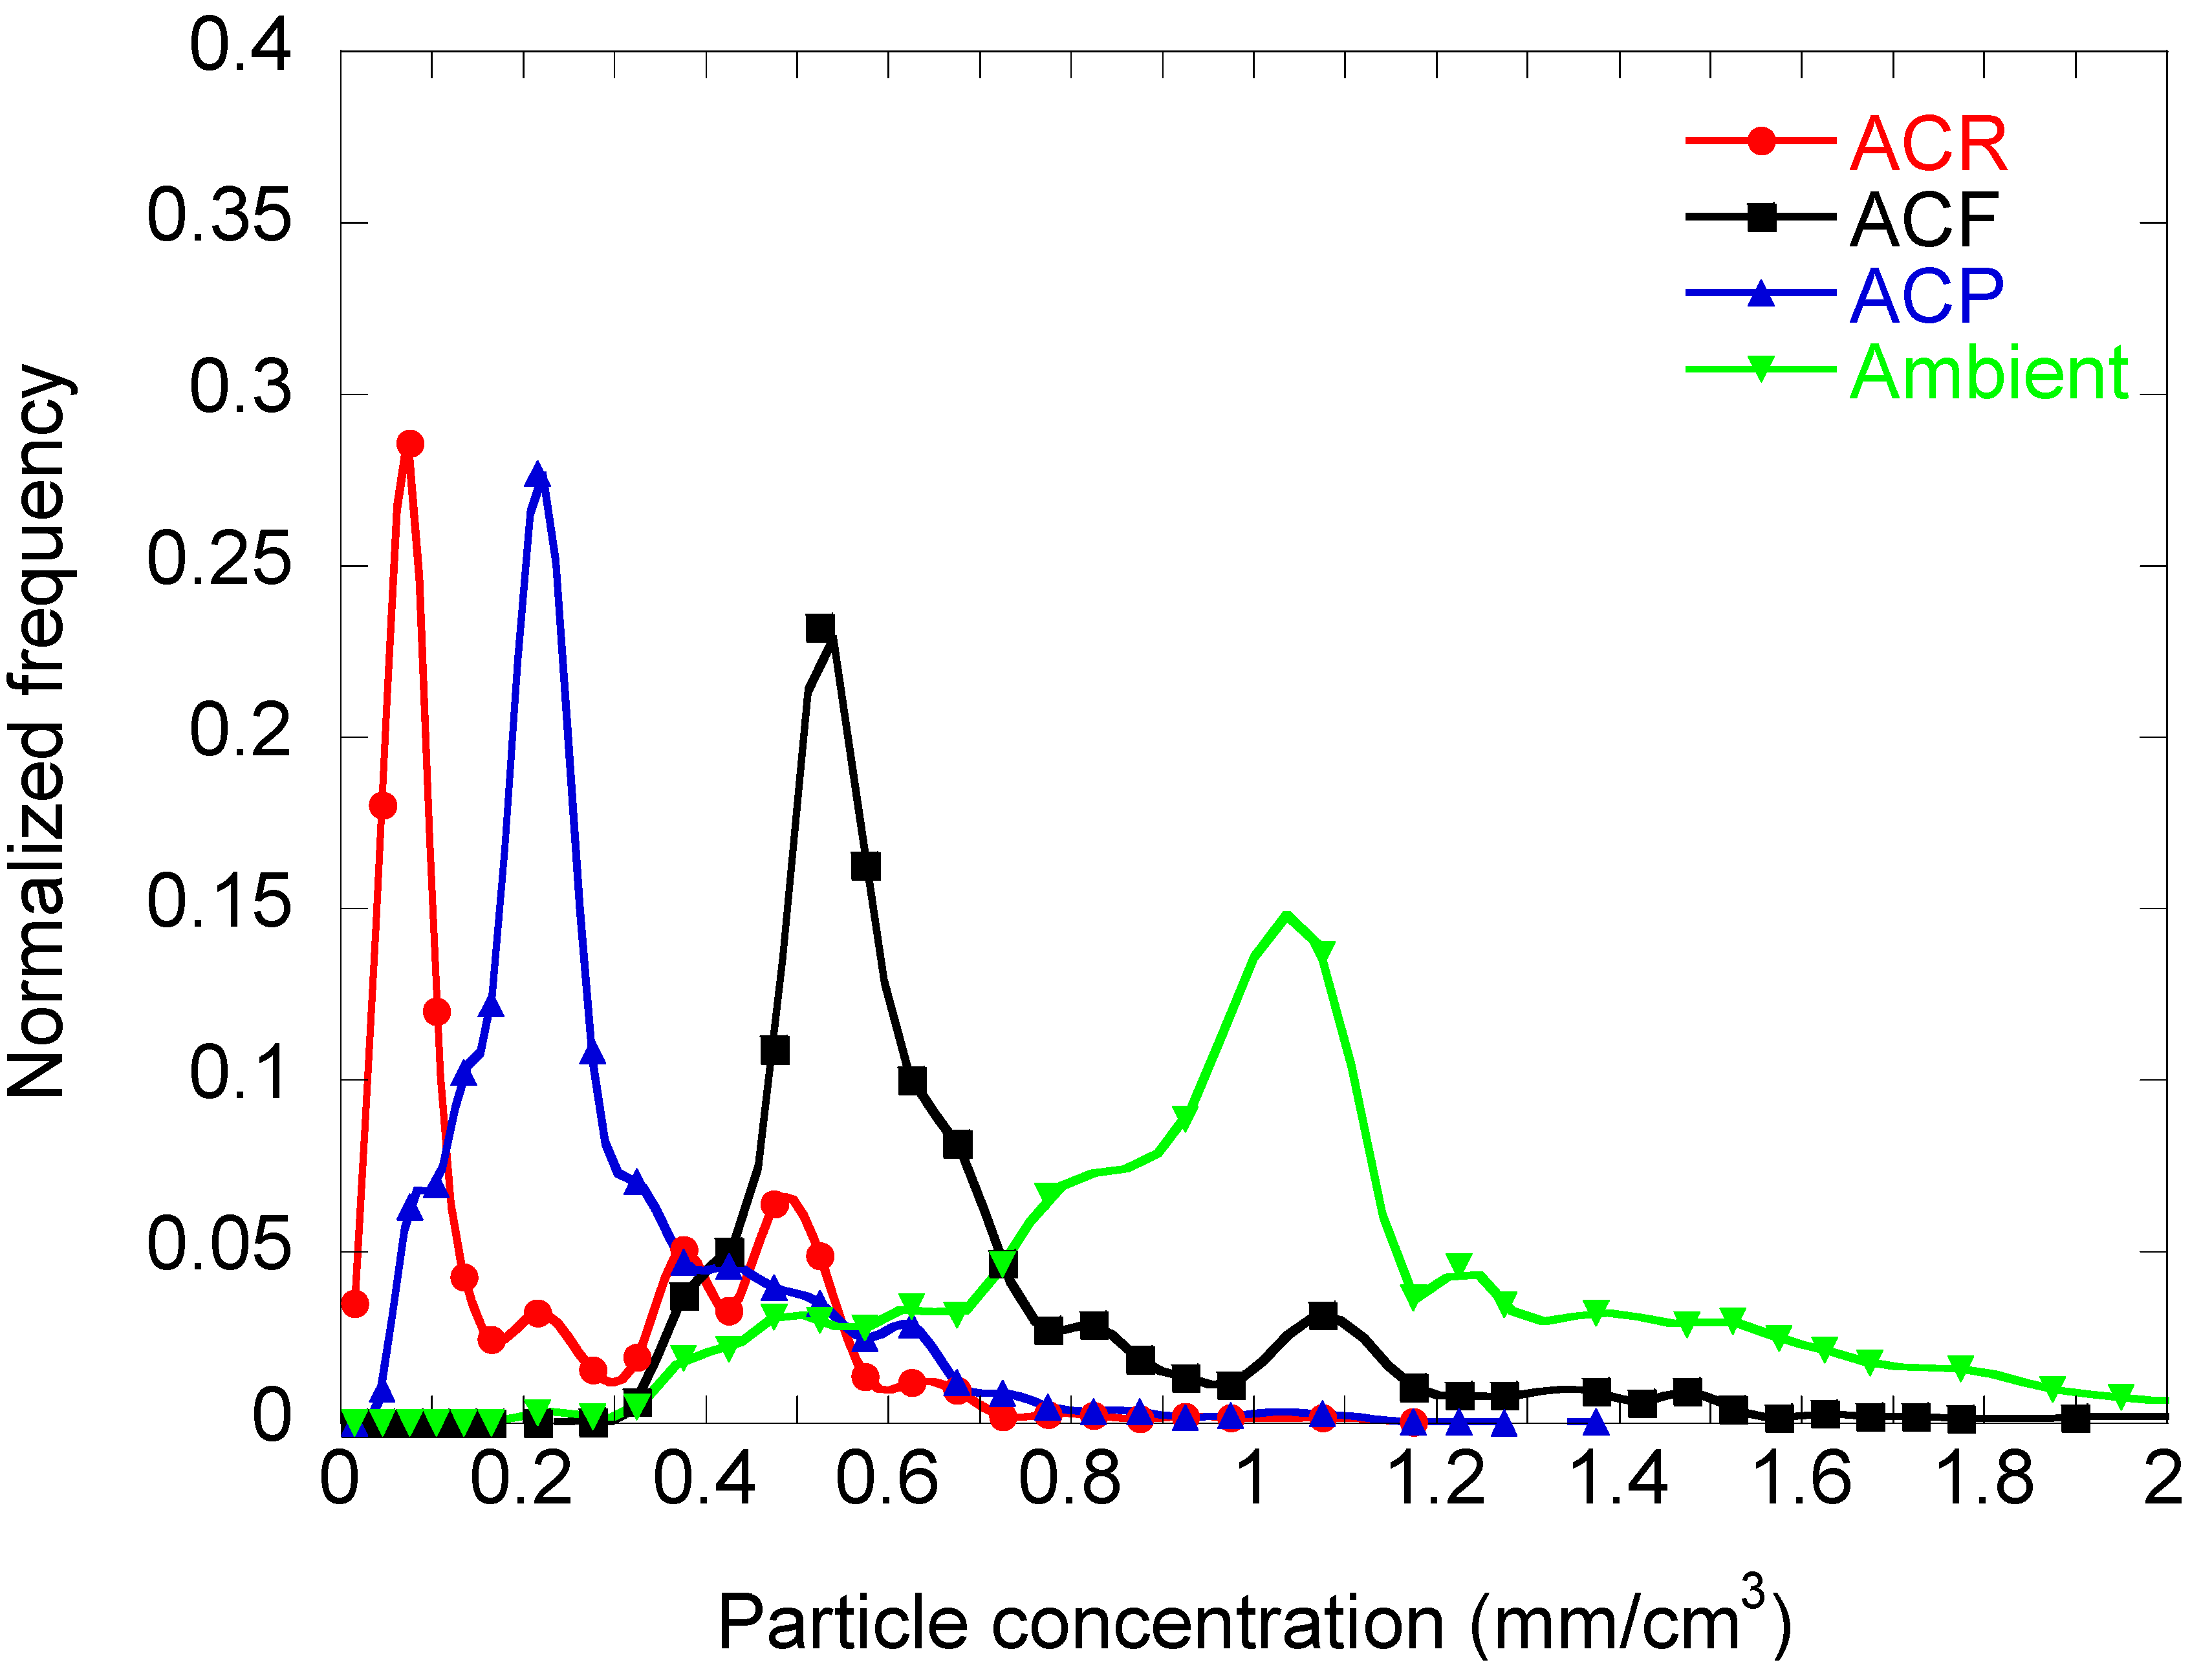
3.3. In-Cabin Air Quality

There is a time delay between in-cabin particle concentrations and outside particle concentrations. This time delay varies as a function of vehicle speed and HVAC settings. Interpreting real-time I/O ratio (particle concentration inside cabin over particle concentration outside cabin) requires a very sophisticated analysis, which tends to lead to large uncertainty and is beyond the scope of this paper [38]. Pham et al. have developed a test method to determine a cabin air quality index by using integrated I/O ratio over the duration of a test route [39]. Their goal is to compare different vehicles’ ability to maintain good cabin air quality using a standardized test route. They showed that the I/O ratio increases as the power of the metric increases with respect to particle diameter. I/O ratio determined by mass metric (d3) is larger than that by aerosol surface area (d1.13)—corresponding to the diffusion charger signal—and by a particle counter (d0). This is because small particles are preferentially removed inside the cabin due to higher diffusivity.
In the current study, our goal was to show the difference in cabin air quality in terms of particle concentration using different HVAC settings. A frequency plot was used to show the difference of in-cabin particle concentrations at different HVAC settings during the highway test. Particle surface area concentrations in mm/cm3 measured by EAD were normalized and plotted in Figure 8. The mode concentration in the frequency plot represents the most prevalent in-cabin particle concentrations during the test under specific air ventilation conditions. The highest value of particle concentration was 1.05 mm/cm3, recorded when windows were open and thus allowing on-road ambient particles to get into the vehicle cabin with no filtration. The mode particle concentration reduced to 0.55 mm/cm3 under ACF conditions, which showed a 48% reduction by the filtration effect of the pollen filter. Previous studies by the authors showed a reduction of particle concentrations by 30% when they drove their test vehicle at 15 mph in a parking lot at a fan speed of 2 (fan speed 8 is the maximum) [16,17]. We speculate that the difference in reduction compared to the previous study is in part due to using different methods to determine the I/O ratio—the current study used the ratio of mode particle concentrations while other studies used the I/O ratio of the quasi-steady state concentrations or integrated concentrations—and the use of a different metric (aerosol surface area) in this study. While this needs to be further investigated, it should be noted that the purpose of the current study was to show the difference in cabin air quality at different HVAC settings qualitatively, using a convenient measurement instrument (diffusion charger). The lowest mode particle concentration of ~0.08 mm/cm3 was observed during ACR conditions. This is almost a 92% reduction of particle concentration compared to the outside ambient concentration. Although air recirculation is beneficial to reduce in-cabin particle concentration, CO2 exhaled by passengers accumulates relatively fast during 100% recirculation [14]. Partial recirculation strategy controls the extent of recirculation as a function of the number of passengers, vehicle speed, fan speed, and cabin volume. This strategy can be implemented to take advantage of air recirculation while suppressing the negative effect of CO2 accumulation [17]. Although it was far from optimized, the ACP condition was a demonstration of such a condition. The mode particle concentration for ACP condition was 0.22 mm/cm3, which was between the ACF and ACR conditions, as expected. Further optimization can quantitatively inform us of the benefit of partial air recirculation.

3.4. Discussion

The experimental results summarized in Table 2 show that the order of AC power consumption of the three selected cabin air conditions for the SC03 cycle is ACF > ACR > ACO. The percentage AC power consumption increased as the outside temperature increased during the on-road test. ACR consumed an average 28.4% of the total power, which was 6.1% less than for ACF during the SC03 cycle in the lab conditions. On the other hand, ACR and ACF conditions showed little difference during the on-road test. ACR conditions improved relative fuel economy (or vehicle energy efficiency) compared to ACO conditions by ~20% and by ~8% compared to ACF conditions for SC03 test and on-road test, respectively (see Figure 6 and Figure 7). In addition, ACR conditions significantly reduced in-cabin particle concentrations by 85% and 92% in comparison to ACF conditions and ambient conditions, respectively. These results suggest that the driver (and/or passengers) who operates the vehicle with ACR conditions can increase vehicle fuel economy and improve cabin air quality with the caveat that ACR can lead to accumulation of CO2 in the cabin. As noted in the introduction, Toyota has implemented ACR conditions over the duration of ECO mode of the Prius 2017 to save fuel economy, and BMW adopted intermittent air recirculation to reduce exposure to air pollutants. The current study provides the basis for the development and implementation of such technologies, which can save energy and at the same time reduce the environmental impact of air pollutants to occupants in the vehicle.

4. Conclusions

We evaluated the impact of cabin air recirculation on the power consumption of the MAC and fuel economy of a hybrid electric vehicle. Testing was done using two types of driving route (on-road driving and chassis test on SC03) with three different cabin air conditions (ACF, ACR, and ACO) and an additional ventilation condition of ACP was conducted during the highway test. The MAC power consumption measured with two different driving conditions showed that the on-road driving route was less aggressive, which could have two to three times lower power consumption than the SC03 cycle. ACR used on average 28.4% of the total power and reduced power consumption by 6.1% in comparison to ACF for the SC03 cycle. However, on-road driving tests had minor differences in power consumption in all cabin air settings. These results imply that the MAC power consumption varied significantly depending on the driving cycle. We found that the AC recirculation condition improved relative fuel economy (or vehicle energy efficiency) compared to the AC off condition by 20%, and by 8% compared to AC fresh condition for SC03 and on-road tests, respectively. Furthermore, the AC recirculation and ACP (AC partial recirculation) conditions significantly reduced in-cabin particle concentrations by 92% and 79%, respectively, compared to outside ambient conditions.

Author Contributions

Conceptualization, H.J.; Investigation, E.B., L.P. and H.J.; Writing—original draft, C.L. and H.J.

Funding

The project was funded by California Energy Commission under EISG (Energy Innovations Small Grant) program with Grant No: 10-08TE.

Acknowledgments

The authors are grateful to Kurt Bumiller for his assistance on the SC03 test.

Conflicts of Interest

The authors declare no conflict of interest.

Abbreviations

ACOFresh mode with air conditioner (AC) offBEVBattery Electric Vehicle
ACRAir recirculation mode with AC onHEVHybrid electric vehicle
ACFFresh air mode with AC onFTPFederal Test Procedures
CSCharge SustainingMPGMiles per gallon
CDCharge DepletingPHEVPlug-in Hybrid Vehicle
EADElectrical aerosol detectorSOCState of charge
MACMobile air conditionerMPGMiles per gallon
ICEInternal combustion engineMPGeMiles per gallon equivalent
SFTPSupplemental FTPEPAEnvironmental Protection Agency
OBDOn-board diagnosticsPIDParameter identification
HVACHeating, ventilation, and air conditioningCPCCondensation particle counter
VERLVehicle Emission Research LaboratoryMAFMass air flow

References

  1. EPA. Final Rule for Model Year 2017 and Later Light-Duty Vehicle Greenhouse Gas Emission Standard and Corproate Average Fuel Economy Standards. 2012. Available online: https://www.epa.gov/regulations-emissions-vehicles-and-engines/final-rule-model-year-2017-and-later-light-duty-vehicle#rule-summary (accessed on 2 October 2018).
  2. Holmen, B.A.; Sentoff, K.M. Hybrid-Electric Passenger Car Carbon Dioxide and Fuel Consumption Benefits Based on Real-World Driving. Environ. Sci. Technol. 2015, 49, 10199–10208. [Google Scholar] [CrossRef] [PubMed]
  3. Bharathan, D.; Chaney, L.; Farrington, R.B.; Lustbader, J.; Keyser, M.; Rugh, J. An Overview of Vehicle Test and Analysis from NREL’s A/C Fuel Use Reduction Research. In Proceedings of the Vehicle Thermal Management Systems Conference & Exhibition (VTMS-8), Nottingham, UK, 20–24 May 2007. CP-540-41155. [Google Scholar]
  4. Zhang, Q.; Meng, Y.; Creiner, C.; Soto, C. Air Conditioning System Performance and Vehicle Fuel Economy Trade-Offs for a Hybrid Electric Vehicle; 2017-01-0171; SAE International: Warrendale, PA, USA, 2017. [Google Scholar] [CrossRef]
  5. Nam, E.K.; Colvin, A.D. An Experimental Procedure for Simulating an SC03 Emissions Test with Air Conditioner on; SAE Technical Paper Series, 2004-01-0594; SAE International: Warrendale, PA, USA, 2004. [Google Scholar] [CrossRef]
  6. Sciance, F.; Nelson, B.; Yassine, M.; Patti, A.; Rao, L. Developing the AC17 Efficiency Test for Mobile Air Conditioners; SAE International: Warrendale, PA, USA, 2013; p. 0569. [Google Scholar] [CrossRef]
  7. U.S. EPA. Emission Standards Reference Guide. EPA SC03 Supplemental Federal Test Procedure (SFTP) with Air Conditioning. 2015. Available online: https://www.epa.gov/emission-standards-reference-guide/epa-sc03-supplemental-federal-test-procedure-sftp-air (accessed on 2 October 2018).
  8. Scales, B. VSD Compressor Control. 2013. Available online: http://www.airbestpractices.com/technology/compressor-controls/vsd-compressor-control (accessed on 2 October 2018).
  9. Shendge, S.; Tilekar, P.; Dahiya, S.; Kapoor, S. Reduction of MAC Power Requirement in a Small Car; 2010-01-0803; SAE International: Warrendale, PA, USA, 2010. [Google Scholar] [CrossRef]
  10. Srinivasan, D.; Phadke, P. Reducing AC Power Consumption by Compressor Downsizing on a Sports Utility Vehcile. In Proceedings of the International Refrigeration and Air Conditioning Conference Paper, West Lafayette, IN, USA, 17–20 July 2006; R048. pp. 1–7. [Google Scholar]
  11. Farrington, R.; Rugh, J. Impact of Vehicle Air-Conditioning on Fuel Economy, Tailpipe Emissions, and Electric Vehicle Range; NREL/CP-540-28960; National Renewable Energy Laboratory: Golden, CO, USA, 2000. [Google Scholar]
  12. Shete, K. Influence of Automotive Air Conditioning Load on Fuel Economy of IC Engine Vehicles. Int. J. Sci. Eng. Res. 2015, 6, 1367–1372. [Google Scholar]
  13. Jung, H.; Grady, M.; Victoroff, T.; Miller, A. Simultaneously reducing CO2 and particulate exposures via fractional recirculation of vehicle cabin air. Atmos. Environ. 2017, 160, 77–88. [Google Scholar] [CrossRef] [PubMed]
  14. Zhu, Y.; Eiguren, F.A.; Hinds, W.C.; Miguel, A.H. In-cabin commuter exposure to ultrafine particles on Los Angeles freeways. Environ. Sci. Technol. 2007, 41, 2138–2145. [Google Scholar] [CrossRef] [PubMed]
  15. Pui, D.Y.; Qi, C.; Stanley, N.; Oberdorster, G.; Maynard, A. Recirculating air filtration significantly reduces exposure to airborne nanoparticles. Environ. Health Perspect. 2008, 116, 863. [Google Scholar] [CrossRef] [PubMed]
  16. Jung, H. Modeling CO2 Concentration in Vehicle Cabin; 2013-01-1497; SAE International: Warrendale, PA, USA, 2013. [Google Scholar] [CrossRef]
  17. Grady, M.L.; Jung, H.; Kim, Y.C.; Park, J.K.; Lee, B.C. Vehicle Cabin Air Quality with Fractional Air Recirculation; 2013-01-1494; SAE International: Warrendale, PA, USA, 2013. [Google Scholar] [CrossRef]
  18. Monforte, R.; Lovuolo, F.; Rostagno, M.; Seccardini, R. New MAC Technologies: Fuel Efficiency Effect in Real Driving of the Air Intake Flap Management; 2015-01-1609; SAE International: Warrendale, PA, USA, 2015. [Google Scholar] [CrossRef]
  19. The International BMW Website. Automatic air Recirculation (AAR). 2017. Available online: http://www.bmw.com/com/en/insights/technology/technology_guide/articles/automatic_air_recirculation.html?source=index&article=automatic_air_recirculation/;2017 (accessed on 2 October 2018).
  20. Toyota Prius Operating Modes. ECO, Normal, PWR and EV. 2016. Available online: http://prius.wikia.com/wiki/Operating_modes_(ECO,_Normal,_PWR_and_EV)/;2016 (accessed on 2 October 2018).
  21. U.S. Energy Information Administration. California Leads the Nation in the Adoption of Electric Vehicles. Todays in Energy. Available online: https://www.eia.gov/todayinenergy/detail.php?id=19131/;2014 (accessed on 2 October 2018).
  22. Rugh, J.P.; Hovland, V.; Andersen, S.O. Significant Fuel Savings and Emission Reductions by Improving Vehicle Air Conditioning; National Renewable Energy Laboratory: Golden, CO, USA, 2004. [Google Scholar]
  23. Johnson, V.H. Fuel Used for Vehicle Air Conditioning: A State-by-State Thermal Comfort-Based Approach; SAE Technical Paper Series; 2002-01-1957; SAE International: Warrendale, PA, USA, 2002. [Google Scholar]
  24. Jung, H.; Silva, R.; Han, M. Scaling Trends of Electric Vehicle Performance: Driving Range, Fuel Economy, Peak Power Output, and Temperature Effect. World Electr. Veh. J. 2018, 9, 46. [Google Scholar] [CrossRef]
  25. Menke, J.; Scora, G. Mobile Energy Emission Telematics System (M.E.E.T.S.); University of California: Riverside, CA, USA, 2011. [Google Scholar]
  26. DeFries, T.H.; Sabisch, M.; Kishan, S.; Posada, F.; German, J.; Bandivadekar, A. In-Use Fuel Economy and CO2 Emissions Measurement Using OBD Data on US Light-Duty Vehicles; SAE Technical Paper Series; 2014-01-1623; SAE International: Warrendale, PA, USA, 2014. [Google Scholar] [CrossRef]
  27. OBD-II Resource. OBD-II Software Resource for Developers and Users. 2010. Available online: http://obdcon.sourceforge.net/2010/06/obd-ii-pids/ (accessed on 2 October 2018).
  28. Jung, H.; Kittelson, D.B. Characterization of Aerosol Surface Instruments in Transition Regime. Aerosol Sci. Technol. 2005, 39, 902–911. [Google Scholar] [CrossRef] [Green Version]
  29. Pham, L.; Jung, H.S. Alternative metrics for spatially and temporally resolved ambient particle monitoring. J. Aerosol Sci. 2016, 102, 96–104. [Google Scholar] [CrossRef]
  30. Green Car Reports. 2012 Toyota Prius Plug-in Hybrid Window Sticker Showing EPA Fuel Efficiency Ratings. 2012. Available online: https://www.greencarreports.com/image/100383903_2012-toyota-prius-plug-in-hybrid-window-sticker-showing-epa-fuel-efficiency-ratings (accessed on 2 October 2018).
  31. Hybrid Cars. 2012 Toyota Prius Plug-in Hybrid Review. 2012. Available online: http://www.hybridcars.com/toyota-prius-plug/;2012 (accessed on 2 October 2018).
  32. Khoury, G.; Clodic, D. Method of Test and Measurements of Fuel Consumption Due to Air Conditioning Operation on the New Prius II Hybrid Vehicle; SAE Technical Paper Series; 2005-01-2049; SAE International: Warrendale, PA, USA, 2005. [Google Scholar] [CrossRef]
  33. DieselNet. Emission Test Cycles: SFTP-SC03. 2013. Available online: https://www.dieselnet.com/standards/cycles/ftp_sc03.php (accessed on 2 October 2018).
  34. EPA. Sample Fuel Economy Calculations. 1987, Code of Federal Regulations 40 CFR Appendix II to Part 600. Available online: https://www.law.cornell.edu/cfr/text/40/appendix-II_to_part_600 (accessed on 2 October 2018).
  35. Silva, C.; Ross, M.; Farias, T. Evaluation of energy consumption, emissions and cost of plug-in hybrid vehicles. Energy Convers. Manag. 2009, 50, 1635–1643. [Google Scholar] [CrossRef]
  36. USNEWS. What Is MPGe? 2018. Available online: https://cars.usnews.com/cars-trucks/what-is-mpge (accessed on 2 October 2018).
  37. Durbin, T.D.; Karavalakis, G.; Russell, R.L.; Short, D.; Hajbabaei, M.; Villela, M. Aromatics Final Report; American Petroleum Institute: Washington, DC, USA, 2013. [Google Scholar]
  38. Xu, B.; Zhu, Y. Quantitative analysis of the parameter affecting in-cabin to on-roadway (I/O) ultrafine particle concentration ratio. Aerosol Sci. Technol. 2009, 43, 400–410. [Google Scholar] [CrossRef]
  39. Pham, L.; Molden, N.; Boyle, S.; Johnson, K.; Jung, H. Development of a standard testing method for vehicle cabin air quality index. SAE Int. J. Commer. Veh. submitted.
Figure 1. SC03 cycle speed plot.
Wevj 09 00051 g001
Figure 2. On-road route (3.4 miles) for tests in charge depletion mode.
Wevj 09 00051 g002
Figure 3. Average speed plot of the on-road route.
Wevj 09 00051 g003
Figure 4. Comparison of fuel consumption between carbon balance and OBD-II methods over the SC03 cycle.
Wevj 09 00051 g004
Figure 5. AC power consumption (%) in relation to total power consumption of on-road and SC03 drive cycles.
Wevj 09 00051 g005
Figure 6. Fuel Economy calculated from the OBD-II data for all tests.
Wevj 09 00051 g006
Figure 7. Difference in fuel economy relative to average ACO conditions result.
Wevj 09 00051 g007
Figure 8. Normalized frequency plot of particle surface area concentrations, corresponding to the diffusion charger signal, during the highway test. The ambient condition was measured with two front windows fully opened.
Wevj 09 00051 g008
Table 1. List of on-board diagnostic parameter identifications (PID) used in testing. Mode 21 signifies a Toyota defined PID. Letters represent the location of the value in the OBD-II output [27].
ModePIDData Bytes ReturnedDescriptionUnitsFormula
218118Battery Block Voltage-V01V(A*256+B)*79.99/65535
218118Battery Block Voltage-V02V(C*256+D)*79.99/65535
218118Battery Block Voltage-V03V(E*256+F)*79.99/65535
218118Battery Block Voltage-V04V(G*256+H)*79.99/65535
218118Battery Block Voltage-V05V(I*256+J)*79.99/65535
218118Battery Block Voltage-V06V(K*256+L)*79.99/65535
218118Battery Block Voltage-V07V(M*256+N)*79.99/65535
218118Battery Block Voltage-V08V(O*256+P)*79.99/65535
010C2Engine RPMrpm((A*256)+B)/4
217D3AC Power ConsumptionhpC*50*0.001341022089595
21989Batt. Pack Current Valueamperes(A*256+B)/100–327.68
015B1State of Charge%A*20/51
01461Ambient Air Temperature°CA–40
010D1Vehicle speedmphA*6213/10000
01102MAF air flow rategrams/sec((A*256)+B)/100
Table 2. Overview of the experimental design and results.
ParametersCycle/Road
Lab SC03On-Road Surface RoadOn-Road Highway
Total distance (km)6.66.196.3
Avg/max speed (km/h)34.8/88.238.1/65.571.6/118.3
Vehicle modeCSCDCS
AC modeACOACRACFACOACRACFACRACPACFAmb.
Fuel economy (kWh/100km)14.821.424.712.916.7 17.5NMNMNMNM
*AC power consumption (%)0.028.434.50.011.812.0NMNMNMNM
Particle conc. (mm/cm3)NMNMNMNMNMNM0.080.220.551.05
NM means not measured *AC power consumption (%) is relative to the ACO condition.

