Fuzzy Prediction of Power Lithium Ion Battery State of Function Based on the Fuzzy c-Means Clustering Algorithm


School of Automation Engineering, University of Electronic Science and Technology of China, Qingshuihe Campus of UESTC, No.2006, Xiyuan Avenue, West Hi-Tech Zone, Chengdu 611731, China
*
Author to whom correspondence should be addressed.
World Electr. Veh. J. 2019, 10(1), 1; https://doi.org/10.3390/wevj10010001
Submission received: 8 November 2018
/
Revised: 10 December 2018
/
Accepted: 17 December 2018
/
Published: 3 January 2019
Abstract
:Following the widespread and large-scale application of power lithium ion battery, State of Function (SOF) estimation technology of power lithium ion batteries has gained an increasing amount of attention from both scientists and engineers. During the lifetime of the power lithium ion battery, SOF reflects the maximum instantaneous output power of the battery. When discarded, it is able to show the degree of performance degradation of the power battery when also taken as a performance evaluation parameter. In this paper, the variables closely related to SOF have been selected to conduct the fuzzy inference system, which is optimized by the fuzzy c-means clustering algorithm, to estimate the SOF of the power lithium ion battery, whose relations can be proved by experimental data. Our simulation results and experimental results demonstrate the feasibility and advantages of the estimation strategy.
1. Introduction
With the electric vehicle market booming and production of the power lithium ion battery rapidly increasing, the technology of power lithium ion battery state estimation has become one of the key techniques for promoting the healthy and sustainable development of the electric vehicle industry. State of Function (SOF) of the power lithium ion battery indicates the power output capability of the battery. SOF is of great research significance since it shows the instantaneous power output capability of the electric vehicle when the power battery is used online, and it measures the overall performance of the power battery for the off-line case. There are two types of definitions for the SOF of a power lithium ion battery, which are based on the discrete and continuous variables, respectively. In this paper, the continuous one is adopted, as it is able to provide more accurate and reasonable measurements. The definition of SOF is given as
where is the maximum discharge power that the battery can support, and is the initial maximum discharge power of the battery when it leaves the factory. The physical meaning of SOF is clearly defined as the ratio of the current power output capacity of the battery to the initial one. The reason why SOF is particularly difficult to estimate is because it fluctuates widely. Alexander Farmann and Dirk Uwe Sauer wrote a detailed summary of the SOF estimation strategy, and the SOF estimation strategy has so far been considered as mainly including methods based on the model and one based on the feature variables [1]. At present, SOF research has been primarily concentrated on two methods: one is to use the equivalent circuit and battery mechanism for battery modeling, and then obtain the variables directly related to the battery SOF, such as voltage, capacity, and other related parameters, to calculate SOF [2,3,4,5,6,7,8,9,10], but the calibration process is often expensive and has a long cycle; the other is to analyze the variables closely related to SOF, which is used in the estimation equation of SOF adopting data statistical methods, such as the neural network and Kalman filter, to acquire the estimation equation of SOF and then conduct the estimation of SOF [3,4,5,6,7,8,9,10,11,12,13,14,15,16,17,18,19,20,21,22,23,24,25,26,27,28,29,30]—however, this needs a large amount of data and a lot of preparatory work.
The fuzzy inference system, based on fuzzy mathematics, is an advanced intelligent system which uses fuzzy rules to describe knowledge and experience and make decisions. It is essentially function-mapping from input space to output space [31,32,33,34,35,36]. The fuzzy inference system has been widely applied in many fields, and uses power battery state estimation as an outstanding characteristic to directly obtain the output value through relevant variables. In order to decrease estimation error, the fuzzy inference system, when used to estimate the SOF, is optimized by the fuzzy c-means clustering algorithm (FCM). This algorithm is one of the most famous clustering techniques. Clustering techniques are mainly a process of decomposing data into different subgroups or clusters according to similarities among the instances, which means samples of the same subgroup are more similar to each other than the samples belonging to different subgroups [37]. They are often divided into two categories, namely, the hard (crisp) clustering category and the fuzzy (soft) one. The FCM algorithm belongs to the soft clustering category [38,39,40,41,42]. SOF can be significantly affected by many factors, such as the feature variables, temperature, and state of charge (SOC) of the battery. This paper chooses the key variables and takes the fuzzy prediction of FCM to conduct SOF estimation, which has the advantages of easy implementation and full conformation to the change rule of SOF.
2. Selection of Relevant Variables of SOF
2.1. SOC
The state of charge (SOC) of the battery describes the current residual capacity of the battery. Obviously, the total residual capacity of the battery would significantly affect the maximum instantaneous output power of the battery which is measured by the SOF, meaning that SOC is taken as one of the key variables related to SOF. On the other hand, due to the strong correlation between the SOC and the open circuit voltage of the battery, the voltage is likely to no longer be taken into consideration.
2.2. SOH
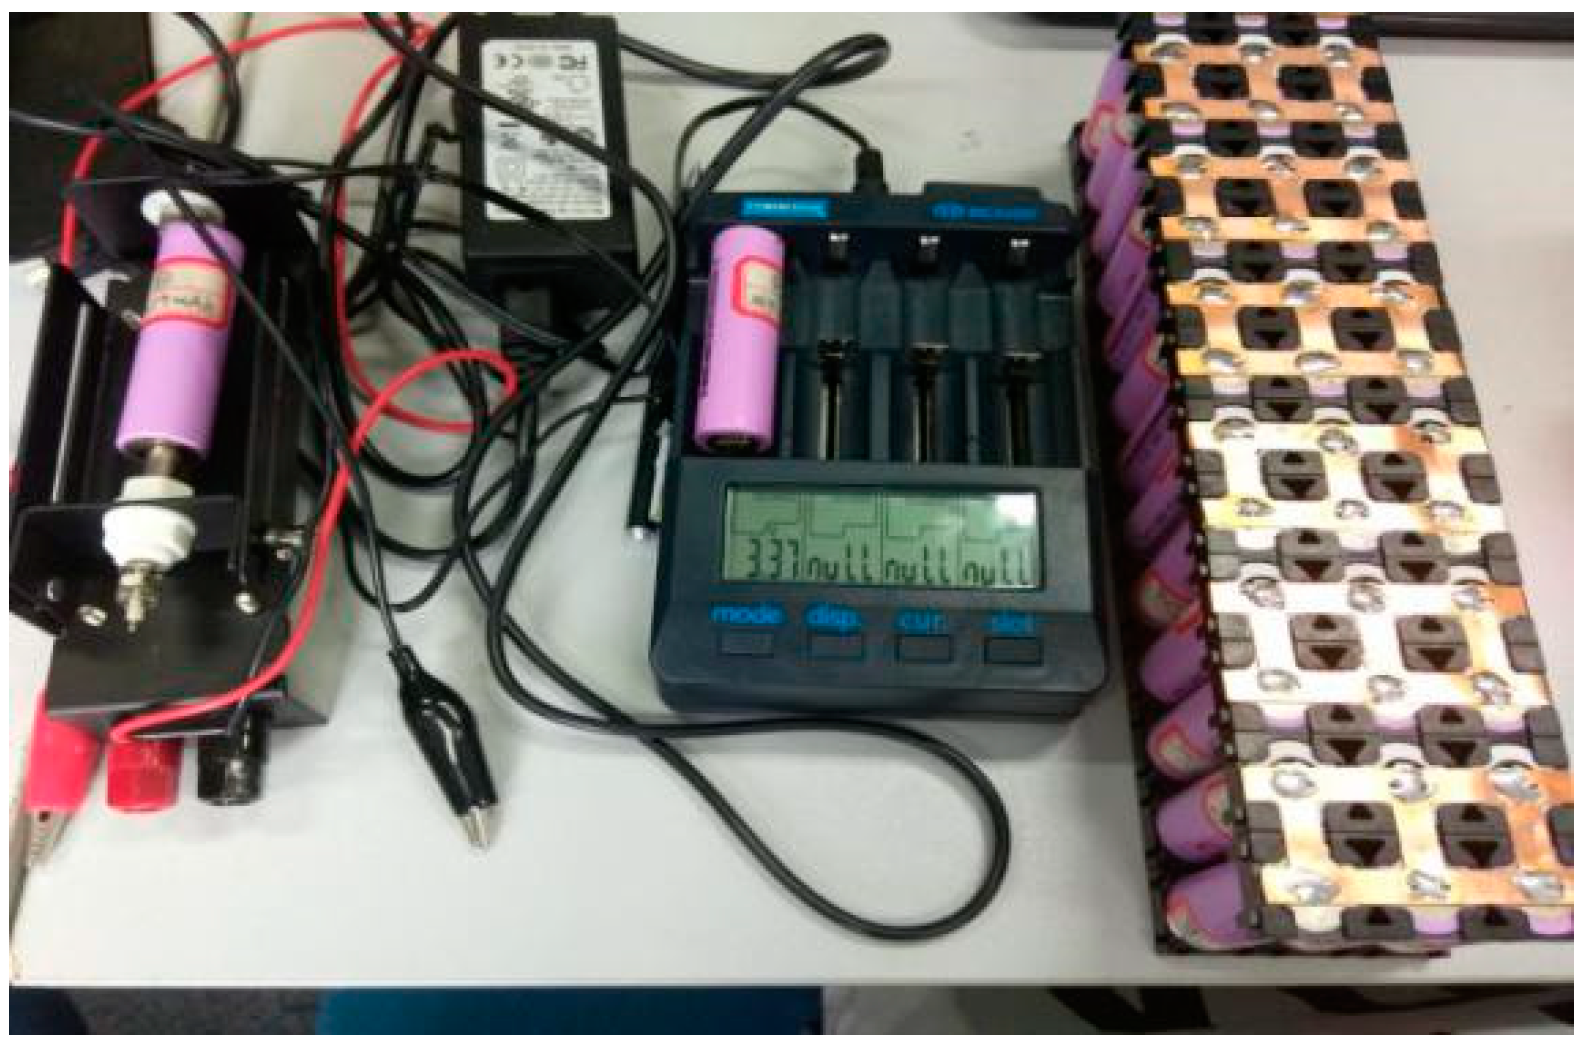
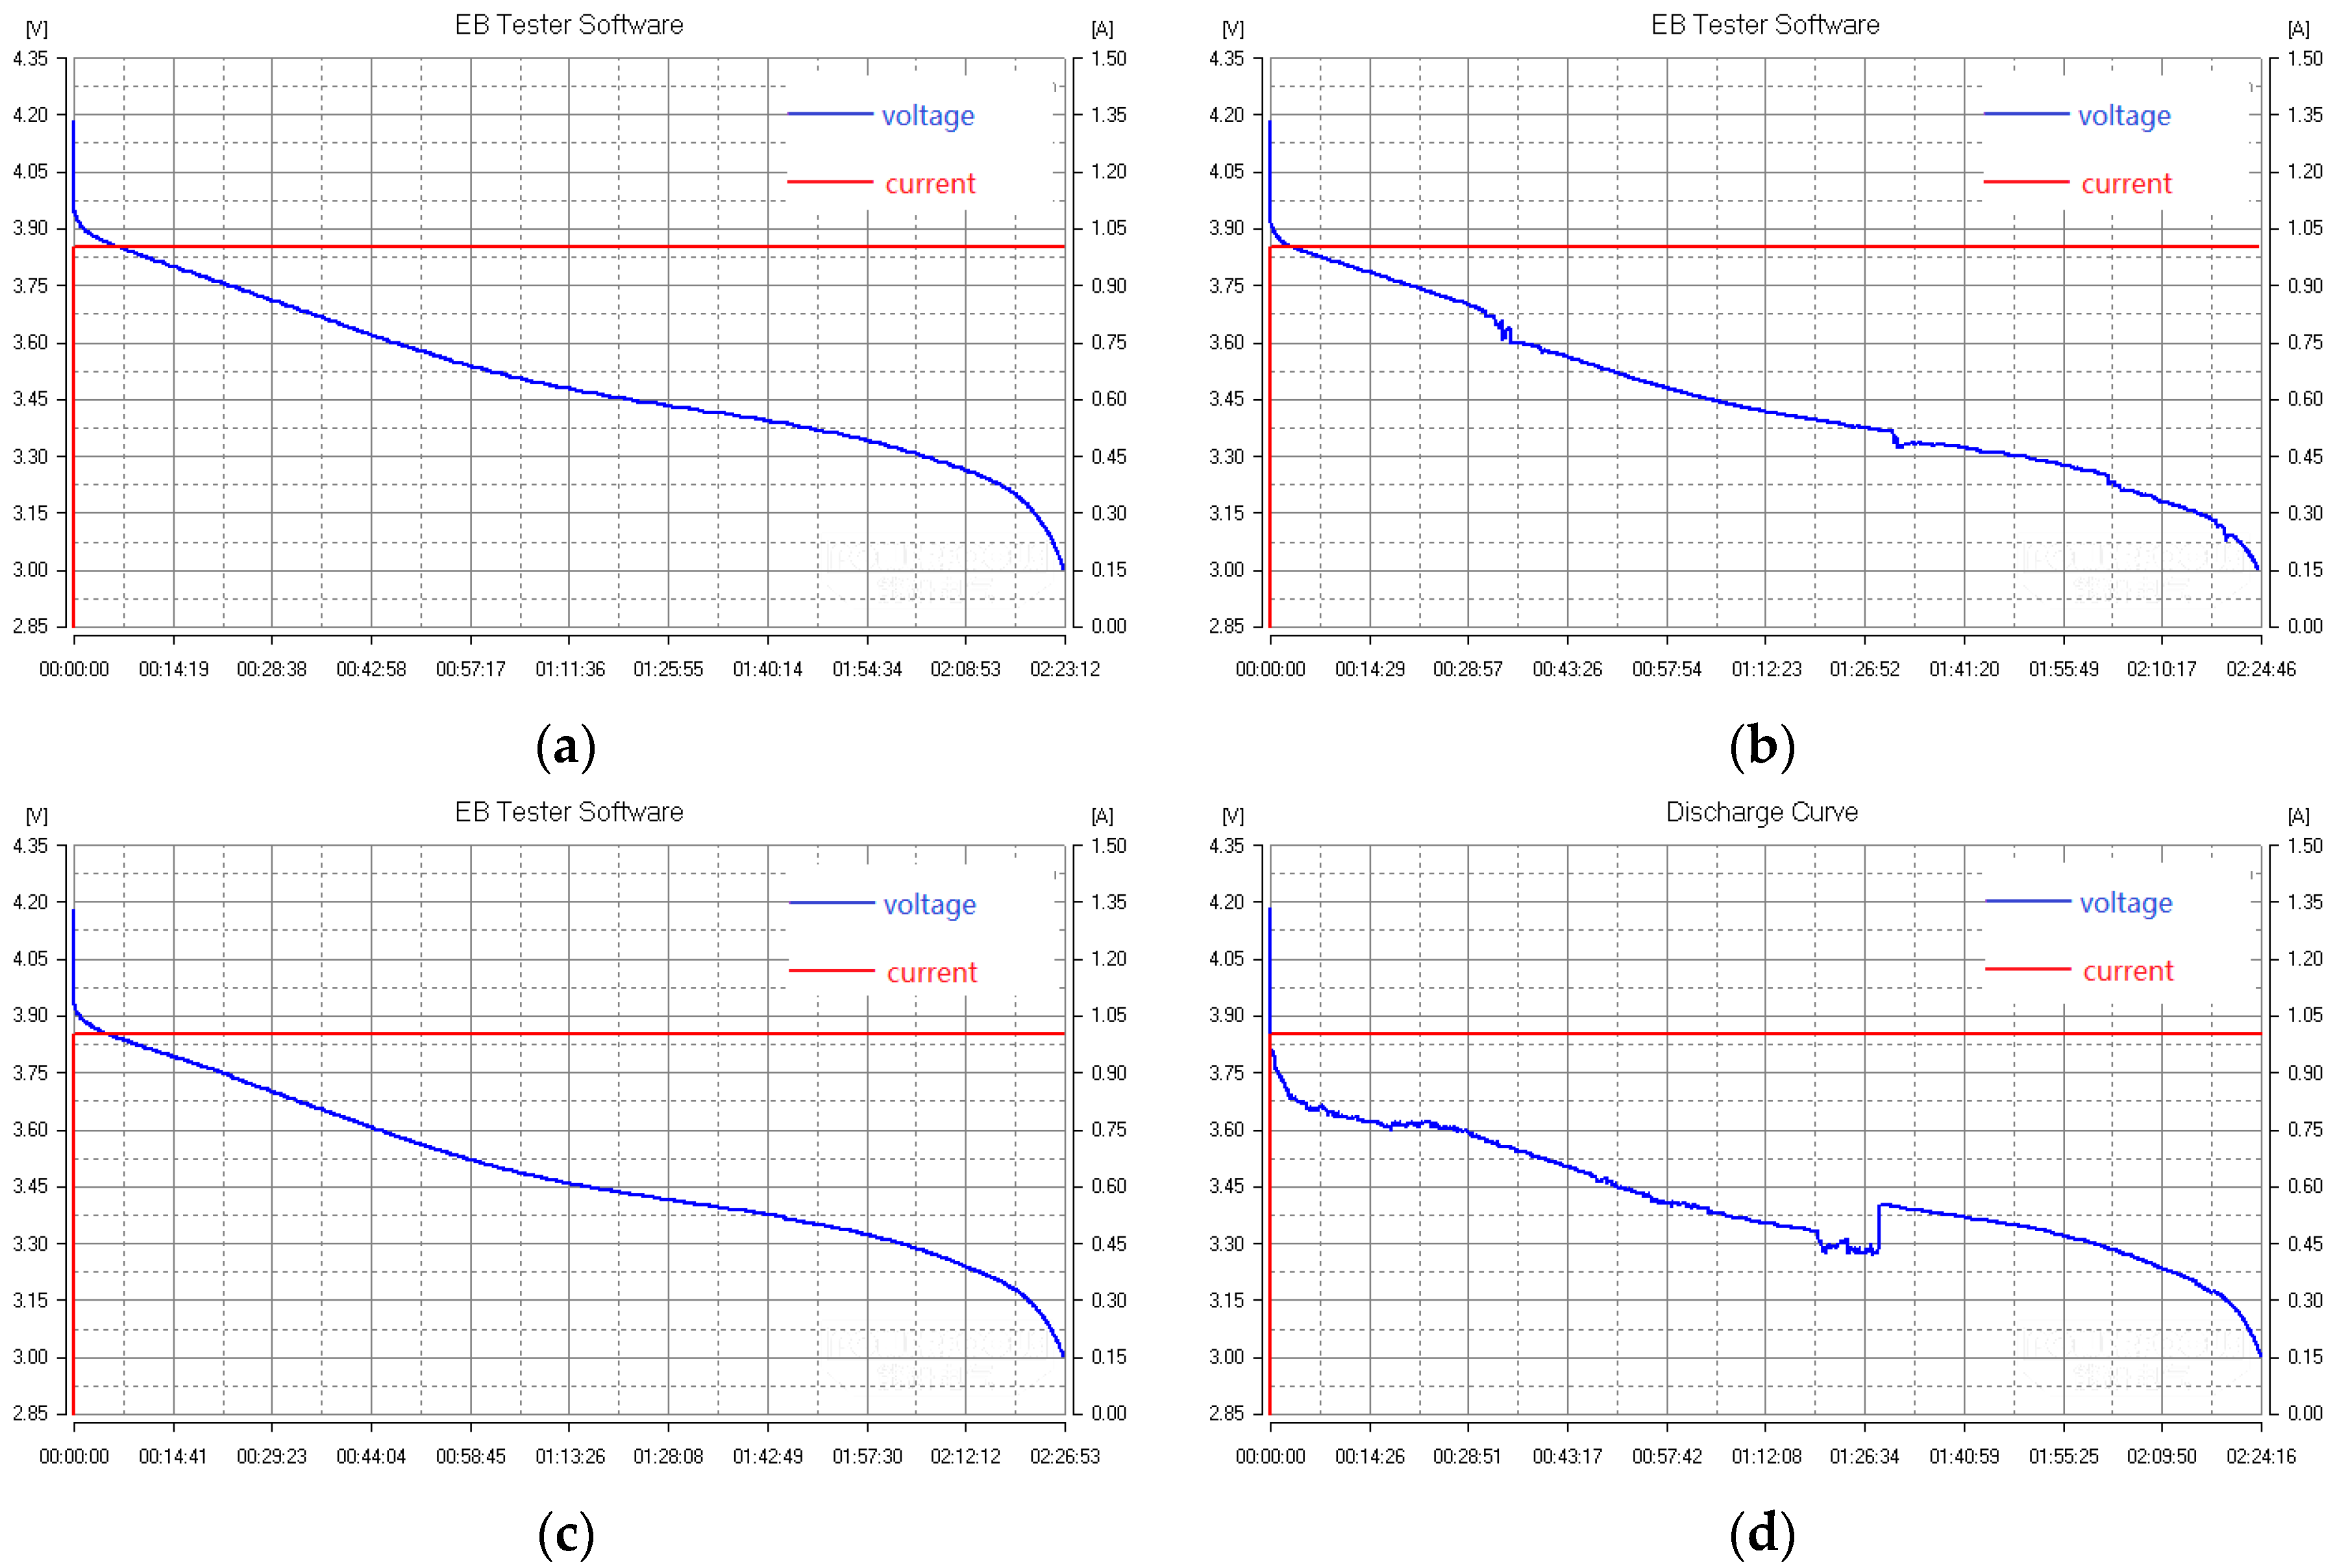
The definition of the battery health state or state of health (SOH) is the ratio between the total capacity that the battery can currently provide after being fully charged, and the initial value when the battery has left the factory. SOH measures the degree of battery degradation, where battery degradation is one of the reasons which directly result in a change of the battery’s maximum output power. In this paper, 18,650 ternary lithium batteries were taken as the experimental object to carry out the same discharge experiment at different SOH values—the experimental platform is shown in Figure 1, and the experiment results are shown in Figure 2. From Figure 2a–d, the values of the battery’s SOH are shown to decrease gradually, which means that the battery in Figure 2a has the highest SOH, and the one in Figure 2d has the lowest. It can be seen that the voltage drop curves of batteries with different SOH demonstrate a clear distinction under the same discharge current; that is, SOH has a remarkable effect on the instantaneous output power of the battery. However, thanks to the strong correlation between the SOH and internal resistance, studying the influence of battery internal resistance on SOF was not necessary.
2.3. Maximum C-Rate (Charge–Discharge Rate)
The discharge current of the battery can vary greatly, and the maximum C-rate supported by the battery is one of the main factors that determine the output power of the battery. In many research reports, the maximum C-rate is also used as the key parameter to estimate SOF. In this paper, 18,650 ternary lithium batteries are used as the experimental object to explore the relation between the maximum C-rate and SOF. By increasing the discharge current gradually, the maximum C-rate can be acquired and the results are shown in Figure 3. It can be seen that the battery has different voltage drops and is under different discharge currents. Specifically, in Figure 3d, the battery voltage initially drops rapidly to 3.62 V, the critical voltage of the battery in normal state, which means that the maximum C-rate of the battery is 3C.
3. Prediction of SOF Based on the Fuzzy Inference System Optimized by the FCM Algorithm
The reason for choosing only the three variables above is that the fuzzy inference system cannot be too complex to conduct. In this section, the membership function and the fuzzy reasoning process will be established carefully, where the fuzzy c-Means clustering algorithm is used to optimize the membership function and the fuzzy rule of the inference system based on the relationship between the relevant variables and the SOF.
3.1. Fuzzy c-Means Clustering
The fuzzy clustering method provides an uncertain description of the sample or object, where one input data point could belong to multiple clusters with different degrees specified by its membership function, which coincides well with the real situation of the world. It has been widely used in many fields. Fuzzy C-means clustering (FCM) is the most famous soft clustering technique, and is also called fuzzy ISODATA. It was proposed by Bezdek as an alternative to the k-means clustering, an earlier hard clustering technique [11]. FCM provides a better description tool for real situations as the boundary is not as clear as with the k-means algorithm, especially in cases where there are missing data. Furthermore, the original k-means algorithm could be trapped in a local minimum status unless proper initial values are selected. The fuzzy c-means technique is less likely to have such problems [15]. FCM partitions the input data into fuzzy clusters by minimizing the following cost objective function, which has a pre-defined or fixed number of clusters, , and a fuzziness parameter [11]:
where is the partition (membership) matrix and is the likelihood value that indicates the degree to which the ith input data, , belongs to the kth cluster, (), . The higher means that demonstrates a stronger association with . are the centers of the clusters, while refers to the center of the ith cluster. is the distance between the kth input data and ith cluster center. It generally refers to the Euclidean distance. , the fuzziness parameter, is used to set the fuzziness of the cluster. Its value range is . At the left limit , the method degenerates into a standard K-means. is the number of input data [11].
The membership matrix satisfies the following constraints:
The objective function, via the Lagrange multipliers method, can now be defined as:
where is the Lagrange multiplier.
is generally given by the following formula:
Minimizing the objective function, , shown as in Equation (3), the new cluster center and optimum membership value can be obtained:
The FCM algorithm is an iterative process, according to the iterative equations given above. The method is described by the following algorithm [42,43,44]:
Acquire the input data; set the number of clusters, , the degree of fuzziness, , and the termination constant, (maximum iteration number), and . Randomly initialize the partition matrix, , under the constraint Formula (3).
Step 1. Get the cluster center according to Formula (7) using the initial membership values.
Step 2. Starting the iteration, ;
Step 2.1. Calculate the new membership values, , using the membership Equation (7), where is the distance between input data, , and cluster center, , after the last iteration.
Step 2.2. Get the new cluster center, , with Formula (6) using the membership values, , after the last iteration.
Step 2.3. Stop the iteration if iteration number , or . Otherwise go to step 1.
3.2. Estimate the SOF
In light of the circumstances of the SOF estimation process, the fuzzy inference system improved by the fuzzy C mean clustering (FCM) algorithm is constructed. The inference system is then adopted to estimate the battery SOF. The following steps are used in the proposed algorithm:
(1) Set the number of clusters and fuzzy subsets of input and output variables:
The fuzzy prediction model for SOF estimation belongs to the multi-input single-output (MISO) systems. The fuzzy rules can be simply expressed as:
: if is , is , is , then is .
Here, is the jth rule; is the ith input lingual variable; is the jth fuzzy subset of, , for this rule; is the jth fuzzy set of the output lingual variable, , for this rule.
About 154 observation samples were obtained through experiments, which are represented by .
where, is the pth observation value of the ith input lingual variable, ; is the pth observation value of the output variable.
Then, the set of output language variables, , is extracted from :
Carry out fuzzy clustering of based on fuzzy c-Means. Set the number of clusters as three. The jth cluster, , can be expressed as:
Here, means output samples, , are classified into the jth output cluster through FCM. So, can be divided into three subsets by the output variable cluster, :
Then, samples of each input language variable are classified into three subsets through :
Here, is for the sample set of ith input language variables which correspond to the jth output language variable subset, . The last step is to conduct the FCM algorithm for :
is the kth subclass of set . So far, all clustering definitions are finished. The whole classification process of the sample set is shown in Figure 4.
At the first level, construct the fuzzy subset according to the output lingual variable, . Then, at the second level, build the fuzzy subset in light of the input lingual variable based on .
(2) Constructing the fuzzy subset membership function:
According to the analysis of input and output variables, build triangle fuzzy sets, which are extraordinarily simple and easily used to calculate the membership value. There are three key parameters in the triangular membership function, represented here by letters and . Combined with the classification results, the parameter values are set as follows:
where is for the sample set of fuzzy language variables such as and . is an adjustable parameter of the membership function. Here, it is set as 0.5. There are two steps in the process: firstly, obtain the value of and by clustering the results of the lingual variables. Then calculate the triangular membership function on the basis of the distribution and distance of the cluster center.
(3) Building the fuzzy rule base
According to the fuzzy set provided before and the general form of fuzzy rules, we obtain the following fuzzy rules
where , . means the ith input lingual variable, , of the input data is partitioned by FCM into the subset of corresponding to the jth output subset.
The rule base is constructed after all the fuzzy rules are summed up.
The SOC domain is [0%–100%].
The SOH domain is [0%–100%].
The C-rate domain is [0–2C].
The SOC fuzzy set can be described in detail as . L, M, and H are less than 40%, 40%–75%, and greater than 75%, respectively.
The SOH fuzzy set can also be described as . L, M, H are less than 40%, 40%–75%, and greater than 75%, respectively, which is the same as the SOC.
The C-rate fuzzy set is . L, M, and H are less than 0.6C, 0.6C–1.2C, and 1.2C–2C, respectively.
Take the first three elements of a four-dimensional vector as the three linguistic variables, and the forth one is used as the output lingual variable of SOF. The rules are:
(L,L,L,L), (L,L,M,L), (L,L,H,L), (L,M,L,L), (L,M,M,M), (M,L,L,M), (M,L,M,M), (M,M,H,H), (L,M,H,M), (L,H,L,L), (L,H,M,M), (L,H,H,M), (M,L,L,M), (M,L,M,M), (M,L,H,M), (M,M,L,M), (M,M,M,M), (M,M,H,H), (M,H,L,M), (M,H,M,M), (M,H,H,H), (H,L,L,M), (H,L,M,M), (H,L,H,M), (H,M,L,M), (H,M,M,M), (H,M,H,H), (H,H,L,M), (H,H,M,H), (H,H,H,H).
The Mamdani fuzzy rule is adopted here. The FCM algorithm is used to optimize the membership function and extract the fuzzy rule. Update the membership function according to the distribution of clustering centers.
The membership functions of the fuzzy subset of SOC are:
The membership functions of three fuzzy subsets of SOH are:
The membership functions of three fuzzy subsets of C-rate are:
Input variable membership functions and three-dimensional graphs of fuzzy relations are shown in Figure 5:
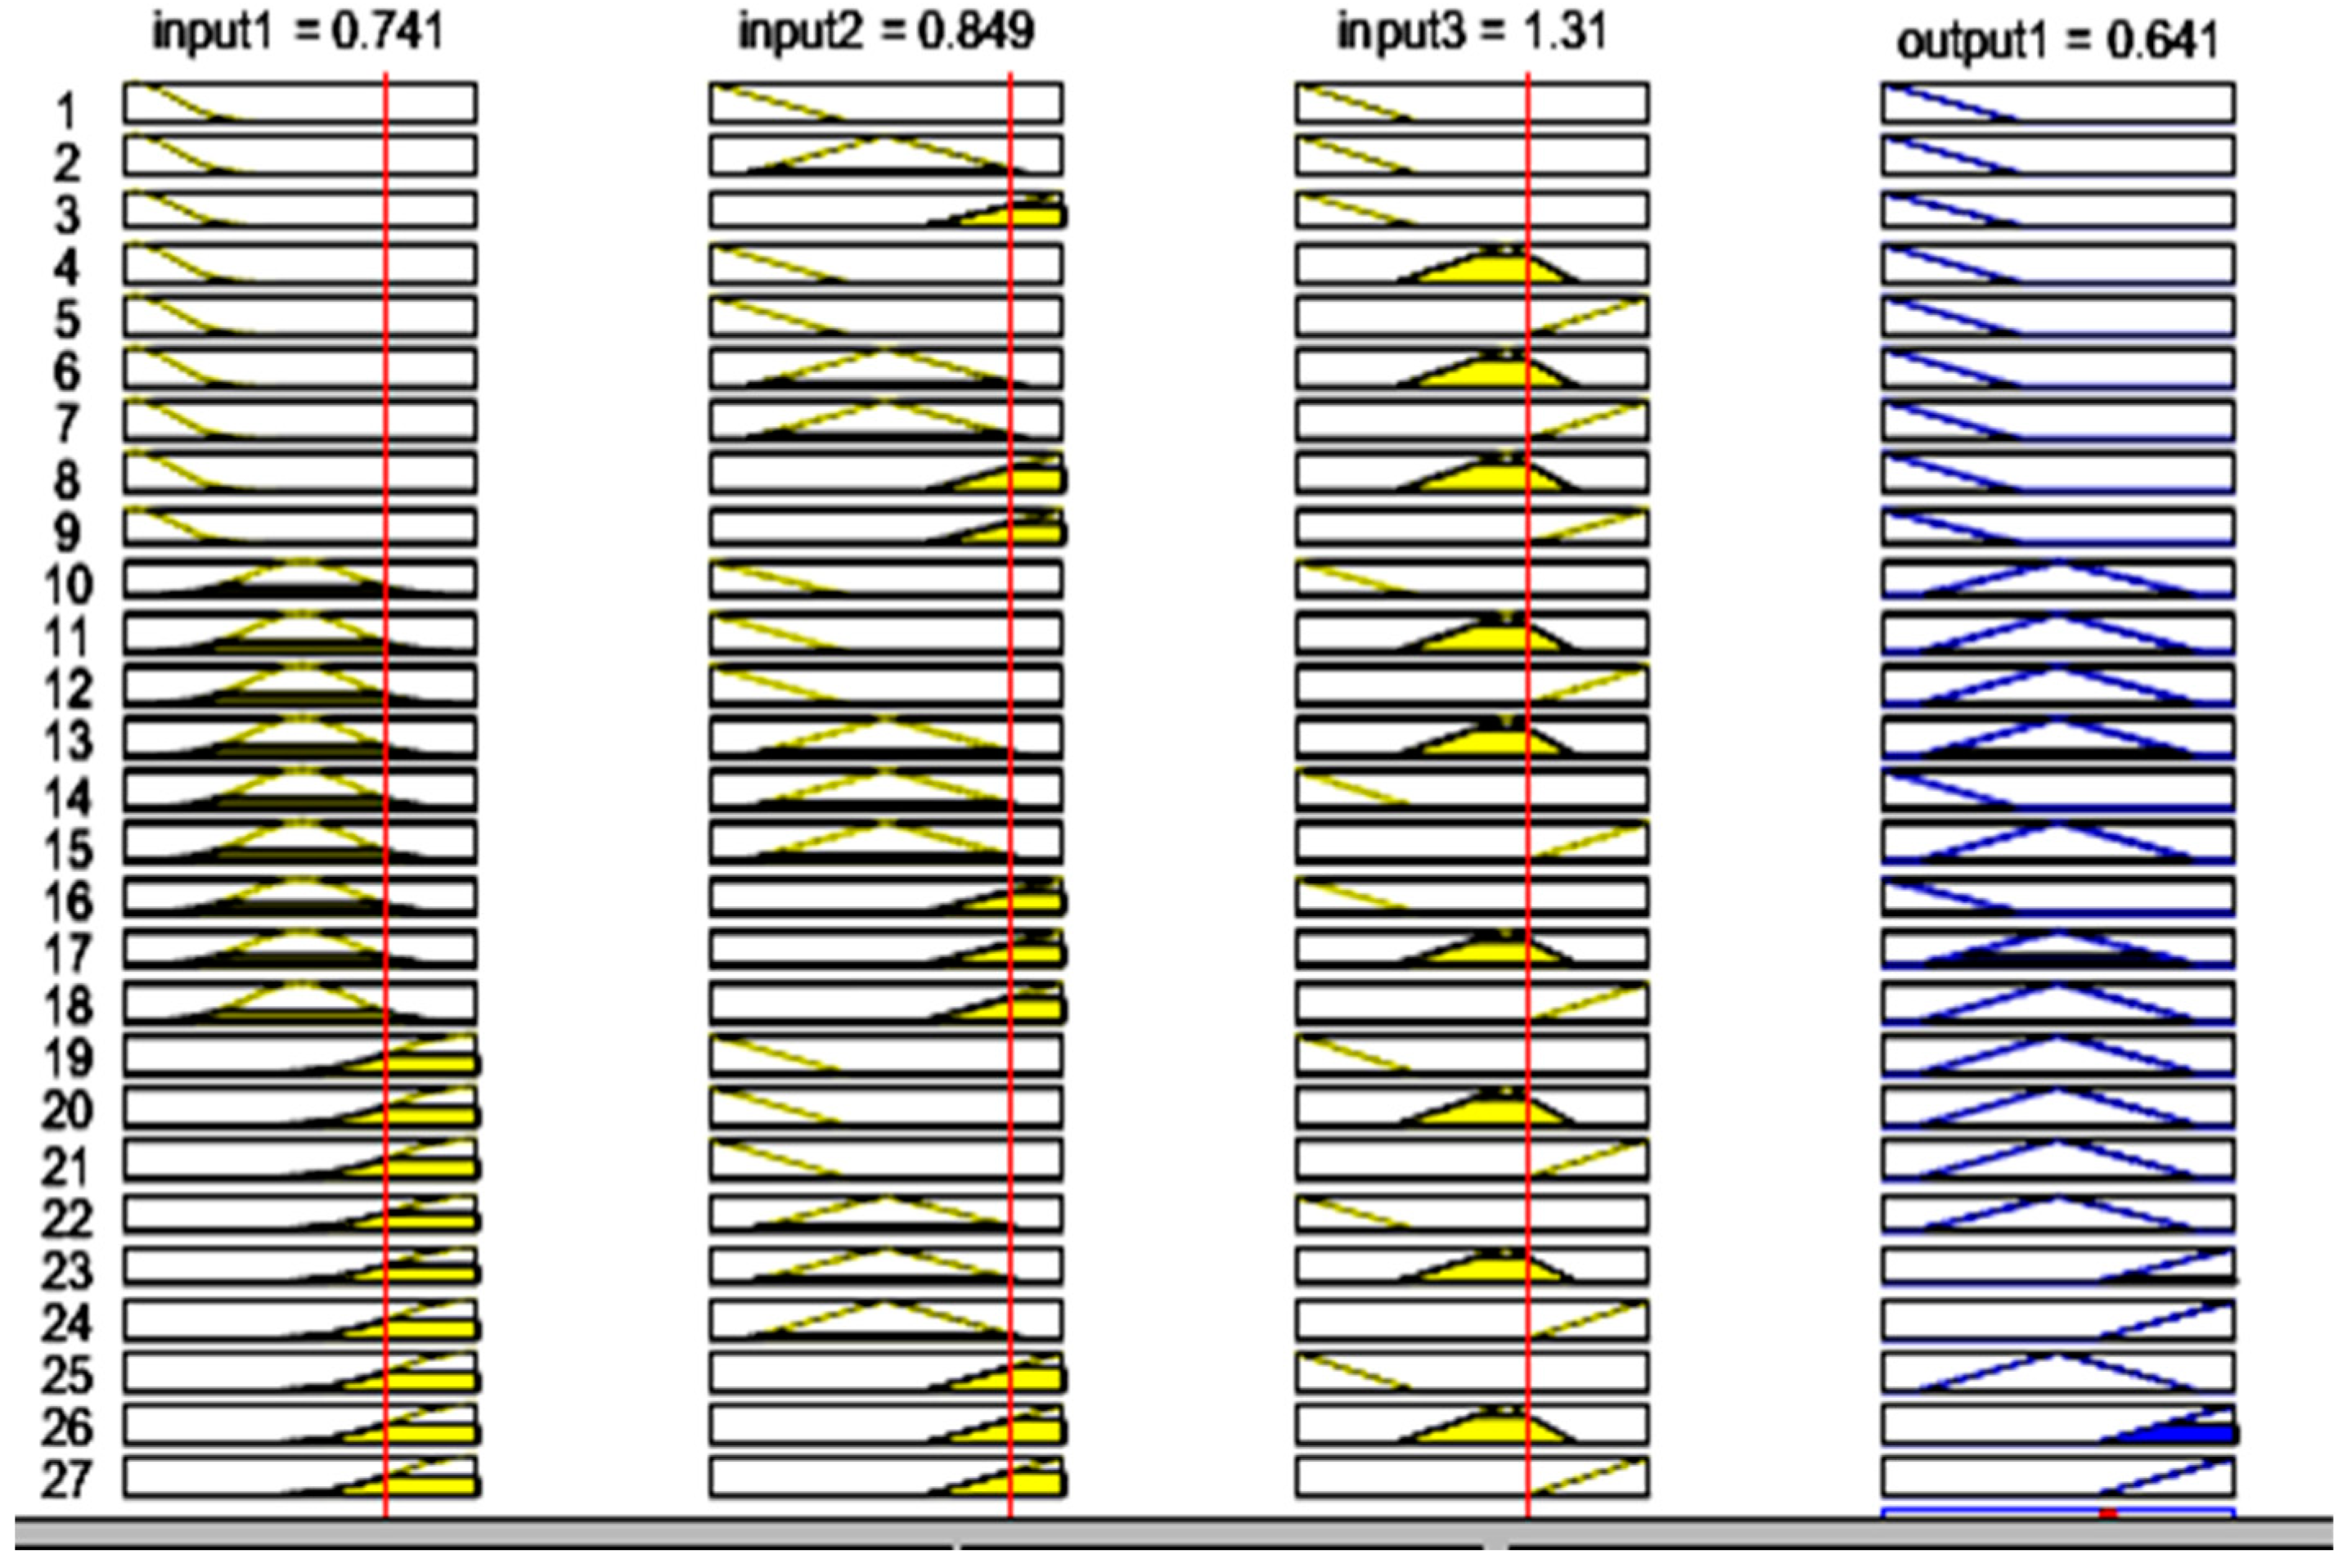
Adopt triangle MFs as output variable membership functions, whose membership functions of fuzzy subsets are triangle (0,0,0.37), triangle (0,26,0.58,0.71), and triangle (0.56,0.82,1). The output of the single point test is shown in Figure 6, where SOC is 0.741, SOH is 0.849, and C-rate is 1.31C. The estimated value of SOF is 0.641.
4. SOF Measurement
On the basis of the definition of SOF, we measure the SOF of the battery. The measuring scheme can be described as: increase the battery discharge current gradually until the battery voltage drops to the critical value of supply voltage in the abnormal state, which is shown in Figure 7.
The discharge is carried out with an adjustable load. The measurement steps mainly include:
- (1)
- Leave the battery for two hours to make sure that it stays in a stable state;
- (2)
- Adjust the instrument to ensure that correct readings of the current voltage and the current of the battery are obtained;
- (3)
- Set the discharge working mode as the cyclic test mode. The parameters of the starting current, termination current, termination voltage, step interval and time-step interval are set, respectively. Then, start the measurement.
- (4)
- Measure the maximum discharge current while the voltage drops to the termination voltage. At this time, the product of the voltage and current is taken as the current SOF of the battery.
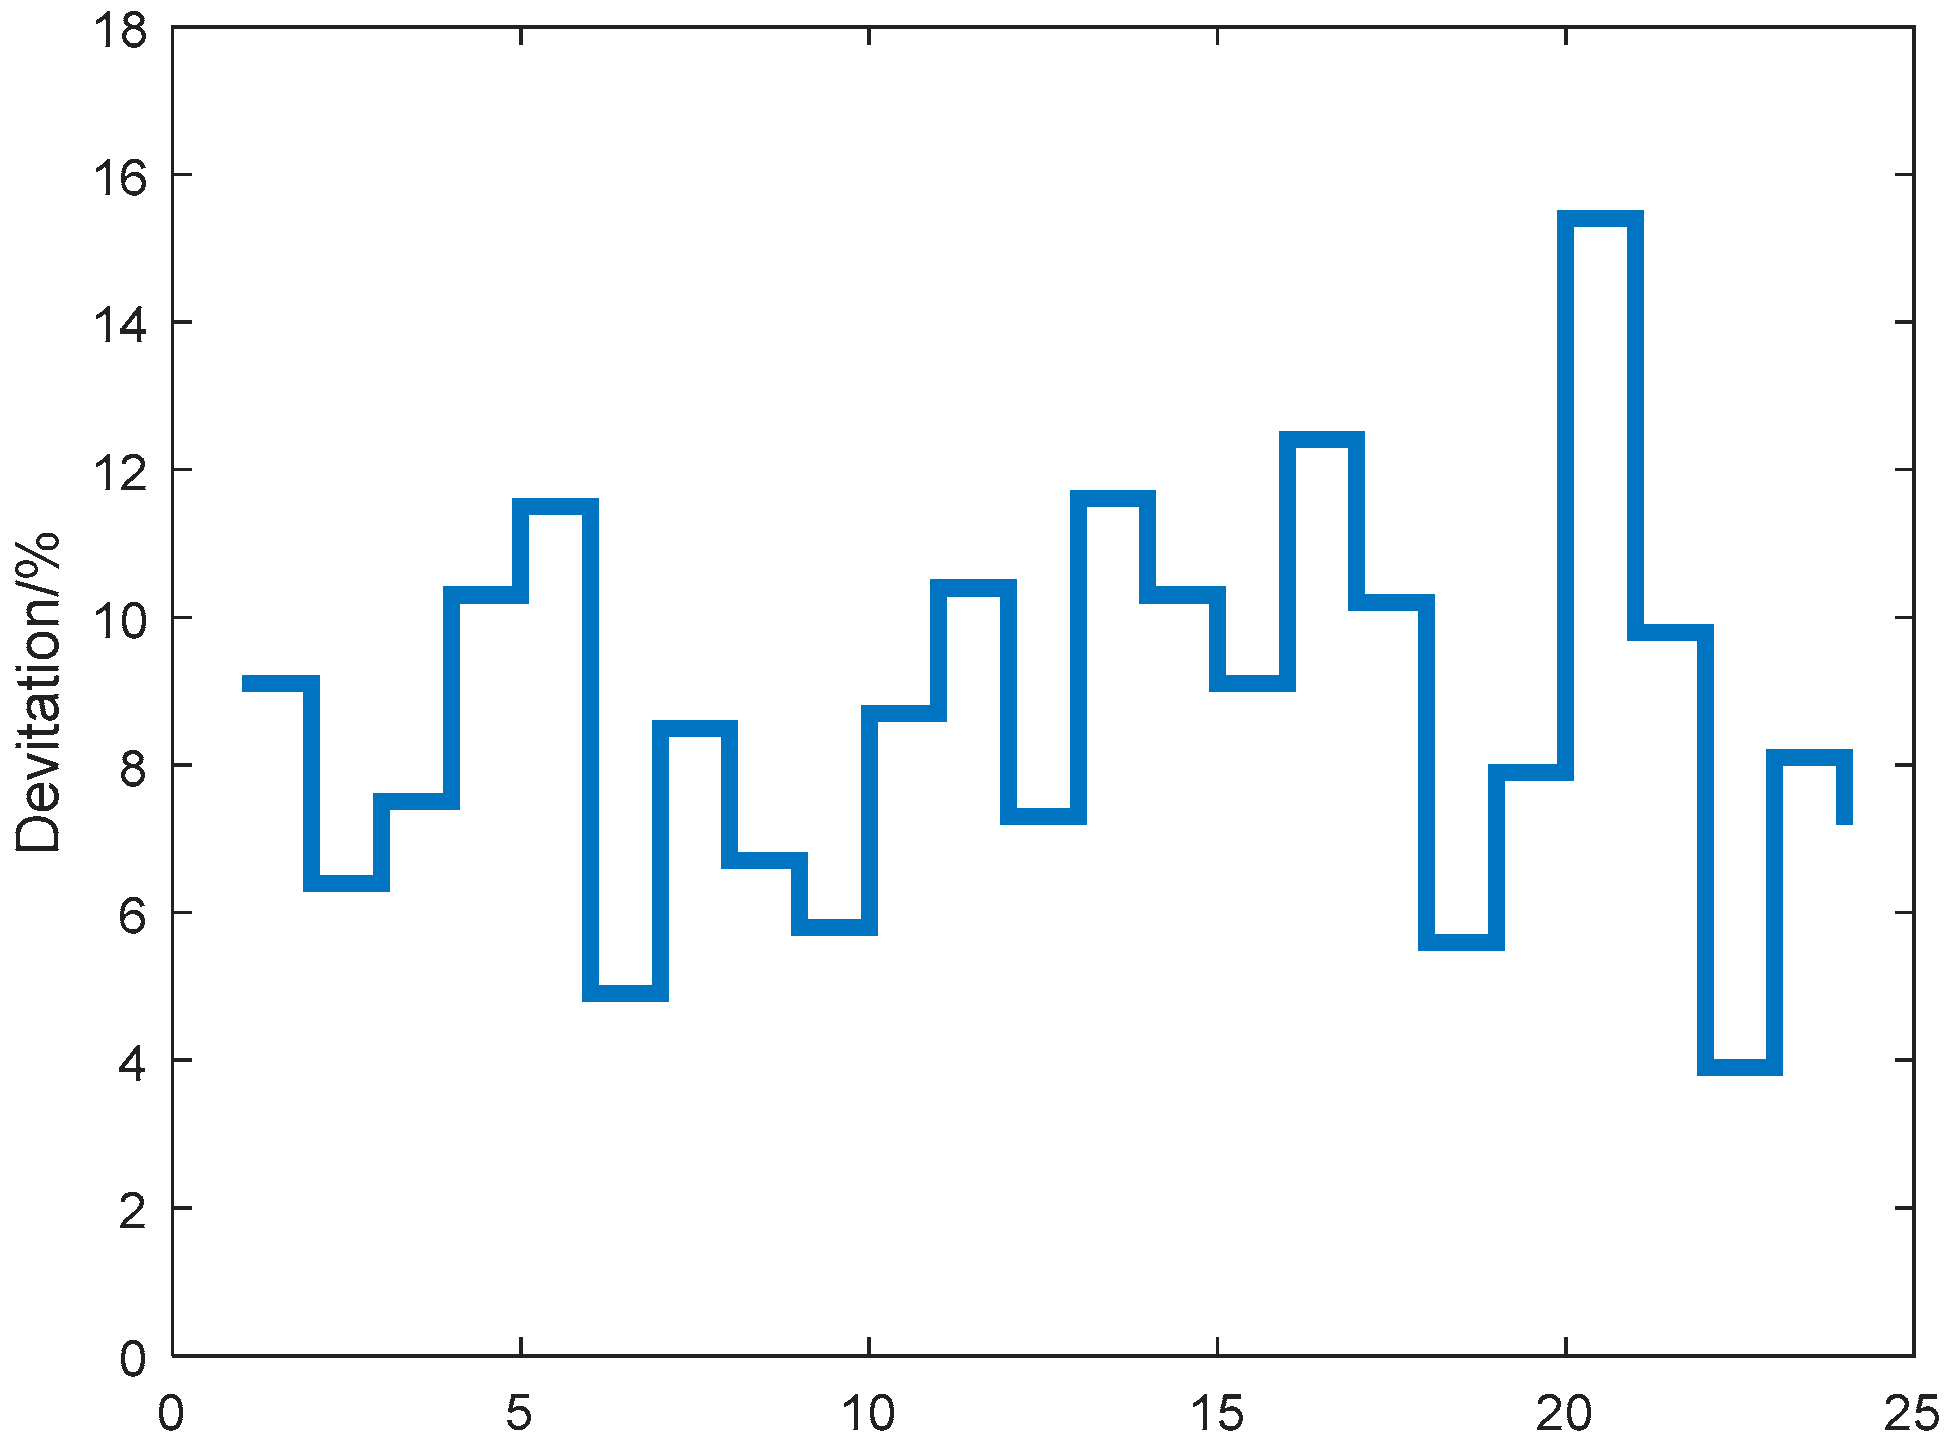
The SOF measurement processes of four batteries with different SOC, SOH and maximum C-rate are shown in Figure 7. The SOFs of the four batteries in the test are 0.75, 0.675, 0.70 and 0.72, respectively. Choose randomly 24 state points in Figure 7a for SOF estimation, where SOC is estimated according to the SOC-OCV curve provided by the factory and estimation results are shown in Table 1. The prediction error is shown in Figure 8.
The maximum error of the SOF fuzzy prediction optimized by FCM for power lithium ion battery is shown as merely 15.4%, and the average error is 8.69%. Even though the SOF varies widely, the estimation results with lower error can still be obtained by the proposed fuzzy prediction algorithm. In addition, it has much room for improvement in many aspects.
5. Conclusions
With the large-scale application of power lithium ion batteries, the study on the SOF (the state of function) of power lithium ion batteries has become increasingly significant. In this paper, we have given the definition and physical meaning of SOF. Three typical variables, SOC, SOH and C-rate, which are closely related to SOF, were obtained through experiments.
Combining this with the results from previous research and a large number of experimental results, the fuzzy logic inference system can be used as a strategy of battery SOF estimation. On this basis, the fuzzy C- mean clustering algorithm was introduced in detail and added to the framework of battery SOF prediction. We then carried out SOF estimation based on fuzzy prediction, which was optimized by the FCM algorithm using the three variables as inputs. The prediction algorithm was simulated and the results were compared with the experimental ones. The evaluation process was finally completed. The mean error of estimation is less than 9% and the prediction algorithm has the advantages of easy implementation, fast response and much room for improvement in the future.
Author Contributions
Conceptualization, D.W.; methodology, D.W. and L.G.; software, D.W.; validation, D.W., D.W. and L.G.; formal analysis, D.W.; investigation, Y.L.; resources, F.Y.; writing—original draft preparation, D.W.; writing—review and editing, F.Y.; project administration, F.Y.; funding acquisition, Y.L.
Funding
This research received no external funding.
Conflicts of Interest
The authors declare no conflict of interest.
References
- Farmann, A.; Sauer, D.U. A comprehensive review of on-board State-of-Available-Power prediction techniques for lithium-ion batteries in electric vehicles. J. Power Sources 2016, 329, 123–137. [Google Scholar] [CrossRef]
- Masoudi, R.; Uchida, T.; Mcphee, J. Parameter estimation of an electrochemistry-based lithium-ion battery model. J. Power Sources 2015, 291, 215–224. [Google Scholar] [CrossRef] [Green Version]
- Zhang, C.P.; Zhang, C.N.; Sharkh, S.M. Estimation of Real-Time Peak Power Capability of a Traction Battery Pack Used in an HEV. In Proceedings of the 2010 Asia-Pacific Power & Energy Engineering Conference, Chengdu, China, 28–31 March 2010; pp. 1–6. [Google Scholar]
- Juang, L.W.; Kollmeyer, P.J.; Jahns, T.M.; Lorenz, R.D. Implementation of online battery state-of-power and state-of-function estimation in electric vehicle applications. Energy Conver. Congr. Expos. 2012, 11, 1819–1826. [Google Scholar]
- Wang, L.; Cheng, Y.; Zou, J. Battery available power prediction of hybrid electric vehicle based on improved Dynamic Matrix Control algorithms. J. Power Sources 2014, 261, 337–347. [Google Scholar] [CrossRef]
- Xiong, R.; He, H.; Sun, F.; Liu, X.; Liu, Z. Model-based state of charge and peak power capability joint estimation of lithium-ion battery in plug-in hybrid electric vehicles. J. Power Sources 2013, 229, 159–169. [Google Scholar] [CrossRef]
- Klir, G.J.; Yuan, B. Fuzzy Sets and Fuzzy Logic—Theory and Applications; Prentice-Hall, Inc.: Upper Saddle River, NJ, USA, 1994; pp. 283–287. [Google Scholar]
- Malkhandi, S. Fuzzy logic-based learning system and estimation of state-of-charge of lead-acid battery. Eng. Appl. Artif. Intell. 2006, 19, 479–485. [Google Scholar] [CrossRef]
- Li, S.G.; Sharkh, S.M.; Walsh, F.C.; Zhang, C.N. Energy and Battery Management of a Plug-In Series Hybrid Electric Vehicle Using Fuzzy Logic. IEEE Trans. Veh. Technol. 2011, 60, 3571–3585. [Google Scholar] [CrossRef]
- Gan, L.; Yang, F.; Shi, Y.F.; He, H.L. Lithium-ion battery state of function estimation based on fuzzy logic algorithm with associated variables. In Proceedings of the IOP Conference Series: Earth and Environmental Science, Prague, Czech Republic, 11–15 September 2017. [Google Scholar]
- Bezdek, J.C.; Ehrlich, R.; Full, W. FCM: The fuzzy c-means clustering algorithm. Comput. Geosci. 1984, 10, 191–203. [Google Scholar] [CrossRef]
- Dagher, I. Fuzzy clustering with optimized-parameters multiple Gaussian Kernels. In Proceedings of the IEEE International Conference on Fuzzy Systems, Istanbul, Turkey, 2–5 August 2015; pp. 1–6. [Google Scholar]
- Waag, W.; Sauer, D.U. Secondary Batteries–Lead–Acid Systems State-of-Charge/Health; Elsevier B.V: Amsterdam, The Netherlands, 2009; Volume 796. [Google Scholar]
- García, S.; Luengo, J.; Herrera, F. Data Preprocessing in Data Mining; Springer: Berlin/Heidelberg, Germany, 2015. [Google Scholar]
- Van Bree Patrick, J.; Veltman, A.; Hendrix, W.H.A.; van den Bosch, P.P.J. Prediction of Battery Behavior Subject to High-Rate Partial State of Charge. IEEE Trans. Veh. Technol. 2009, 58, 1–2. [Google Scholar] [CrossRef]
- Scrosati, B.; Garche, J. Lithium batteries: Status, prospects and future. J. Power Sources 2010, 195, 2419–2430. [Google Scholar] [CrossRef]
- Goriparti, S.; Miele, E.; Angelis, F.D.; Fabrizio, E.D.; Zaccaria, R.P.; Capiglia, C. Review on recent progress of nanostructured anode materials for Li-ion batteries. J. Power Sources 2014, 257, 421–443. [Google Scholar] [CrossRef] [Green Version]
- Zou, Y.; Hu, X.; Ma, H.; Li, S.E. Combined state of charge and state of health estimation over lithium-ion battery cell cycle lifespan for electric vehicles. J. Power Sources 2015, 273, 793–803. [Google Scholar] [CrossRef]
- Wang, S.; Verbrugge, M.; Wang, J.S.; Liu, P. Power prediction from a battery state estimator that incorporates diffusion resistance. J. Power Sources 2012, 214, 399–406. [Google Scholar] [CrossRef]
- Hu, Y.; Yurkovich, S.; Guezennec, Y.; Yurkovich, B.J. A technique for dynamic battery model identification in automotive applications using linear parameter varying structures. Control Eng. Pract. 2009, 15, 1190–1201. [Google Scholar] [CrossRef]
- Malysz, P.; Ye, J.; Gu, R.; Yang, H.; Emadi, A. Battery state-of-power peak current calculation and verification using an asymmetric parameter equivalent circuit model. IEEE Trans. Veh. Technol. 2015, 65, 4512–4522. [Google Scholar] [CrossRef]
- Hu, X.; Xiong, R.; Egardt, B. Model-based dynamic power assessment of lithium-ion batteries considering different operating conditions. Ind. Inf. IEEE Trans. 2014, 10, 1948–1959. [Google Scholar] [CrossRef]
- Ceraolo, M. New dynamical models of lead-acid batteries. Power Syst. IEEE Trans. 2000, 15, 1184–1190. [Google Scholar] [CrossRef]
- Zhang, H.; Chow, M.-Y. Comprehensive dynamic battery modeling for PHEV applications. In Proceedings of the Power and Energy Society General Meeting, Providence, RI, USA, 25–29 July 2010; pp. 1–6. [Google Scholar]
- Buller, S. Impedance-based Simulation Models for Energy Storage Devices in Advanced Automotive Power Systems. Ph.D. Thesis, Institute for Power Electronics and Electrical Drives, RWTH Aachen University, Aachen, Germany, 2003. [Google Scholar]
- Hu, X.; Li, S.; Peng, H. A comparative study of equivalent circuit models for liion batteries. J. Power Sources 2012, 198, 359–367. [Google Scholar] [CrossRef]
- Li, X.; Sun, J.; Hu, Z.; Lu, R.; Zhu, C.; Wu, G. A New Method of State of Peak Power Capability Prediction for Li-Ion Battery. In Proceedings of the 2015 IEEE Vehicle Power and Propulsion Conference (VPPC), Montreal, QC, Canada, 19–22 October 2015. [Google Scholar]
- Fleischer, C.; Waag, W.; Sauer, D.U. Adaptive on-line State-of-Available-Power prediction of lithium-ion batteries. J. Power Electron. 2013, 13, 516–527. [Google Scholar] [CrossRef]
- Xiong, R.; He, H.; Sun, F.; Zhao, K. Online estimation of peak power capability of Li-ion batteries in electric vehicles by a hardware-in-loop approach. Energies 2012, 5, 1455–1469. [Google Scholar] [CrossRef]
- Root, M. The Tab Battery Book e an In-depth Guide to Construction, Design, and Use; The McGraw-Hill Companies: New York, NY, USA, 2011; ISBN 978-0-07-173991-7. [Google Scholar]
- Mueller, S.C.; Sandner, P.G.; Welpe, I.M. Monitoring innovation in electrochemical energy storage technologies: A patent-based approach. Appl. Energy 2015, 137, 537–544. [Google Scholar] [CrossRef] [Green Version]
- Zadeh, L.A. Fuzzy sets. Inf. Control 1965, 8, 338–353. [Google Scholar] [CrossRef] [Green Version]
- Zadeh, L.A. Fuzzy logic. Computer 1988, 21, 83–93. [Google Scholar] [CrossRef]
- Lee, C.C. Fuzzy logic in control systems: Fuzzy logic controller—Parts I and II. IEEE Trans. Syst. Man Cybern. 1990, 20, 404–435. [Google Scholar] [CrossRef]
- Chang, L.C.; Chu, H.J.; Chen, Y.W. A fuzzy inference system for the conjunctive use of surface and subsurface water. Adv. Fuzzy Syst. 2013, 2013. [Google Scholar] [CrossRef]
- Firat, M.; Turan, M.E.; Yurdusev, M.A. Comparative analysis of fuzzy inference systems for water consumption time series prediction. J. Hydrol. 2009, 374, 235–241. [Google Scholar] [CrossRef]
- Lohani, A.K.; Goel, N.K.; Bhatia, K.K.S. Improving real time flood forecasting using fuzzy inference system. J. Hydrol. 2014, 509, 25–41. [Google Scholar] [CrossRef]
- Pinzon-Morales, R.-D.; Baquero-Duarte, K.-A.; Orozco-Gutierrez, A.-A.; Grisales-Palacio, V.-H. Pattern Recognition of Surface EMG Biological Signals by Means of Hilbert Spectrum and Fuzzy Clustering; Arabnia, H.R., Tran, Q.-N., Eds.; Springer: New York, NY, USA, 2011; pp. 201–209. [Google Scholar]
- Bezdek, J.C. Pattern Recognition with Fuzzy Objective Function Algorithms; Plenum Press: New York, NY, USA, 1981. [Google Scholar]
- Ahmed, M.N.; Yamany, S.M.; Mohamed, N.; Farag, A.A.; Moriarty, T. A modified fuzzy C-means algorithm for bias field estimation and segmentation of MRI data. IEEE Trans. Med. Imaging 2002, 21, 193–199. [Google Scholar] [CrossRef]
- Maulik, U.; Bandyopadhyay, S. Fuzzy partitioning using a real coded variable length genetic algorithm for pixel classification. IEEE Trans. Geosci. Remote Sens. 2003, 41, 1075–1081. [Google Scholar] [CrossRef]
- Celikyilmaz, A.; Trksen, I.B. Modeling Uncertainty with Fuzzy Logic: With Recent Theory and Applications, 1st ed.; Springer: Berlin, Germany, 2009. [Google Scholar]
- Dovžan, D.; Škrjanc, I. Recursive fuzzy c-means clustering for recursive fuzzy identification of time-varying processes. ISA Trans. 2011, 50, 159–169. [Google Scholar] [CrossRef]
- Mendes, J.; Araújo, R.; Souza, F. Adaptive fuzzy identification and predictive control for industrial processes. Expert Syst. Appl. 2013, 40, 6964–6975. [Google Scholar] [CrossRef]
Figure 1.
Experimental platform.

Figure 2.
Voltage curve under 1A constant current discharge using batteries with different state of health (SOH). From (a)–(d), the SOH of the battery decreases in turn. (a) is the voltage vs. 1A-constant current curve of the battery with the best SOH, while (d) is of the lowest one.
Figure 2.
Voltage curve under 1A constant current discharge using batteries with different state of health (SOH). From (a)–(d), the SOH of the battery decreases in turn. (a) is the voltage vs. 1A-constant current curve of the battery with the best SOH, while (d) is of the lowest one.
Figure 3.
Voltage curve of the battery under different discharge currents. The discharge currents are 0.5A (a), 1A (b), 2A (c) and 3A (d), respectively.
Figure 3.
Voltage curve of the battery under different discharge currents. The discharge currents are 0.5A (a), 1A (b), 2A (c) and 3A (d), respectively.

Figure 4.
Classification process of the sample set.
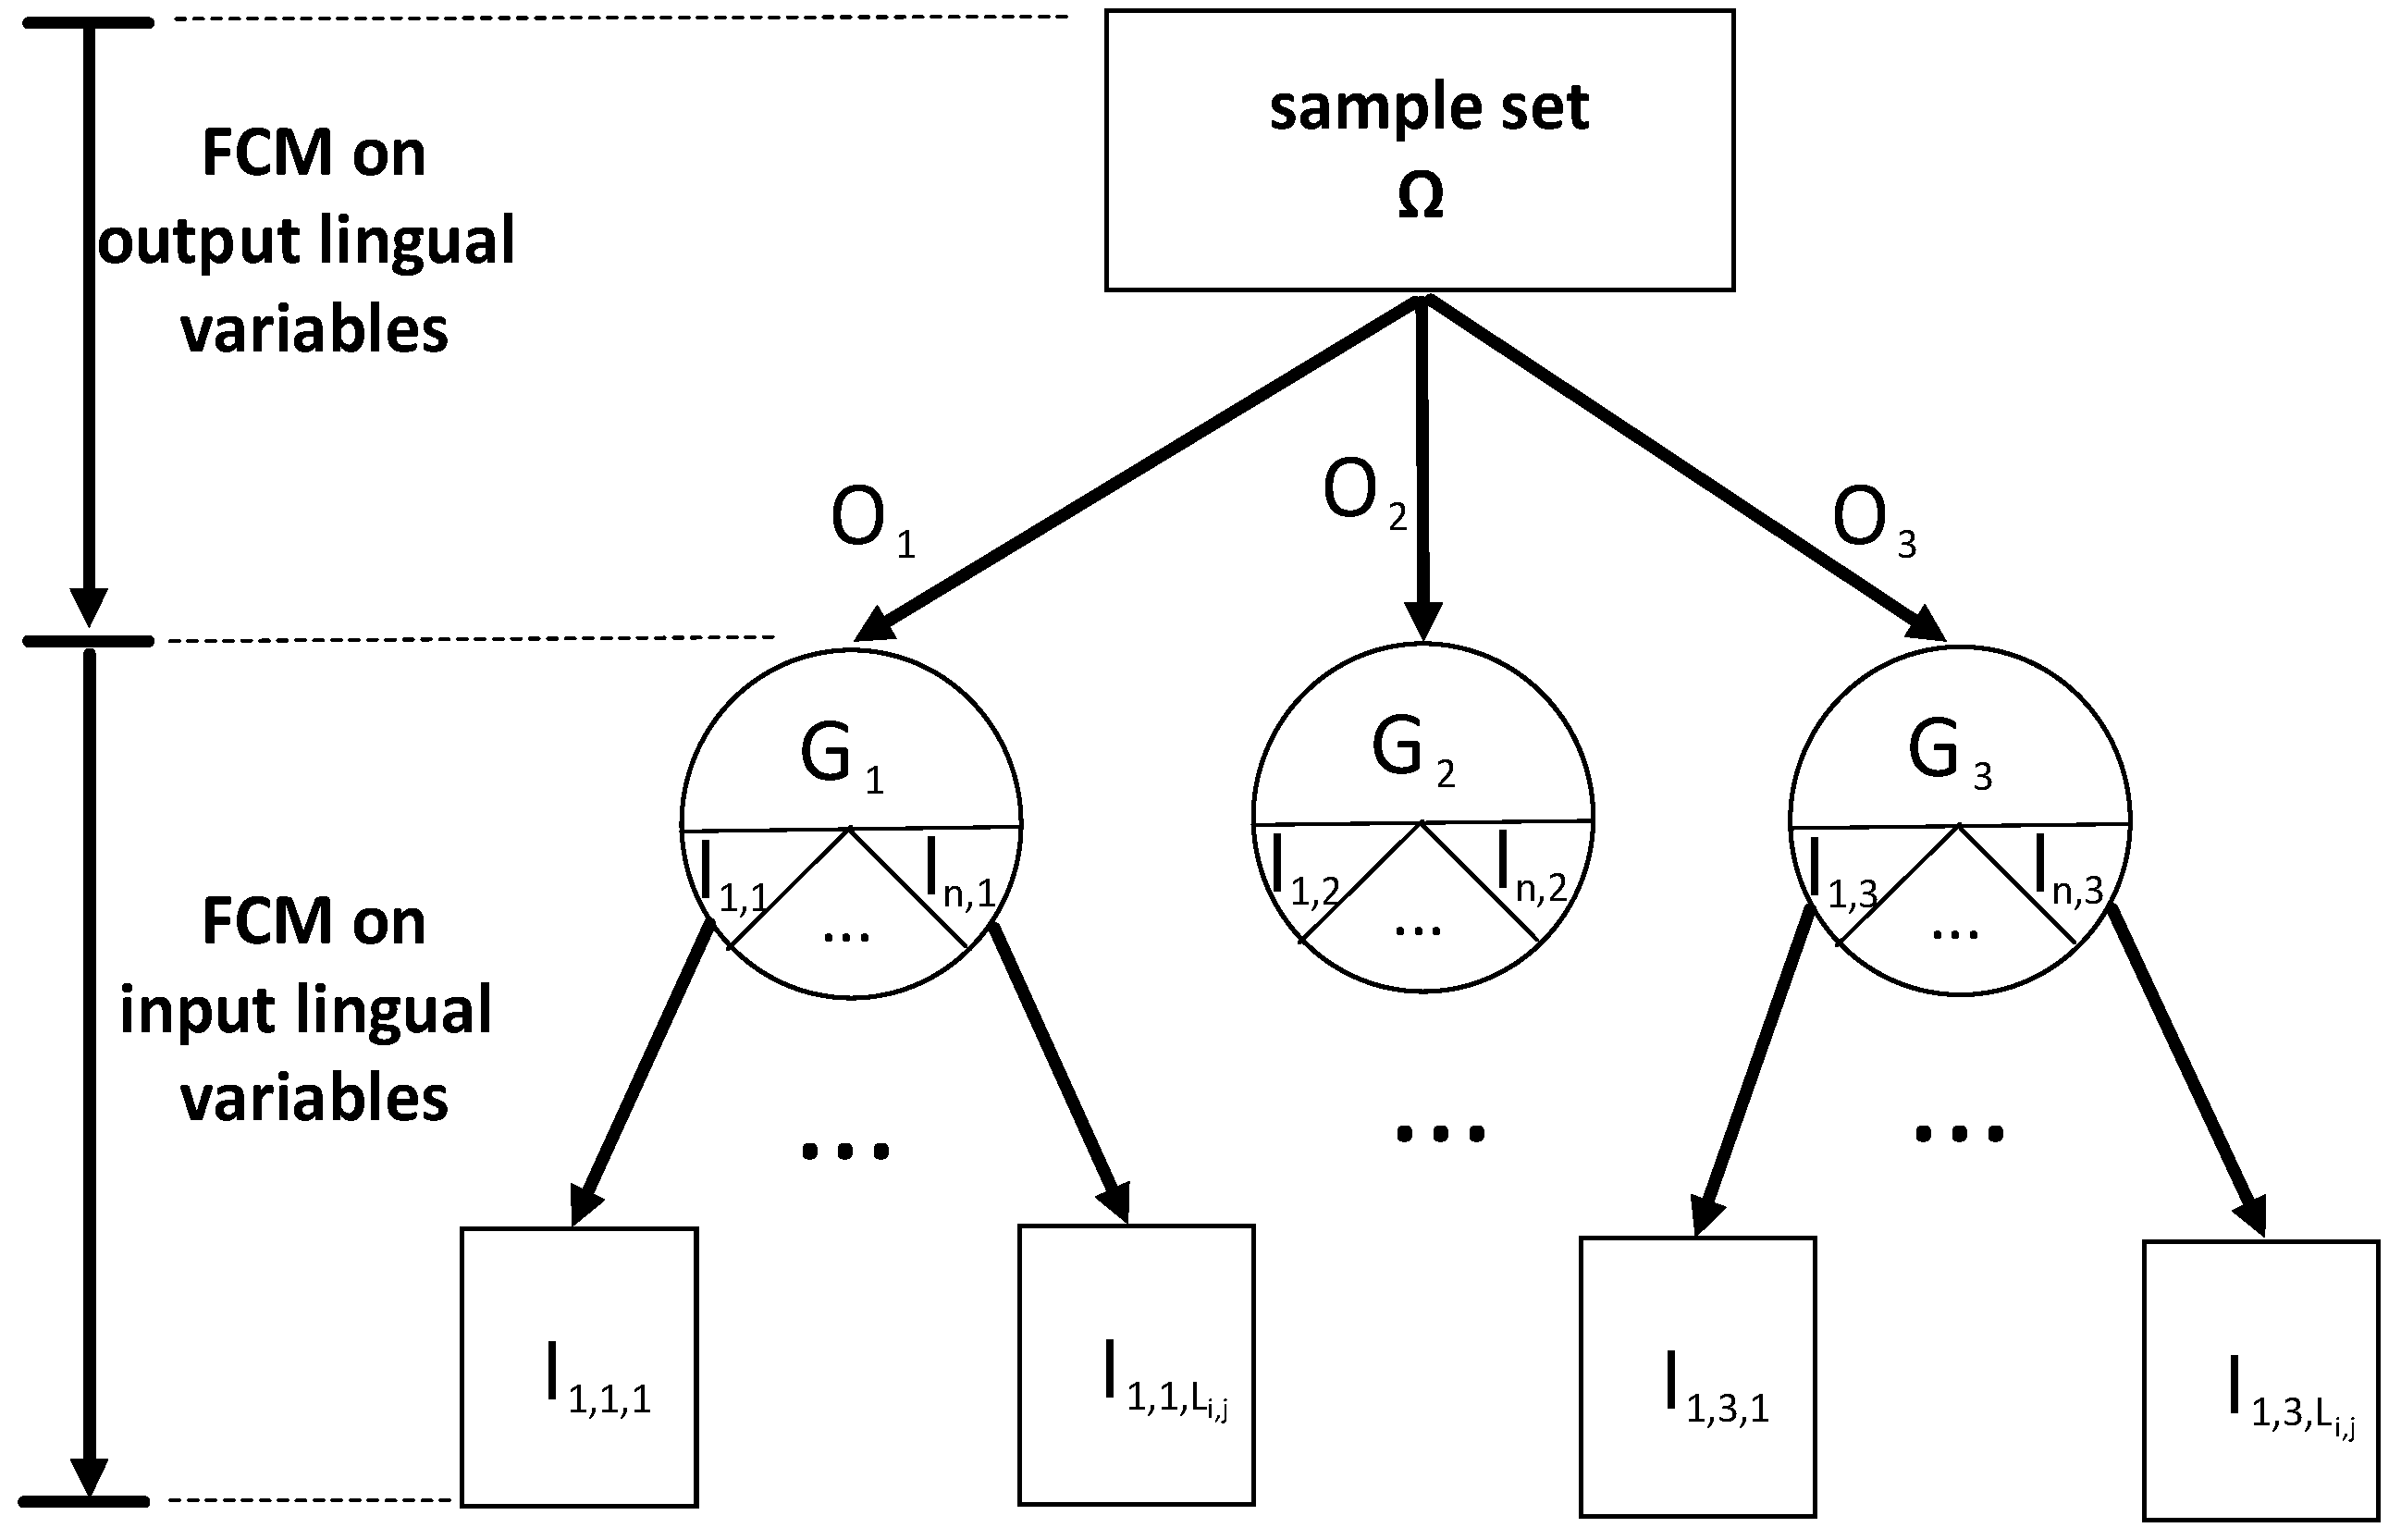
Figure 5.
Input variable membership functions and three-dimensional graphs of fuzzy relations. (a)–(c) are input variable membership functions of state of charge (SOC), SOH and charge–discharge rate (C-rate), respectively. (d)–(f) are three-dimensional graphs of fuzzy relations of every two input variables of three corresponding to SOF.
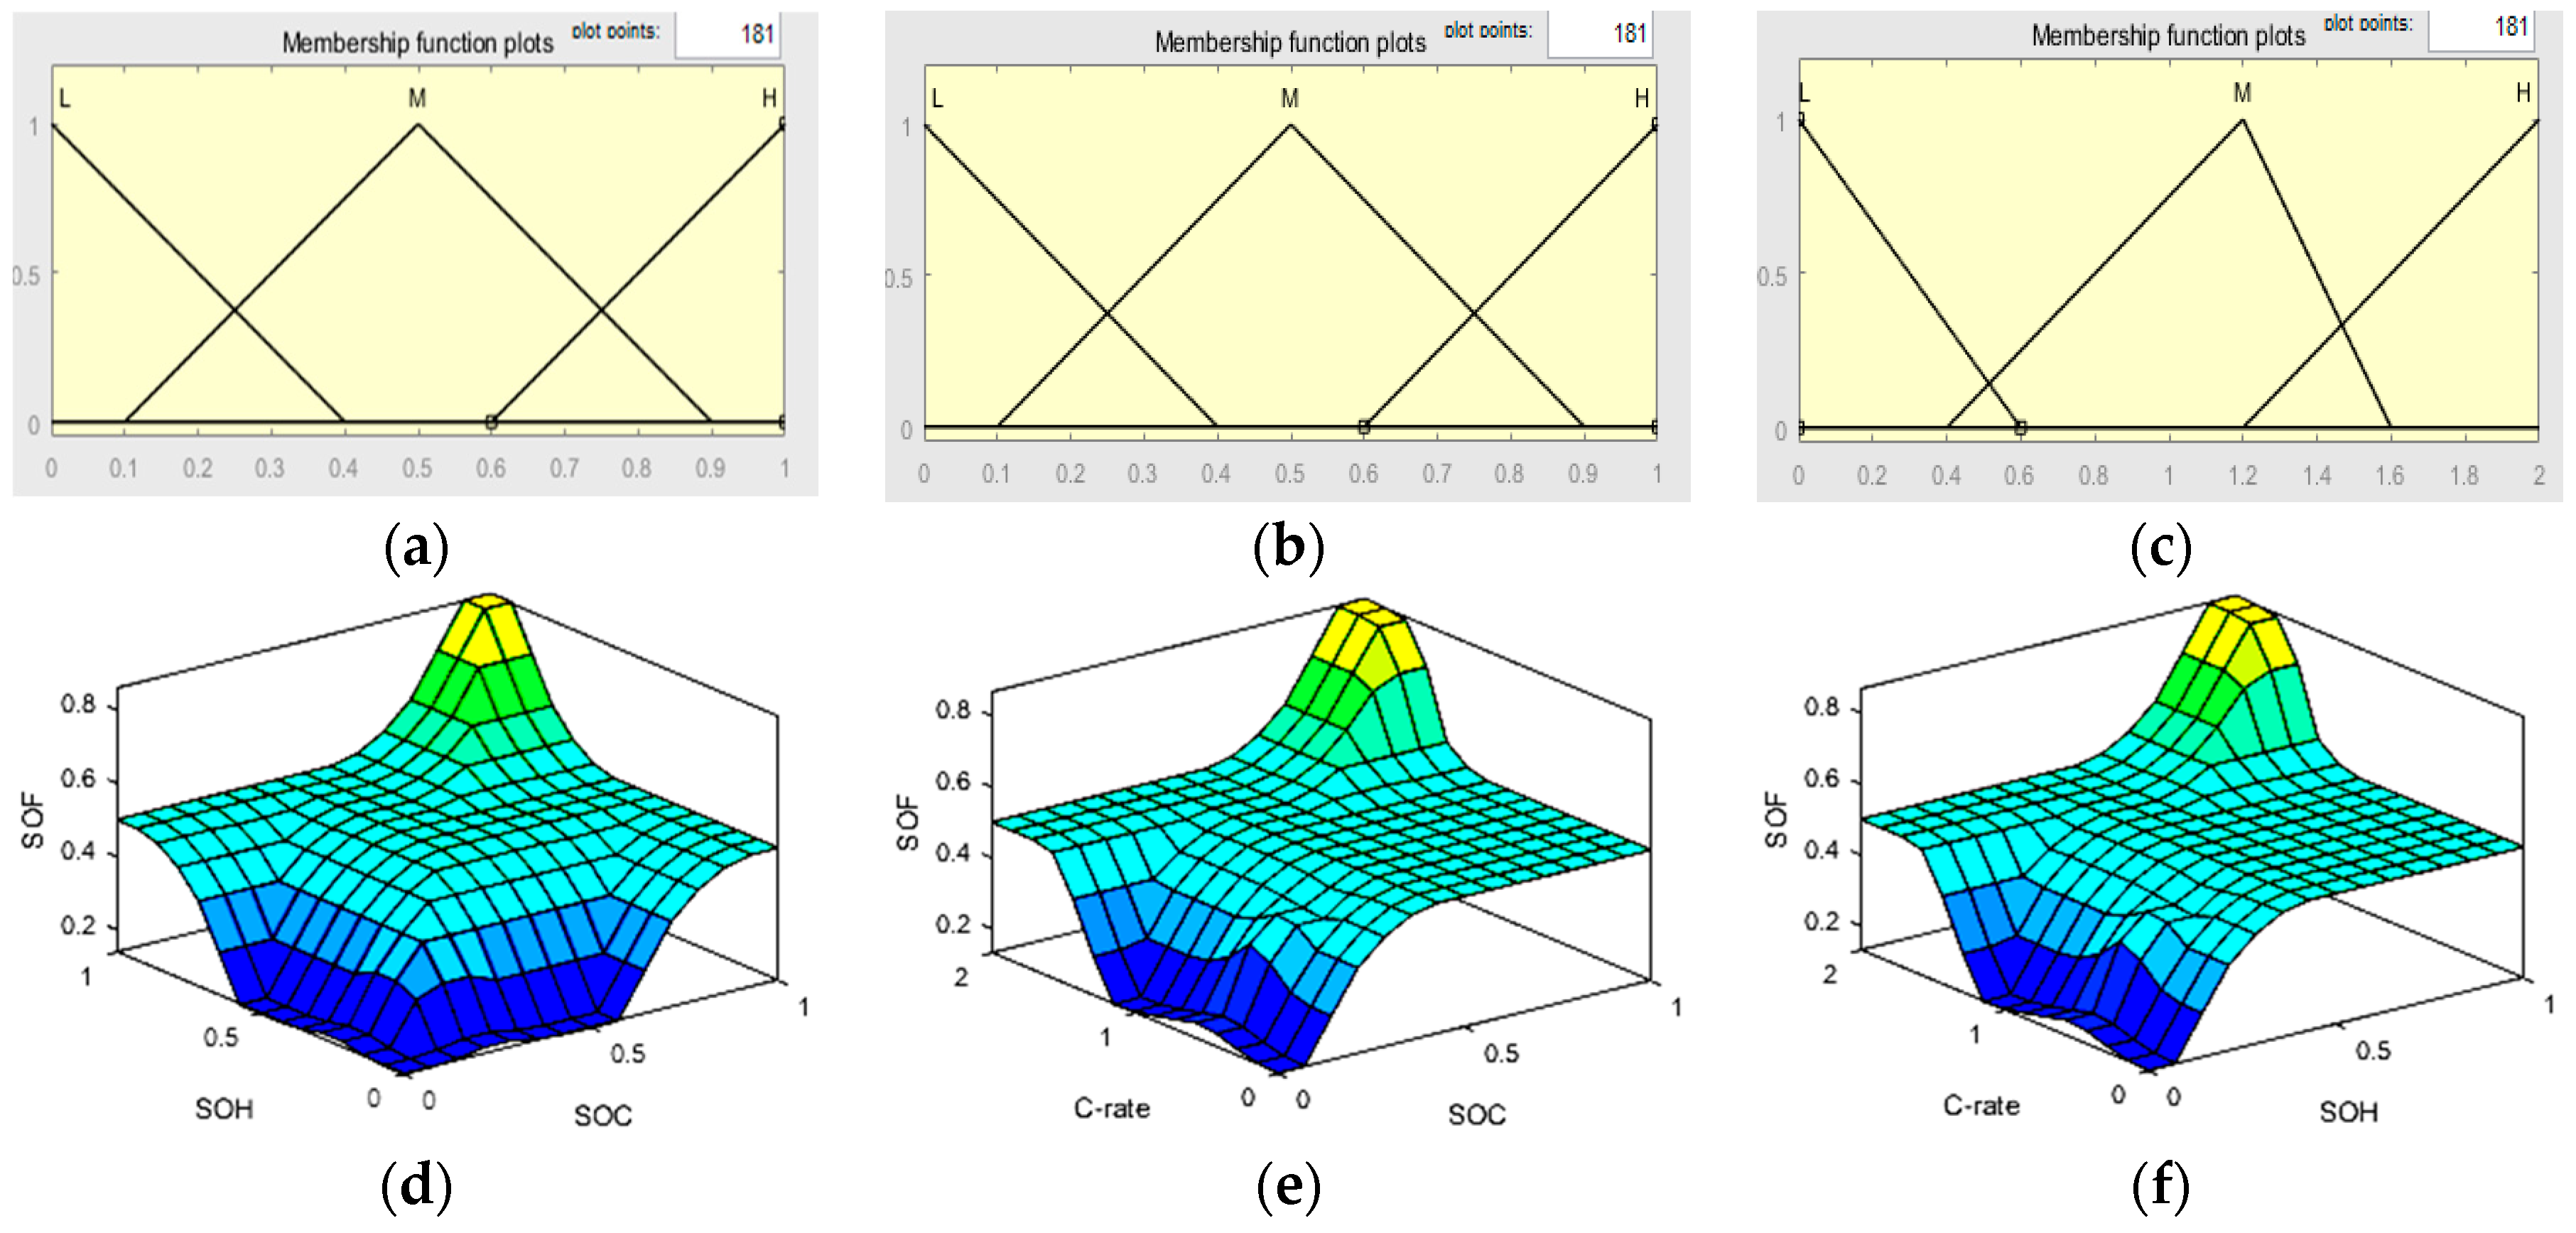
Figure 6.
Display of single point simulation after optimization of the FCM algorithm.
Figure 7.
SOF measurement under the step-increasing discharge current. (a)–(d) represent voltage vs step-increasing current curves of four different batteries.
Figure 7.
SOF measurement under the step-increasing discharge current. (a)–(d) represent voltage vs step-increasing current curves of four different batteries.
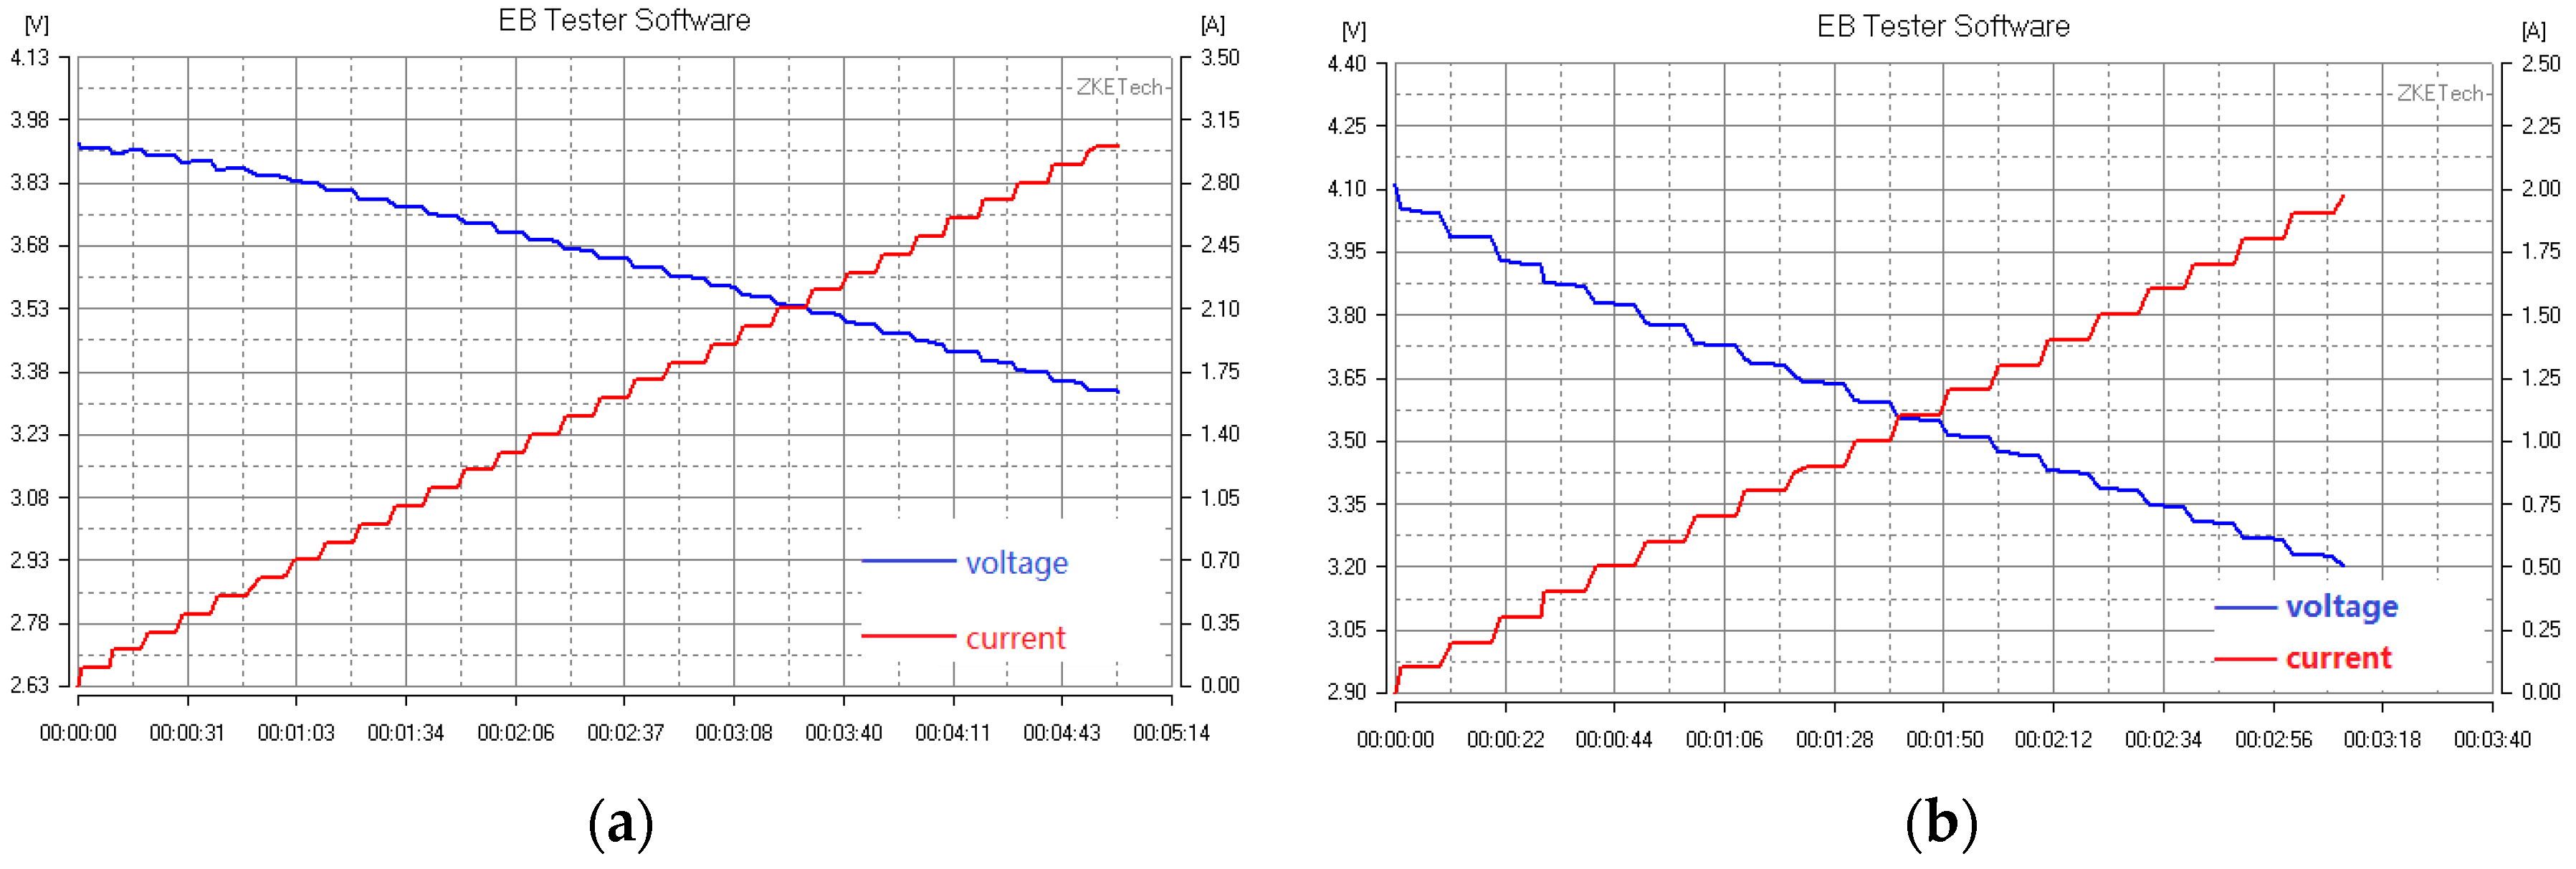
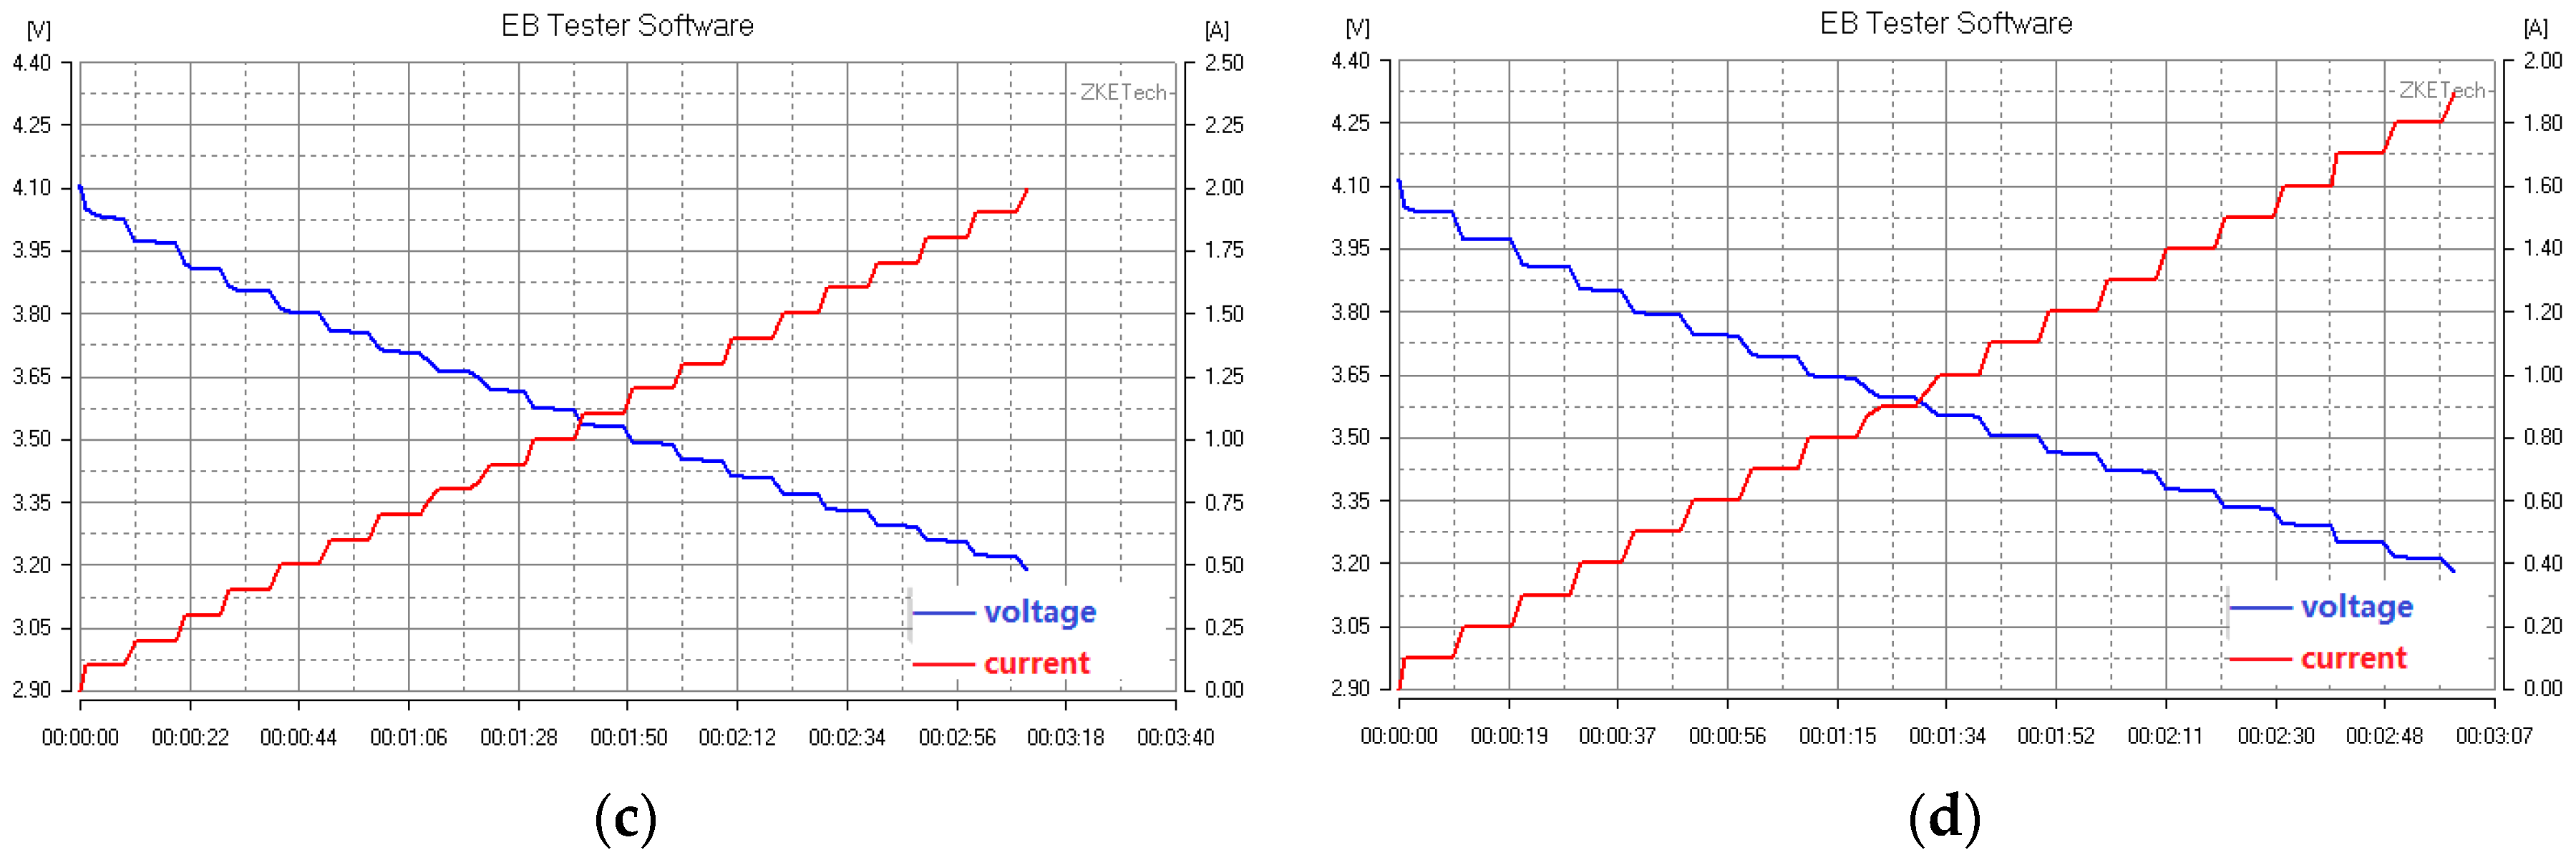
Figure 8.
Estimation error.


Table 1.
Estimation results of the first battery.
| Index | Voltage | Current | SOH | SOF-ESTIMATED | Index | Voltage | Current | SOH | SOF-ESTIMATED |
|---|---|---|---|---|---|---|---|---|---|
| 1 | 3.90 | 0.1 | 0.849 | 0.817 | 12 | 3.67 | 1.2 | 0.849 | 0.799 |
| 2 | 3.85 | 0.2 | 0.849 | 0.795 | 13 | 3.67 | 1.3 | 0.849 | 0.84 |
| 3 | 3.84 | 0.3 | 0.849 | 0.802 | 14 | 3.66 | 1.4 | 0.849 | 0.825 |
| 4 | 3.80 | 0.4 | 0.849 | 0.832 | 15 | 3.65 | 1.5 | 0.849 | 0.788 |
| 5 | 3.78 | 0.5 | 0.849 | 0.840 | 16 | 3.64 | 1.6 | 0.849 | 0.803 |
| 6 | 3.77 | 0.6 | 0.849 | 0.787 | 17 | 3.62 | 1.7 | 0.849 | 0.866 |
| 7 | 3.74 | 0.7 | 0.849 | 0.817 | 18 | 3.61 | 1.8 | 0.849 | 0.825 |
| 8 | 3.74 | 0.8 | 0.849 | 0.794 | 19 | 3.60 | 1.9 | 0.849 | 0.773 |
| 9 | 3.72 | 0.9 | 0.849 | 0.793 | 20 | 3.60 | 2.0 | 0.849 | 0.810 |
| 10 | 3.69 | 1.0 | 0.849 | 0.811 | 21 | 3.59 | 2.1 | 0.849 | 0.803 |
| 11 | 3.68 | 1.1 | 0.849 | 0.829 | 22 | 3.62 | 2.2 | 0.849 | 0.800 |
© 2019 by the authors. Licensee MDPI, Basel, Switzerland. This article is an open access article distributed under the terms and conditions of the Creative Commons Attribution (CC BY) license (http://creativecommons.org/licenses/by/4.0/).
Share and Cite
MDPI and ACS Style
Wang, D.; Yang, F.; Gan, L.; Li, Y. Fuzzy Prediction of Power Lithium Ion Battery State of Function Based on the Fuzzy c-Means Clustering Algorithm. World Electr. Veh. J. 2019, 10, 1. https://doi.org/10.3390/wevj10010001
AMA Style
Wang D, Yang F, Gan L, Li Y. Fuzzy Prediction of Power Lithium Ion Battery State of Function Based on the Fuzzy c-Means Clustering Algorithm. World Electric Vehicle Journal. 2019; 10(1):1. https://doi.org/10.3390/wevj10010001
Chicago/Turabian StyleWang, Dasong, Feng Yang, Lin Gan, and Yuliang Li. 2019. "Fuzzy Prediction of Power Lithium Ion Battery State of Function Based on the Fuzzy c-Means Clustering Algorithm" World Electric Vehicle Journal 10, no. 1: 1. https://doi.org/10.3390/wevj10010001