1. Introduction
The availability of application programming interfaces (APIs) for accessing social network data is a gold-mine for developers, since they provide a standard, easy and trustworthy way for requesting user’s information, useful for a personalized application experience. Social Network APIs, such as the Facebook Graph API [
1], apply strict rules in order to protect their users’ privacy. They must explicitly grant the access on specific information to the different applications. For instance, a simple application can show the contents created by friends while being in a restaurant, taking its location as input. Provided that the application has the permission to access the data, it costs only a few lines of code for developers to retrieve contents created by the user’s friends in that specific place, combining comments, photos and videos.
In contrast, even if users are the owners of the data, they have less control of it. The social network application mediates their access: they cannot combine sources, filter results or perform specific actions if not explicitly provided by the interface. Considering the increasing growth of social networks’ size, users are already overwhelmed by the contents created every day [
2]. This opened the market for third party applications that provide visualizations for specific user interests (e.g., travelling, restaurants, music
etc.). However, it is also difficult for third party developers to support unusual searches and other specific tasks that have a smaller potential audience. Nevertheless, for these small groups, such functionalities are useful.
In this paper, we propose to fill this gap applying End User Development (EUD) techniques for enabling end-users to inspect and control their social network data, creating applications able to both retrieve and manipulate their contents. We describe the design iterations and the implementation of FaceMashup, an environment allowing users to mix contents their contents and those created by their friends, and to perform actions on them. As an example of a social network, we focus on Facebook.
FaceMashup represents the Graph API data (e.g., user profiles, photos, comments, videos, etc.) with the same elements used in the social network application interface (e.g., the Facebook web client in our case), including them in dedicated widgets. Starting from these building blocks, the user can drag interface elements between different widgets for retrieving, combining and filtering data coming from the Facebook graph. In addition, (s)he can perform actions on the selected entries through a set of action widgets. In the last part of the paper, we report on a preliminary user study on the FaceMashup prototype, which shows a good completion rate, even for difficult tasks (e.g., the combination and filtering of more than two data sources), a good overall acceptance of the tool and the proposed EUD techniques, together with the need for more effective help during the widget connection.
2. Related Work
FaceMashup [
3] shares different ideas and interaction techniques with existing EUD tools. We consider three different aspects relating our work with other ones in literature: the representation of data, the application flow definition and the social support.
We represent the social network data using a graphical representation similar to the Facebook web application. In this way, the user is able to recognize the information by its appearance, associating intuitively the data semantics. Such techniques have been applied successfully in [
4,
5], where the authors proposed a tool for creating mashups from existing web applications. In order to collect and manipulate the data, the user selects different web interface fragments, which can be connected into a dedicated environment. For each fragment, the tool maintains the same appearance and style of the original website, in order to ease the recognition and the interpretation of the data meaning. Hartman
et al. [
6] follow a similar approach, requiring some programming knowledge for creating the data composition code.
For defining the application logic, FaceMashup requests the users to directly manipulate the data representation (e.g., using a field as input for a search, or filtering some photos by date,
etc.). The environment translates the actions into more general steps. The user performs such manipulation on real data, providing a concrete example to the system that generalises his/her actions. Such paradigms are derived from the programming by example [
7] technique, which has been employed in different EUD tools. For instance, CoScripter [
8] allows users to automatize searches and data extraction on web pages recording the user’s actions. The tool automatically creates scripts, whose description in natural language contains the procedure steps. Users can review, modify, load and save them through a dedicated panel in the web browser. Lin
et al. [
9] created a different interface for the same scripting engine, based on spreadsheets, which allows users to combine data coming from different websites.
End users efectively share scripts in order to reuse or modify them for different purposes [
10]. Therefore, providing social support in an EUD tool is important for both its usability and effectiveness. In particular, the field study in [
10] demonstrated that most EUD scripts belong to three categories: those run a few times by many users, those run many times by a few users, and those run only a few times at all. Therefore, we included the possibility to share applications in the social network, in order to better support the first category. We decided that the changes to an existing application are persisted into a copy, rather than providing collaborative editing support. Indeed, according to the findings in [
10], people often do not realize that their changes would replace the original procedure for all users. Instead, end user collaboration has been proven effective for considering the changes as suggestions for improvement. For instance, Nebeling
et al. [
11] created a crowdsourced environment for the design and engineering of web interfaces. End users can actively propose changes to an application with a direct manipulation of the exiting interface. The designer receives such suggestions and may accept them in a new version.
3. Example Scenario
We start the description of our EUD tool from a small example scenario, in order to show how it can be exploited by end users in order to create simple utility procedures on their social network data.
Alice and Bob are a young couple, and they have a passion for traveling. They usually share their experiences on places around the world through Facebook. They are visiting Madrid and, while walking, they upload photos and small videos of the most important points of interest in the city. Once back at the hotel, Bob reviews the multimedia material collected during the day. He would like to tag Carol and Mark, who have been in Madrid last summer. He tries to remember if there are other friends who have been in Madrid for tagging them too, but he cannot recall any. He thinks that it would be nice if Facebook would support such kind of searches.
If Bob had development skills, it would be easy for him to write a small program for tagging his friends who have been in Madrid exploiting the Graph API [
1]. At a high abstraction level, the routine would follow four steps: (1) find where a photo was shot (e.g., Madrid); (2) retrieve the friend list; (3) select those who published some content from the same place and (4) tag the selected friends. In order to create a reusable application, a good developer would not hard-code in the procedure neither the profile for retrieving the friend list nor the place to search.
The challenge we tackle with FaceMashup is to support Bob in defining his own Social Network Application (SNA) for solving specific problems, similar to the one described in the scenario. Other use cases are related to automating routine operations, such as posting birthday wishes, liking contents with specific hashtags, aggregating photos or videos created on a specific day and at a specific place, defining multi-criteria repeatable searches (e.g., location, time, specific friend groups) and to execute bulk operations on them. Besides single users interested in saving their own routines, we foresee that EUD approaches on social networks are useful for people working in the communication field, which would take advantage from tailoring routine procedures for their own needs. All the listed examples are supported by the current version of FaceMashup.
In the following sections, we describe the design iterations and the problems we encountered. Considering the feedback about the first prototype, we derived a set of design principles which we applied in the final interface.
4. Preliminary Design
In the first iteration, we provided the users with a data flow representation of the SNA: actions and data types were represented through interaction boxes, which we call widgets, that the user positions inside the working area. Pipe connections represented the information passing between widgets for filtering and/or performing actions.
We grouped widgets in three categories. Data widgets correspond to the entity types that can be retrieved from the Facebook graph, such as a user’s profile information, friend lists, photo collections, the wall posts and so on. We represented them in the environment with a blue color. The second group contains manipulation actions, such as filtering by user’s selection or matching elements with a desired property value (e.g., the content was created is Madrid). The data manipulation color was green. The third group contained widgets that create new data in the Facebook graph (e.g., adding likes, tags, etc.). They were colored in yellow.
The connection mechanism, shown in
Figure 1, was similar to Yahoo Pipes. Each widget has one or more input and and output sockets, represented, respectively, as green and red circles. The user specified the data flow among the widgets creating pipes between the boxes: (s)he first clicked on the output port of a widget, and then (s)he clicked on the input socket of the other one. Between the two clicks, the environment provided feedback showing the pipe starting at the output socket and ending in the current pointer position.
Considering the scenario described in
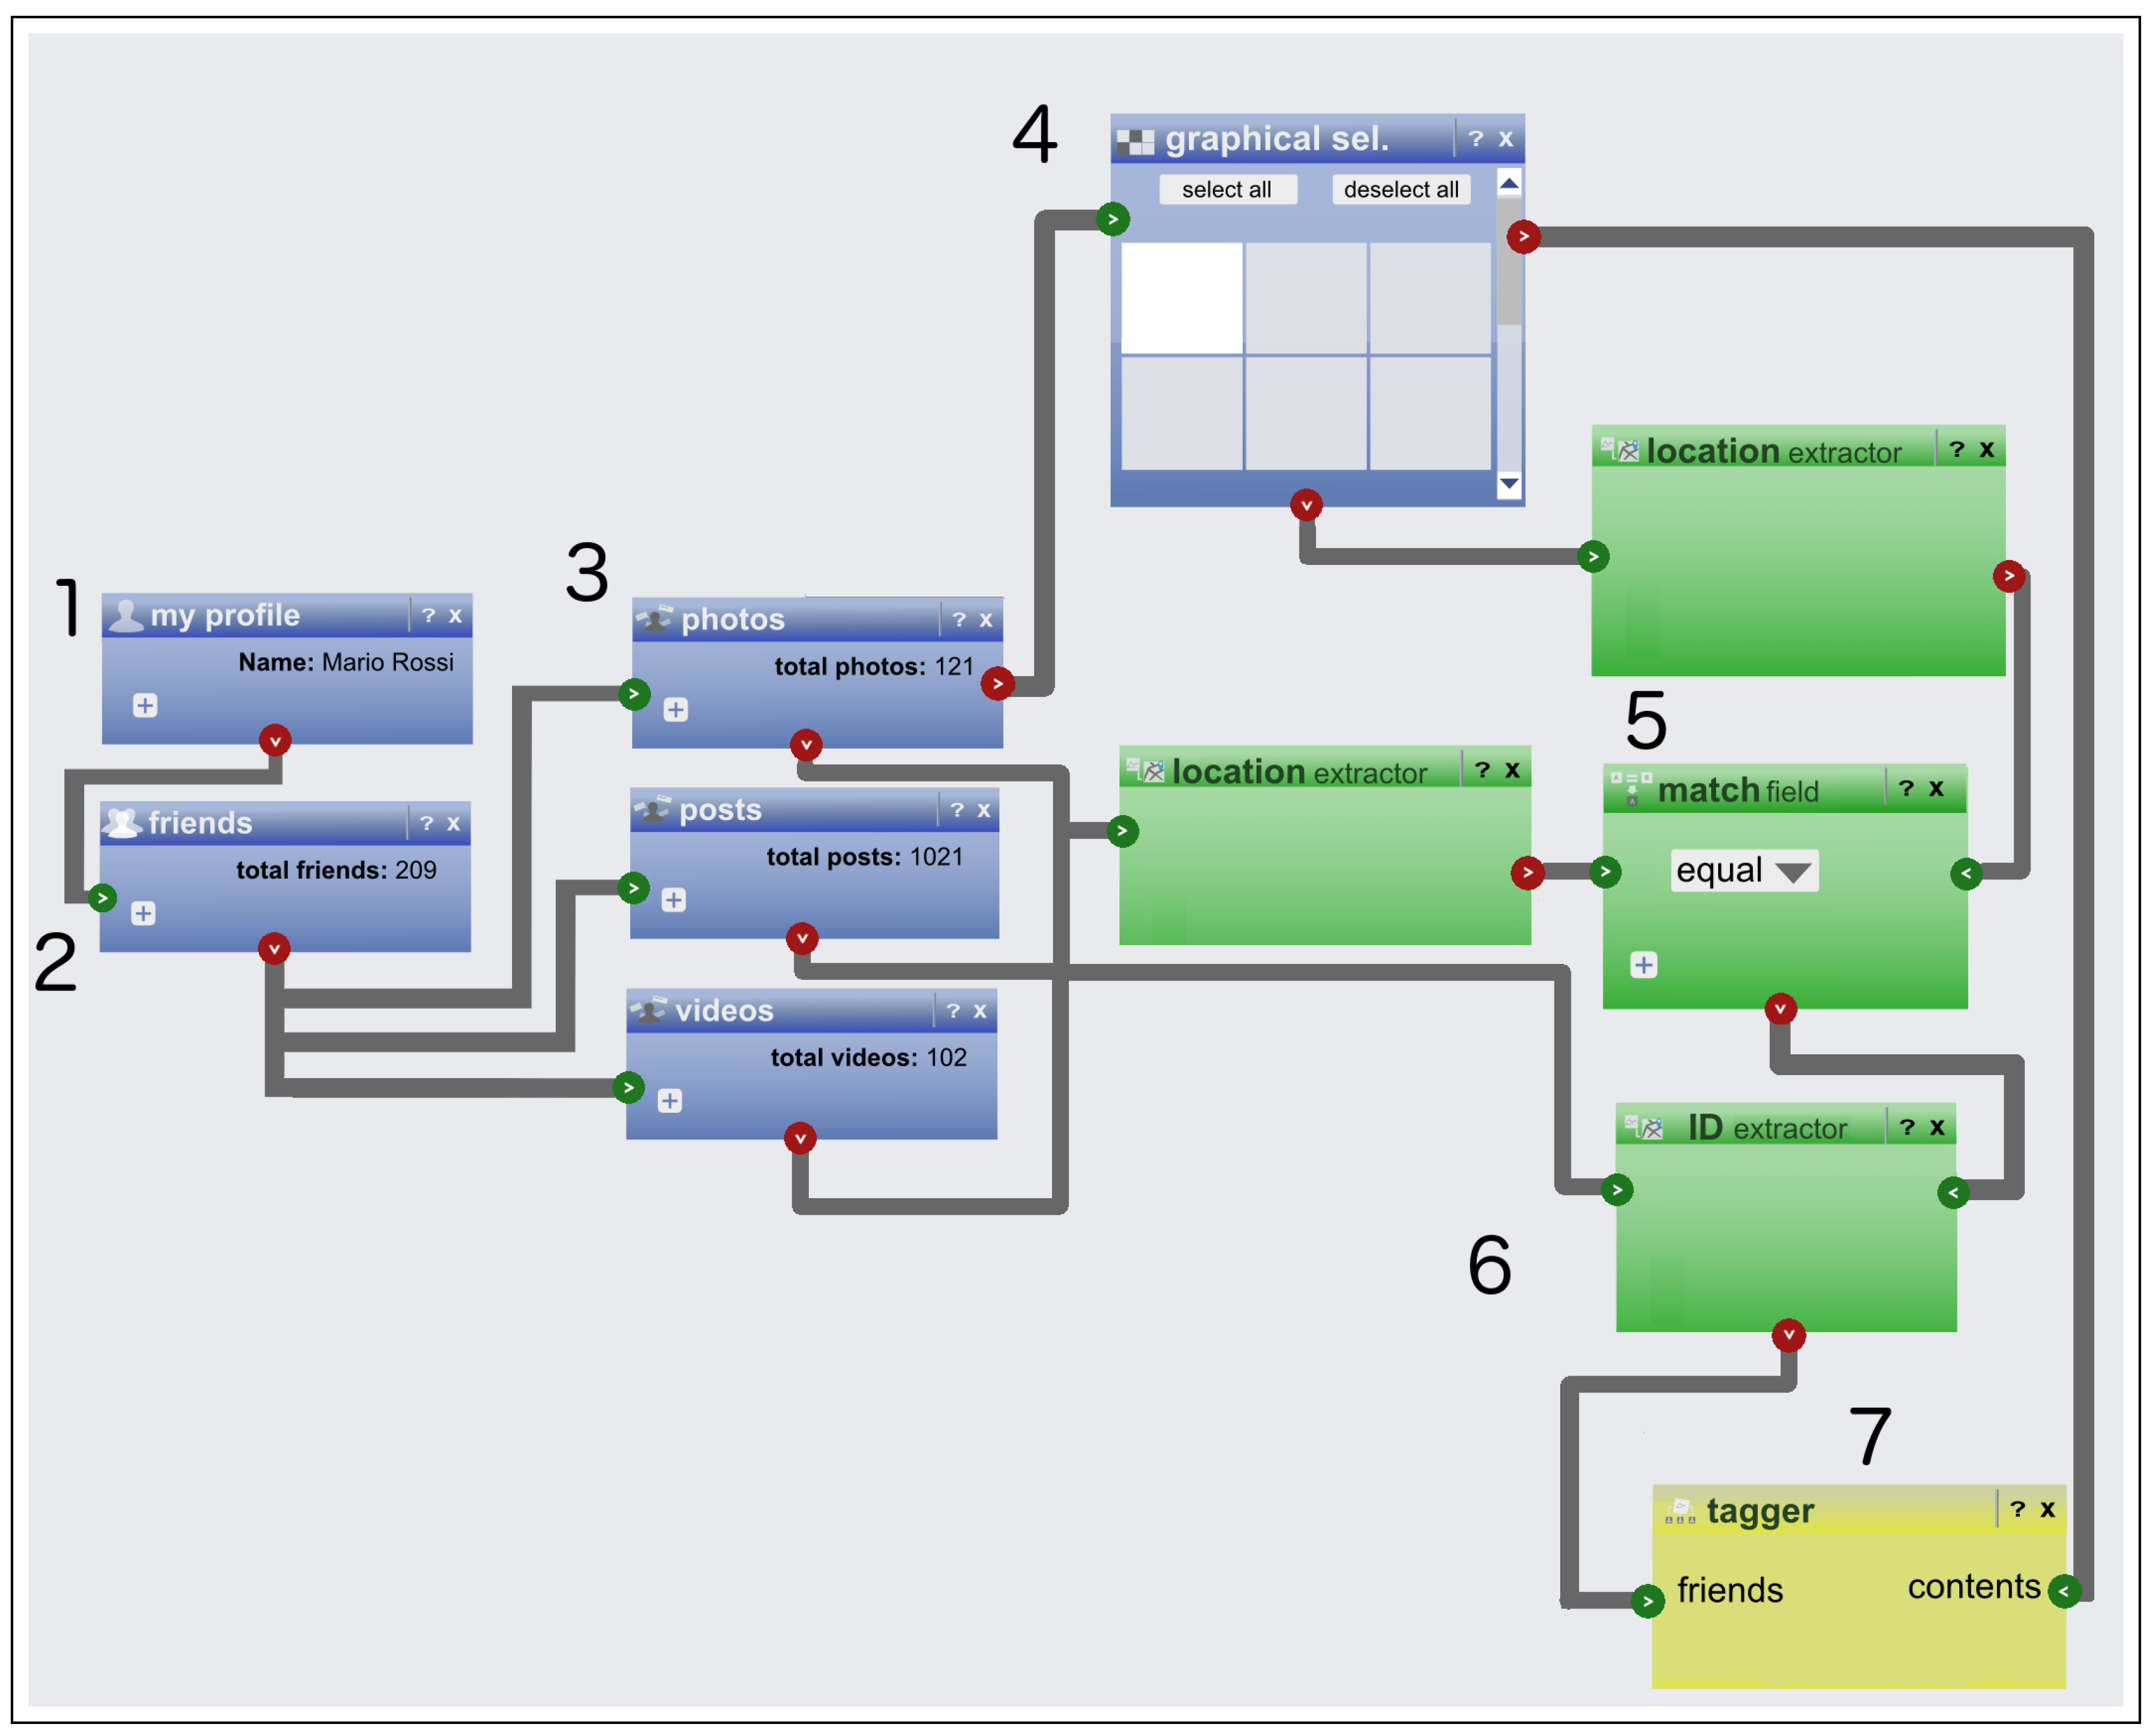
Section 3, Bob should produce a SNA similar to the one in
Figure 1. He should first include a widget for retrieving the profile information through a log-in (step 1), which is used for retrieving the friend list (step 2). After that, he should include different widgets for searching the contents created by his friends (step 3): photos, posts, videos
etc. Then, such results are used in two logical branches. In the first one, Bob specifies that the SNA users should select a photo (4) with an image picker widget, receiving the image list from step 3. In addition, the SNA extracts the selected photo location through a data manipulation widget (the green box connected to the image picker widget). In the second branch (step 5), the SNA extracts the location from all contents retrieved at step 3, matching them with the location of the photo from step 4. Finally (7), the application retrieves the friends ID from the filtered data, and tags them in the photo selected at step 4.
Once the different widgets are connected, the environment allows the user to run the SNA, inserting the starting input data (e.g., the log-in information) and the other user input needed during the execution (e.g., the image picking).
In order to get a preliminary feedback, we have shown an interactive mock-up to a group of four users without programming experience. We collected their opinions discussing with them. Their feedback highlighted a set of conceptual difficulties that degraded the usability of the tool. First of all, it was difficult for all users to understand which data was provided by a widget, or the effect of data manipulation, without executing the SNA. The users switched often between the design and the run step not only for checking the application logic, but also for understanding which data was included e.g., in the profile information. Secondly, they had difficulties in understanding the difference between the input and the output sockets, especially while connecting the data manipulation widgets (the green ones). Finally, the pipes cluttered the graphical representation of the SNA, and they had difficulties in recalling the flow order when the number of widgets increased.
5. End User Development Support
Considering the problems elicited with the first prototype, we redesigned the social network data representation and the actions for defining the routine flow. We summarize the design principles we followed for creating the environment user interface (UI), which motivated our choices.
- P1
No separation between the design and the runtime of an SNA. The user defines the data and the application logic while executing the SNA. The goal is to require a lower abstraction effort for the end user, since (s)he focuses on a specific example, while the generalization is demanded to the underlying tool support, as happens with the programming by example paradigm [
7].
- P2
A data type is represented through the interface elements exploited in the social network application UI. Since the user is familiar with such data presentation, we exploit the recognition mechanism for helping the user in understanding the semantics of a data type (e.g., a user profile is represented through the profile picture, the name
etc.). If a data type contains inner fields, such representation allows us to provide access to its inner elements (e.g., the name of the user in the profile, the place in photo,
etc.). In this case, we follow the approach in [
5], where the data
is the UI element from the end user’s point of view.
- P3
The user exploits familiar interactions for defining the input of a routine element and exploiting its output. He or she should consider them as UI objects that can be manipulated inside the environment like e.g., file icons.
- P4
The environment should support the user guiding his/her actions while creating the application logic, in order to (1) avoid conceptual errors (e.g., data type mismatch) and (2) explore the possibilities offered by the environment for stimulating the learning process.
The combination of P3 and P4 supports the users in a gradual transition from the first intuitive manipulation of the data and action representation towards a reflective stage of understanding concepts using a scaffolding approach [
12]. In the following sections, we analyze in detail all the objects provided by FaceMashup, and how their design supports the design principles.
5.1. Scenario Support
Before describing the representation more in detail, we show here how Bob can define an SNA for solving the problem described in
Section 3.
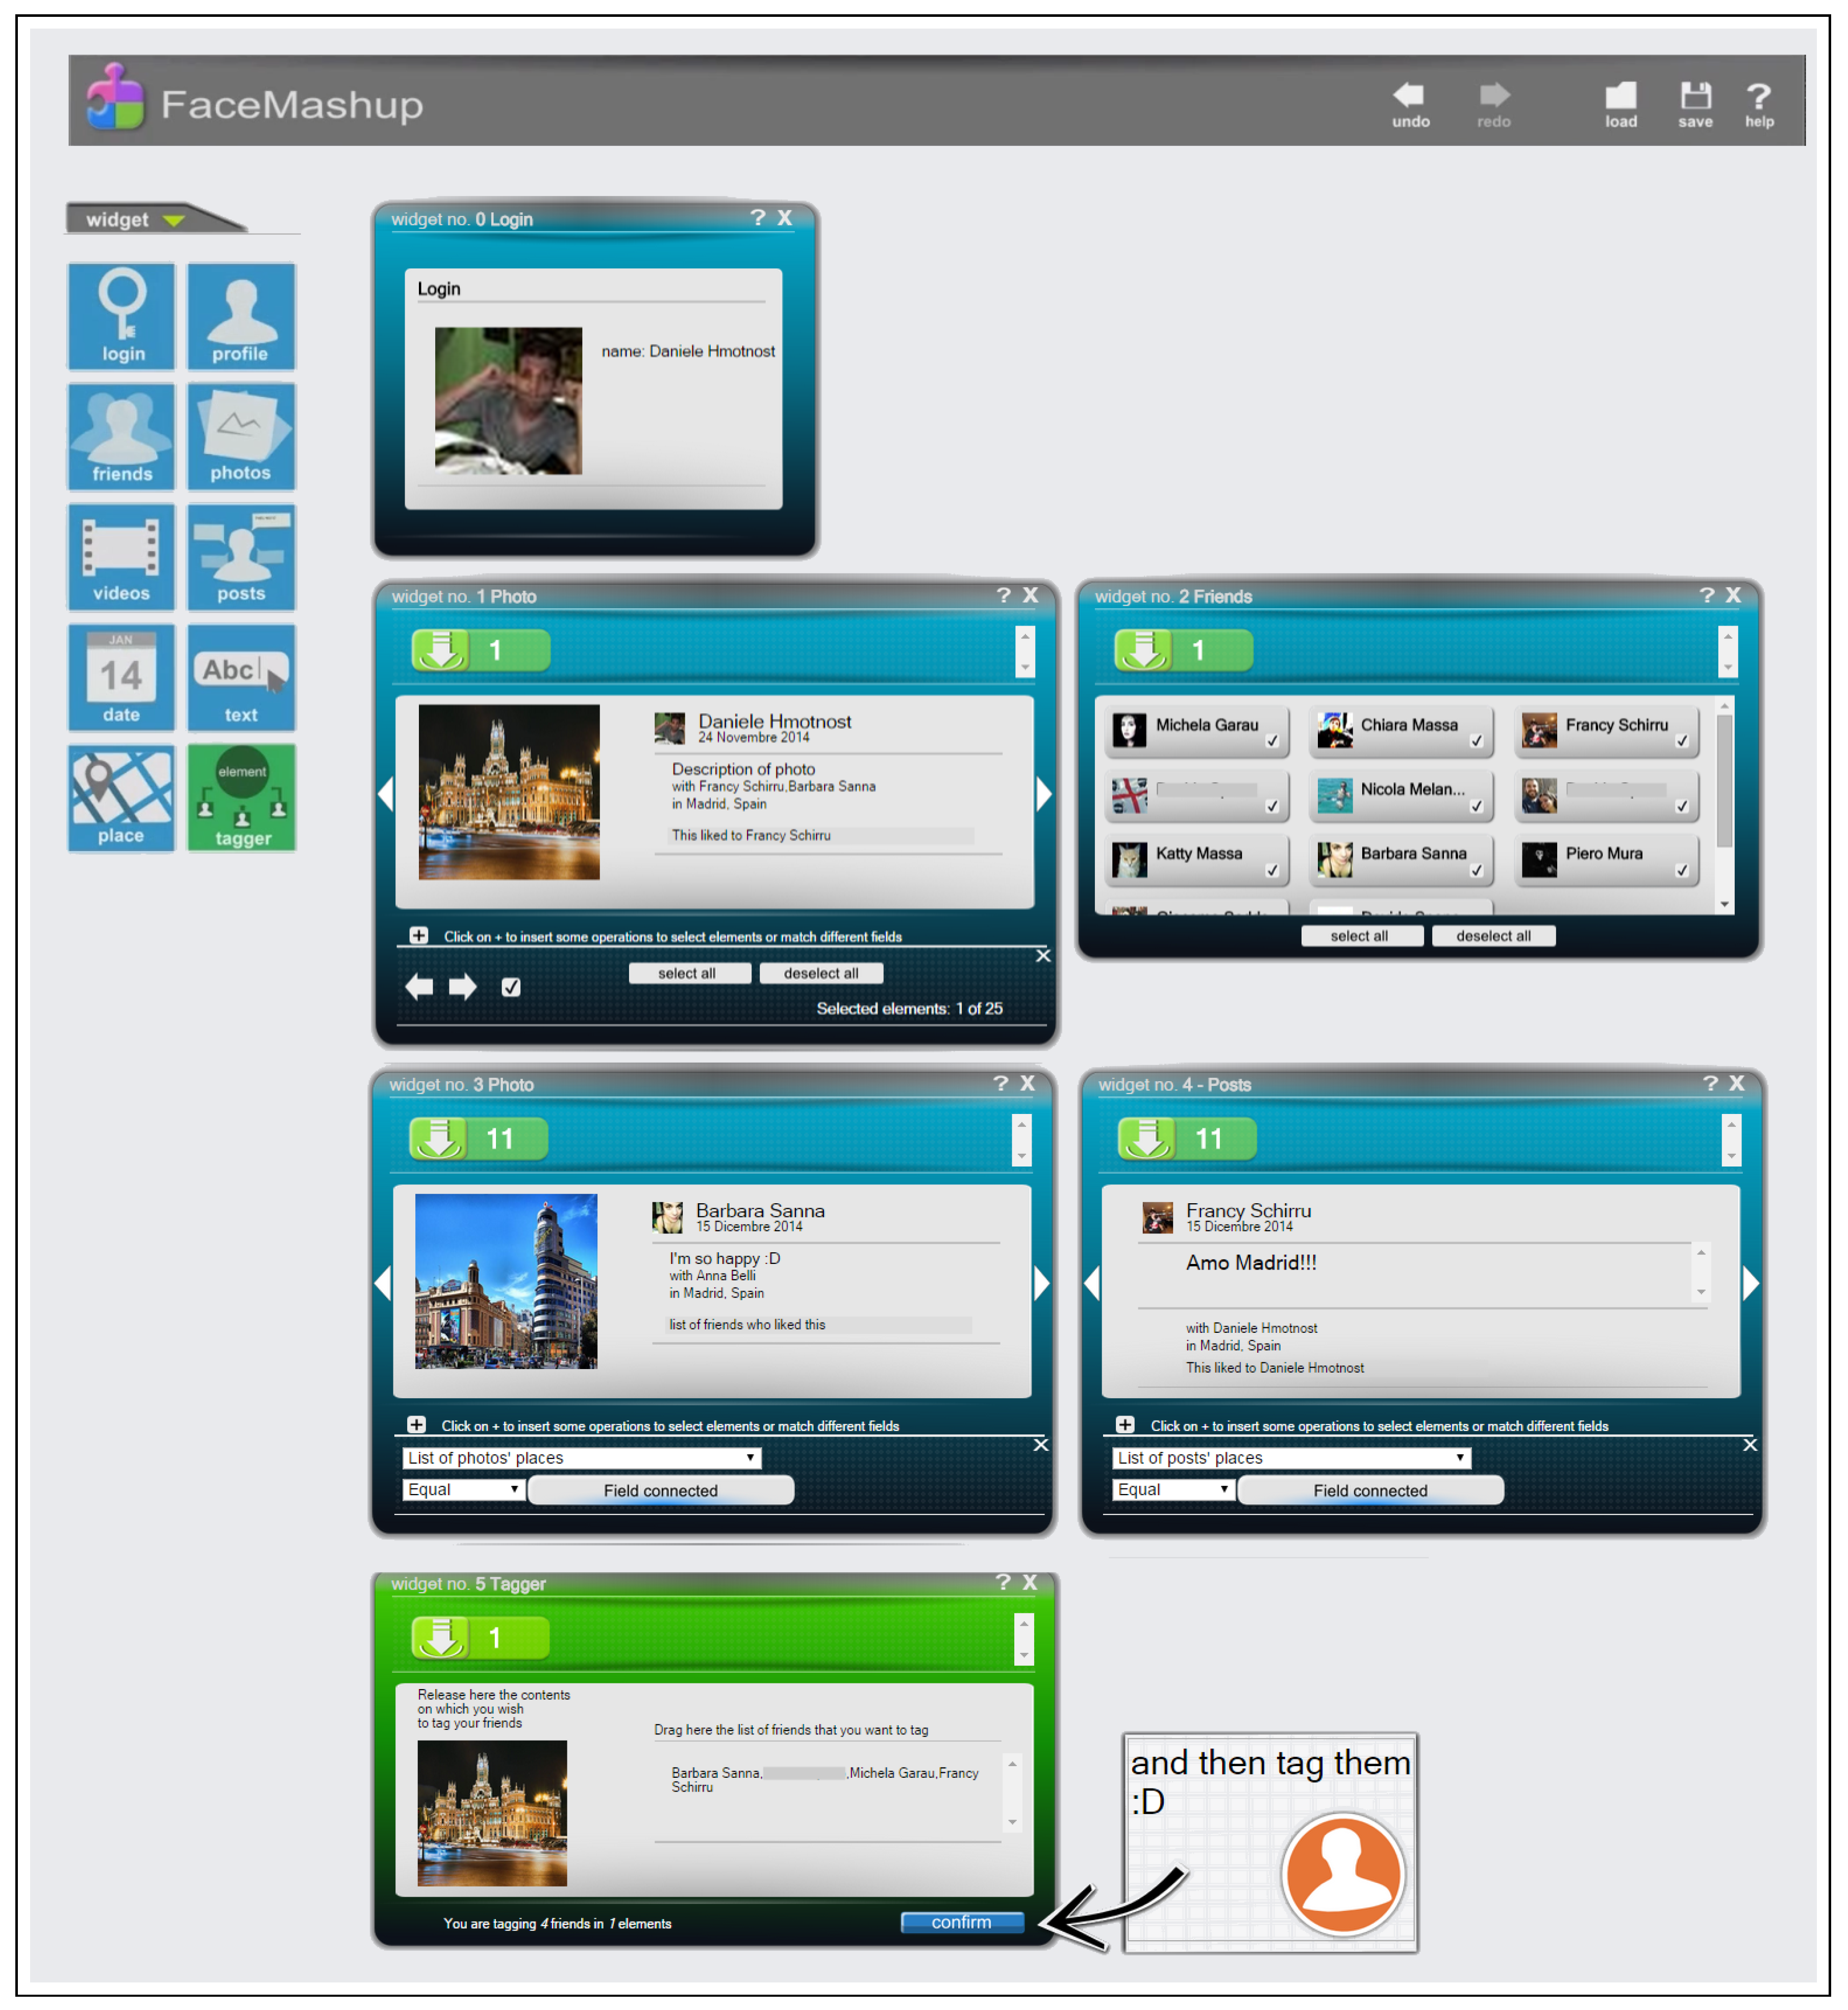
Figure 2 shows the final result, together with the different parts of the environment UI. The environment represents data and actions with widgets, which can be included into the environment through the toolbar in the left part of
Figure 2. He starts from the log-in widget, which shows the information about his profile. Then, Bob inserts the photo widget, for allowing him to select one of his photos. When he inserts the widget in the environment, it suggests dragging a Facebook profile into the content area. Bob drops his profile picture contained into the log-in widget. The photo widget shows the list of his own photos. In a similar way, Bob repeats the same procedure for getting his friends list, inserting the corresponding widget in the working area and dropping his photo into it. The widget shows his friend list.
After that, Bob has to retrieve the posts and the photos of all his friends. He selects the post and another photo widget from the toolbox. As happened for the friend list, each widget requests one or more profiles for showing his data. Bob drags the content of the friend list widget into each one of the new widgets, which show a sample of the retrieved data. Now, he should filter the visualized photo and posts, in order to see only those created in Madrid. In order to do that, he drags the place attributes of the first photo widget into the lower part of the friends photo and post widgets. After that, he sees only the photos and posts created by his friends in Madrid.
Finally, the application must tag the friends that created some content in the selected place. Bob inserts a widget in the environment which represents the tag action. It requires a set of friends: Bob drags the owner detail from the photo and post widgets. This concludes the definition of the application, which has been gradually executed during all the previous operations. The tag operation can be confirmed through a button. In order to execute the same operation for another place, Bob simply selects another photo: the contents inside the friends, photos and posts widgets change accordingly. In order to repeat the action on the new results, the tag operation must be confirmed again. A video showing all the operations in detail is available at [
13].
5.2. Data and Actions
In FaceMashup, an SNA can be defined composing a set of predefined widgets. Each widget represents a block for building the entire application. A widget retrieves data from the Facebook graph, or it performs a specific action, e.g., creating or deleting such data. In addition, a widget can be used for requesting simple direct inputs (e.g., a text or a number) to the SNA user. Therefore, we group the FaceMashup widgets into three categories:
Content,
Action or
Input widgets. It is possible to drag new widgets into the FaceMashup environment selecting them from a tool bar positioned on the left-part of the environment UI (visible in
Figure 2). If a widget is not needed anymore, it can be closed through the X button in the top-right corner.
The content and the input widget manipulate data but do not modify it, which is the task of the action widgets. FaceMashup highlights such differences through the widget background color: Blue for those that do not modify data, green for action widgets. It is worth pointing out that the data access and execution of the different actions is constrained by the Facebook Graph API privacy policies. Therefore, each access or action may have different effects according to the user who executes the SNA. We elaborate more on this aspect in
Section 6.
Content widgets are user-friendly representation of the Facebook graph data types. In FaceMashup, it is possible to insert the following content widgets:
Login. It allows for executing the different actions and retrieve the data on behalf of a specific Facebook user, who accesses the SNA through his/her credentials on the social network. Once authenticated, the widget allows to access the authenticated profile information.
Photo. It allows for retrieving the photos uploaded by a specific user or list of users.
Post. It retrieves the posts created by a specific user or list of users.
Video. It retrieves the videos created by a specific user or list of users.
Friend List. It retrieves the friend list of a specific user or list of users.
Profile Information. It retrieves the profile information of a specific user or list of users.
Like list. It retrieves the contents that a group of users (or a single user) like(s).
Each widget contains either a single content or a list of objects sharing the same data type, depending on both the actual value of a widget input parameter (e.g., the owner profile for a photo widget) and a set of filter values that can be specified by the user. We elaborate more on this aspect in the next section.
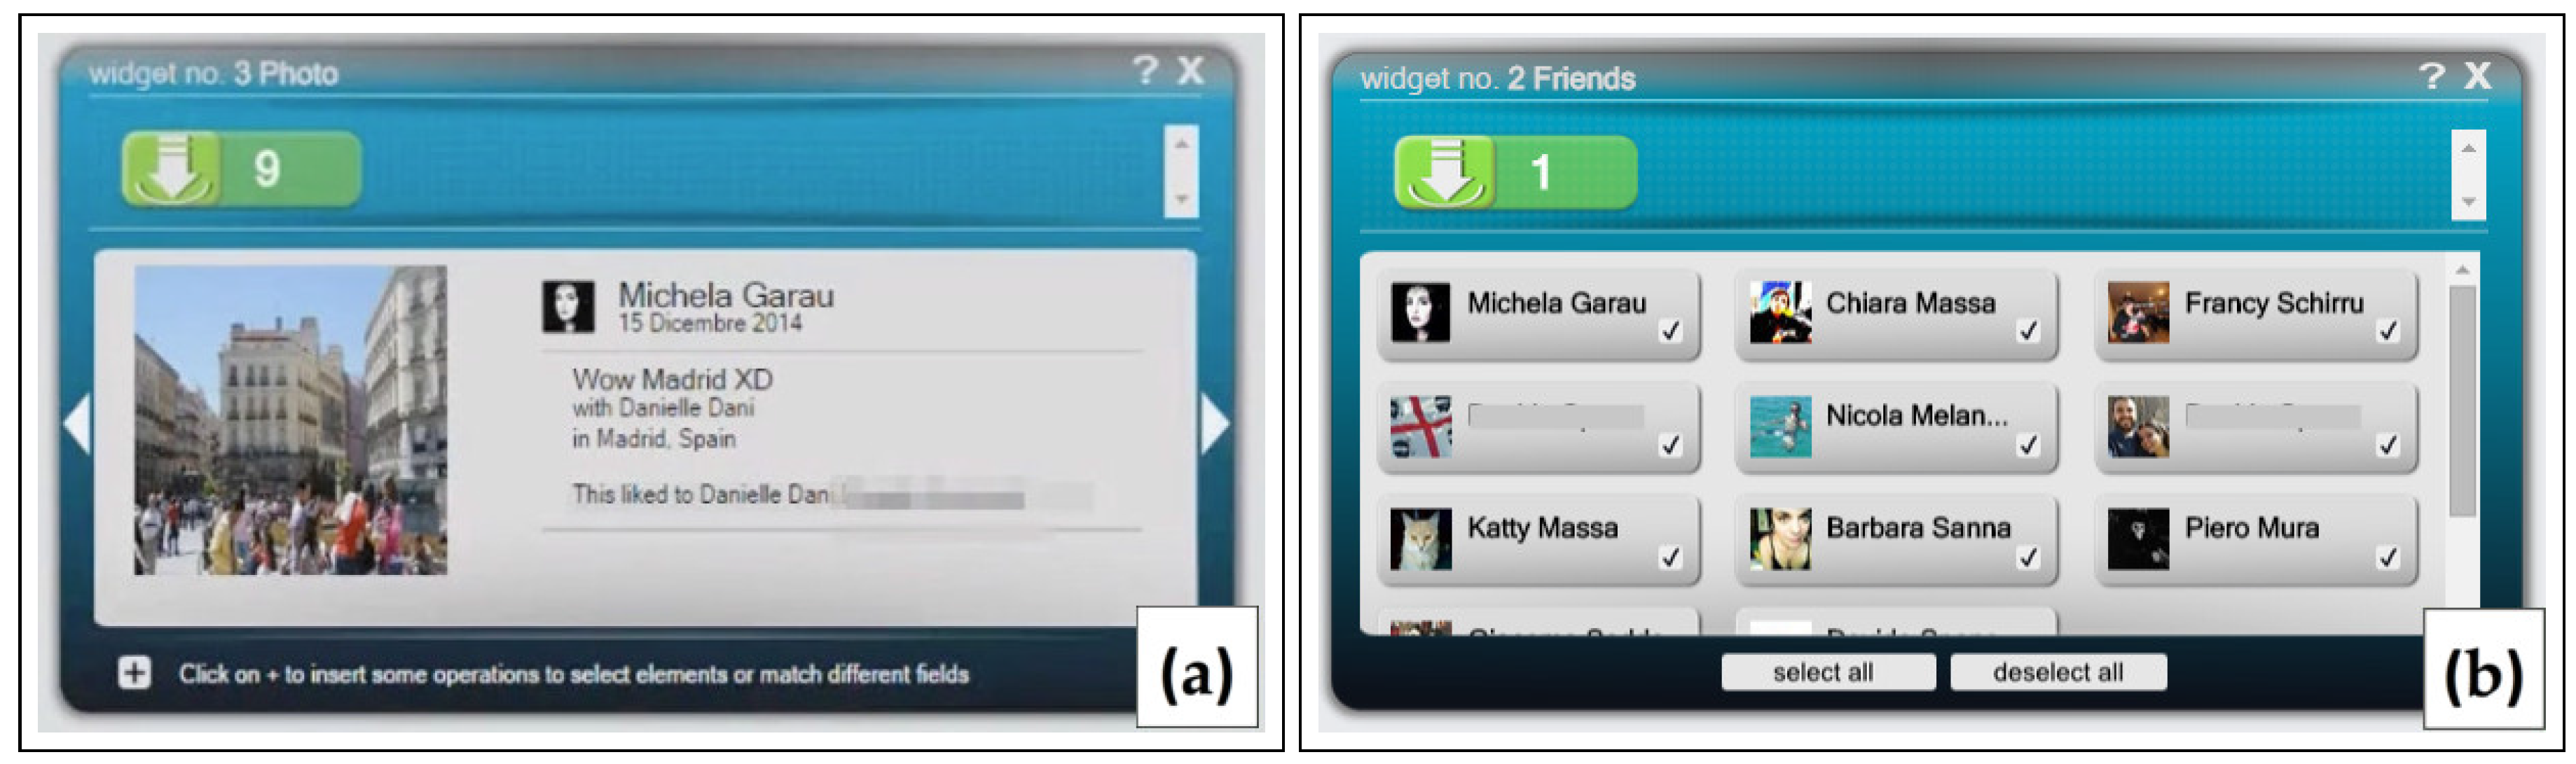
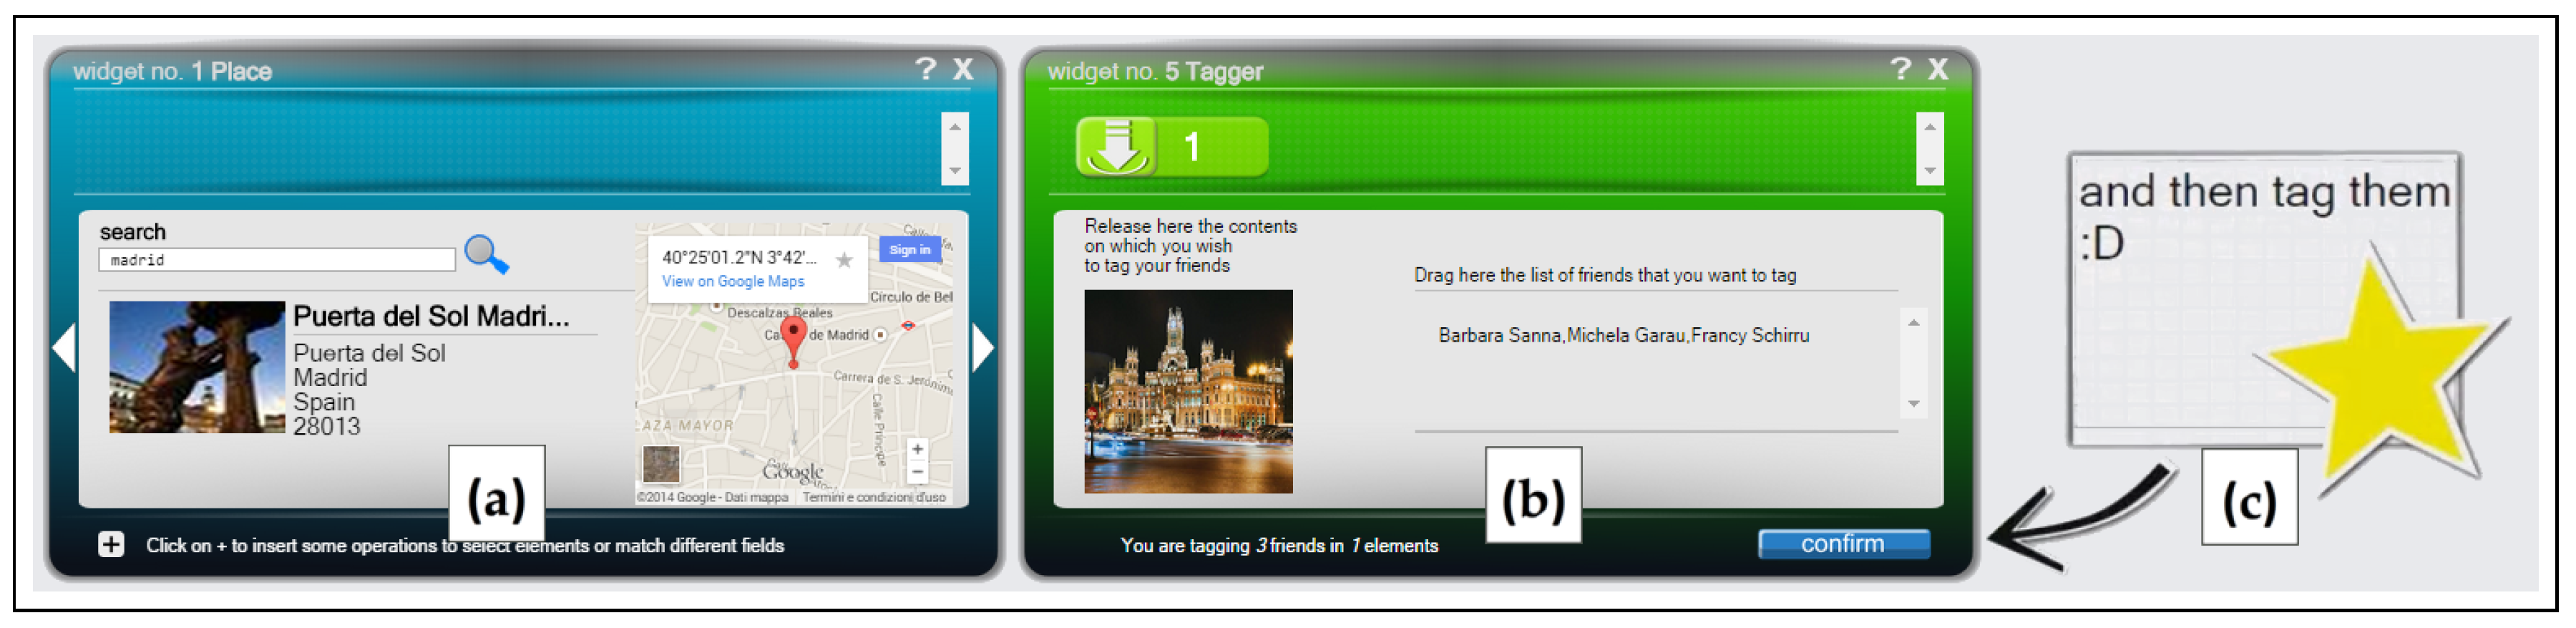
According to P2, we maintained a representation which is similar to the corresponding one in the Facebook UI. For instance,
Figure 3a contains a photo widget that, besides the obvious preview of the photo, contains the information about its author, the location, the list of people who liked the photo
etc. as happens in the Facebook application UI. In case the widget contains more than one photo, the user can browse between them using the arrows at each side of the widget box.
Figure 3b shows the friend list photo, which is again inspired to the representation of the friend list in the Facebook UI. For each friend, the widget shows the profile picture, his name and surname.
The second type of widget we included in FaceMashup is the
Input, which collects data inserted directly by the user of the SNA. Input widgets can be used for filtering and/or define the application flow as happens for the data retrieved by the Facebook graph. FaceMashup provides the following input widgets:
Text. It allows for inserting a small text, through a textfield.
Number. It allows for inserting a numeric value, through a textfield that accepts only numeric input.
URL. It allows for inserting a link to a web resource, showing a small preview of the linked content.
Date. It allows for inserting a date, picking a day from a calendar.
Place. It allows for specifying a location or a point of interest, searching it by name and/or picking it from a map view.
We show an example of input widget in
Figure 4a. The user specifies a location writing its name in a search bar, and the widget updates the map visualization accordingly.
The last type of widget included in FaceMashup is the
Action. Such widgets take as input a set of objects and modify their state or add new content on the Facebook graph. We included in the environment the following set of action widgets:
Tagger. It takes as input a set of contents (e.g., posts, photos videos etc.) and a set of user profiles. It performs the action of tagging all the profiles in all the specified contents.
Share. It allows for sharing content on the Facebook wall. It takes as input one or more URLs, photos, video etc.
Like. It allows for liking a set of contents, passed as input to the widget.
Figure 4b shows a tagger widget. If the user presses the confirm button, it would tag the list of friends in the specified content(s).
5.3. Flow Control
If we do not consider the input and the log-in, all widgets show contents or perform actions according to some input data. The end-user defines which widget provides such input data while creating the SNA. In this way, (s)he is able to create and control the flow of the routine (s)he wants to automatize.
This operation is the most complex supported by the environment and, according to P3 and P4, the one where the user requires more support. The data transport between two widgets exploits a drag and drop metaphor: a UI element, which represents a data type or a data field, can be selected in a source widget, and it can be dropped inside another one. Such interaction specifies that the data corresponding to the selected element is the input of the widget where it was dropped.
This metaphor poses three challenges to an the end-user that is trying to define an SNA. First, (s)he must recognize that a widget needs some input in order to retrieve other data or perform an action. Second, (s)he has to identify which UI element can be selected and dragged towards another widget. Third, (s)he must be able to drop the content into a widget that accepts it, in order to avoid a type mismatch.
We propose to solve these problems applying the design principles listed in
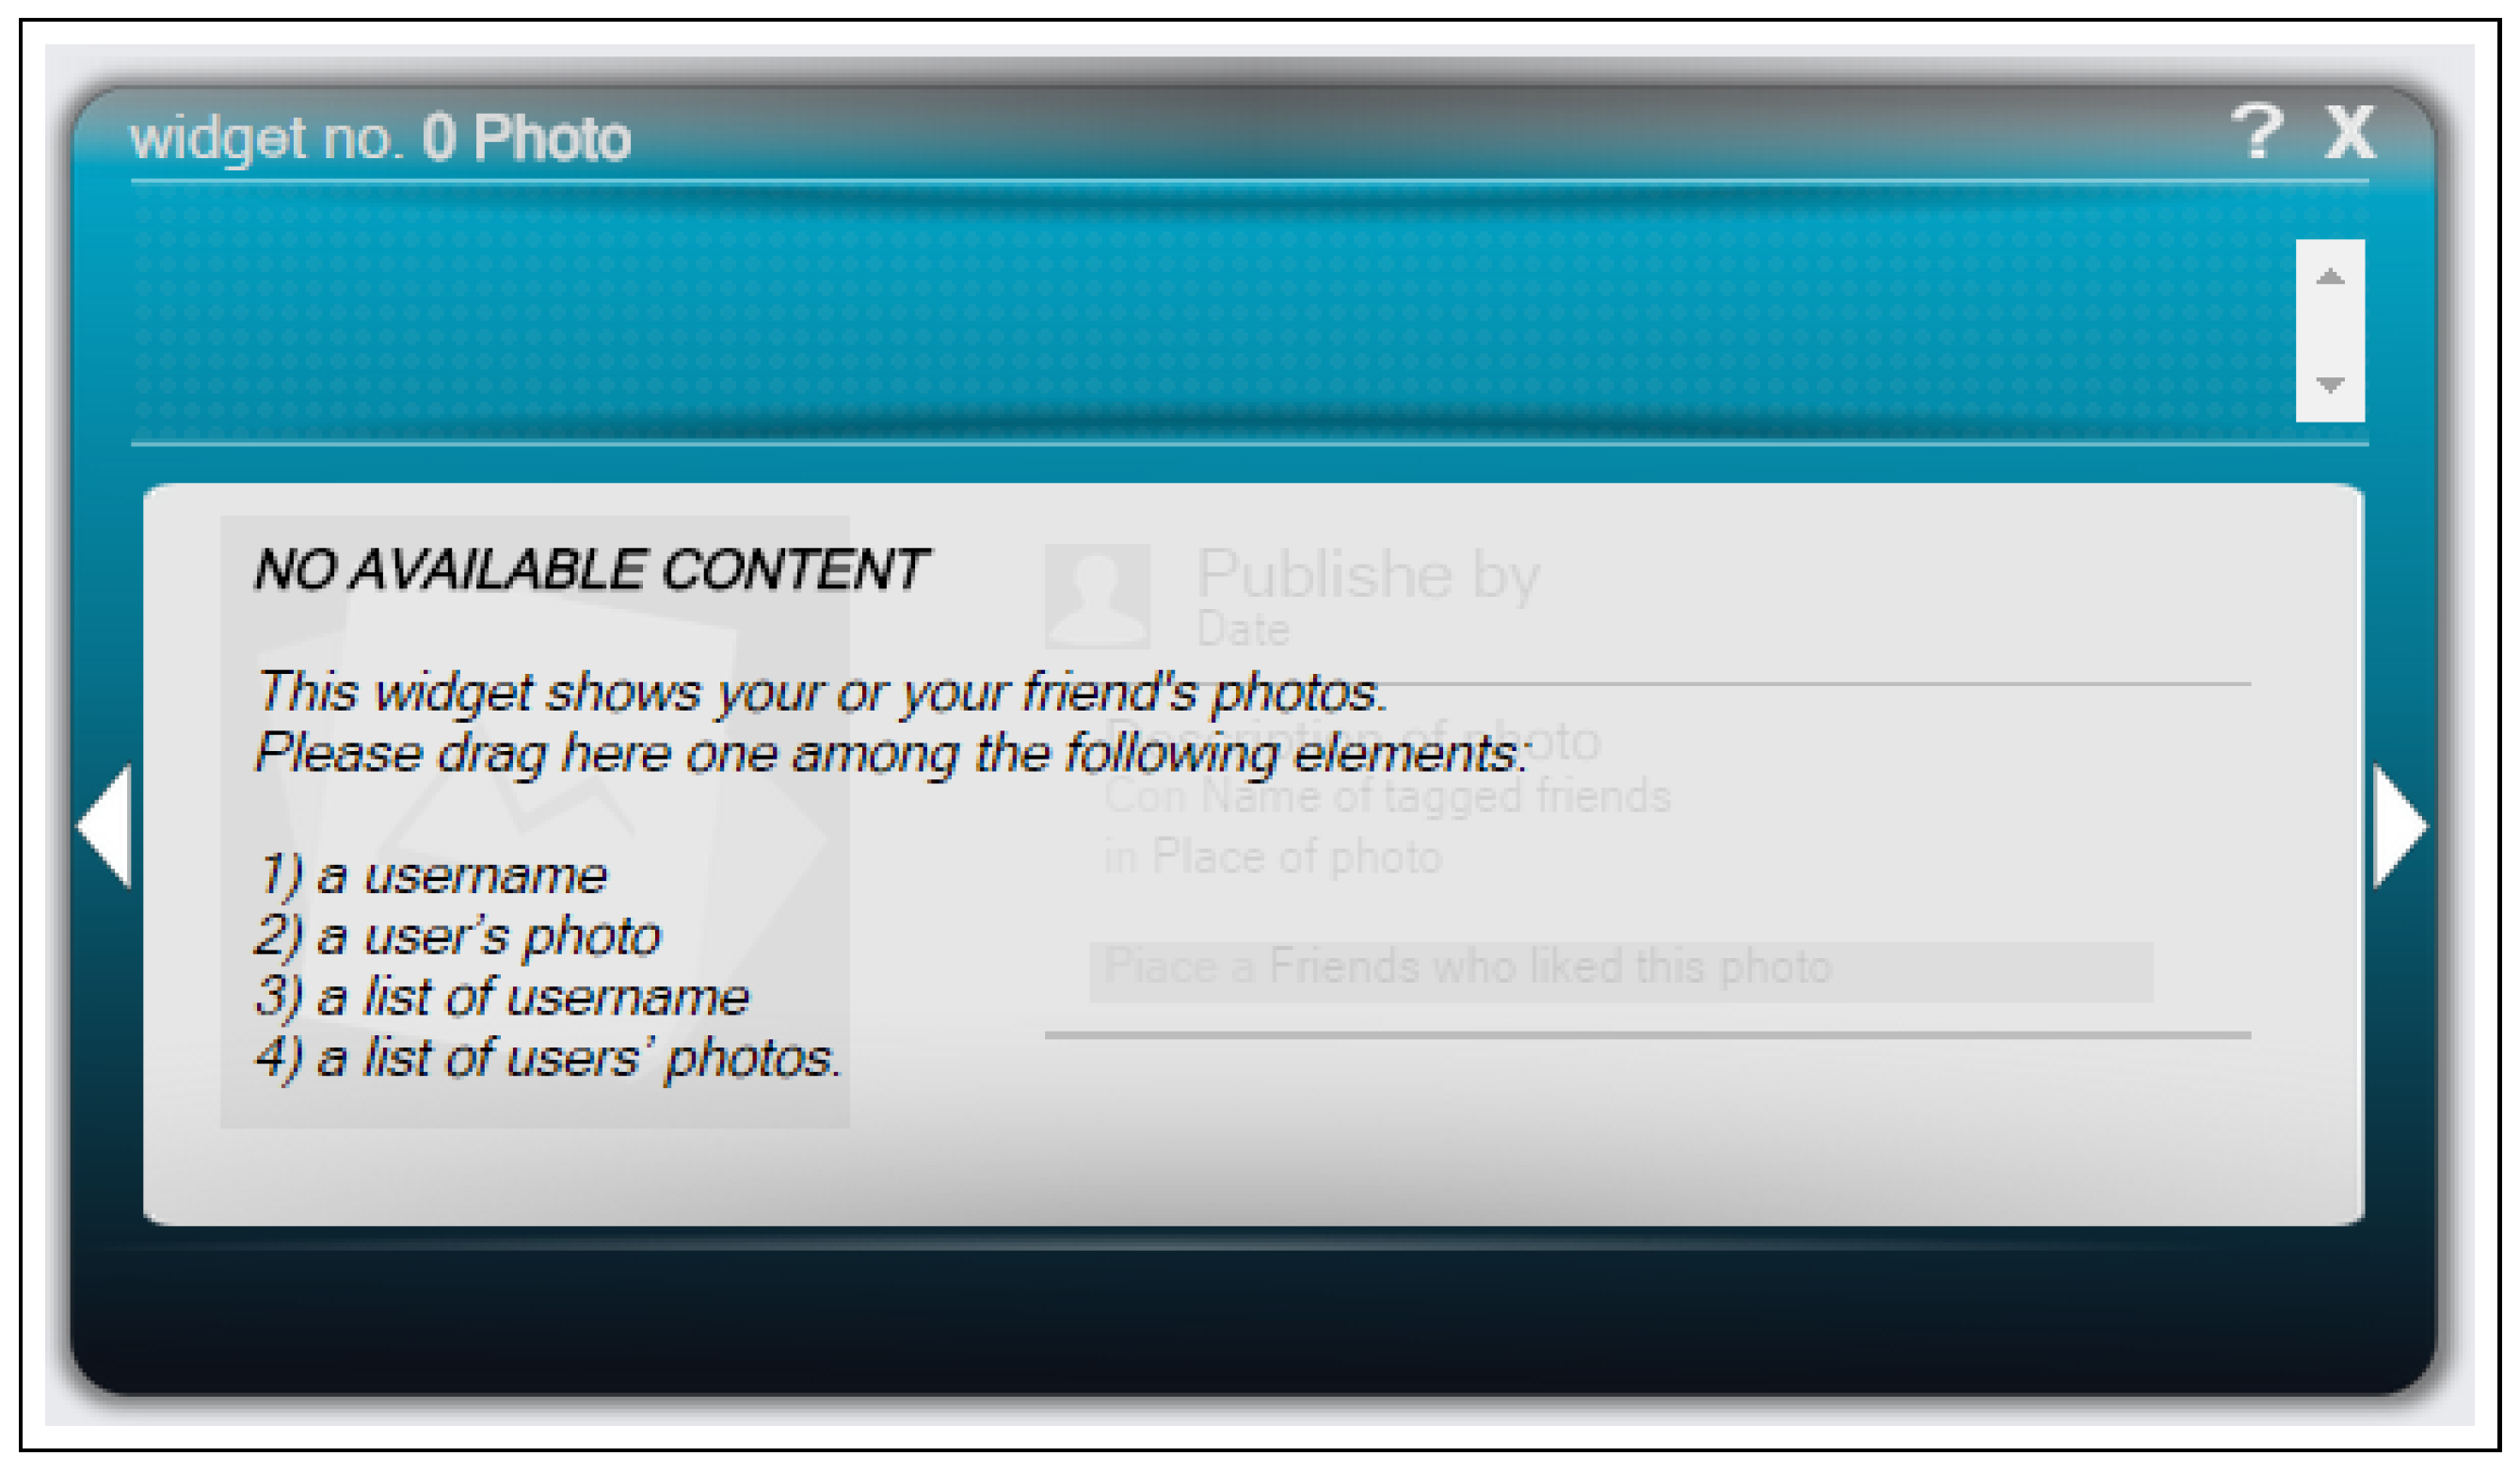
Section 5. First of all, when the user adds a new widget in the environment, it shows a help message for supporting the user in figuring out which kind of information it needs.
Figure 5 shows how a photo widget looks immediately after adding it into the FaceMashup environment. Since it needs one or more user profiles for retrieving a user’s photos, it suggests how the user can specify them dragging data from other widgets.
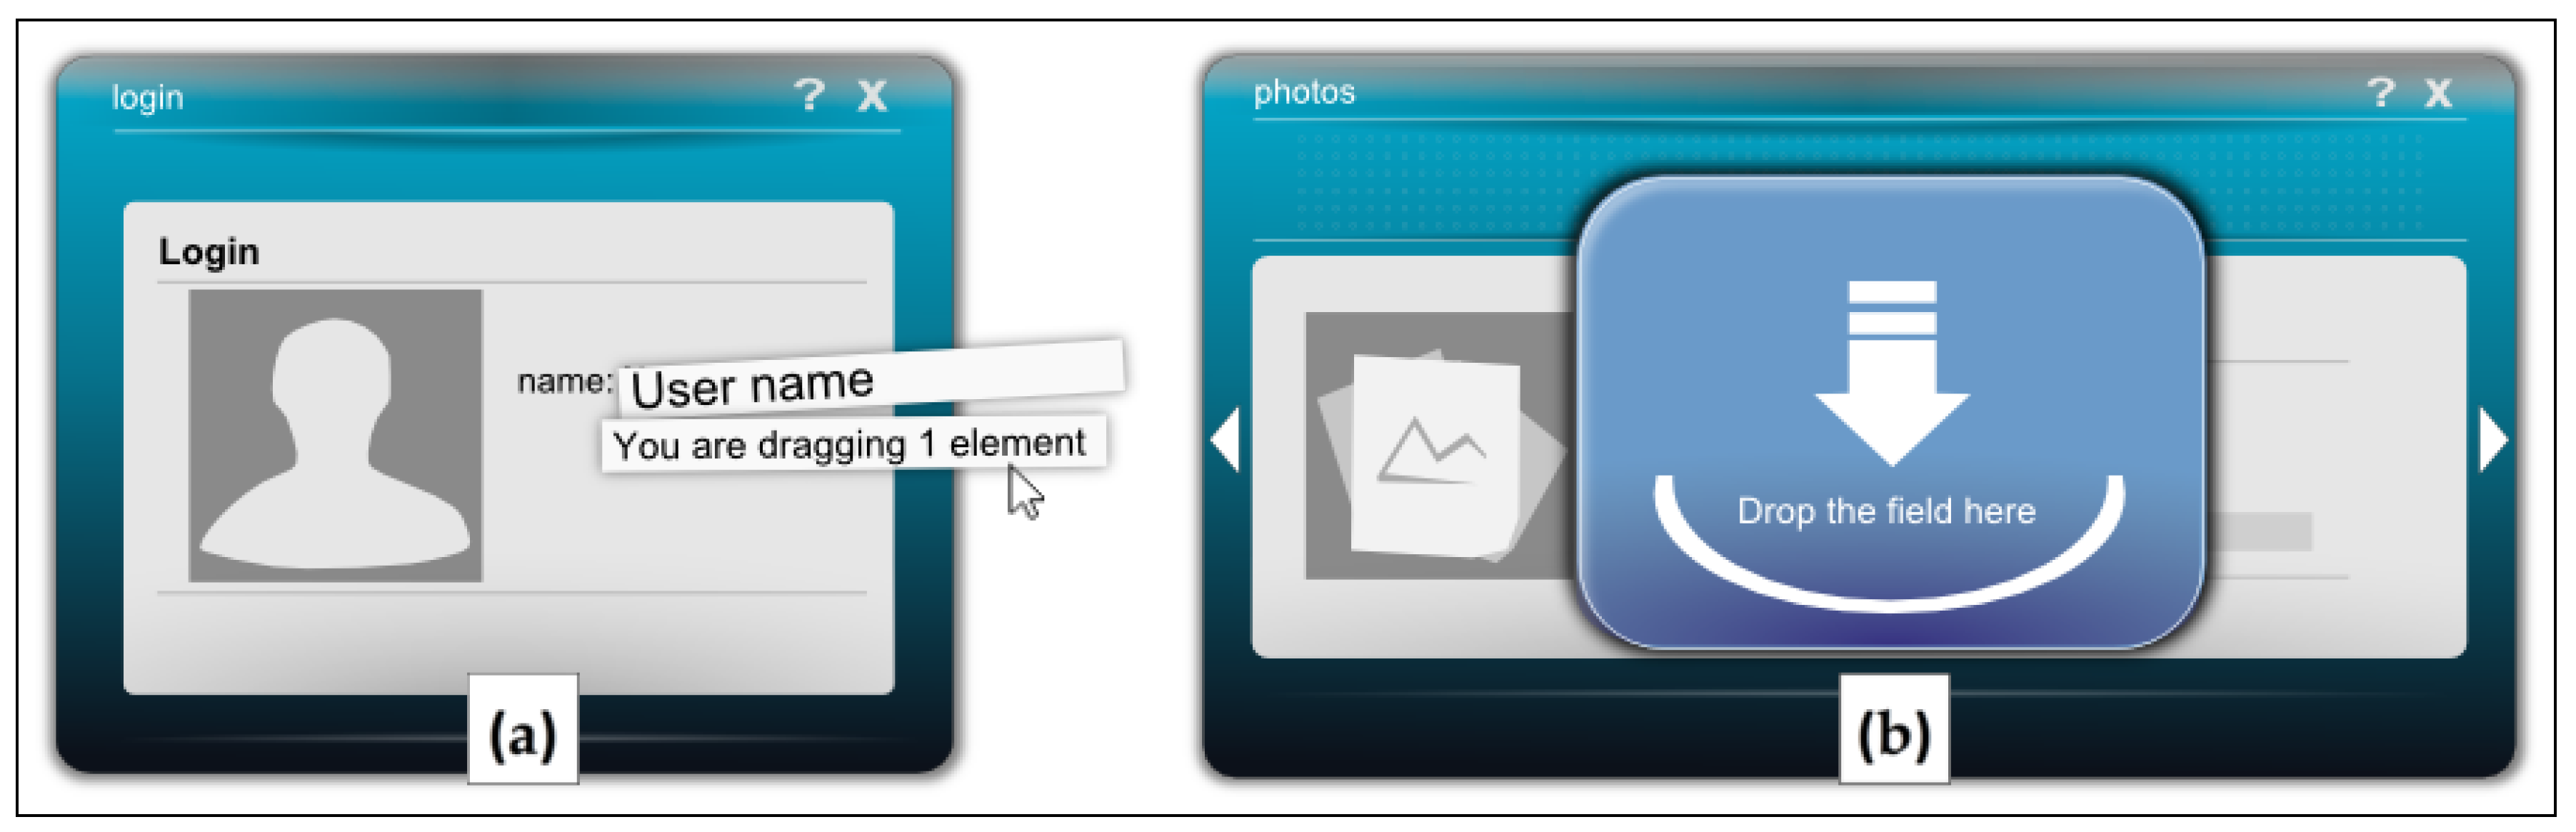
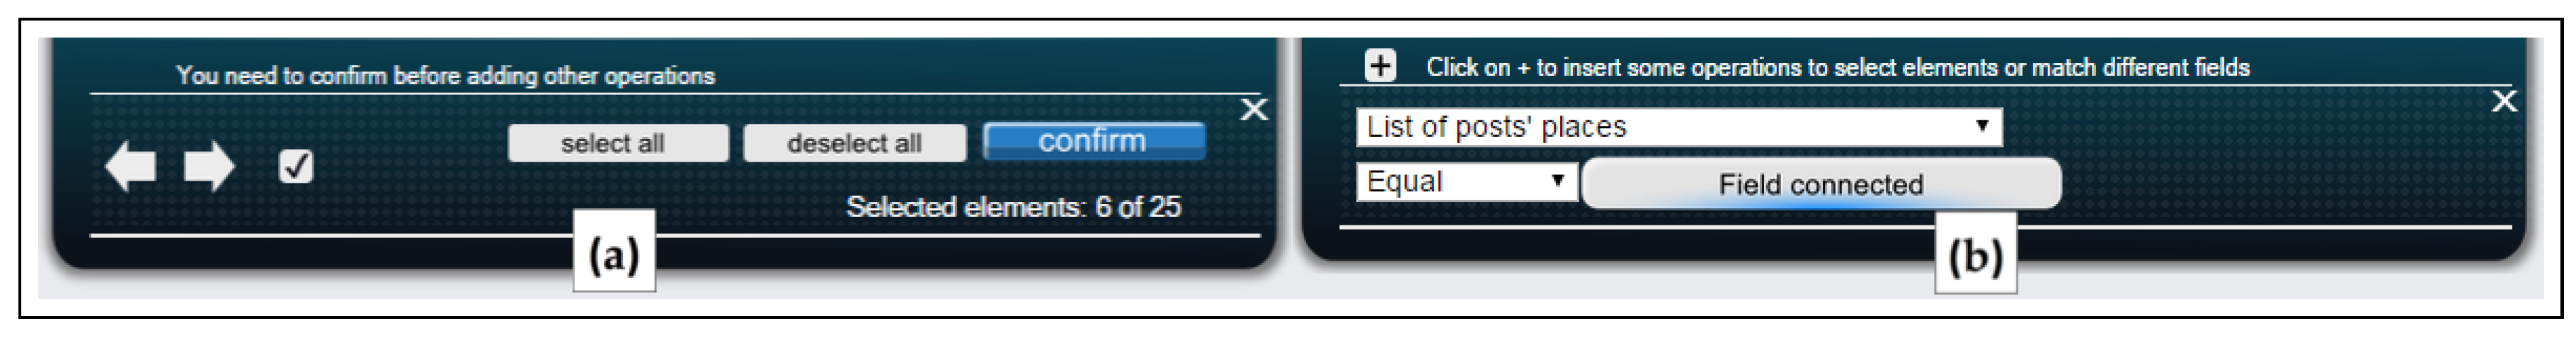
In order to show which elements can be dragged from a widget, FaceMashup visualizes an immediate feedback to the end-user each time (s)he clicks the UI element. Such feedback contains information about the selected field, like its type and value, and also the number of dragged elements. Indeed, it is possible for the user to move more than one data object at a time, for instance dragging the entire content of a photo or friend list widget by selecting the container box.
Figure 6a shows an example of such dragging feedback, where the user is informed that (s)he is dragging one data object, corresponding to the profile name.
Finally, the tool guides the user for choosing one among all the available options for releasing the data (s)he is currently dragging. It matches the selected data type with the input needed by all the widgets in the environment. For all widgets that may exploit the such data, FaceMashup shows an icon suggesting to drop the content, as shown in
Figure 6b. In this way, we prevent end-users errors, since we do not allow him/her to release the data elements into widgets that do not accept them. Once data is dropped inside a widget, it immediately updates its visualization for showing the retrieved content.
As happens in other environments that exploit a similar widget representation [
4,
5], the connection mechanism defines both a data dependency and a temporal relationship among the widgets included in the environment. The convention we adopted in FaceMashup is similar to data-flow based approaches for EUD (e.g., Yahoo Pipes): each time the data source widget changes its value, the connected widgets update their values accordingly. Therefore, the connection defines implicitly a partial temporal ordering among the widgets, which can be automatically computed by the underling environment support.
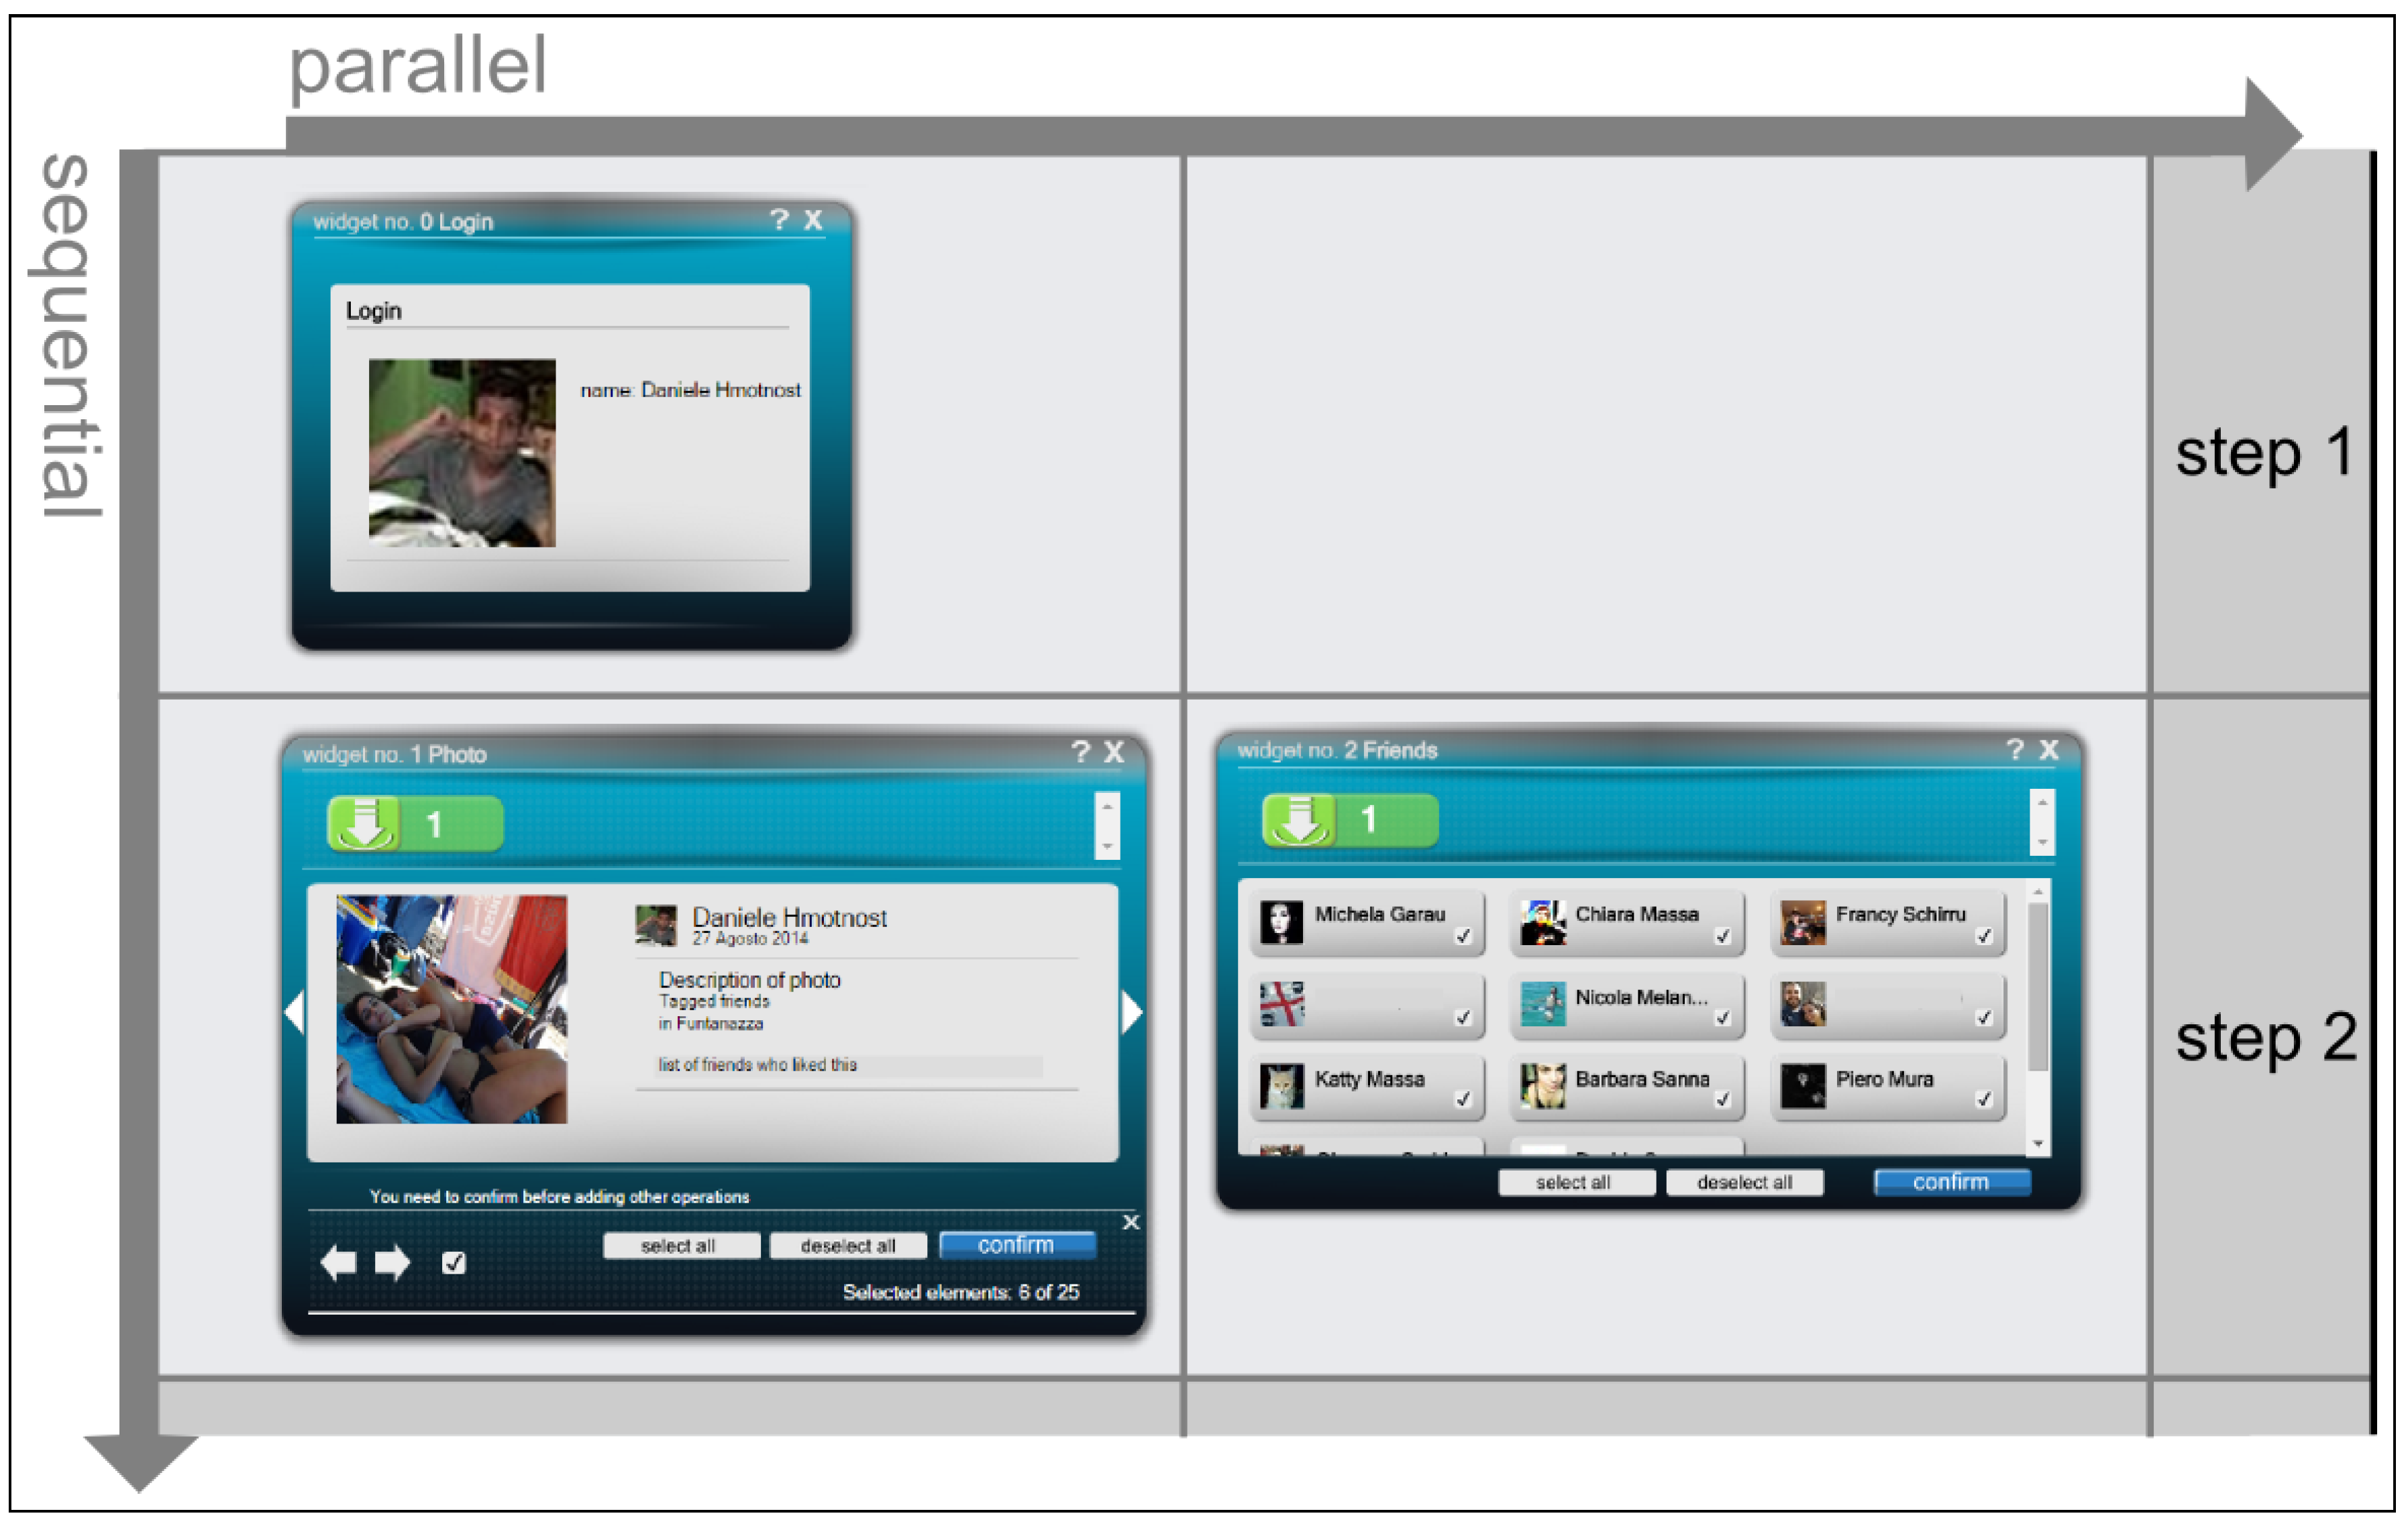
FaceMashup represents explicitly such ordering positioning the widgets inside the environment. It represents a sequential relationship between a widget A and B positioning B below A in the vertical axis. Instead, if the user may provide the information needed by both widgets at the same time (theoretically) or in any order (more practically), the widgets are represented in the same position in the vertical axis, aligned horizontally. This creates a grid of widgets, where rows represent sequential steps and column parallel operations.
The environment maintains the widget ordering as follows. It positions a new widget in the first row. Each time the user drops data from a widget positioned at row n into another, the environment positions the data destination widget into the -th row.
Figure 7 shows an example layout of a FaceMashup SNA. In the first row, there are all widgets that do not depend on any data, the log-in widget in our case. The photo and the friend list both take as input the user profile retrieved by the log-in widget; therefore, they must be placed below it. In addition, since there is no dependency between them, they can be both placed in the second row.
The end-user is able to recall which widget provides input to another one through hints in its presentation. If a widget receives data from any source, in the upper part, there is a green icon with a small number indicating the cardinality of the input set. If the user clicks the icon, the environment highlights the corresponding source widget. If compared with the first design, the new one lost the explicit representation of the connections removing pipes. Showing such information on demand reduces the elements in the visualization, which is simpler to read. The user can de-connect the two widgets by simply dragging out the green icon.
Besides setting the widget input source, in FaceMashup, end-users can control the contents retrieved by a widget applying some filters, in order to select the set of items according to an end-user defined criterion. In order to filter the contents, the user can follow two approaches. The first one is a manual selection of the contents from the set. For instance, (s)he can browse the images retrieved by a photo widget and select only some of them through a check-box (see
Figure 8a).
The second option is to define a filter through the bottom part of a content or action widget. A filter defines a simple comparison between a data attribute (in the example, the place associated with a photo) against an end-user provided value with a comparison operator (e.g., equals to for places, greater or lower than for numeric values
etc.). The operator set changes according to the type of the comparison attribute. The value can be specified dragging data from another widget, as happens for a connection. As in the previous case, the dragging operation defines a temporal dependency between the two widgets.
Figure 8b shows how it is possible to define a place comparison in a photo widget: the retrieved photos have all been shot in a location collected from another widget (Madrid in our scenario).
5.4. Comments and Suggestions
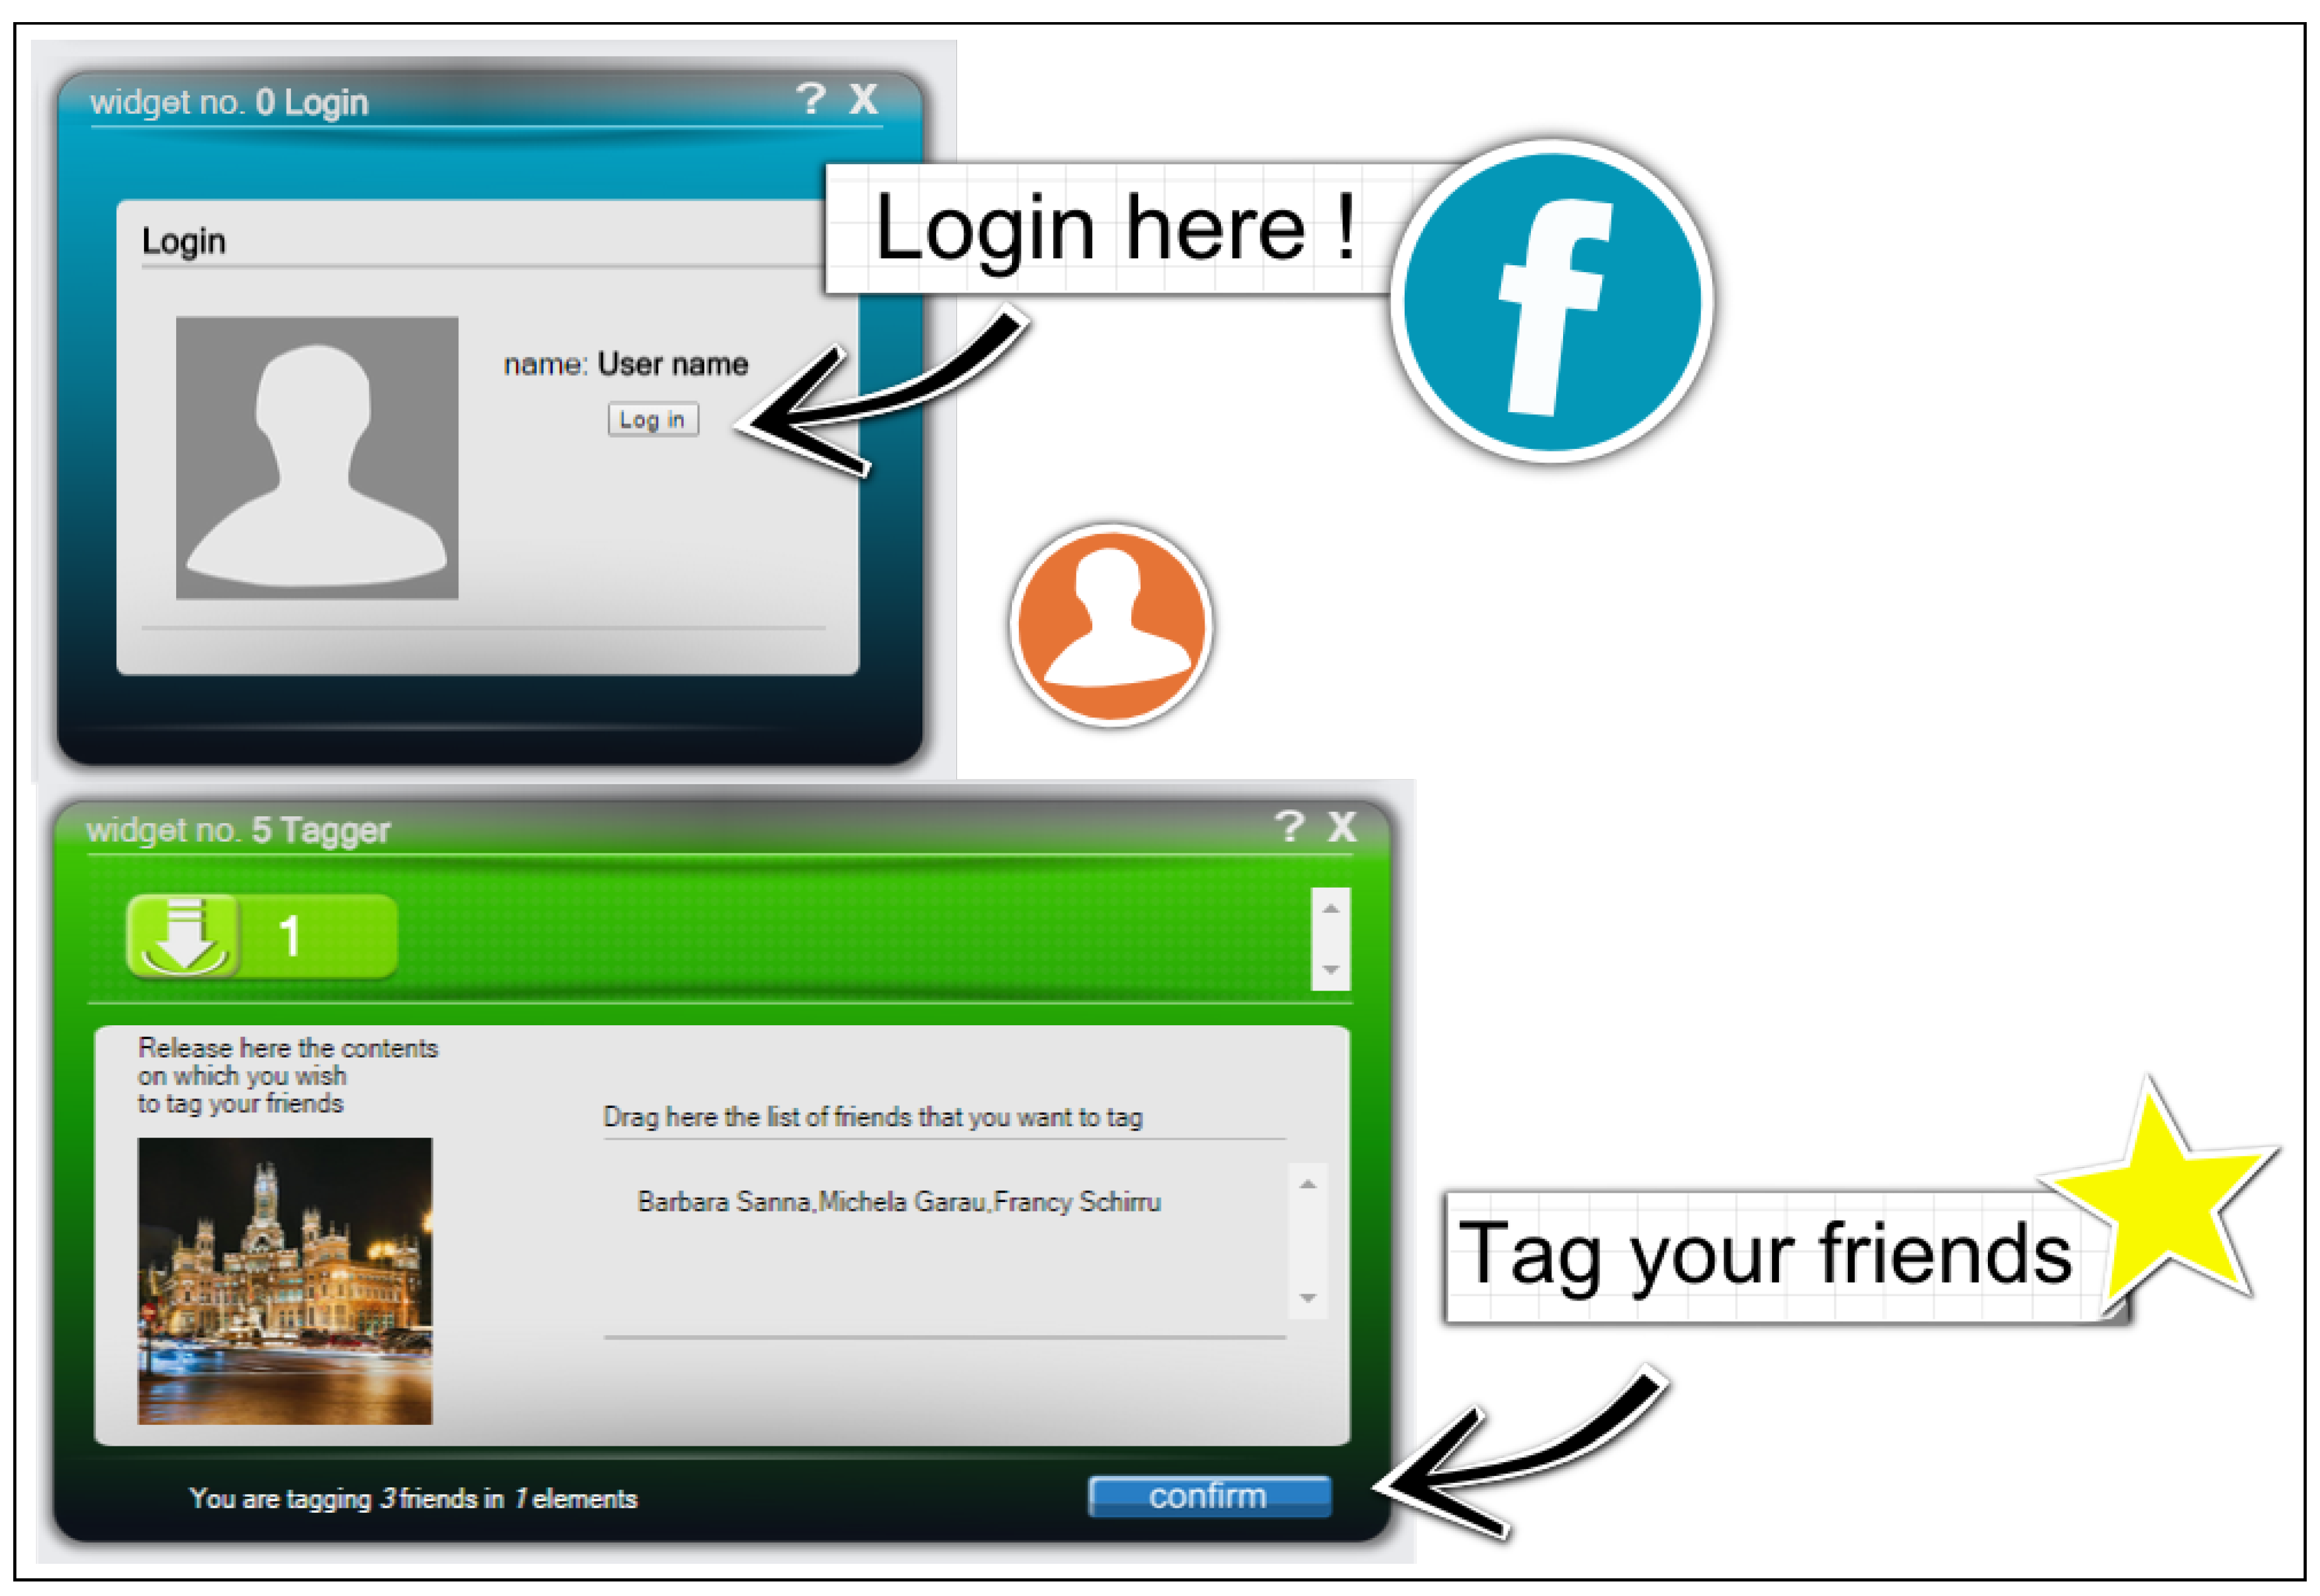
Besides the definition of the application itself, FaceMashup allows the end-users to insert additional elements, for supporting the SNA users while interacting with the EUD application. In FaceMashup, we call such elements stickers, and they are simple icons or text areas where the end-user can write messages and make the SNA more aesthetically pleasing. We included in the sticker set different icons such as the Facebook logo, user profile, photo, place and video. In addition, it is possible to insert arrows for highlighting some widget fields.
Figure 9 shows three stickers in the right part: a text area containing the help message, an arrow and a decorative star. The end-user can insert the stickers freely positioning them inside the environment. In addition, (s)he can add the vertical and or horizontal distance between two widgets for leaving more space for the stickers visualization.
6. Environment Implementation
In this section, we provide some technical details on the environment implementation We are open to share the source code with other groups for further research. Please contact the corresponding author for additional information.
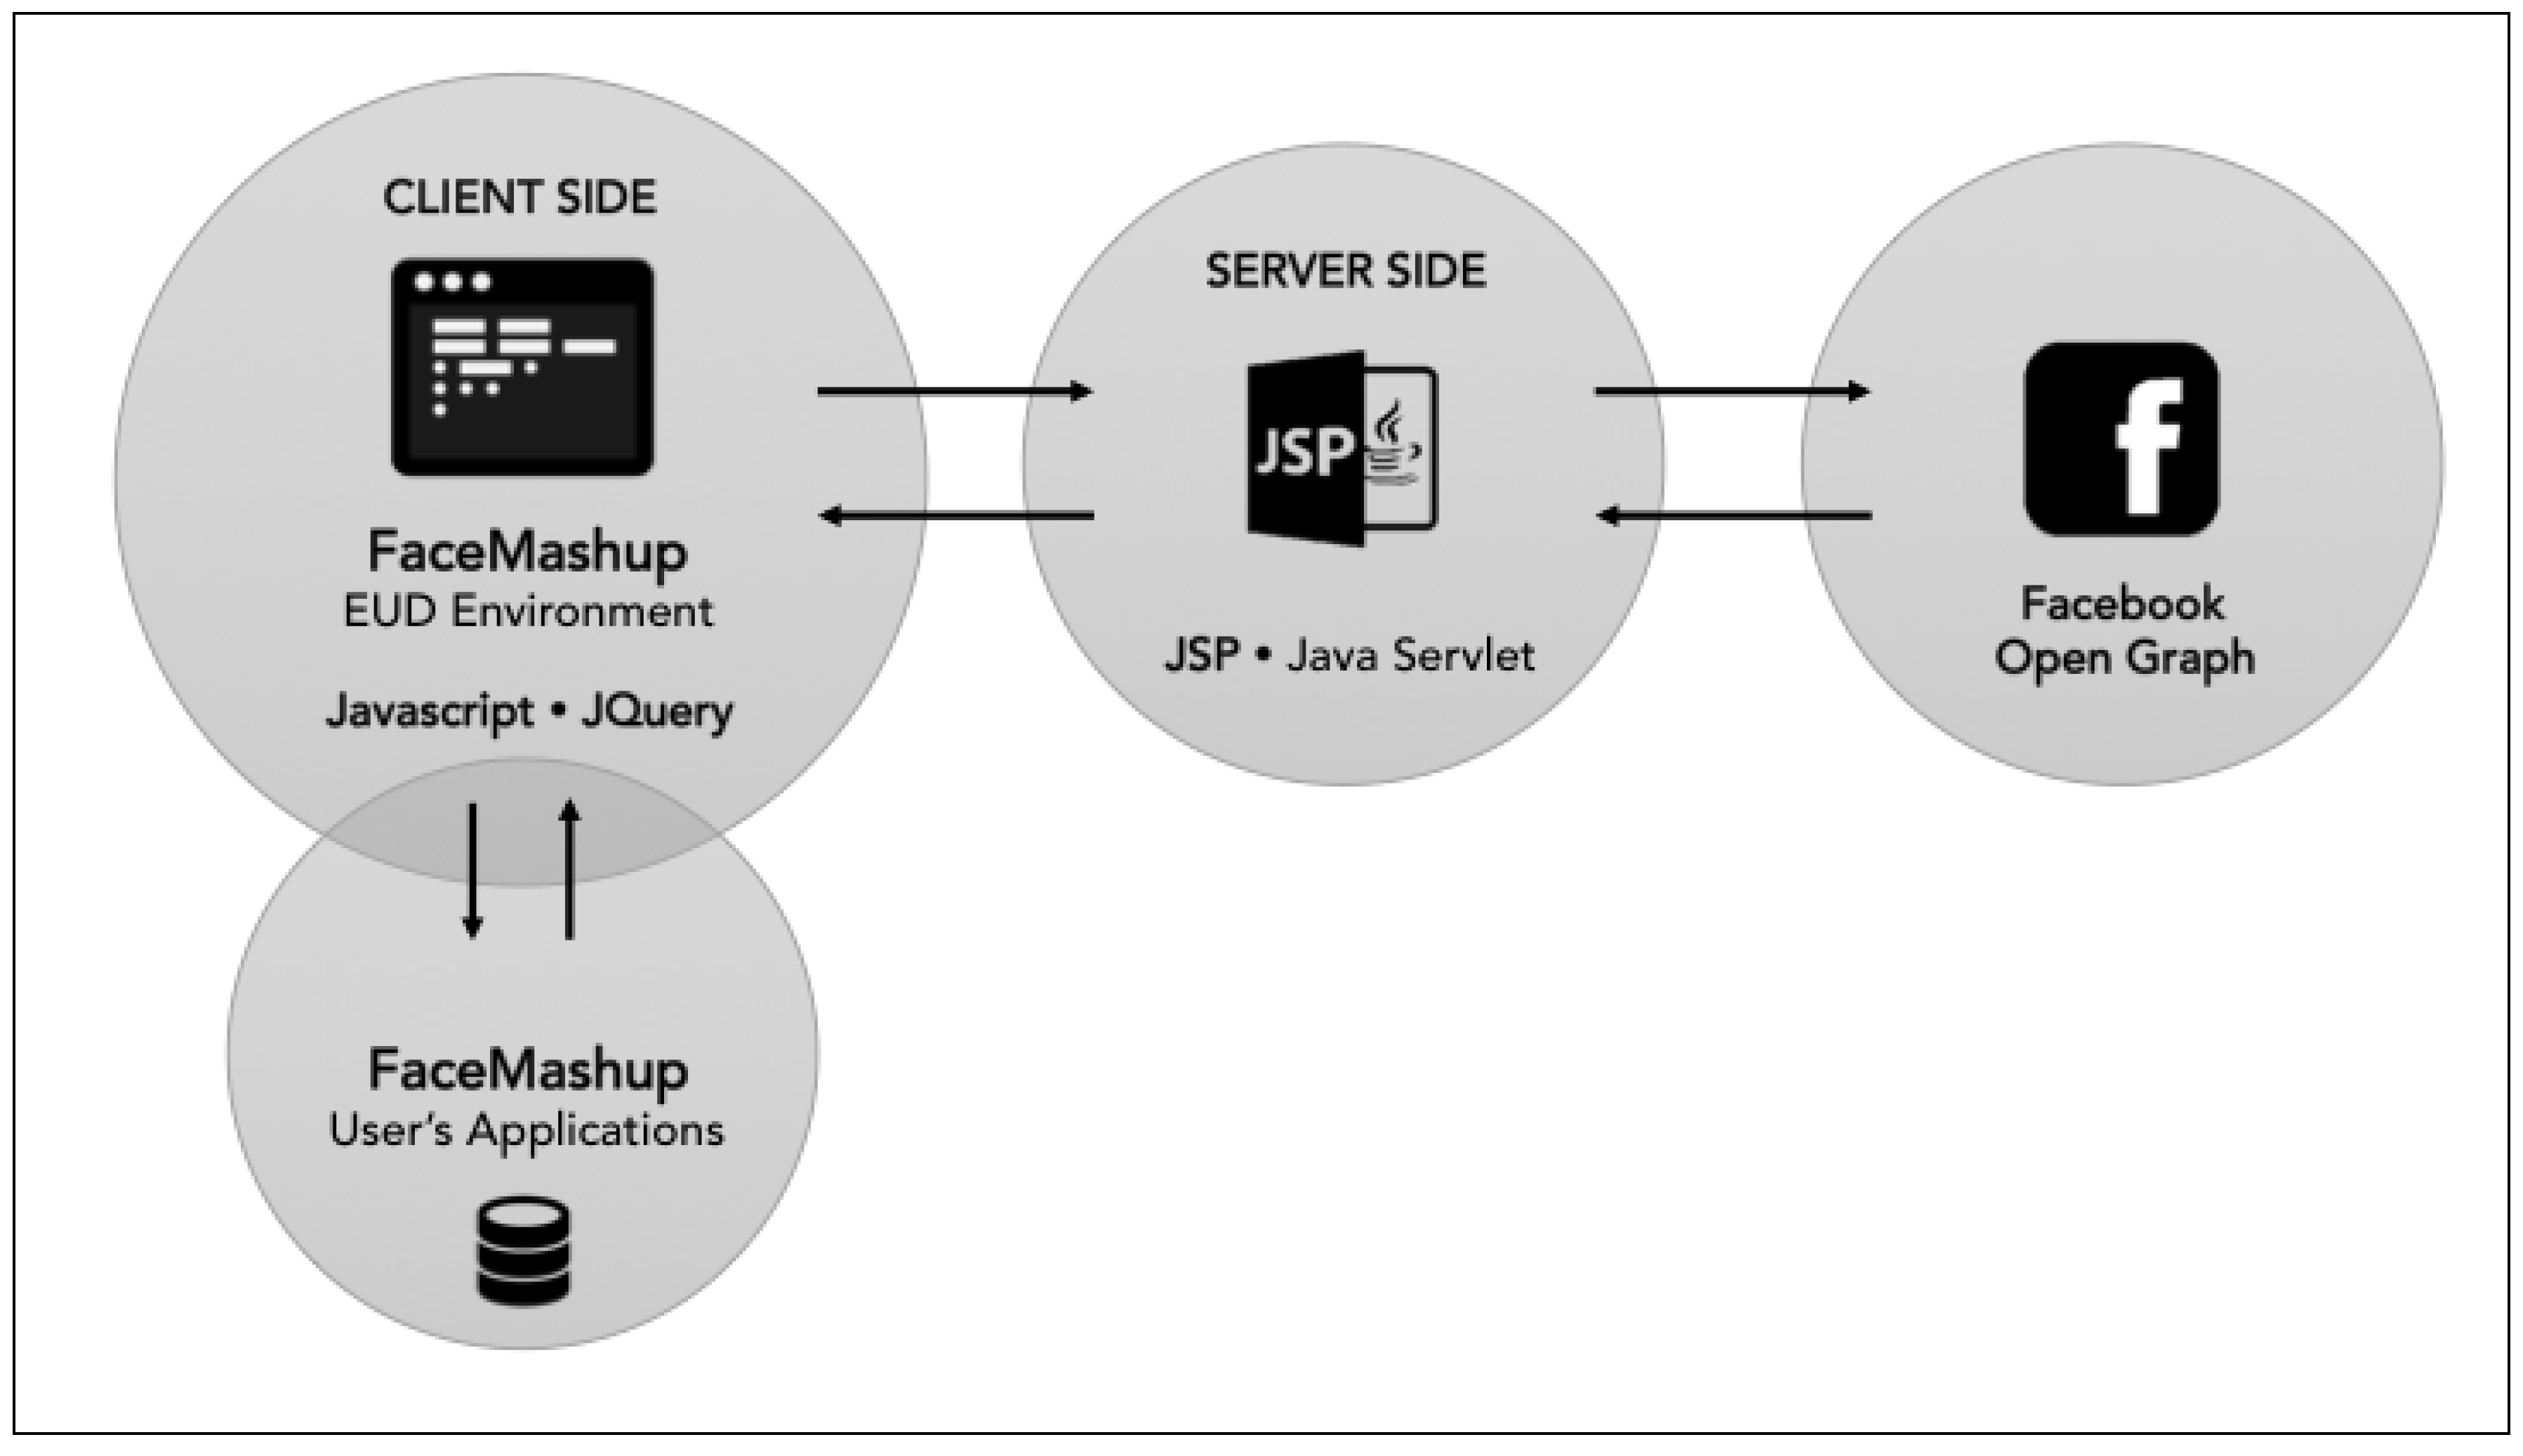
Figure 10 shows the overall architecture of FaceMashup. The tool consists of a client-side part that is responsible for supporting the user interaction, while the server side part maintains the application state.
The initial state of the client side front-end is generated from a JavaServer Page (JSP). During the interaction with the user, the environment creates and modifies the elements through Javascript code, communicating asynchronously with the server through jQuery. The server-side part consists of a Java Servlet that exposes its functionalities through a REST (Representational State Transfer) API. In addition, the server communicates with the Facebook in order to store and retrieve the social network data through the Graph API [
1]. The client-side part never invokes directly the Facebook API, allowing the server to persist all the user actions.
In order to retrieve data from the Facebook API, the FaceMashup environment is registered as a specific Facebook application. Therefore, it has a set of specific read and write permissions on the user’s data, which can be controlled by a Facebook user through the privacy settings.
The environment maintains two different descriptions of the widgets. The first is related to the widget type, which contains a specification of the input and output data provided for supporting the connection suggestions. The matching criteria are not hard coded in the environment, but they are inferred by the widget description. This allows for easily adding new types of widgets.
The second widget description is related to the instances that are currently included in the SNA. Such a description includes the widget identifier, the list of incoming connections, the filter definition, and other information on the widget internal state (e.g., the currently displayed item in a photo list etc.). An application is represented on the server-side as a graph of such widget descriptions.
The update process of an SNA starts from the notification from the client of a user’s action, such as e.g., a new connection. The server receives such notification through the REST API and updates the involved graph node representation accordingly, querying the Facebook graph if necessary. After that, it adds all the elements of the node forward star into an update queue, and repeats the operation until the queue is empty. At the end of the process, the server sends back to the client a JSON (JavaScript Object Notation) formatted description of the state for those widgets that need to be updated. A Javascript routine concludes the client-side state synchronization.
The same widget graph description allows the serialization and the de-serialization of the application state, enabling loading and saving SNAs for sharing and future reuse.
7. Evaluation
We carried out a usability test in order to evaluate the prototype and the techniques for controlling both the data and the control flow. Twelve people participated in the user test, aged between 20 and 36 years old (
,
). They had different education levels: one of them had a junior degree, nine a high school degree and two a bachelor degree. Six of them were students, five were searching for a new job and one had a temporary position. The sample size guarantees a practical significance [
14] considering the granularity of the Likert scales used for the evaluations, following the procedure described in [
15].
None of them had programming skills, while eight used applications for organizing automatically personal data (e.g., Microsoft Excel, Yahoo Pipes, Apple Automator etc.). All users were familiar with Facebook: five of them used it for more than two hours per day, two at least two hours per day, three at least one hour per day, two at least one hour per week.
In the first part of the test, each user was requested to fill out a demographic questionnaire. After that, the participants read a one page description of the application they were going to use. The instructions included a high-level explanation of the application scope and functionalities.
Then, each user completed the following three tasks:
- T1
Create an application for retrieving all the photos of a user.
- T2
Create an application for retrieving all the photos created by all the friends of a user on a specific day.
- T3
Create an application allowing the user to select a photo and tag all friends that published at least a photo or a post in the same place where the photo was shot.
We ordered the tasks by difficulty: T1 is simple, T2 is medium, while T3 is the most difficult. For each task, we asked the users to plan the solution identifying an instance of the data that should be returned or manipulated by the application through the Facebook interface, in order to understand when problems with completing tasks are related to the identification of a solution for the specific task, or if the source is the FaceMashup UI. For T1, they should find their personal photos, for T2 they had to select a friend and find all his/her photos shot on 20 November 2014. For T3, they had to select one of their photos and tag at least a friend that shot a photo or wrote a post in the same place. While users performed the tasks, we tracked the time and whether the user completed it successfully or not.
Finally, the users completed a post-test questionnaire in two parts. The first contained a set of 15 questions for evaluating the overall usability of the tool with a 1 to 7 Likert scale. Ten questions were taken from the standard Software Usability Scale (SUS) [
16] questionnaire. The other five evaluated some application-specific aspects such as the user’s satisfaction for the development results and the perceived usefulness. The second part contained the assessment of the application features. We asked the user to mark the ones they found difficult to understand and use, explaining their answers through open ended questions.
All users completed T1 and T2 successfully. Only one user was not able to complete T3.
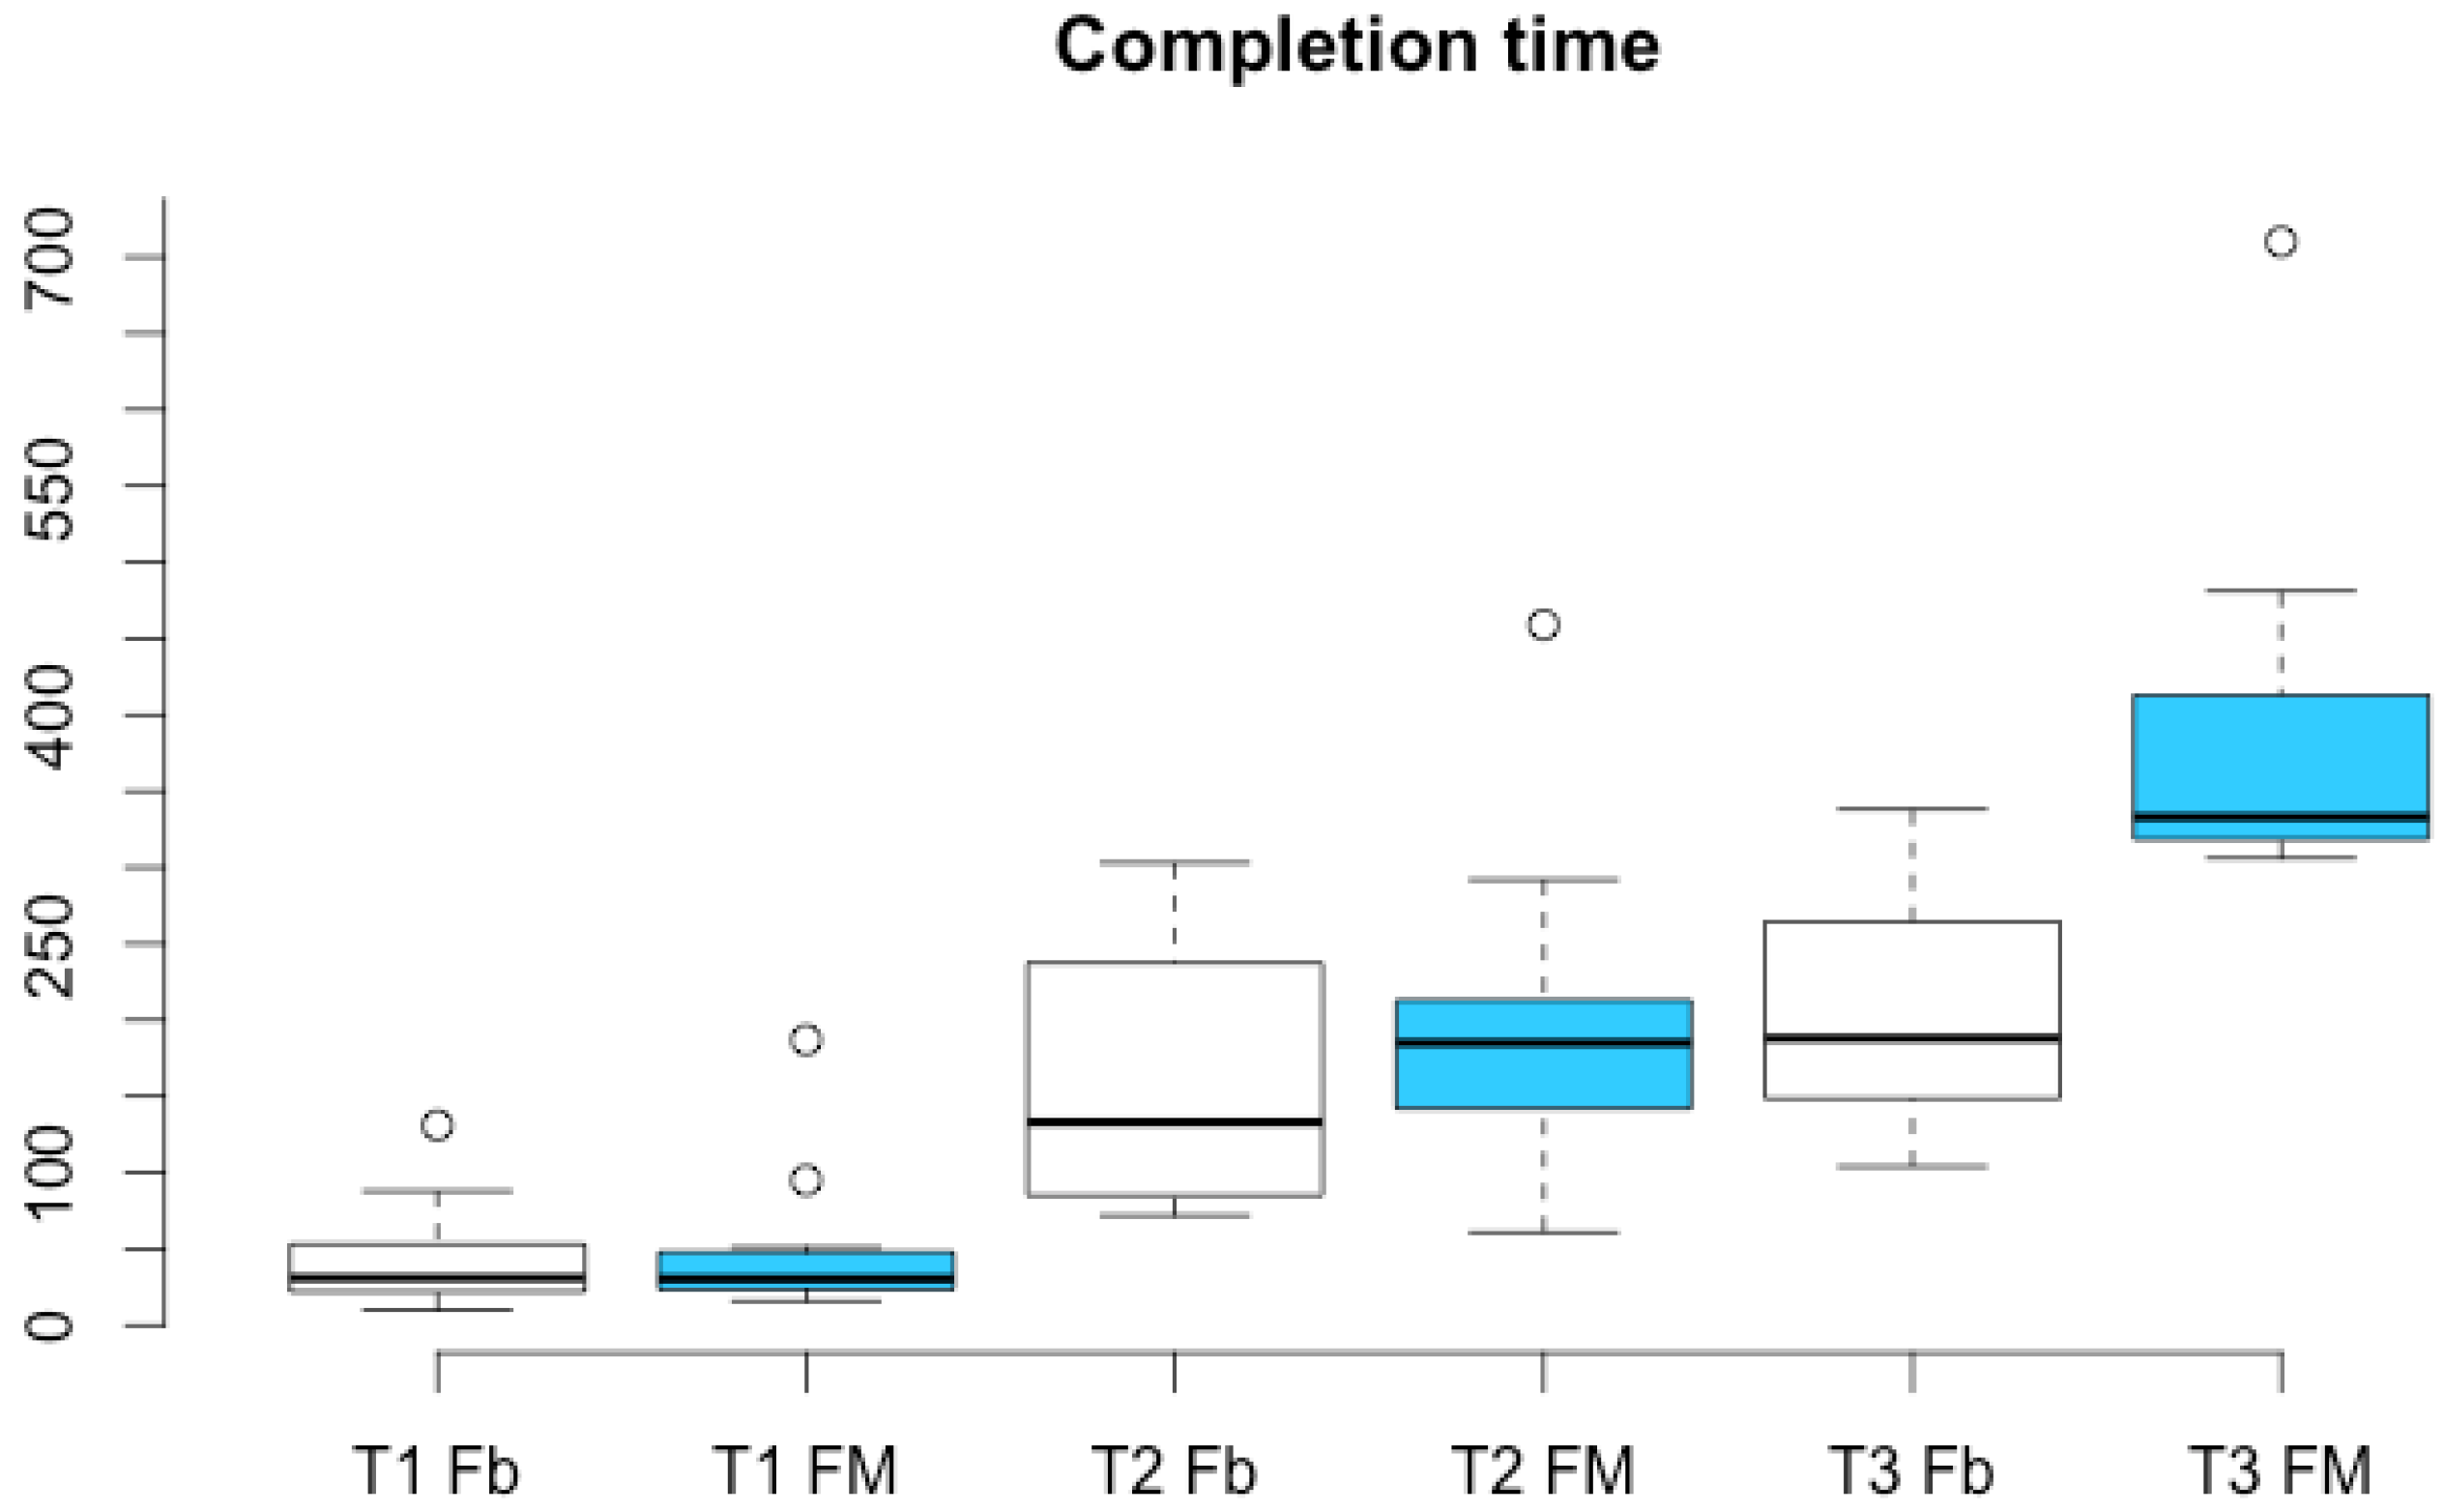
Figure 11 shows the completion time for all tasks, compared with the time needed for the pre-planning with the Facebook UI. For T1 and T2, the planning and the completion time are similar (respectively about one and three minutes). For T3, the planning took about 3.5 min (
s,
s), while the completion took about 6.5 min (
s,
s). From the observation of the users, we noticed that the most difficult part in this task was the combination of two data sources as input of the tagger widget. This was also the cause of failure for the only user that was not able to complete T3.
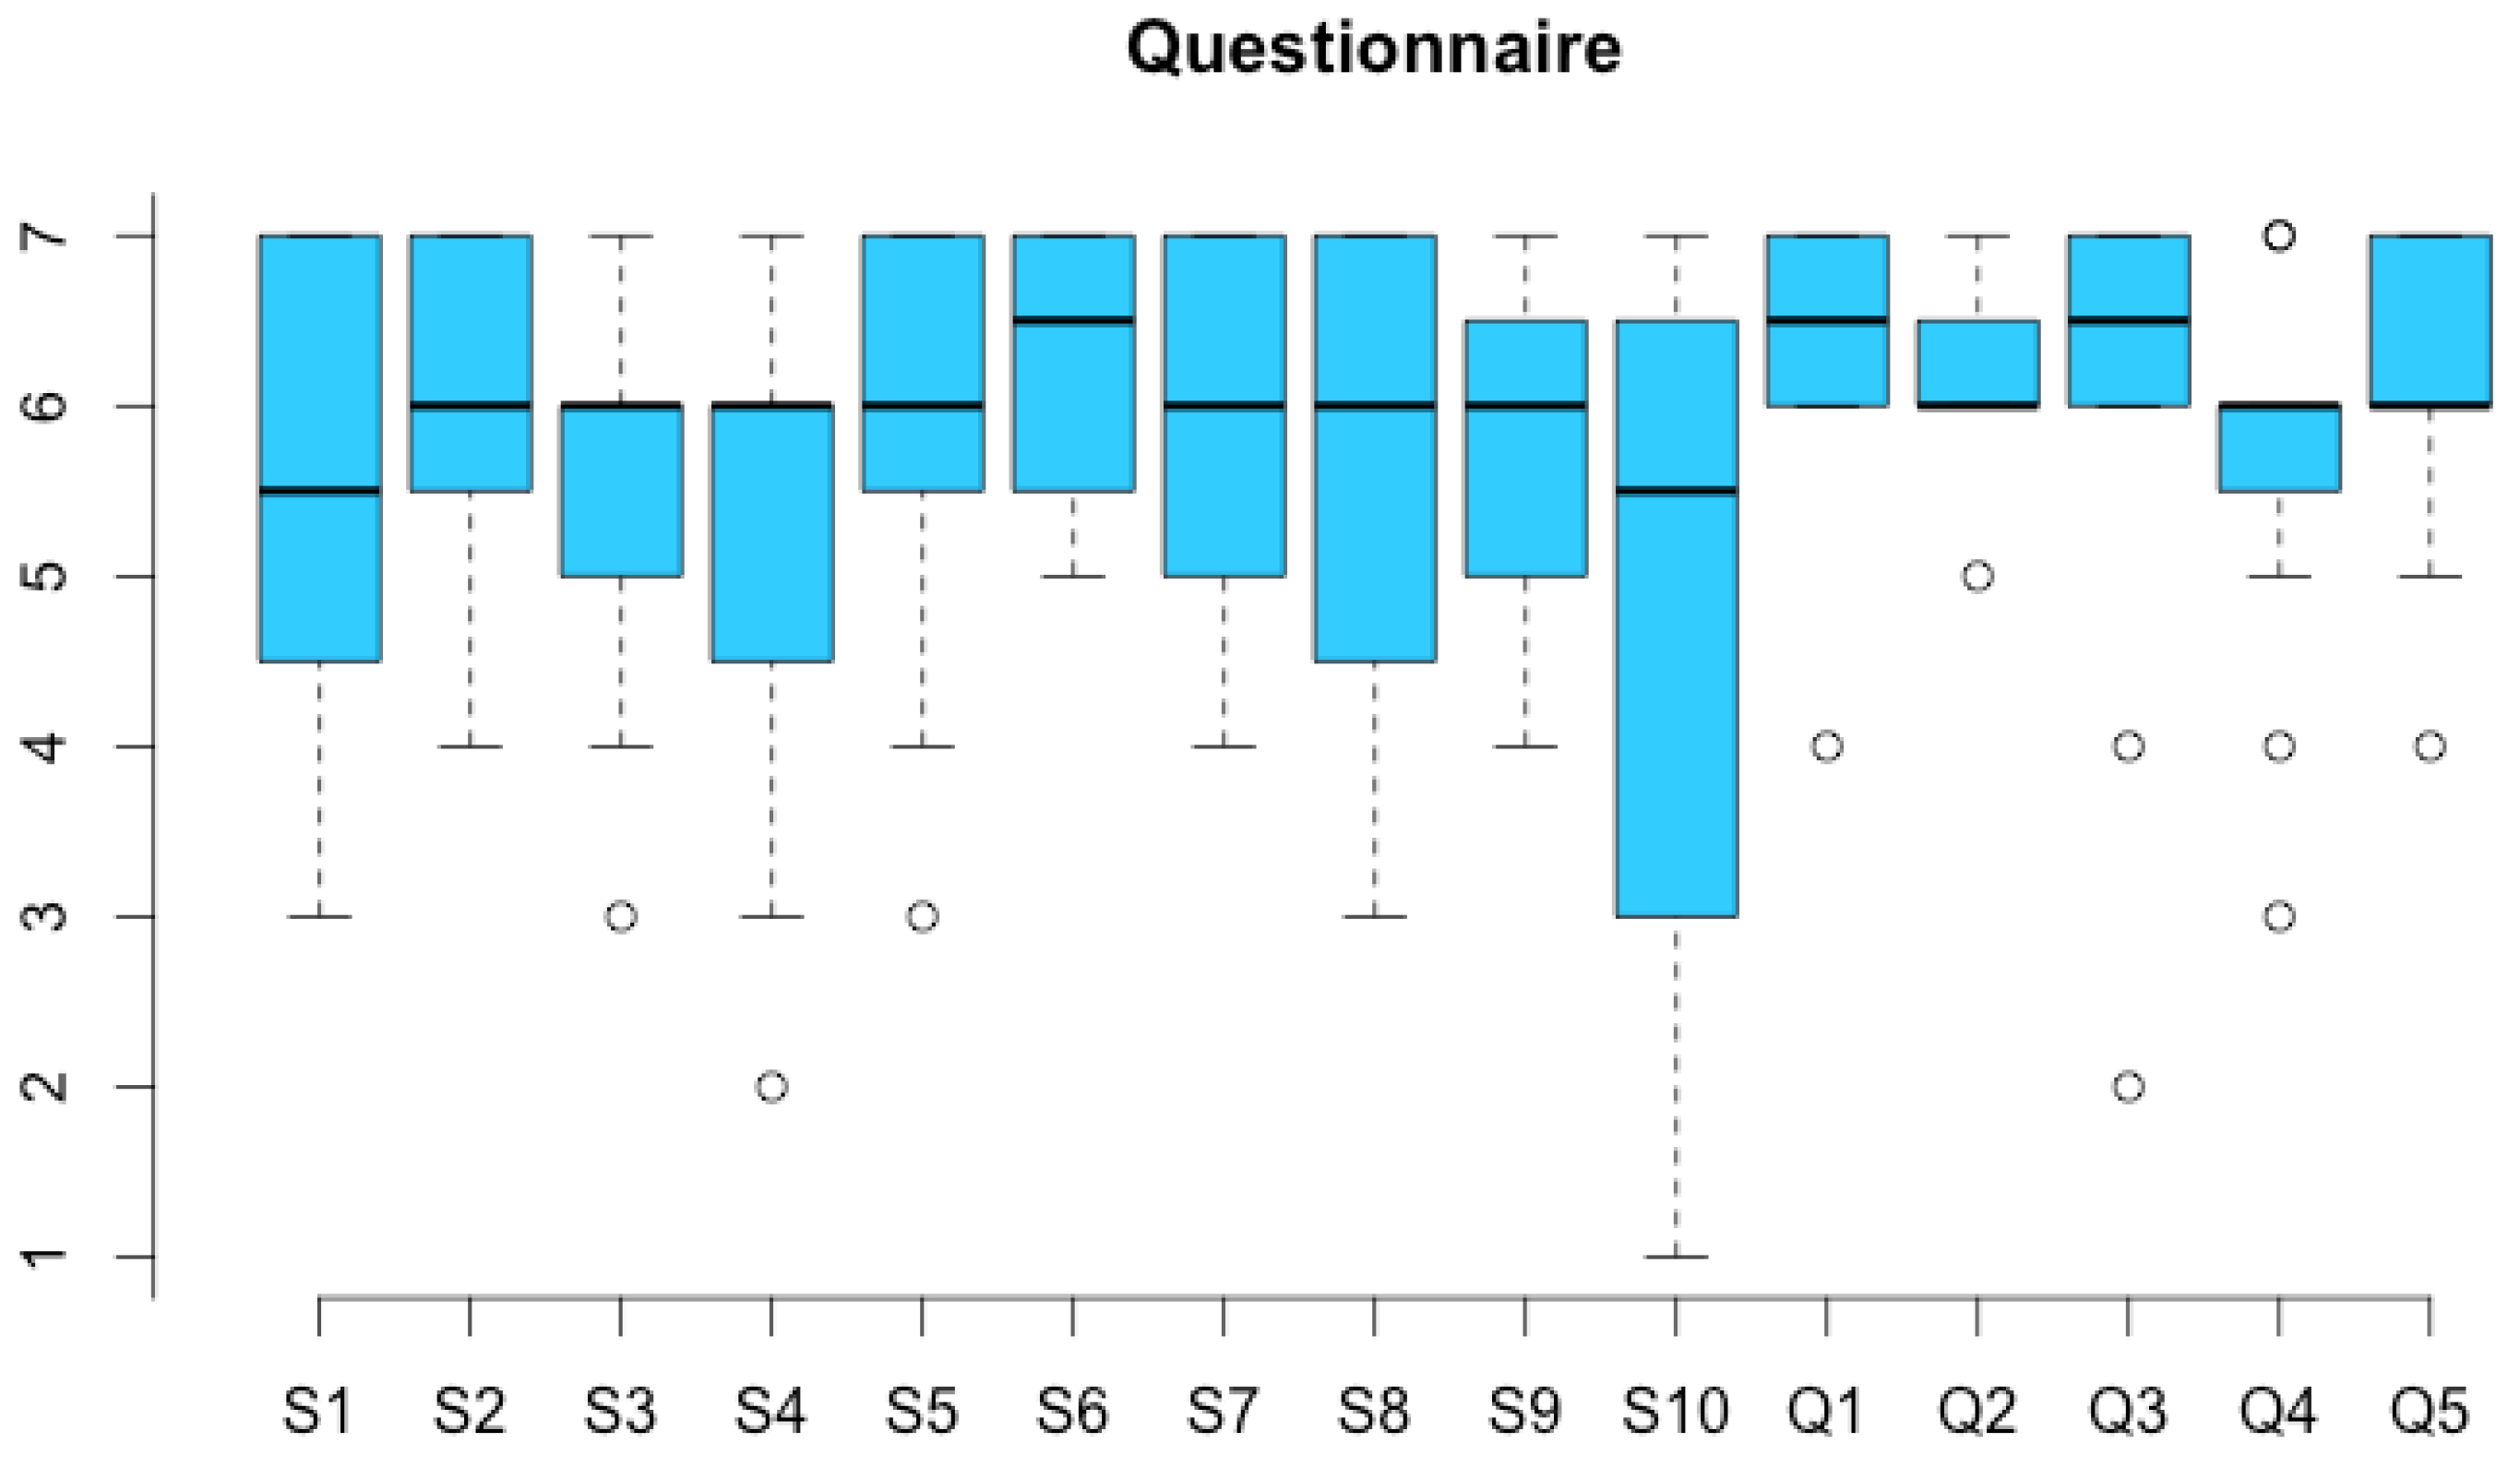
Figure 12 summarizes the results of the first part of the questionnaire. All questions received high mean ratings. The mean SUS [
16] score is good (
,
). We registered a high variability for question 10 of the SUS questionnaire, which means that different users did not feel immediately confident with the proposed programming mechanism. However, quoting user 8: “
at the beginning it was not clear what how a widget works, but after some attempts I was able to figure it out”. This means that the next version of the prototype should focus more on such a learning phase, providing support and help for users that are exploring the environment for learning. The additional five questions (Q1–Q5 in
Figure 12) show a good rating of FaceMashup in the following aspects: (Q1) satisfaction; (Q2) usefulness; (Q3) overall experience; (Q4) aesthetics and (Q5) completeness.
The second part of the questionnaire allows us to elaborate more on users’ difficulties. The most common misunderstanding was related the application concept: four users realized that their flow was general with respect to the data shown by the interface while completing the third task. Three users had difficulties in both understanding the drag and drop mechanism and in connecting widgets. One of them found it hard to identify the UI parts that can be used for the connection, while another one had difficulties in selecting them. One user found it difficult to associate the functionalities to the different widgets. Another had trouble in using the stickers for creating the application help, since she was not able to fill them in with useful information.
In summary, the users found the tool useful and they were able to complete the programming tasks, even the most difficult ones. The interface was able to support them appropriately in creating applications with social network data. However, the evaluation also highlighted the need for more effective help, in order to better convey the application concept to end-users. In addition, the environment should include more feedback and suggestions for the available actions, especially for the widget connections.
8. Conclusions
In this paper, we described the design and the implementation of FaceMashup, a tool that empowers social network users, supporting them in creating their own procedures for inspecting and controlling their data. The tool represents the Facebook graph data through a set of widgets containing the interface elements exploited in the social network application. Users can drag and drop the widget UI elements for reusing the output of a widget as input for another one, or in order to filter some search results. Finally, the tool allows them to perform a set of actions on the retrieved data, through the action widgets. Once the user specified all the connections, a change in the data provided by one widget (e.g., the user selects a different location) triggers the update of whole application, allowing the reuse of the procedure more than once and by more than one user.
The user test results highlighted both a good acceptance of the tool and a high completion rate even for complex tasks. More work is needed for providing a better user guidance during the widget connection, especially for identifying and selecting the UI parts that can be exploited for connecting widgets. In this regard, we will work on exploiting recommendation systems for providing suggestions on how to combine or filter data, according to the actions performed in similar applications.
A limitation of the current tool is that of considering Facebook as the only data source. Indeed, one of the possible use cases for EUD environments on social network data is allowing the user to cross combine sources from different social networks in order to perform searches and actions in all of them. From an implementation point of view, it would be easy to add more data sources, since it would require only adding other data readers and writers to the existing back-end logic model. However, from the user point of view, there would be the need to study how to represent the different sources and how to show aggregated results, in order to both keep the tool simple and provide users with a full control of the action effects. In addition, we want to extend this work in order to create a mobile version of the tool, considering that, nowadays, we have more social network access from mobiles with respect to desktop devices. This would require a different technique for connecting widgets together with an efficient and effective visualization of the overall application flow.


