1. Introduction
Nowadays, network security systems require new techniques or methodologies to detect and avoid threats from intruders. An intruder tries to find the way to enter and explore a system with the maximum possible access [
1]. Intrusion detection systems (IDS) are designed to recognize intrusion attempts in order to block attacks or produce alerts to be analyzed by an intelligent instance. According to the detection method, IDS are categorized into anomaly detection and misuse detection [
2,
3,
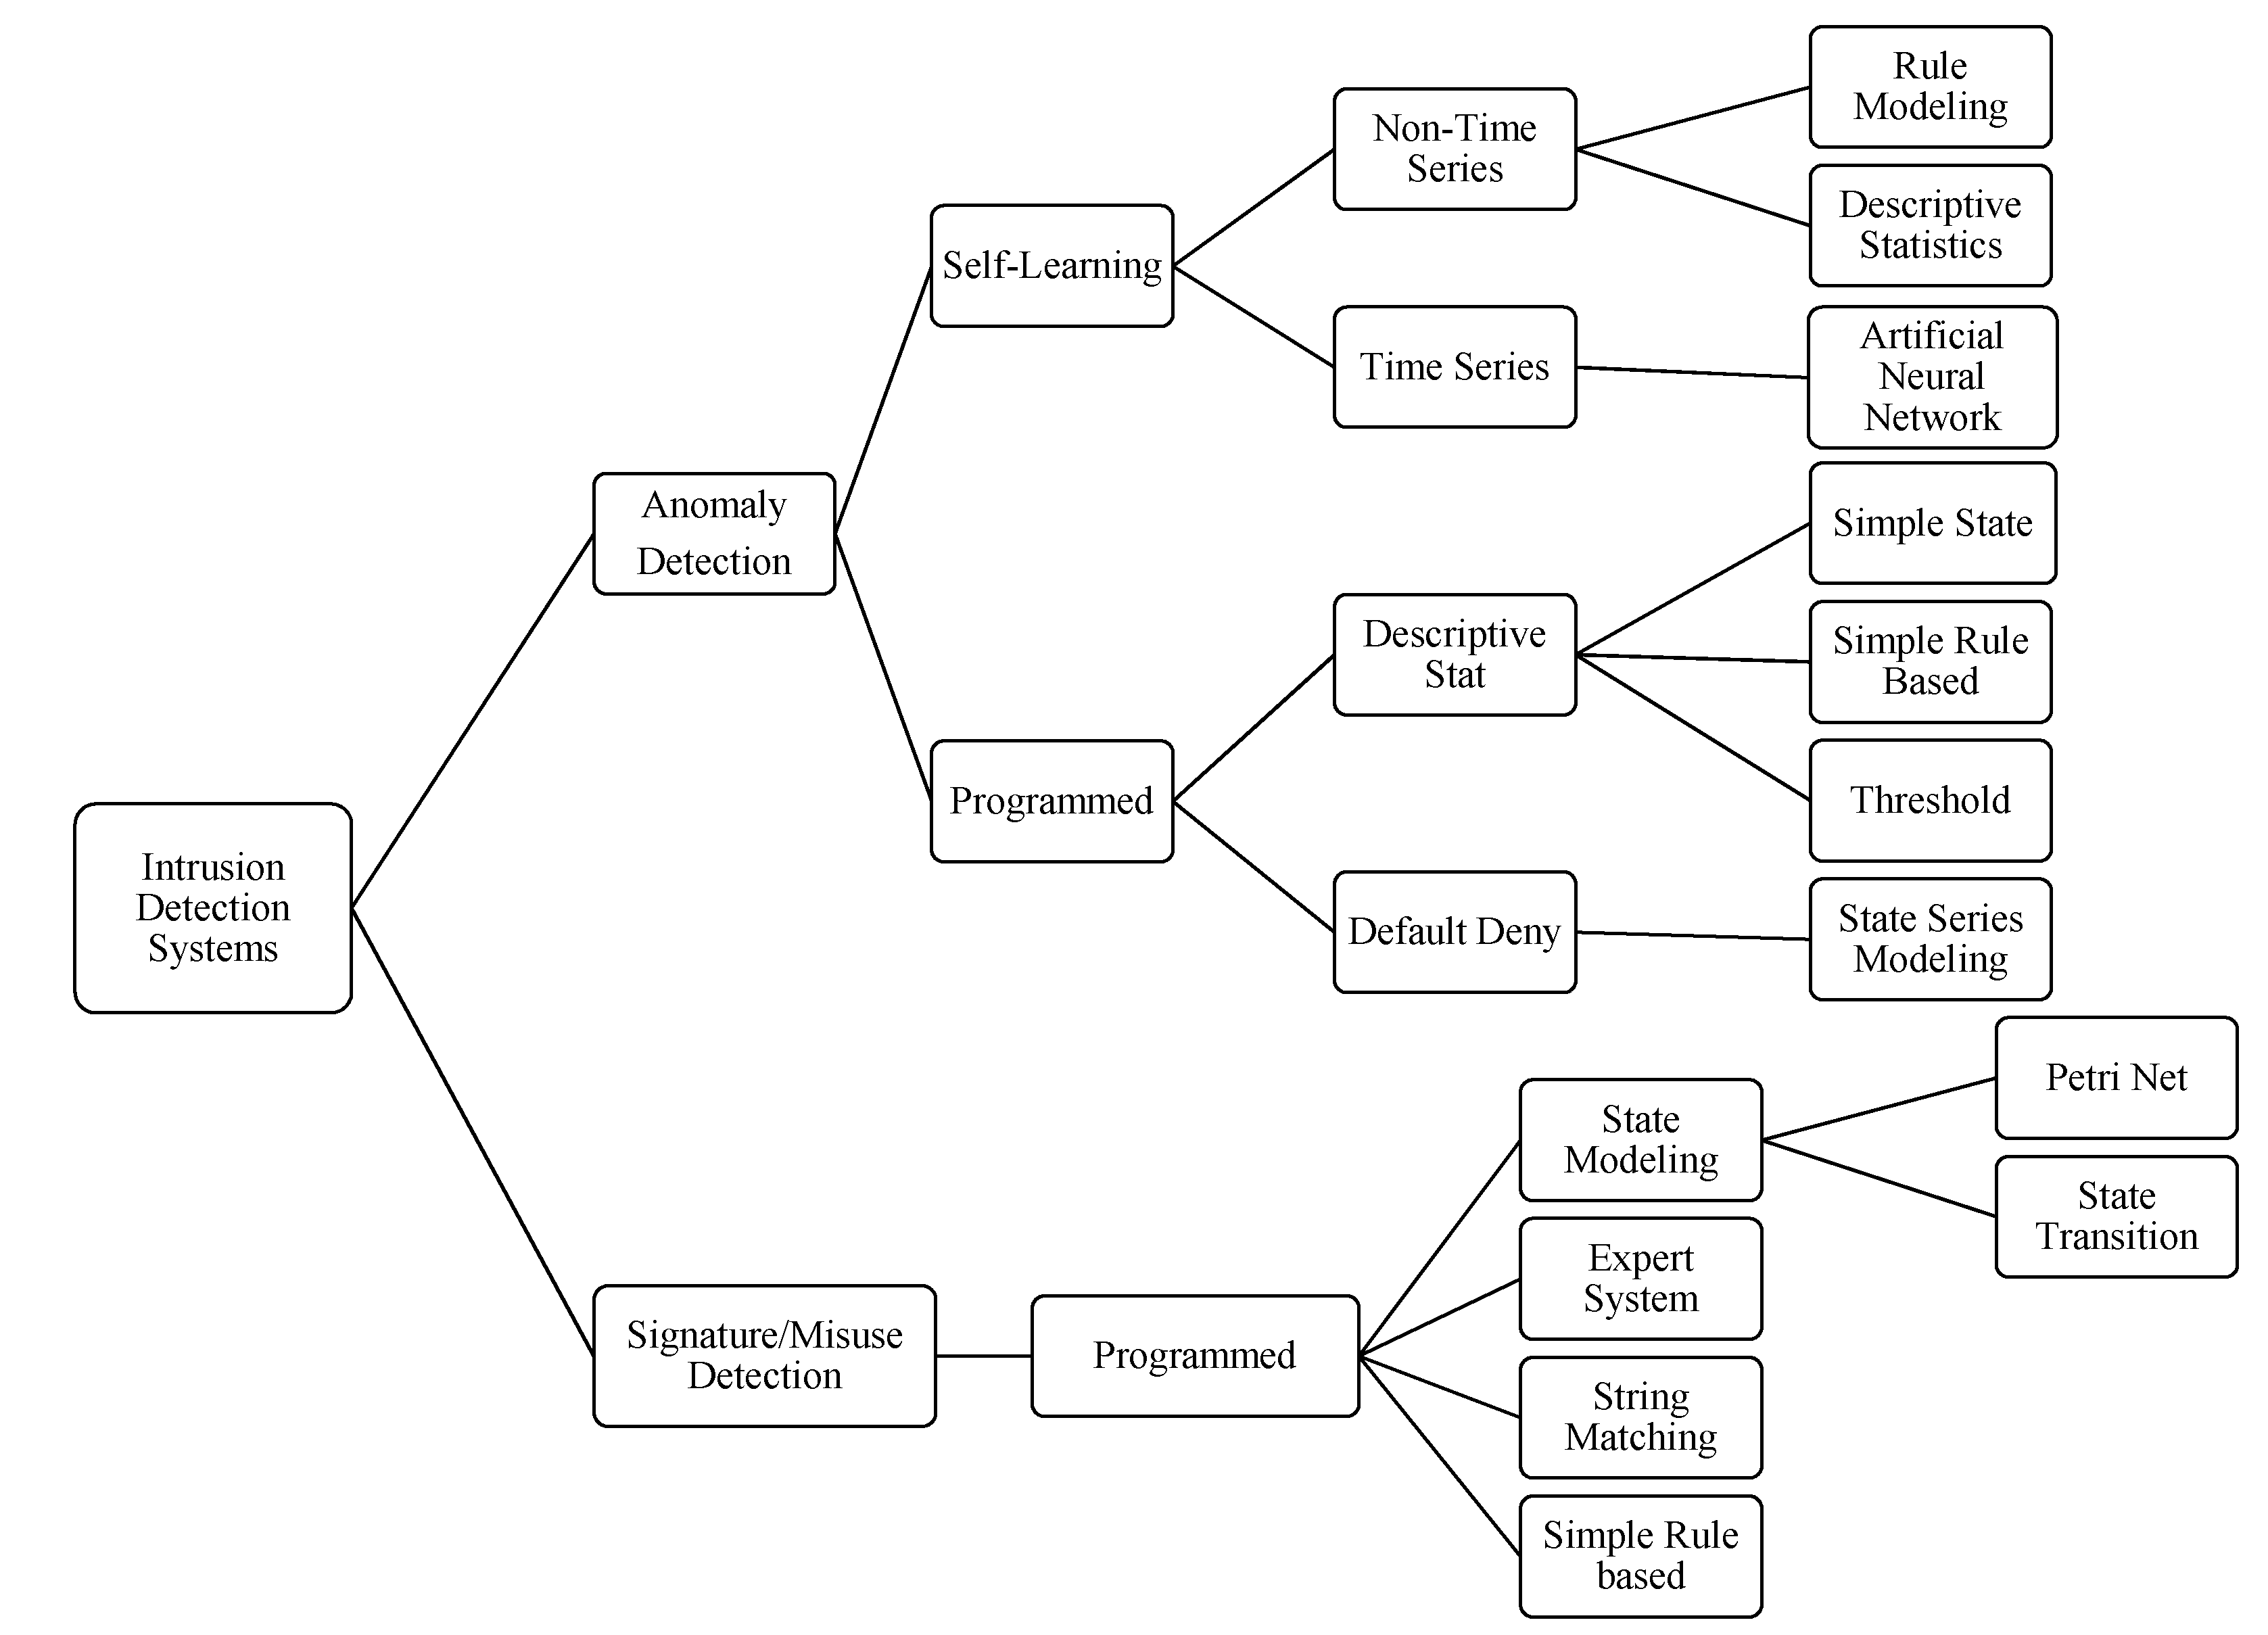
4]. Although this classification is not recent, in general, the same categorization is accepted to classify IDS. For example, in 2000, Stefan Axelsson presented an IDS taxonomy to classify some research approaches, as can be seen in
Figure 1 [
5], among many other taxonomies that have been proposed.
Figure 1.
Intrusion detection system taxonomy.
Figure 1.
Intrusion detection system taxonomy.
In 2012, Liao
et al. worked in the IDS taxonomy based on the Computer Emergency Response Team (CERT) statistics report of the increment of the amount of intrusions year-by-year [
6]. They classified the intrusion detection approaches into five subcategories: statistics based, pattern based, rule based, state based and heuristic based. Finally, they concluded that the pattern-based approach is effective at identifying unknown and hidden attacks.
In recent years, anomaly detection IDS have been the source of great interest because of their capabilities for zero-day attack detection and self-learning. Anomaly detection is composed of a set of processes to identify differences between normal activities by comparing observed events with behavioral deviations in a network. The IDS analysis scheme can build profiles according to selected features from knowledge databases [
7]. Those profiles are created by selecting, analyzing and ordering the behavioral characteristics of the computer network, such as connections, virtual ports, user profiles, among others, over a defined time period in normal operation [
8].
According to the data source and connectivity properties, IDS are classified into two types, network intrusion detection systems (NIDS) and host intrusion detection systems (HIDS) [
3,
9]. Although many hybrid approaches have been proposed, commercial network security implementations have deployed NIDS because they are more efficient against malware attacks than HIDS [
10]. An NIDS has a sensor that is activated in promiscuous mode to capture all data traffic in a network and stores the attack patterns in a database [
11].
For many years, IDS have been widely deployed in secure network infrastructures as the first line of defense against security threats and intruders. As early as 1985, Denning and Neumann [
12] suggested a basic model of IDS that included system design and activity profiles. Nowadays, new threats are born within every hour, and the time between attack deployment and detection is uncertain. Most of these attacks are Internet-based events that are triggered by activity from inside or even outside of the computer network.
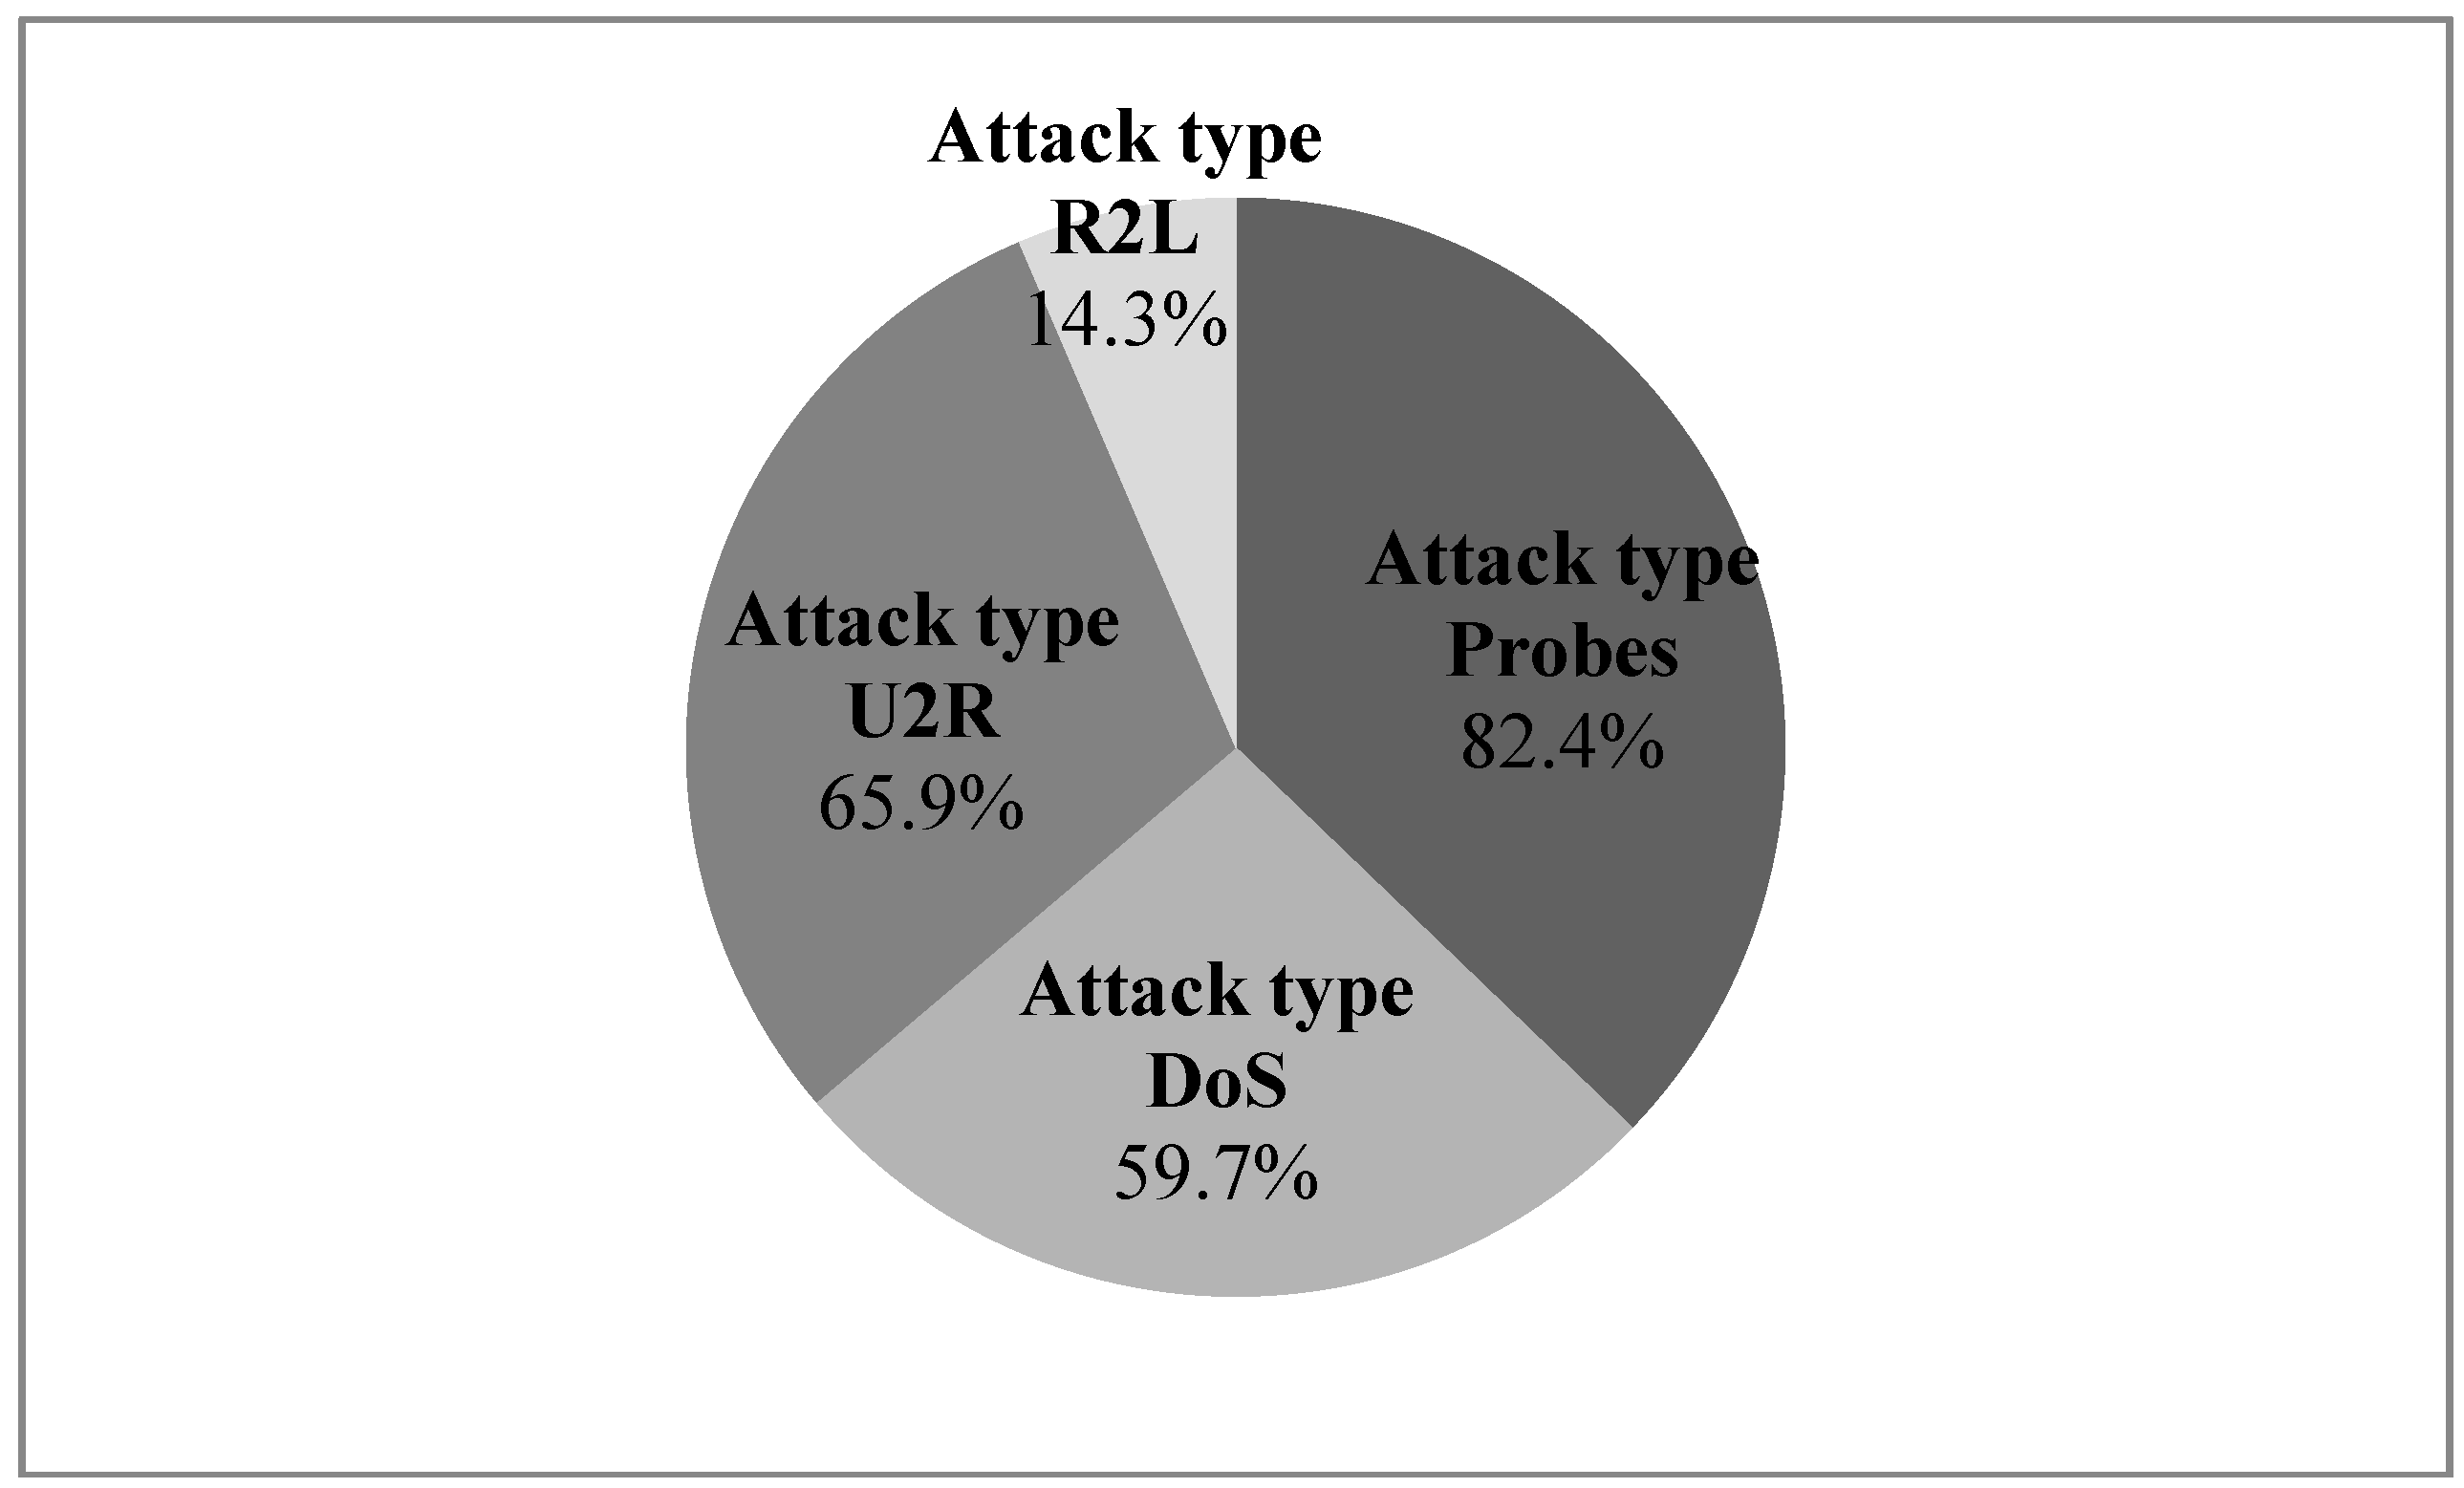
For some approaches, attacks are classified into four categories: denial of services, remote to local (R2L), user to root (U2R) and probes [
13,
14]. Tang and Cao in 2009 proposed a new approach to discover novel attacks, which aims at machine learning implementation to demonstrate the high performance against common attacks, with detectors obtained with artificial neural networks (ANN) [
15]. The portion of analyzed attacks can be seen in
Figure 2.
Figure 2.
The portion of analyzed attacks with the ANN approach [
15].
Figure 2.
The portion of analyzed attacks with the ANN approach [
15].
In 2003, Lazarevic
et al. evaluated anomaly detection techniques in NIDS with DARPA datasets to analyze the unsolved problems for IDS design and the complexity of deploying machine learning techniques with real network data [
16]. They concluded that with the DARPA dataset, it is possible to achieve an effectiveness of up to 74% to detect attacks in multiple connections and a detection rate of 56% in a single connection, which is obviously not as useful today. Subsequently, Zhao
et al. in 2010 conducted an analysis to design IDS based on data mining methods in order to identify the advantages and disadvantages of using hybrid systems with misuse detection and anomaly detection techniques. They concluded that the combination of intrusion detection engines is efficient to detect known and unknown threats, but the design of an accurate system is more complex [
1].
Another important issue is the selection of the relevant features, as Olusola
et al. identified in 2010 [
17]. They evaluated the relevance of feature selection for IDS design along with data mining and machine learning methods. With most of these approaches, when the proposals are implemented in real network scenarios, the results had failed for false positive rates or even detection results.
Most of the anomaly detection approaches have deployed similar steps:
- (1)
Acquire or use knowledge databases for traffic behavior in network scenarios, such as KDD99, CAIDA or CRAWDAD, among others, with samples of normal and under attack behavior.
- (2)
Select the best representative features.
- (3)
Reduce the search space by diminishing redundant information.
- (4)
Apply a machine learning method to generate detectors.
Detectors must be applied in network scenarios in order to detect threats for real time traffic, but, when they are applied in real scenarios, the results for false positives and the detection rates are not predictable. This is in part because the behavior of a network depends on conditions, such as applications, servers or even telecommunication architectures, and the network where the IDS is installed does not have the same behavior as that in which the detector was trained. The main goal of this paper is to show the statistical differences of the performance between the same detectors in dissimilar network scenarios.
2. Materials and Methods
The applied method began by acquiring the traffic information for real scenarios to then select the correct features and to filter them to reduce the search space. ANN is the machine learning method deployed to generate detectors. The system was trained based on a real network scenario, and the obtained ANN was tested for four different network scenarios with a dissimilar network behavior. Insider attacks were deployed to calculate the performance for detection and false positive rates.
2.1. Features Selection
The features are acquired with the Spleen application [
18], and the structure of the variables are similar to KDD99 [
19]. It is important to make clear that neither the database nor the same number of features of KDD99 were used, just its structure. The dataset is acquired from normal traffic and under attack samples and finally labeled by the application. The data is captured from the network traffic samples during peak hours.
Principal component analysis (PCA) was the method selected to extract the attributes, because it is a useful technique for very large-dimensional datasets compared to other analysis tools that are limited to low-dimensional datasets [
20]. The relevant advantage of PCA for anomaly detection is its capacity to identify high and low values of the features with high accuracy [
21]. In this work, PCA is employed for the feature selection phase, in order to reduce the dimensionality in the feature space. The method has been employed in previous approaches for feature selection for IDSs, specifically with KDD, NSL-KDD and CAIDA, among others [
22,
23,
24]. In the work of Kuchimanchi,
et al. [
24], they employed the critical eigenvalue test. The test recommends using the principal components whose eigenvalues exceed the threshold
τe = d0.6/15, where
d is the dimension of the dataset before the feature selection process. With our dataset, the threshold is
τe = 0.7136. The rest of the features are assumed to contain redundancy and noise. In previous works, the significant features of KDD were calculated for 19 of the original 42, but we had to calculate the relevant features again, because our dataset is different from KDD, as was stated before.
With the selected features, it is necessary to learn the search space with a machine learning technique. Many machine learning approaches, such as genetic algorithms (GA), support vector machines (SVM), artificial immune systems (AIS), decision trees or ANN, among others, have been applied to anomaly detection, and although it is possible to find differences regarding the detection results between those methods, their effectiveness is not so different, so the machine learning technique employed in this work is ANN [
25], because it is a well-known Machine Learning (ML) method with proven performance for anomaly detection and there are many approaches to compare with our results [
2,
5,
9,
10,
21,
26].
The basic attributes are analyzed in different network scenarios as unusual TCP flags, the number of out of sequence packets and the average of the payload size [
27]. The number of connections and the percentage of connections are statistical features based on the host checking the number of packets with the optimal connection during the three-way hand-shake process and synchronization. Other features are based on the behavior change detector (BCD) as shown in
Table 1. The advantage of BCD features for IDS is their capacity to detect anomaly changes in events during connection [
28,
29,
30].
The features are shown in lines through an array of
m trainings and
n features. Datasets are generated in comma separated value (CSV) files, and they contain 52 features. The selected features are numeric and the non-selected features are represented as a null value with the “$” symbol. Null fields for the non-selected features are then simplified into a new variable. The connections structure is represented in the next matrix. The feature representation is based on the number of connections and the number of features.
The main variables are a combination of the original features stored in a new matrix that represents the network profiles. Network scenarios have different features and data traffic, according to frequent services, virtual ports, traffic requests, the number of users, among others.
2.2. Network Scenarios
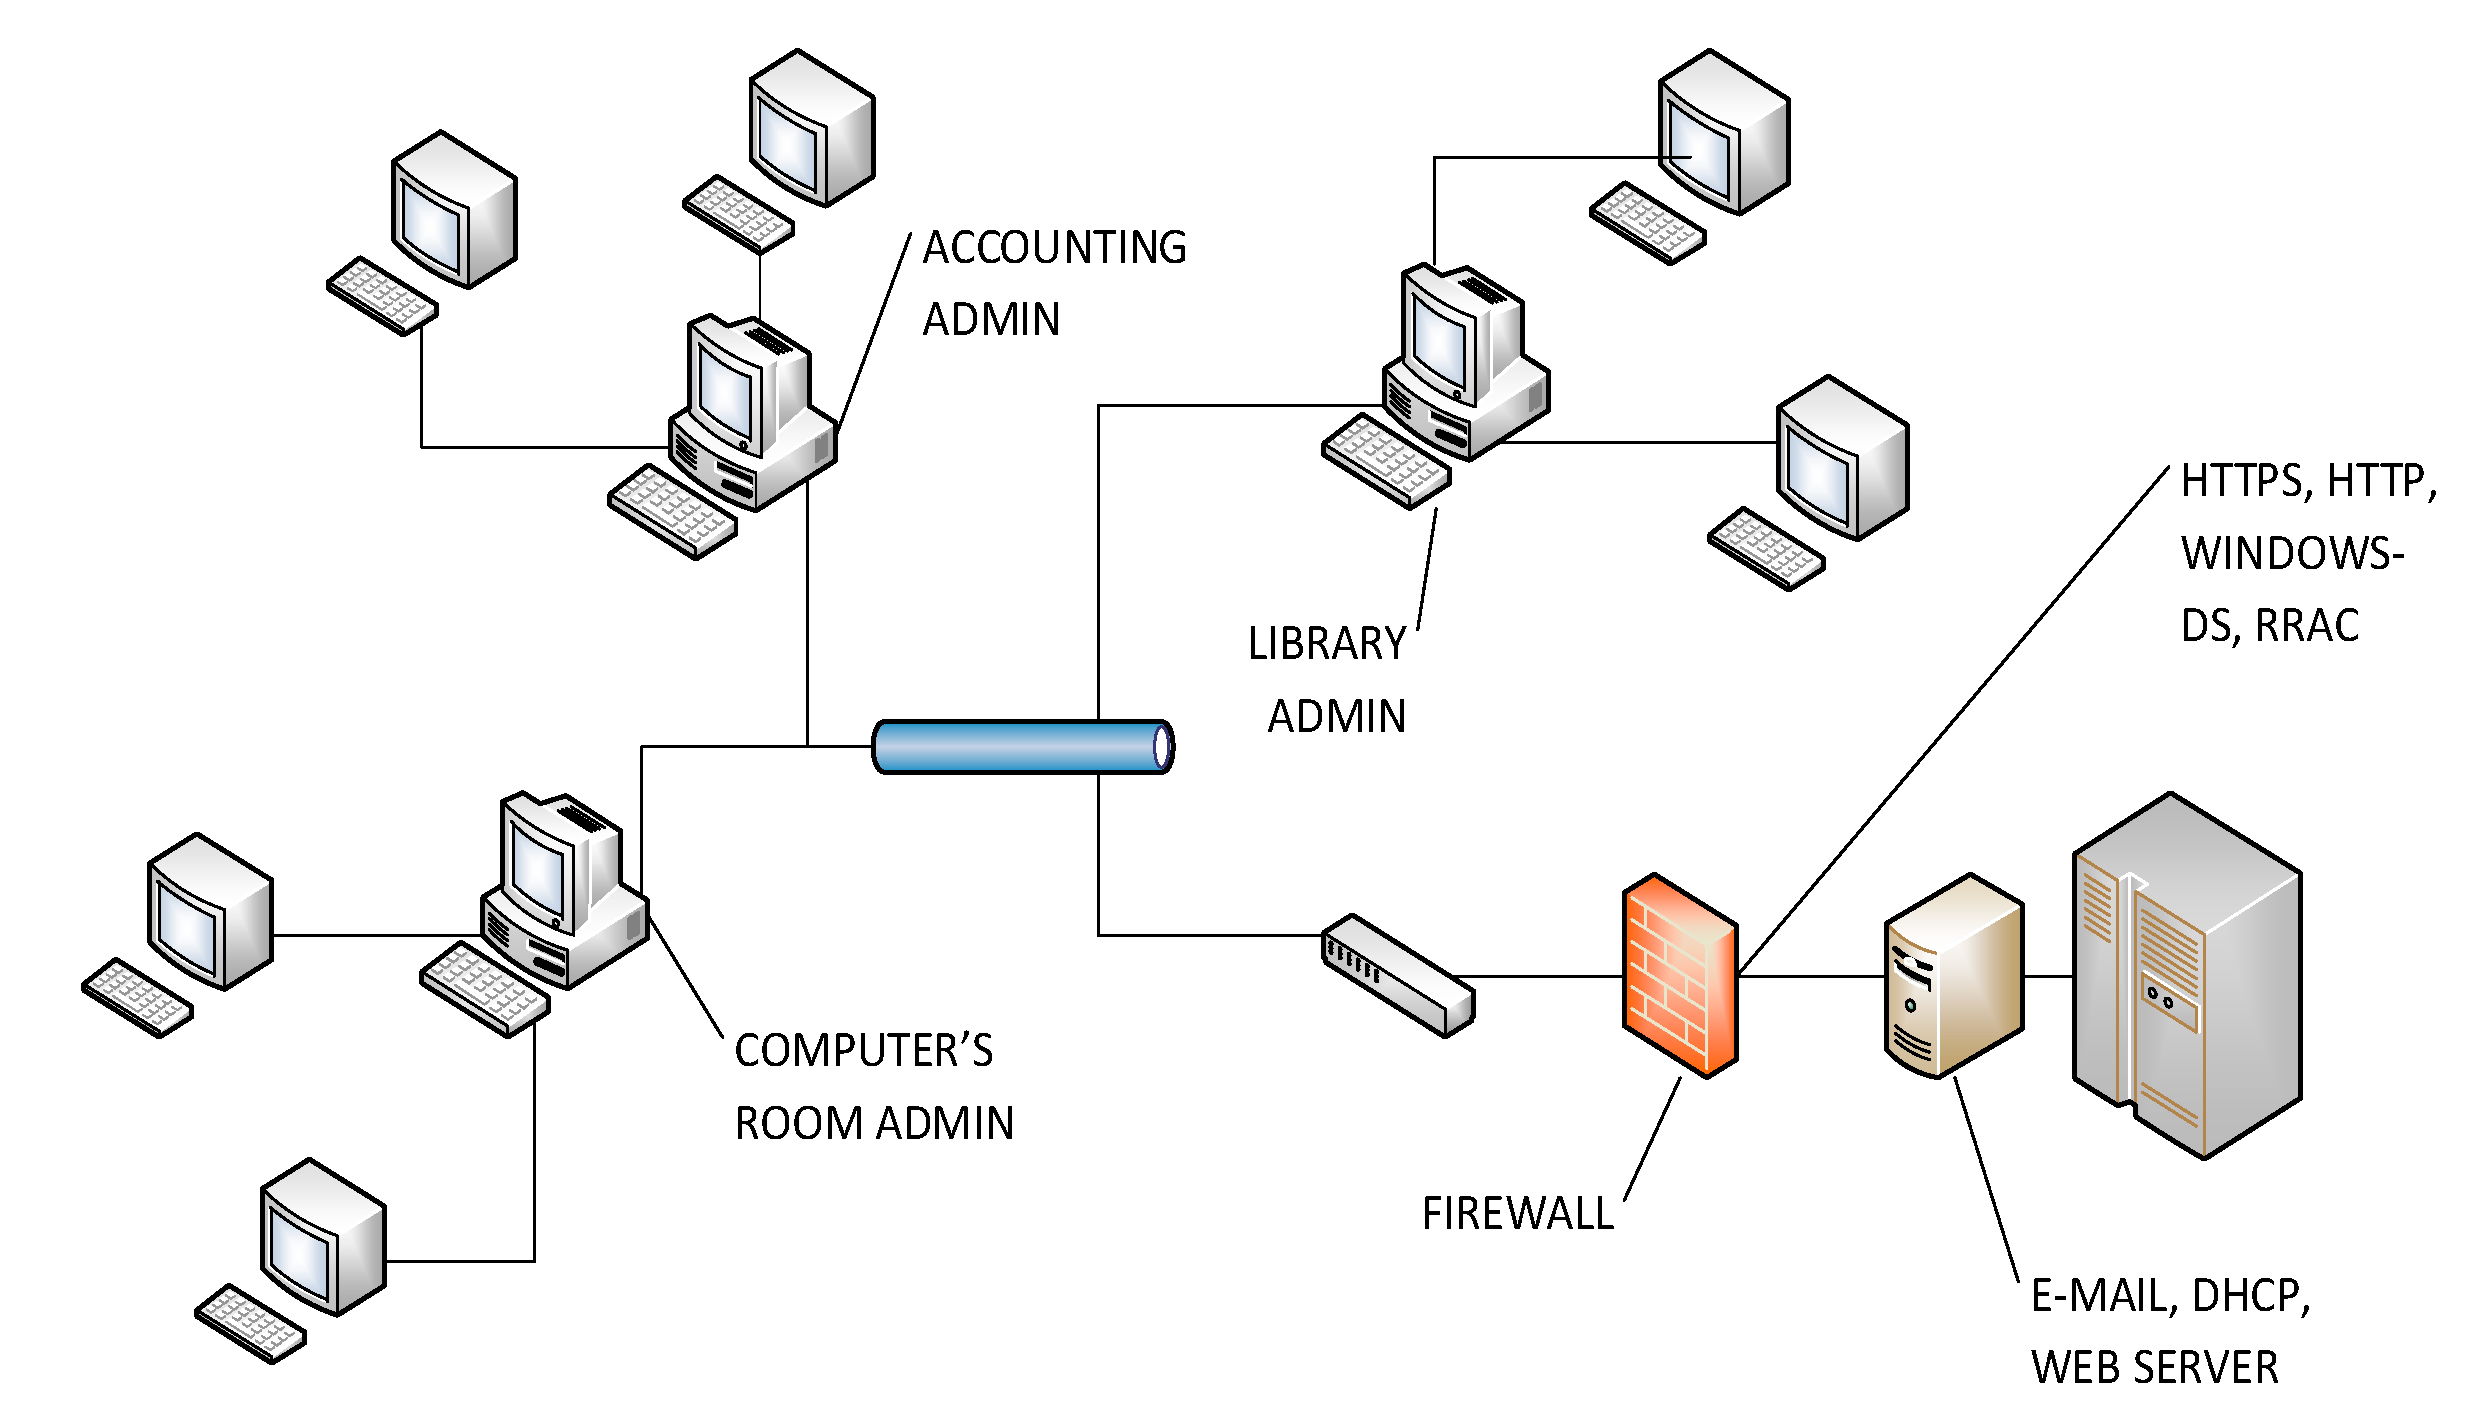
Four network scenarios were selected for the deployed detectors. Tests were made during working hours and at the same time periods. The first scenario is a wireless network in a public segment. The second scenario is a wired network in a private environment, mostly with World Wide Web traffic. The third segment is a server farm with a secure configuration. The last scenario is a LAN in a militarized zone (MZ) with VoIP and streaming services.
2.2.1. Wireless Scenario
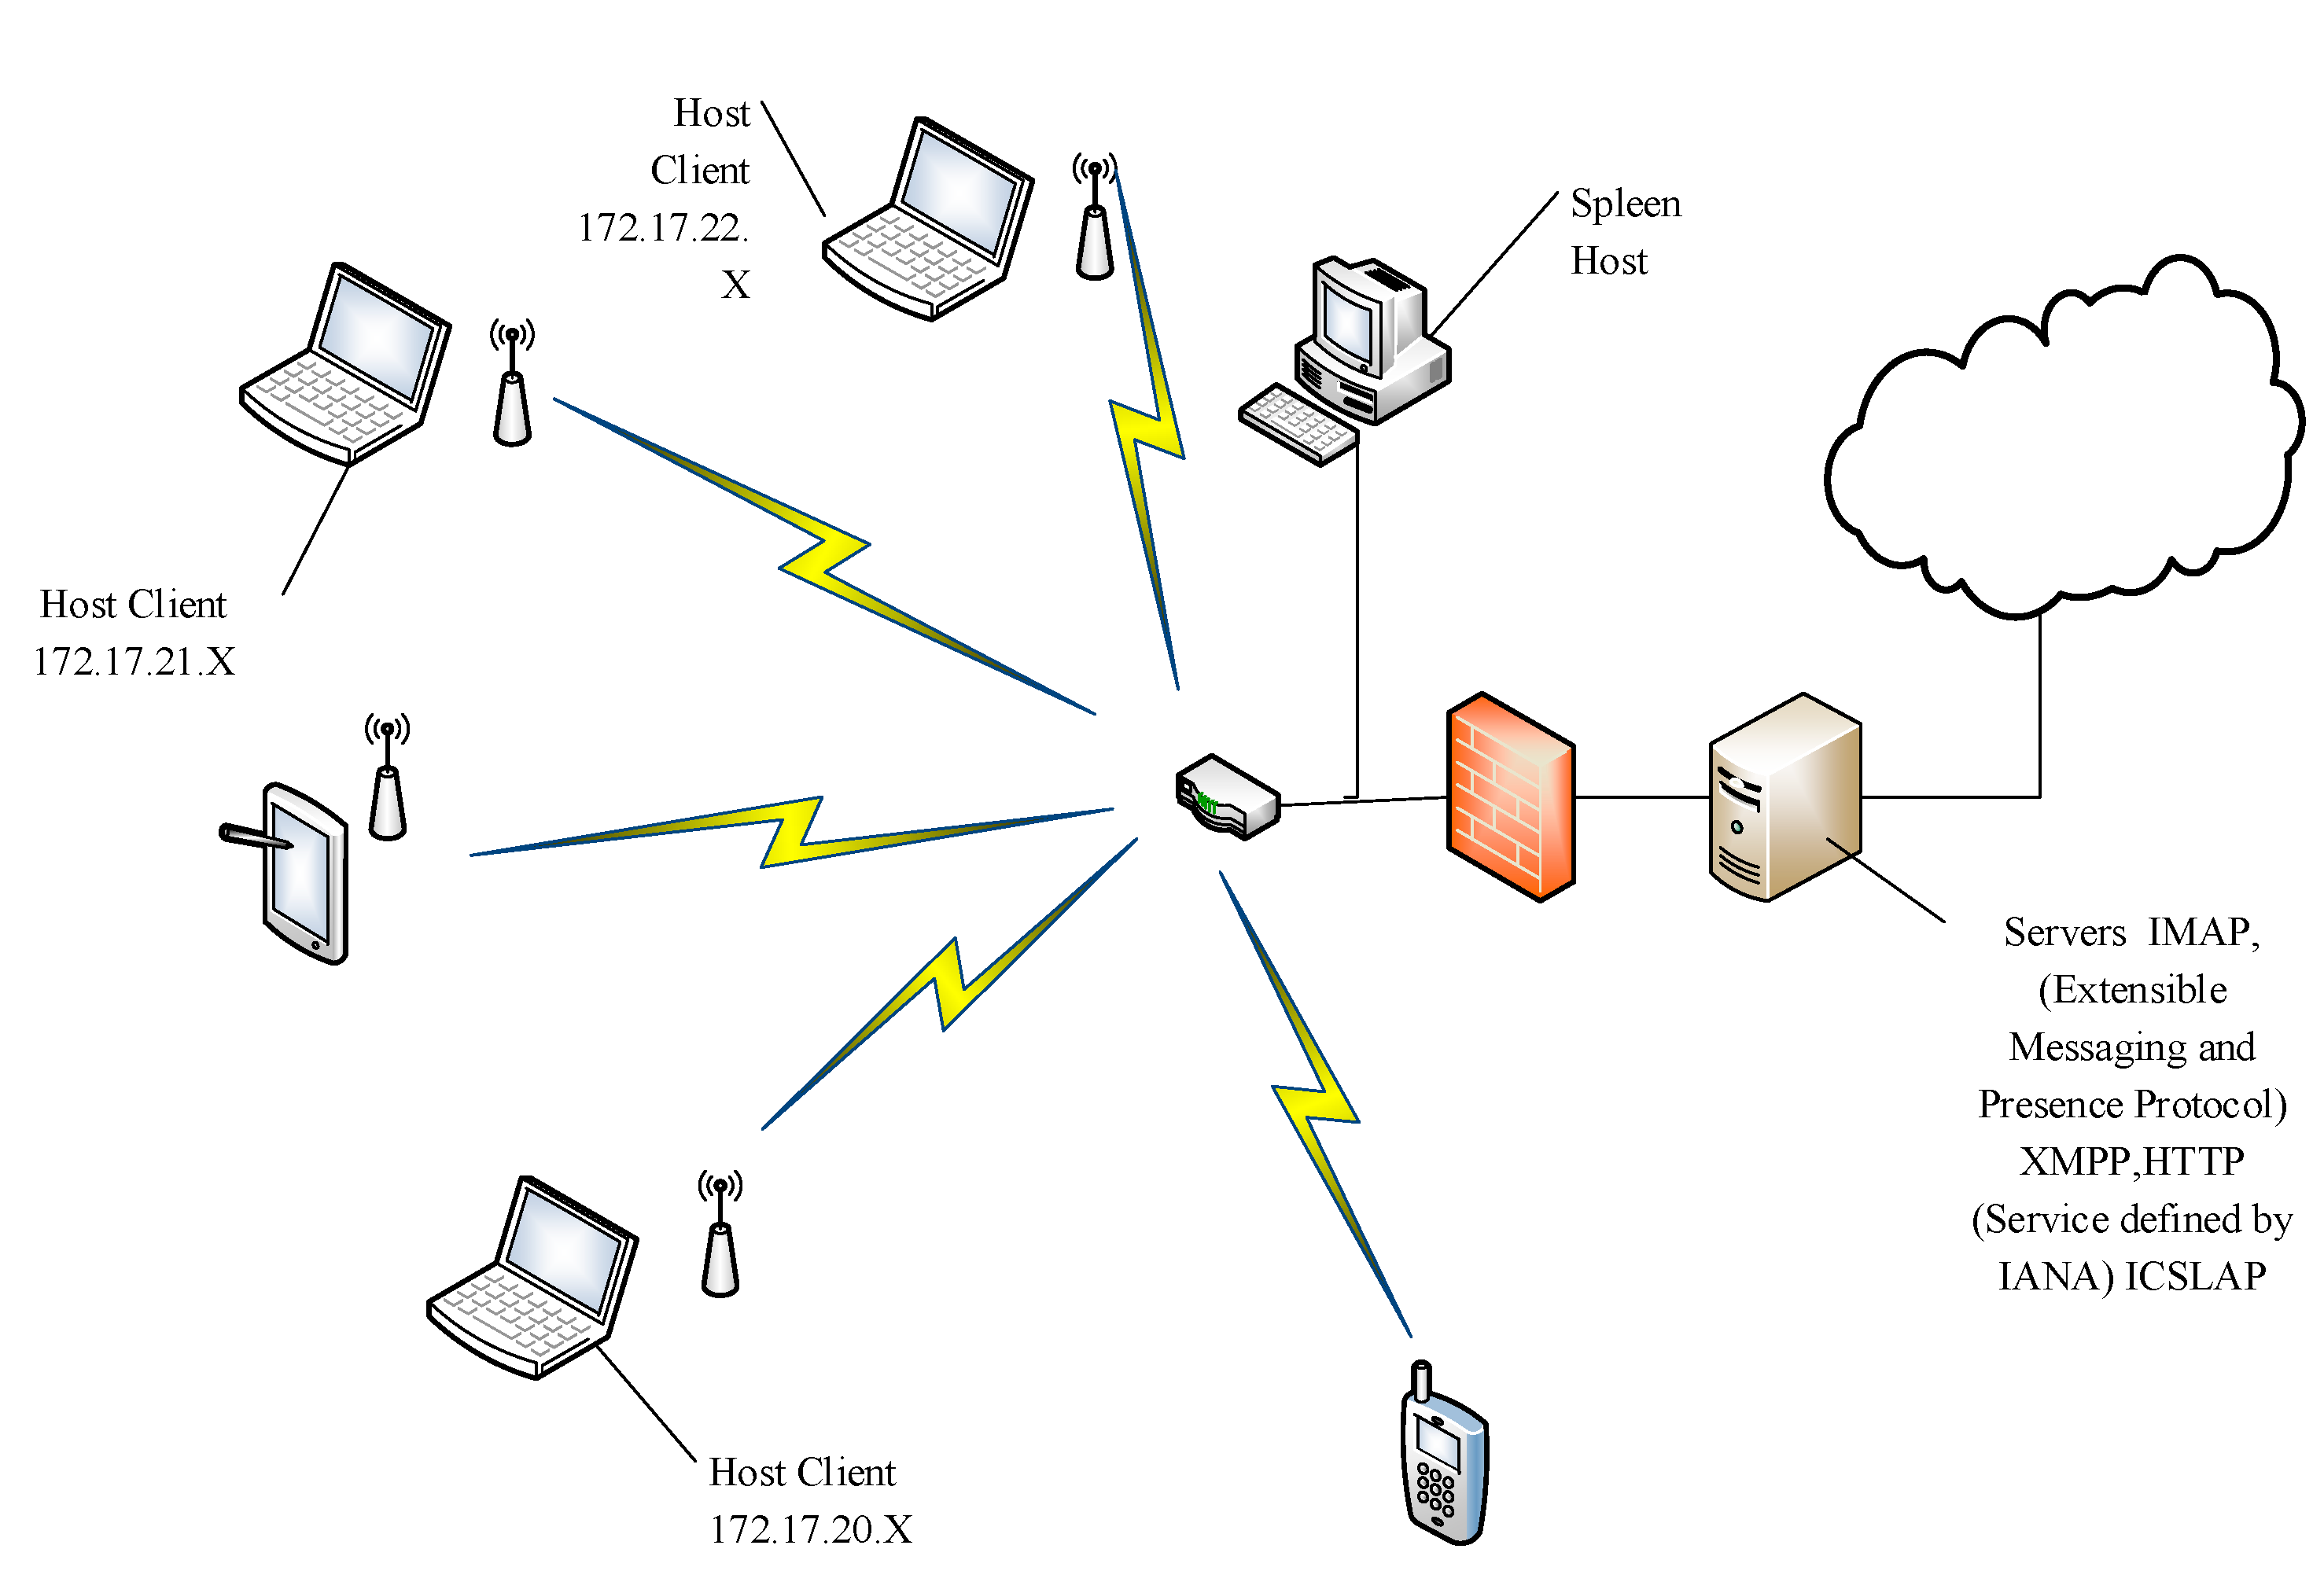
e architecture of the wireless network is presented in
Figure 3. The most frequent identified services were e-mail, streaming, data and audio transmission through ports 80, 2869, 993 and 5222. There were 100,023 connections during the test time, which is equivalent to around 300 users. Datasets were collected in 51 buffers, and there were 58,679 closed connections.
Table 1.
Behavior change detector features description.
Table 1.
Behavior change detector features description.
| Feature | Description |
|---|
| Unusual TCP flags | Boolean variable to check the connection when it has received packets with an unusual TCP flag configuration. |
| Number of out of sequence packets | Number of packets that arrive with delay and change the message’s order (latency). |
| Average of the payload size in bytes | This is the average size of the real message without the header. Payload size is shown in an integer variable represented in bytes series. The result sizes shown depend on services requested and connections active. |
| Count of the connections from this client in the last connection | This feature has control of the connections from the specific host-client only in the last capture or data analysis. This feature is an integer variable. |
| Percentage of connections from the current client with the States S0 and S1 | The S0 state is a configuration to check an initial Synchronization (SYN), but after, there are no reports of a server request. The S1 state is the configuration of the three-way hand-shake connection, but does not show more packets between the network traffic. |
| Percentage of connections from the current client to the current host | This is a feature shown in a double variable, because it represents a percentage of the connections from the current client that has the same host and request services. |
| Percentage of connections to the current host with State S0 and others | The percentage of connections that has attempted connecting with the server, but has not received answer. Then, the same sends another package with a new attempt to receive an answer. |
| Difference between the number of connections to the current host | Represents the connections rejected from the host. The host rejected difference is compared with the ACK package request that has this host. |
| Difference between the number of connections to the current service | Represents the connections rejected, but depends on the service requested. The service rejected difference is compared for the current service approved against requested services. |
| Unanswered host count | This feature is shown in an integer variable based on the number of connections unanswered by the host. It is based on the number of packages that have not arrived to the destination. |
| Unanswered service count | This feature is shown in an integer variable for the number of connections unanswered according to the services request. It is based on the number of packages that have not arrived to the destination. |
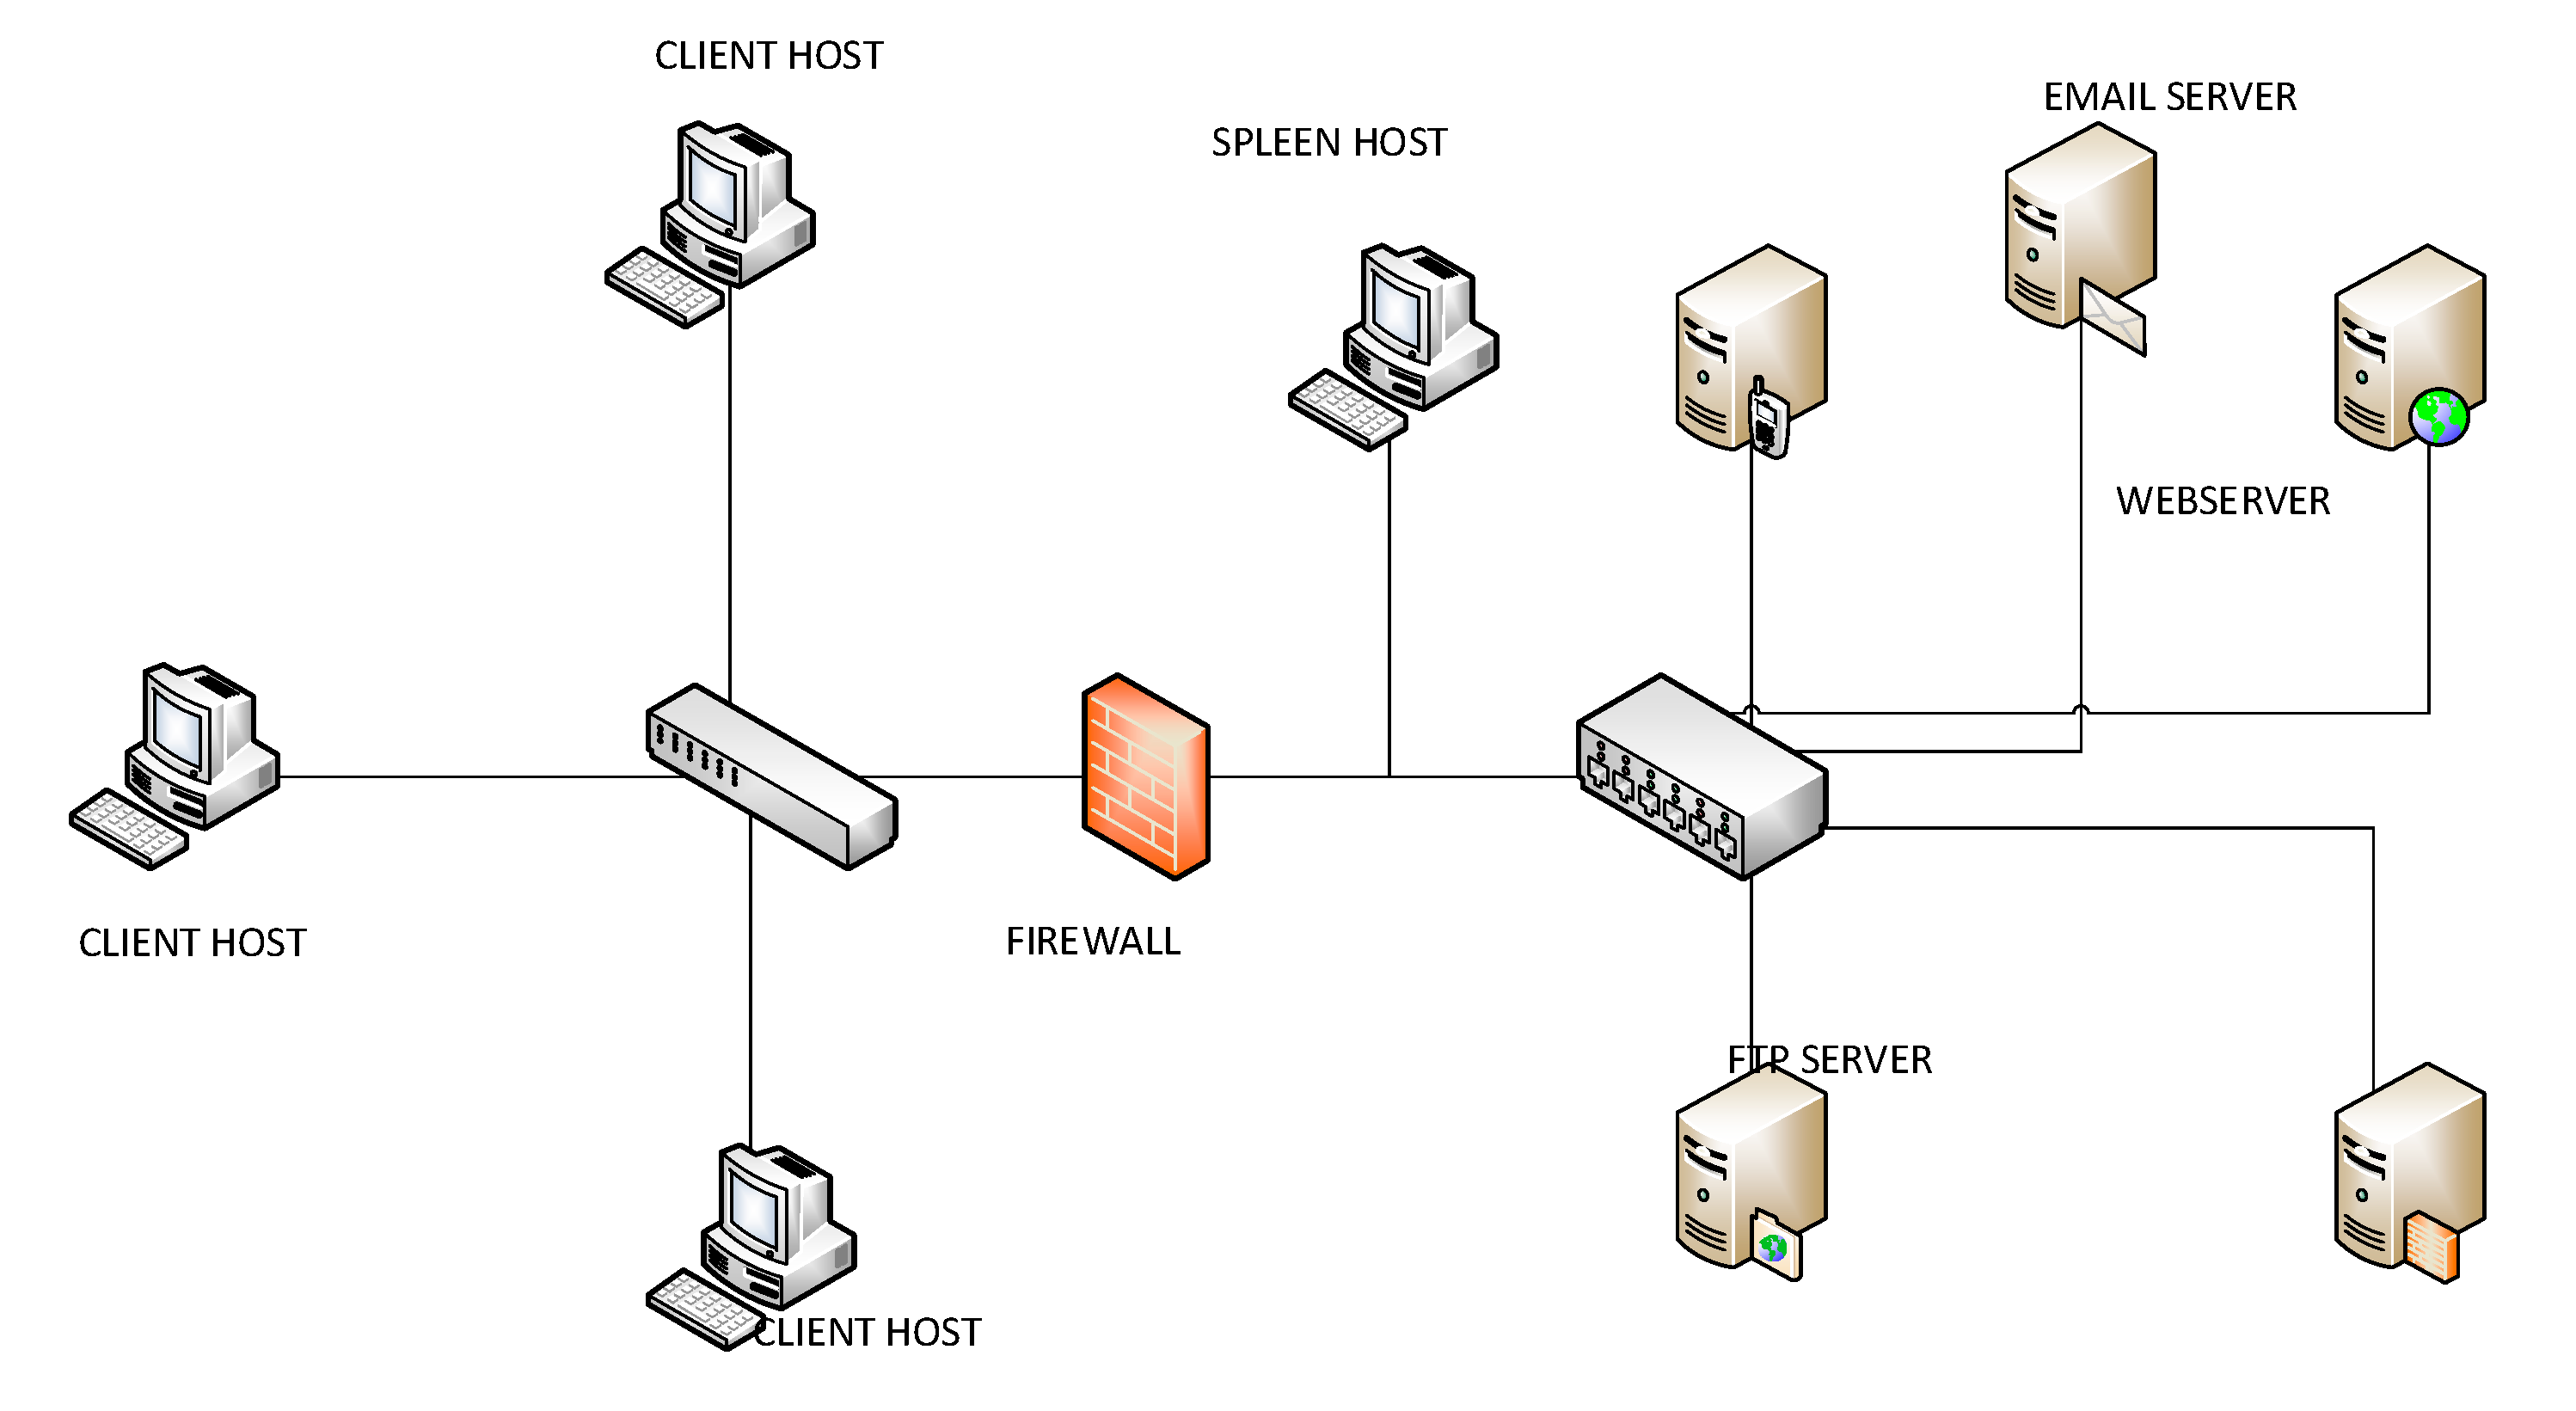
2.2.2. Wired Scenario
The wired network has a structure with 20 hosts connected, including serial port connections with standard output devices. User’s access is limited to web services such as corporate e-mail, database access and secure websites. The most frequent identified services were connected through ports: 80, 443, 13,000, 445, 16,881 and 2,011. The wired network architecture is shown in
Figure 4. There were 35,047 connections. Datasets were collected in 17 buffers, and there were 27,465 closed connections with 3,534,549 packets.
Figure 3.
Architecture of the wireless network scenario.
Figure 3.
Architecture of the wireless network scenario.
Figure 4.
Architecture of the wired scenario.
Figure 4.
Architecture of the wired scenario.
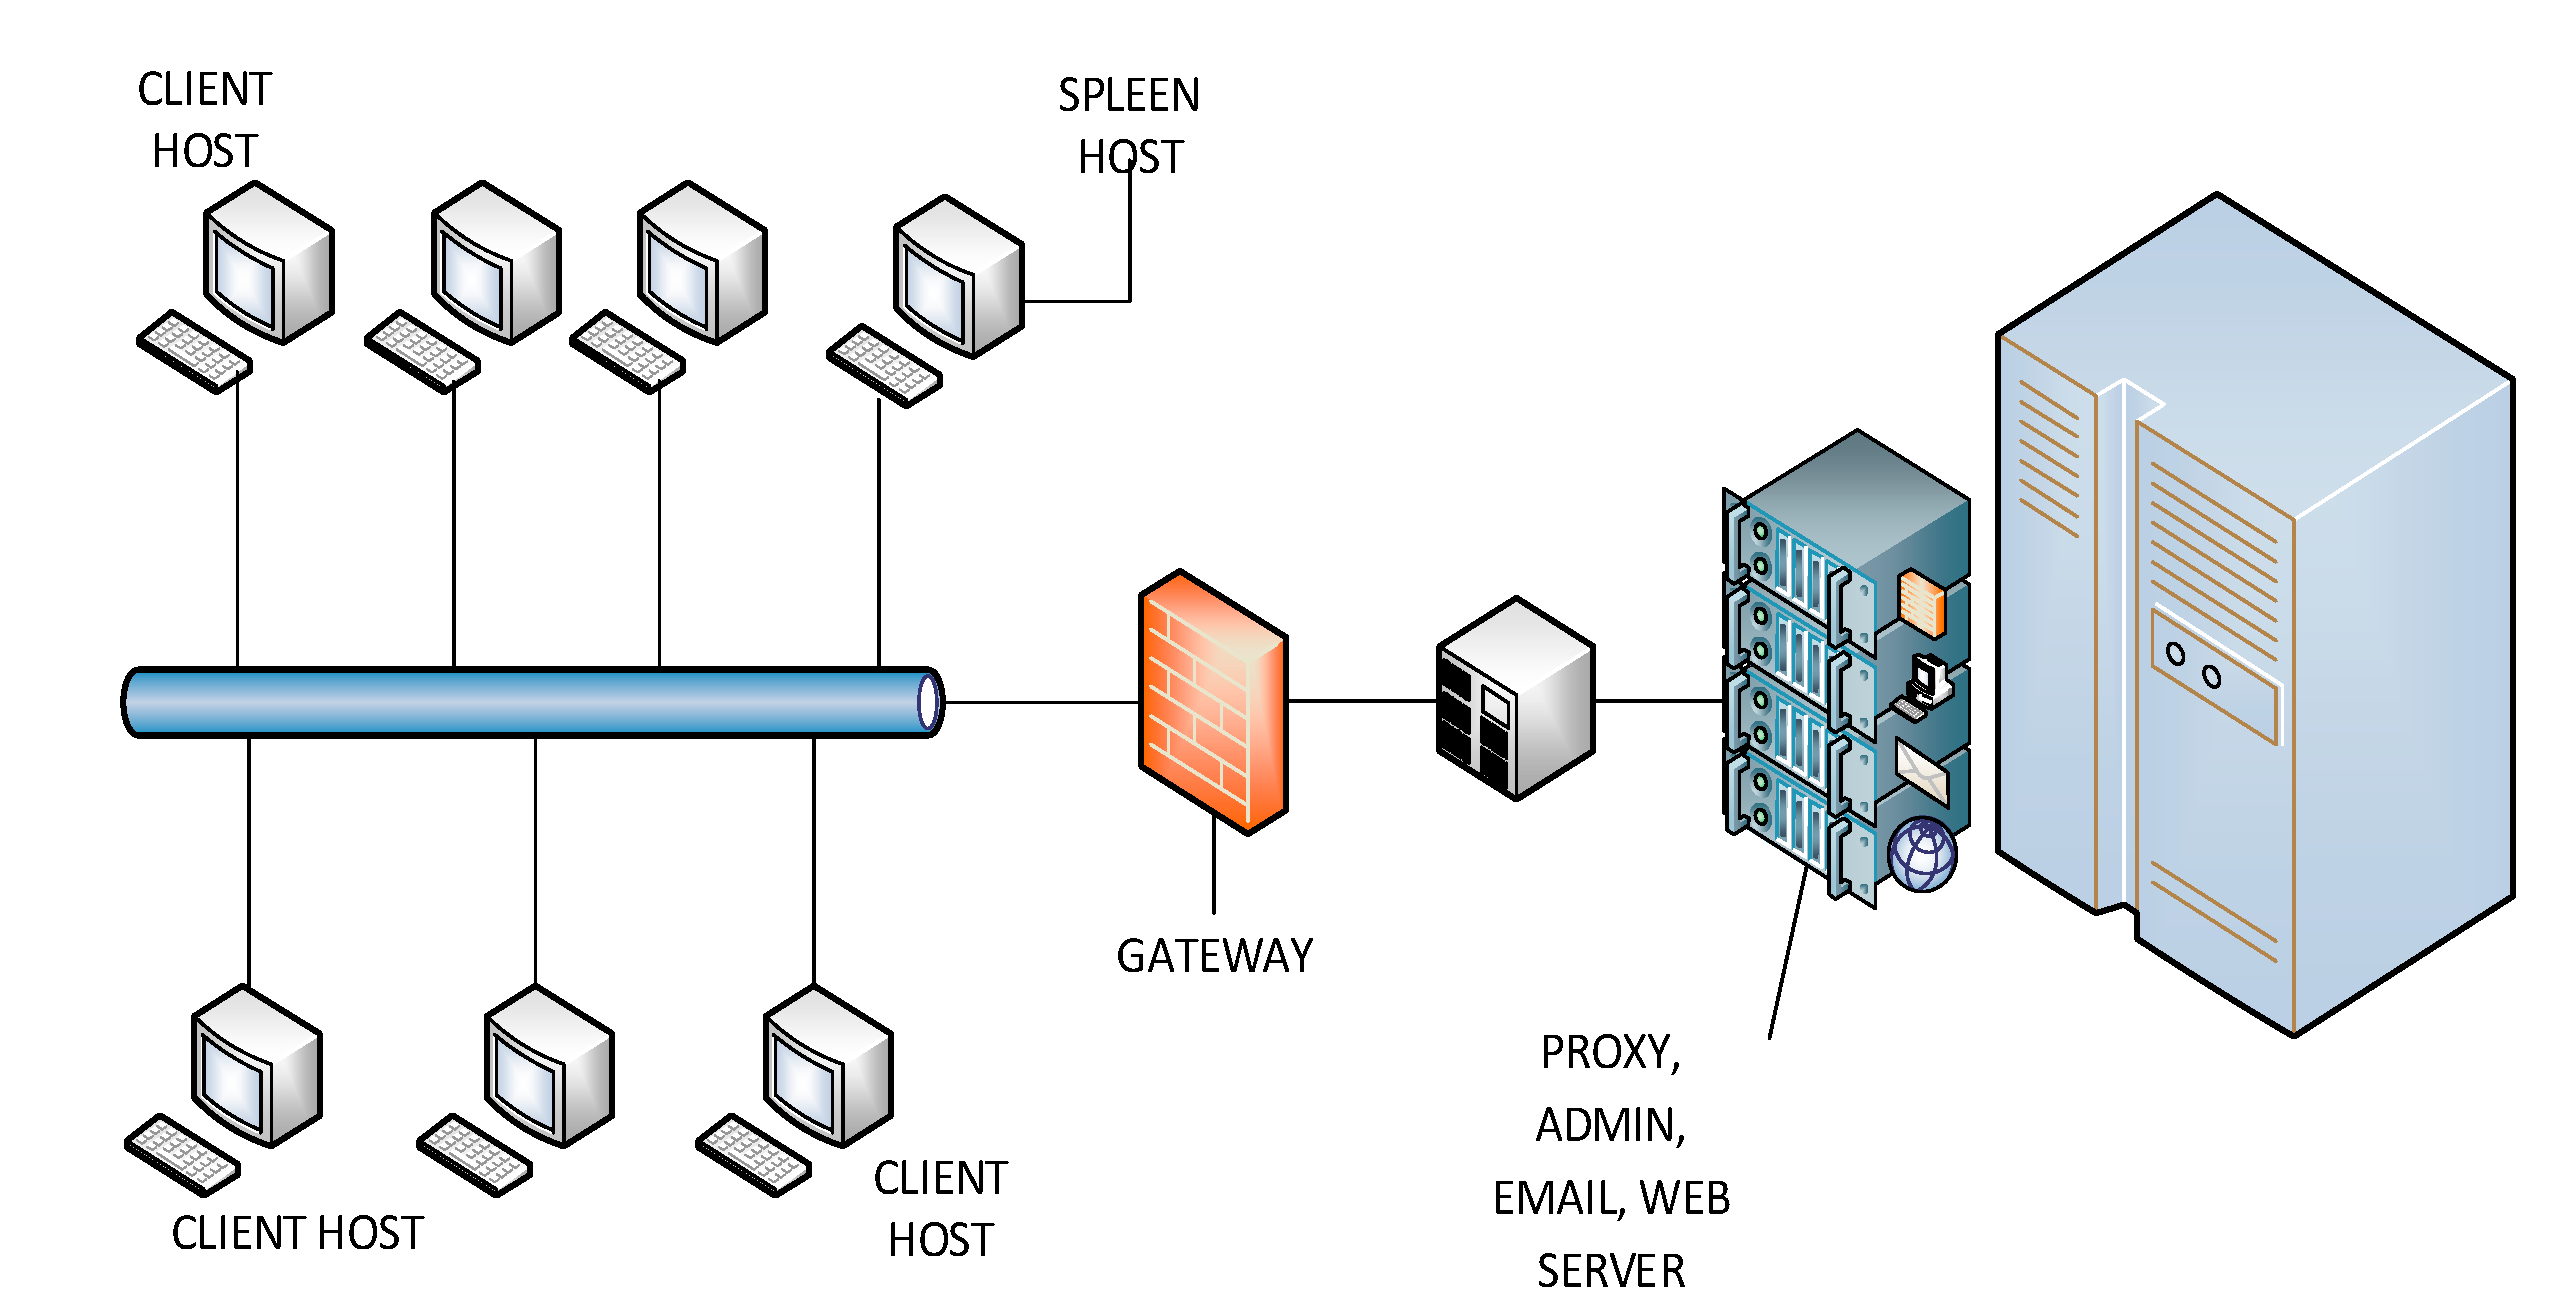
2.2.3. Server Scenario
The server’s network provides services, such as firewall, local DHCP, basic streaming, DNS and web servers, streaming and FTP, as can be seen in
Figure 5. The identified services employed ports 88, 13,000, 445, 135, 49,155, 389 and 8,443. One of the main protocols for the analyzed traffic was Kerberos [
31]. There were about 100,100 connections. Datasets were collect in 33 buffers, and there were 3,839 closed connections with 6,769,309 packets. Demilitarized Zone (DMZ) is composed by six servers, and a host with the tool to monitor the traffic is also included.
2.2.4. LAN MZ Scenario
The selected LAN is in an MZ, as in
Figure 6. Each user has access to the intranet to update and share information across departments. The most frequent services were identified through ports 80, 443, 13,000, 445, and 5,678. Management traffic services are bigger in the intranet than over Internet connections. Some common services are remote replication agent connection (RRAC) with 5678 TCP/UDP protocols. Another frequent service is Windows-DS through port 445. The number of connections was approximately 111,000, with about 15 users during the test time. Datasets were collected in 21 buffers, and there were 5,505 closed connections with 16,818,686 packets.
Figure 5.
Architecture of the server scenario.
Figure 5.
Architecture of the server scenario.
Figure 6.
Architecture of the LAN militarized zone (MZ) scenario. RRAC, remote replication agent connection.
Figure 6.
Architecture of the LAN militarized zone (MZ) scenario. RRAC, remote replication agent connection.
2.3. Artificial Neural Network as the Machine Learning Method
Variables that were selected with PCA from the original datasets according to characteristics and priority weights are employed in the training, validation and test stages [
31]. The features applied to the ANN are composed of four BCD variables, and they are complemented with four variables from the traditional features [
13,
32,
33]. Each feature represents an input to the neural network, based on the status flag of the main attributes. The first stage is to select the data and to load the matrix with eight input variables. The target is loaded to establish the output network. The percentage of the training, test and validation stages is configured according to the dataset samples. Fifty percent of the dataset samples was selected for the training stage, 25 percent for the testing stage and the remaining 25 percent for the validation stage. Then, a suitable neural network is designed by selecting the hidden neurons and the output layer based on the target.
A variable’s status depends on its statistical value and its selection in each connection. The destination host error rate is a BCD variable that has two status flags, which are represented in bits. The input variable is normalized between those values that represent the true or false status of the error. The features with percentage values are normalized for the training. Normalization is implemented to improve the training time and to standardize the inputs in order to stabilize weights and biases. The normalization value has a range 0 to 1 to represent the high and low status. Weight and bias values are stored into a matrix; afterwards, they are tested in each network scenario.
The training was performed with the Levenberg–Marquardt (LM) standard back-propagation algorithm. LM is an iterative algorithm represented in Equation (1) [
34]. The LM algorithm is one of the most efficient algorithms to combine the gradient descent method and the Gauss–Newton method for the training stage.
The function has
m number of connections, where
x is a vector of input variables and
t is a scalar. φ is a scalar that includes the weights of the inputs of the training matrix. The LM algorithm is based on the Hessian matrix [
34,
35]. The Hessian matrix can be calculated with Equation (2) as a typical training feedforward network.
where
J is the Jacobian component of the principal matrix with input variables. The matrix has
m rows that represent the number of connections and has
n columns that represent the input variables.
J implements a gradient vector for each function with
e, which is the vector of network errors. The gradient vector is represented in Equation (3) [
35].
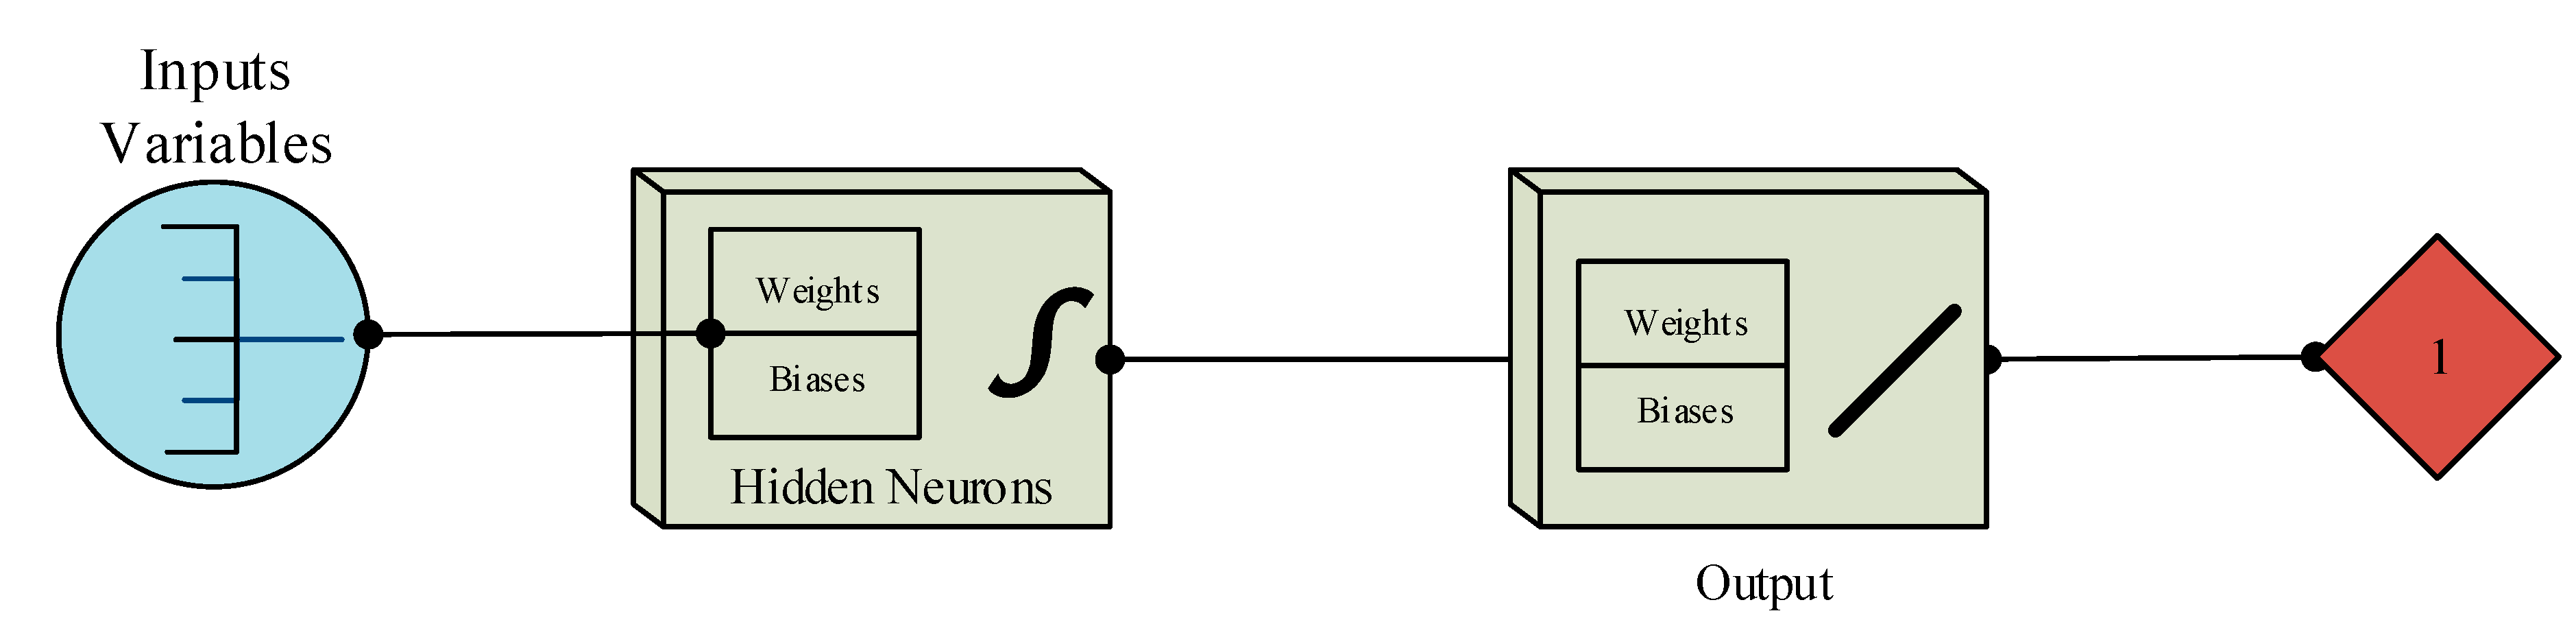
The selected features applied to the ANN are described as follows: The first input is the number of connections with the same service at the current connection in the past two seconds. The second feature is the percentage of connections that have synchronization status error. The third feature is the percentage of connections that have a reject status error. The last variable of the normal database for IDS is the count of connections having the same destination host. The BCD features are: the average of payload size in bytes, the count of connections from this client in the last connection, the percentage of connections from the current client to the current host and the percentage of connections to the current host with States S0 and others. The processing system and the power of the network is delayed for the training algorithm. The appropriate fitting configuration in this ANN is represented with ten hidden neurons for the input data. The ANN structure is shown in
Figure 7, with eight inputs trained by the Levenberg–Marquardt algorithm and one output. The output variable acquires two values: possible attack or a normal connection. We create an ANN for each type of attack; that means that there are three developed detectors. The initial ANN was set to train for 320 epochs for the first set of detectors, 360 epochs for the second set and 290 for the third set.
Tests were reported for the connections captured with the software tool. Statistical events are extracted from services for the TCP requests, HTTP sessions and processing times, among others. String and decimal classes are processed to convert the values to binary representation based on the variable’s status. The target is the last variable of the connections collected in a vector array. The first target is used to identify the attack type. The attacks are based on the probe category to test each scenario;
Table 2 shows the attack types implemented during the training and the code.
Figure 7.
Artificial neural network structure for each type of attack.
Figure 7.
Artificial neural network structure for each type of attack.
Table 2.
Attack types and their numerical representation.
Table 2.
Attack types and their numerical representation.
| Attack type | Numerical value |
|---|
| Normal | 00 |
| ExplorePorts probes | 01 |
| IpAgry probes | 10 |
| Nessus probes | 11 |
Each attack has been used to test the efficiency in detection. Vulnerabilities are scanned to develop IDS detectors and to generate reports based on alerts for the incidents. The Nessus scan ports looking for intrusions in a system.
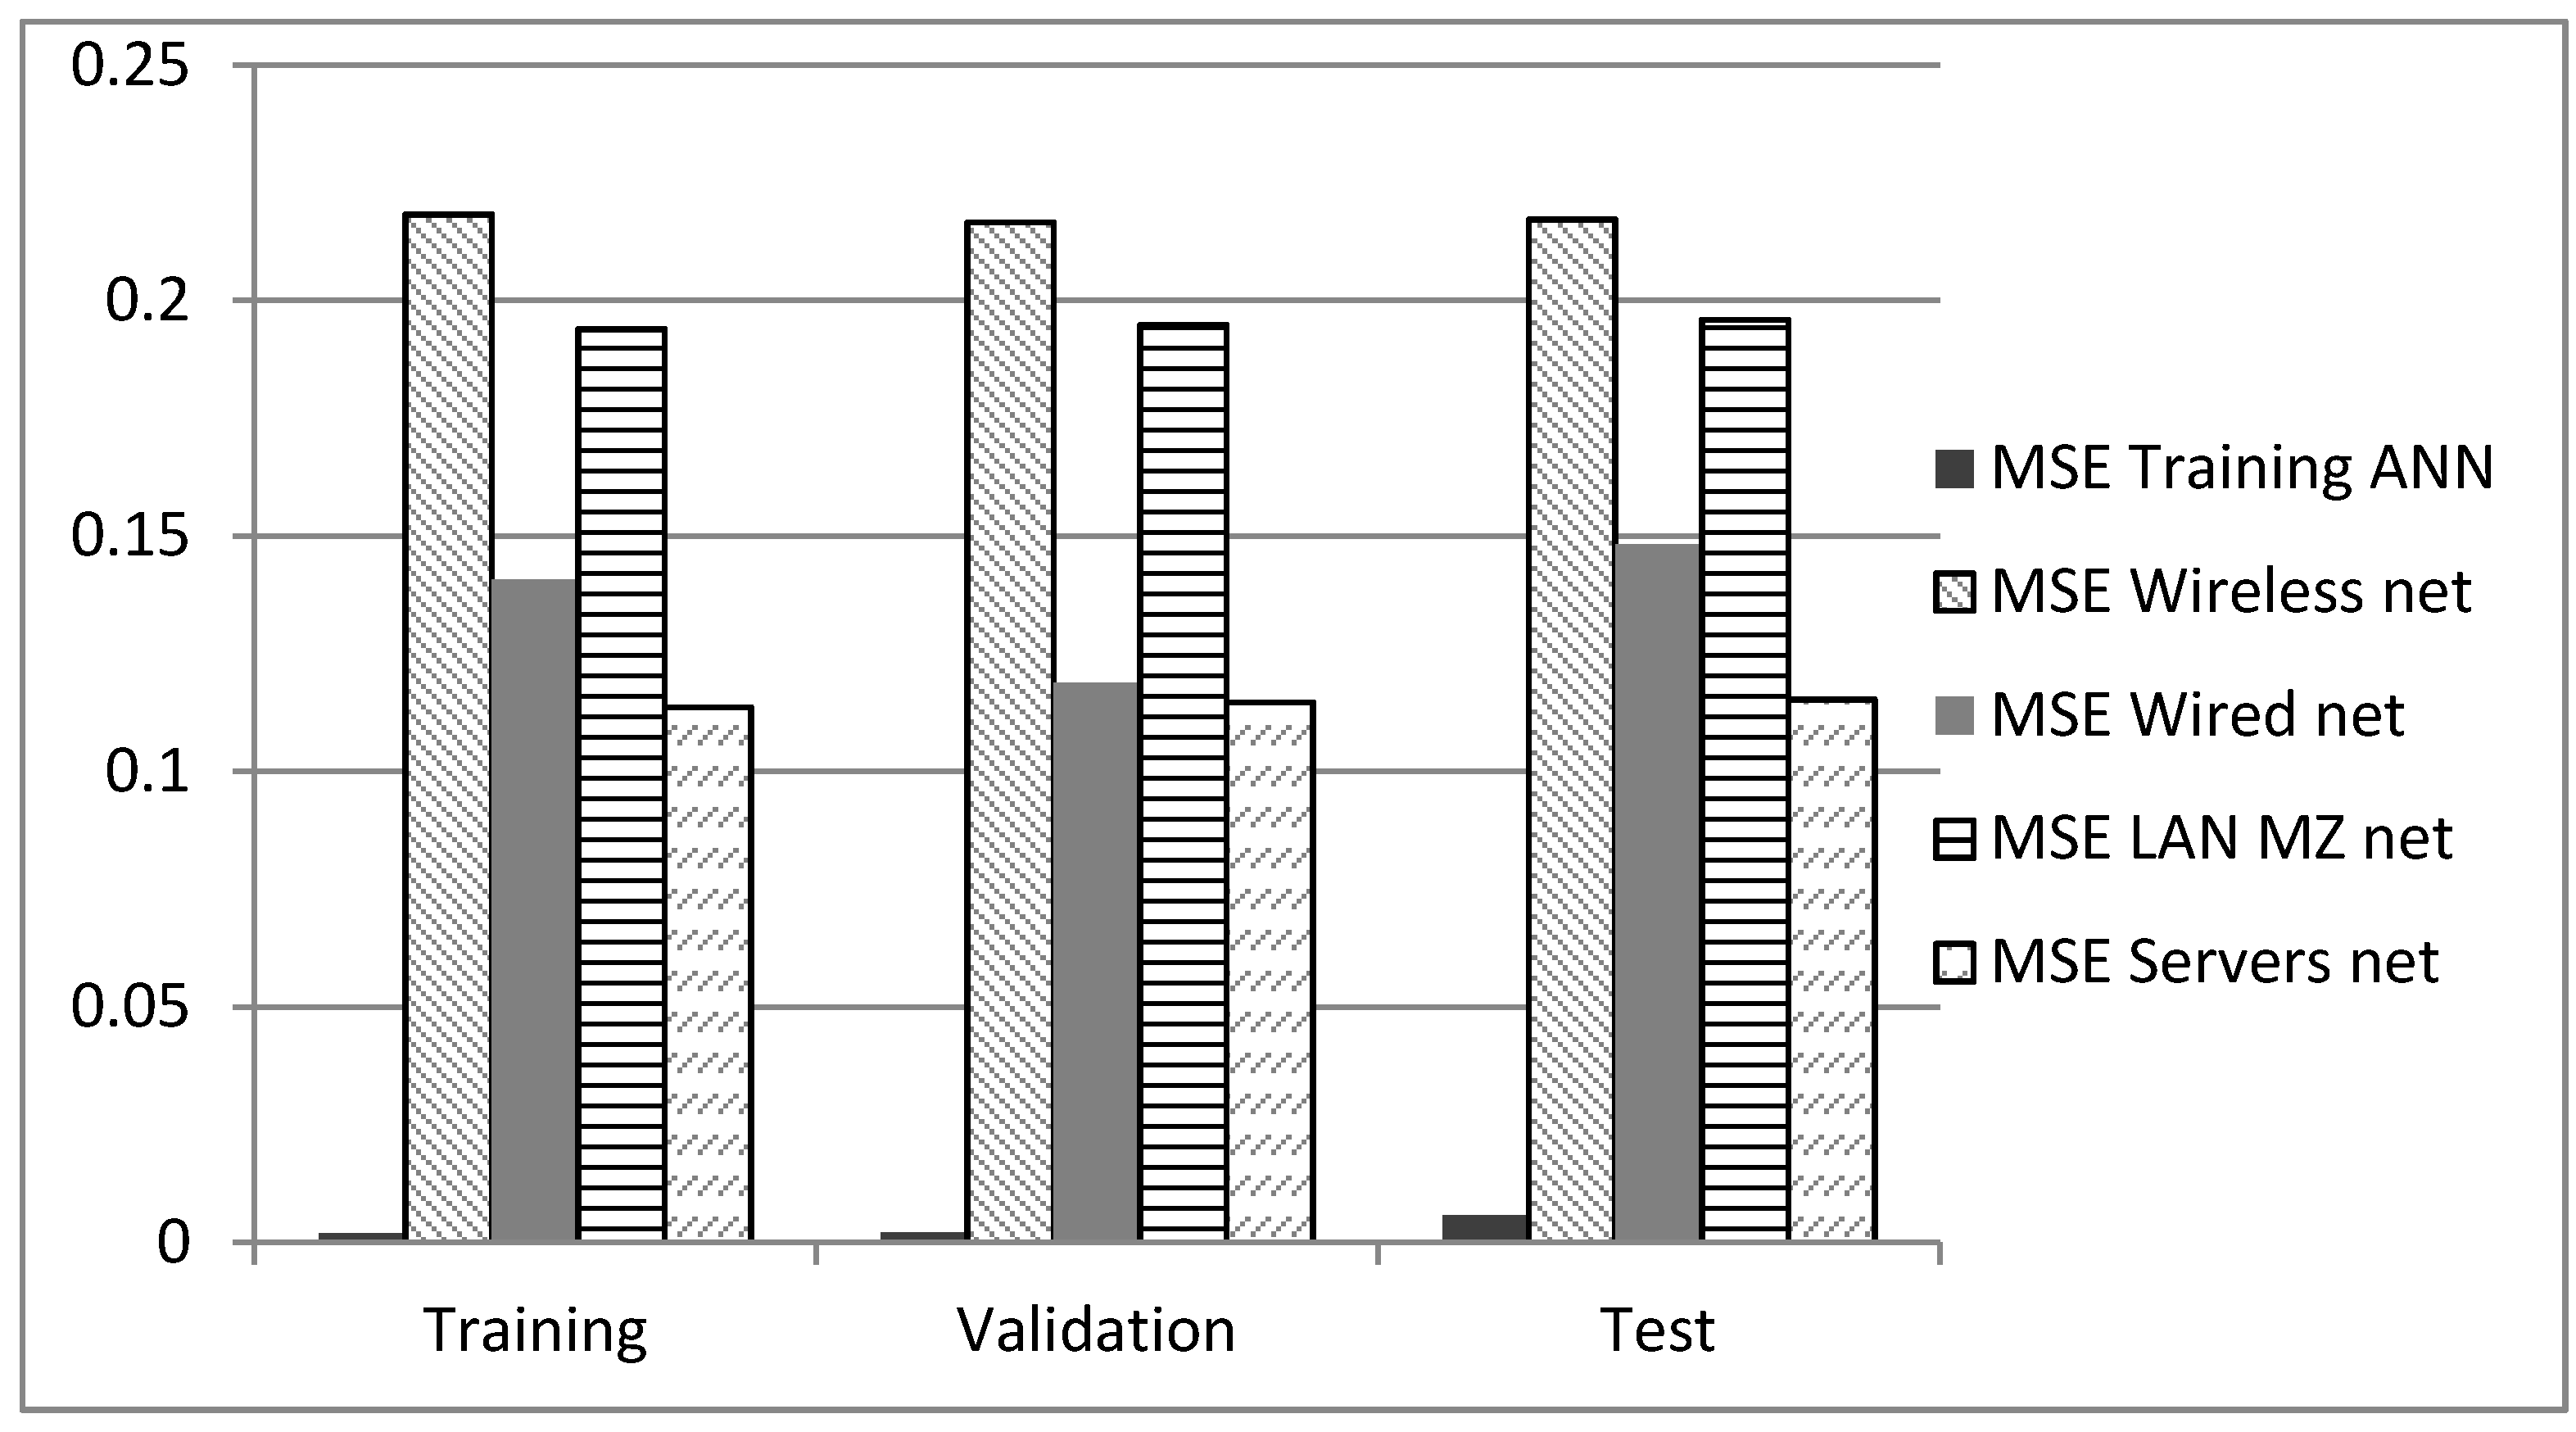
Analysis of the changes in the behavior in the network scenarios is based on the mean squared error (MSE). For each single detector, the MSE was calculated, and the final detection result is the mean of the three detectors.
The evaluation stage has additional tests of the training network. The main process is to analyze the weights and biases of training network, because these results are located in an array and modified in all of the scenarios to make the test. Inputs and targets are selected in this step to test the new network. Each scenario is tested, and its results are collected in statistics graphics.
3. Detection Results
As was stated, detectors were acquired with lab traffic applied to an ANN at three stages, training validation and testing. Afterwards, those detectors were deployed in acquired databases in each single network scenario without retraining the ANN. Due to the nature of the ANN training process, the analysis was made in the same portion of the traffic scenarios, which is why there are results for scenarios for the training stage although, there was no training process; this is just to compare the results under the same conditions. The results can be seen in
Figure 8.
MSE is the difference between targets and practical outputs; its ideal value is closer to zero, and it is related to the detection rate. The MSE training ANN represents the results of the detectors with the portion of the traffic database in the lab environment. These are the optimal results, because the lab data were employed to generate the ANN. The next results show the MSE of the network scenarios with the detectors of the lab data [
36].
The best result for the performance test is the server network with an error of 0.116, and the worst performance was for the wireless network with 0.21719.
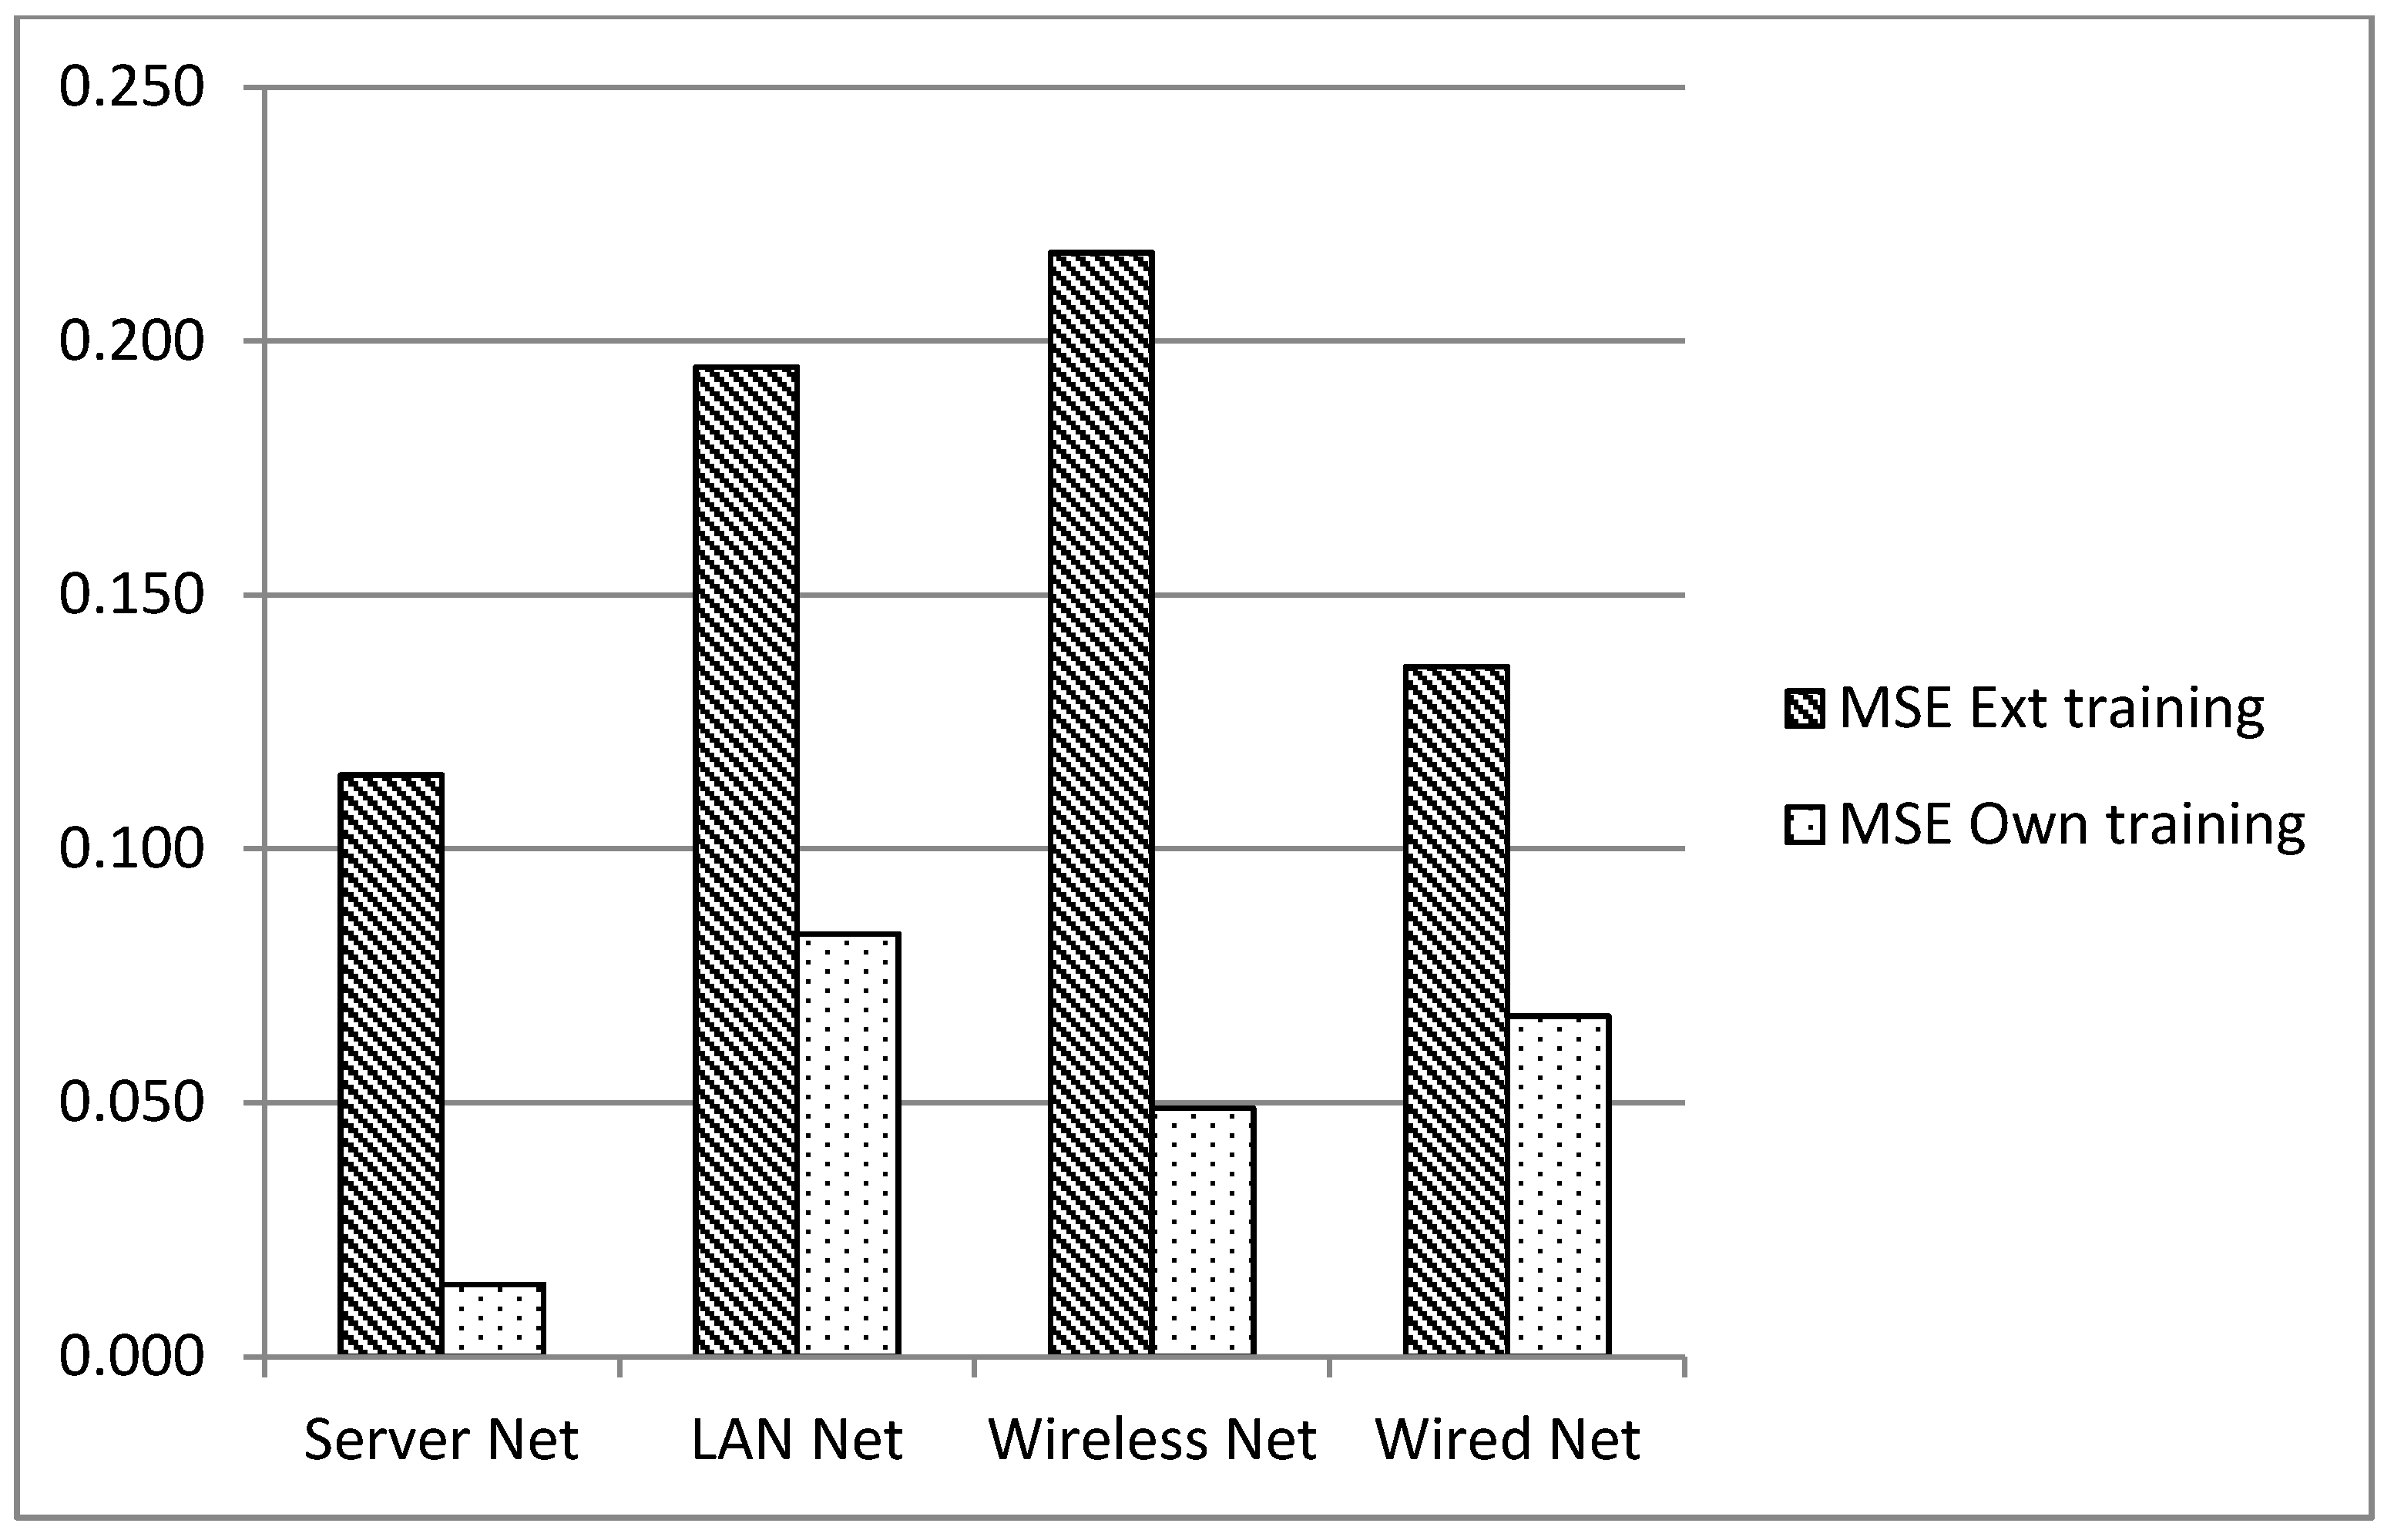
In order to determine if the detectors developed under the lab conditions can be used in real environments, due to the behavior for which they were trained being different from that for which they were set up, the traffic samples for each network scenario were employed to generate new detectors. The results for the detection with detectors created with ANN based on the same scenario in which they were deployed are called “MSE own training”, and the results explained previously are called “MSE ext training”. The results can be seen in
Figure 9.
Figure 8.
Detection results for the test stages of each network scenario to compare the detectors trained in the lab environment when applied in real-world networks.
Figure 8.
Detection results for the test stages of each network scenario to compare the detectors trained in the lab environment when applied in real-world networks.
Figure 9.
Statistics results for MSE external training and its own training network.
Figure 9.
Statistics results for MSE external training and its own training network.
Detection is improved when the ANN is retrained, but in a real environment, this means that new data must be acquired each time a detector is installed.
4. Discussion and Analysis
Internet-based attacks are changing dynamically from polymorphisms to mobile integrated attacks. As we increase web services and cloud dependency, the number of security holes also increases, which is posing a completely new threat in the near future. It is necessary to employ intelligent methods, and anomaly detection could provide the necessary detection availability. However, it turns out that most of the intelligent approaches employ similar general steps with different machine learning techniques. The main problem is not the learning method, as it is possible to see differences between them, but these differences are not really significant. It seems that the difficult point is to find a way to obtain the training data from realistic scenarios and to create a technique to retrain the system constantly, something similar to a biological immune system, not as an algorithm, but as a complete network solution. In fact, artificial immune systems and sub-applications have been presented as machine learning methods, but as was stated, this is just another interesting method.
With anomaly detection, the results show that an IDS detector that was developed in the context of a network’s behavior is not useful in another network with dissimilar applications. The detector is well adapted in its own environment, but it needs to be retrained to achieve good detection results. The detection differences between the network where the ANN detectors were calculated and the tested scenarios are unacceptable in real environments, going from an error of 0.1% in the same network that was used for training, to almost 22% in a different scenario.
It would be useful to apply a methodology for transfer learning, also known as knowledge transfer. This is an emerging field in machine learning that tries to solve the problem of rebuilding the solution when the feature space and distribution have changed [
37]. In fact, from the differences shown in this paper regarding the detection results in different network scenarios, it is clear that there will be a definition for the problem of knowledge transfer that could solve detection stability for IDS architectures in the near future.
Additionally, most approaches use old datasets, which is useful to probe machine learning methodologies, but is not helpful for new attack detection. This changes the accuracy of the system, because the old datasets were developed for simulation scenarios or with different network topologies. The parameters to be considered in Anomaly Detection (AD) IDS design are: network applications, security policies, memory capabilities to reinforce detectors, support of learning on the go, coordination between detectors for different behaviors and compatibility with auditing processes.
Although there are uncountable network user behaviors, it is possible to imagine a network classification according to its behavior, but in order to probe this statement, it is necessary to establish traffic behaviors that are not necessary related to topologies. For example, we calculated differences for detectors with two similar network topologies: a wired network and a LAN MZ network, but the variation of the detection error is near 10%, so a classification by Layer 1, 2 or 3 of the Open System Interconnection (OSI) model is not possible.
5. Conclusions
As expected for AD-based on behavior, detectors that were trained in a network environment are not suitable when installed in a network where the behavior is quite different. Those differences are not easy to model, because the user’s behavior depends on variables, such as available ports, security policies for appliances, network architectures and even operating systems. What is normal in a network is not necessarily normal in another.
Nevertheless, the advantages of AD, such as the detection of zero-day attacks, obfuscated variations and insiders and their ability to reduce the search space compared with the growing rules of misuse detection, are motivations to develop a system capable of self-learning in the network in which the detector is set up.
Acknowledgments
Edward Guillen thanks Jhordany Rodriguez for his work at “Grupo de Investigación en Seguridad y Sistemas de Comunicaciones” GISSIC on Spleen programming. This work was possible in part with the support of the Military University with funds of Project ING1199, and Colciencias young research program.
Author Contributions
E.G author worked on the design of the tests, network scenarios, and analysis of results.
J. S author worked with the measurements of the scenarios and ML method.
R. P. worked on the architecture of the network scenarios
Conflicts of Interest
The authors declare no conflict of interest.
References
- Zhao, D.; Xu, Q.; Feng, Z. Analysis and Design for Intrusion Detection System Based on Data Mining. In Proceedings of the 2010 Second International Workshop on Education Technology and Computer Science (ETCS), Wuhan, China, 6–7 March 2010; pp. 339–342.
- Chen, C.-M.; Chen, Y.-L.; Lin, H.-C. An efficient network intrusion detection. Comput. Commun. 2010, 33, 477–484. [Google Scholar]
- Hoque, M.S.; Mukit, M.A.; Bikas, M.A.N. An implementation of intrusion detection system using genetic algorithm. Int. J. Network Secur. Appl. 2012, 4, 109–120. [Google Scholar] [CrossRef]
- Kim, G.; Lee, S.; Kim, S. A novel hybrid intrusion detection method integrating anomaly detection with misuse detection. Expert Syst. Appl. 2014, 41, 1690–1700. [Google Scholar] [CrossRef]
- Axelsson, S. Intrusion Detection Systems: A Survey and Taxonomy; Technical Report: Chalmers University of Technology, Goteborg, Sweden, 14 March 2000. [Google Scholar]
- Liao, H.-J.; Richard Lin, C.-H.; Lin, Y.-C.; Tung, K.-Y. Intrusion detection system: A comprehensive review. J. Netw. Comput. Appl. 2013, 36, 16–24. [Google Scholar] [CrossRef]
- Cannady, J.; Harrell, J. A comparative analysis of current intrusion detection technologies. In Proceedings of the Fourth Technology for Information Security Conference, Houston, TX, USA, May 1996.
- Scarfone, K.; Mell, P. Guide to intrusion detection and prevention systems (idps). NIST Spec. Publ. 2007, 800, 94. [Google Scholar]
- Corchado, E.; Herrero, Á. Neural visualization of network traffic data for intrusion detection. Appl. Soft Comput. 2011, 11, 2042–2056. [Google Scholar] [CrossRef]
- Bhat, A.H.; Patra, S.; Jena, D. Machine Learning Approach for Intrusion Detection on Cloud Virtual Machines. Int. J. Appl. Innov. Eng. Manage. 2013, 2, 57–65. [Google Scholar]
- Guillen, E.; Padilla, D.; Colorado, Y. Weaknesses and strengths analysis over network-based intrusion detection and prevention systems. In Proceedings on the IEEE Latin-American Conference on Communications, 2009 (LATINCOM'09), Medellín, Colombia, 10–11 September 2009; pp. 1–5.
- Denning, D.E.; Neumann, P.G. Requirements and Model for Ides—A Real-Time Intrusion Detection Expert System; SRI Intermational Final Technical Report: Menlo Park, CA, USA, 28 February 1985. [Google Scholar]
- Kayacik, H.G.; Zincir-Heywood, A.N.; Heywood, M.I. Selecting features for intrusion detection: A feature relevance analysis on KDD 99 intrusion detection datasets. In Proceedings of the Third Annual Conference on Privacy, Security and Trust, New Brunswick, Canada, 12–14 October 2005.
- Mukkamala, S.; Janoski, G.; Sung, A. Intrusion detection using neural networks and support vector machines. In Proceedings of the 2002 International Joint Conference on Neural Networks, 2002 (IJCNN'02.), Honolulu, HI, USA, 12–17 May 2002; pp. 1702–1707.
- Tang, H.; Cao, Z. Machine Learning-based Intrusion Detection Algorithms. J. Comput. Inf. Syst. 2009, 5, 1825–1831. [Google Scholar]
- Lazarevic, A.; Ertцz, L.; Kumar, V.; Ozgur, A.; Srivastava, J. A Comparative Study of Anomaly Detection Schemes in Network Intrusion Detection. In Proceedings of the Third SIAM International Conference on Data Mining, San Francisco, CA, USA, 1–3 May 2003; pp. 25–36.
- Olusola, A.A.; Oladele, A.S.; Abosede, D.O. Analysis of KDD 99 intrusion detection dataset for selection of relevance features. In Proceedings of the World Congress on Engineering and Computer Science, San Francisco, CA, USA, 20–22 October 2010; pp. 20–22.
- Rodriguez, J. GTS: GNU Triangulated Surface Library. Available online: http://gts.sourceforge.net/ (accessed on 13 April 2015).
- Stolfo, S.J.; Fan, W.; Lee, W.; Prodromidis, A.; Chan, P.K. Cost-based modeling for fraud and intrusion detection: Results from the JAM project. In Proceedings of the DARPA Information Survivability Conference and Exposition, 2000 (DISCEX'00), Hilton Head, SC, USA, 25–27 January 2000; pp. 130–144.
- Kim, B.-J.; Kim, I.K. Machine Learning Approach to Realtime Intrusion Detection Systems. AI 2005: Advances in Artificial Intelligence; Springer Berlin Heidelberg: Berlin, Germany, 2005; pp. 153–163. [Google Scholar]
- Camacho, J.; Macia-Fernandez, G.; Diaz-Verdejo, J.; Garcia-Teodoro, P. Tackling the Big Data 4 vs for anomaly detection. In Proceedings of the 2014 IEEE Conference on Computer Communications Workshops (INFOCOM WKSHPS), Toronto, Canadá, 27 April–02 May 2014; pp. 500–505.
- Eid, H.F.; Darwish, A.; Abraham, A. Principle components analysis and support vector machine based intrusion detection system. In Proceedings of the 2010 10th International Conference on Intelligent Systems Design and Applications (ISDA), Cairo, Egypt, 29 November–1 December 2010; pp. 363–367.
- Chen, Y.; Li, Y.; Cheng, X.Q.; Guo, L. Survey and taxonomy of feature selection algorithms in intrusion detection system. In Information Security and Cryptology; Springer Berlin Heidelberg: Berlin, Germany, 2006; pp. 153–167. [Google Scholar]
- Kuchimanchi, G.K.; Phoha, V.V.; Balagani, K.S.; Gaddam, S.R. Dimension reduction using feature extraction methods for Real-time misuse detection systems. In Proceedings of the Fifth Annual IEEE SMC on Information Assurance Workshop, West Point, NY, USA, 10–11 June 2004; pp. 195–202.
- Govindarajan, M.; Chandrasekaran, R. Intrusion detection using neural based hybrid classification methods. Comput. Netw. 2011, 55, 1662–1671. [Google Scholar] [CrossRef]
- Amiri, F.; Rezaei Yousefi, M.; Lucas, C.; Shakery, A.; Yazdani, N. Mutual information based feature selection for intrusion detection systems. J. Netw. Comput. Appl. 2011, 34, 1184–1199. [Google Scholar] [CrossRef]
- Rangadurai Karthick, R.; Hattiwale, V.P.; Ravindran, B. Adaptive network intrusion detection system using a hybrid approach. In Proceedings of 2012 Fourth International Conference on Communication Systems and Networks (COMSNETS), Bangalore, India, 3–7 January 2012; pp. 1–7.
- Guillén, E.; Rodriguez, J.; Páez, R. Evaluating Performance of an Anomaly Detection Module with Artificial Neural Network Implementation. Int. J. Comput. Inf. Syst. Control Eng. 2013, 7, 836–842. [Google Scholar]
- Sommer, R.; Paxson, V. Outside the closed world: On using machine learning for network intrusion detection. In Proeedings of the 2010 IEEE Symposium on Security and Privacy (SP), Oakland, CA, USA, 16-19 May, 2010; pp. 305–316.
- Wang, K.; Stolfo, S.J. Anomalous payload-based network intrusion detection. In Proceedings of the Recent Advances in Intrusion Detection, Sophia Antipolis, France, 15–17 September 2004; pp. 203–222.
- Neuman, B.C.; Ts’o, T. Kerberos: An authentication service for computer networks. IEEE Commun. Mag. 1994, 32, 33–38. [Google Scholar] [CrossRef]
- Mahoney, M.V.; Chan, P.K. PHAD: Packet header anomaly detection for identifying hostile network traffic; Florida Institute of Technology Technical Report: Melbourne, FL. USA, April 2001. [Google Scholar]
- Sung, A.H.; Mukkamala, S. Identifying important features for intrusion detection using support vector machines and neural networks. In Proceedings of the 2003 Symposium on Applications and the Internet, Orlando, FL, USA, 27–31 January 2003; pp. 209–216.
- Wilamowski, B.M.; Yu, H. Improved computation for Levenberg–Marquardt training. IEEE Trans. Neural Netw. 2010, 21, 930–937. [Google Scholar] [CrossRef] [PubMed]
- Yu, H.; Wilamowski, B.M. Levenberg-Marquardt Training. Ind. Electron. Handb. 2011, 5, 1–15. [Google Scholar]
- Guillén, E.; Rodriguez, J.; Páez, R.; Rodriguez, A. Detection of non-content based attacks using GA with extended KDD features. In Proceedings of the World Congress on Engineering and Computer Science, San Francisco, CA, USA, 24–26 October 2012; pp. 30–35.
- Pan, S.J.; Yang, Q. A survey on transfer learning. Knowledge and Data Engineering. IEEE Trans. 2010, 22, 1345–1359. [Google Scholar]
© 2015 by the authors; licensee MDPI, Basel, Switzerland. This article is an open access article distributed under the terms and conditions of the Creative Commons Attribution license (http://creativecommons.org/licenses/by/4.0/).


