On
the device level the real-time requirements are very strict [
18]. Typical devices doing the communicating are actuators, programmable logic controllers (PLC), sensors and such. Very little amounts of data are transmitted. Data transmitted represent two categories: data transfers. which are typically cyclic and periodic are one category, and alarms another. The data transfers are composed of control and measurement data that flows between field equipments. Alarms interrupt the normal data flow [
17].
The plant level interconnects the cell controllers to enterprise resource planning (ERP) systems. It does most of its communications during non-critical times transmitting much larger amounts of data compared to the previous two levels [
17]. Networks present in a factory environment should also be segmented by use of firewalls and demilitarized zones (DMZ), terminating connections coming from outside of the ICS network at these DMZ’s. This segmentation into security areas should not be confused with the above functional differentiation. The security segmentation and its particularities is discussed extensively in several research papers and other documents, such as [
1]. The division into separated functional levels allows for the creation of separate models for anomaly detection. What is anomalous in one functional level can be normal when another level is concerned.
3.1. Network Structure and Available Traffic
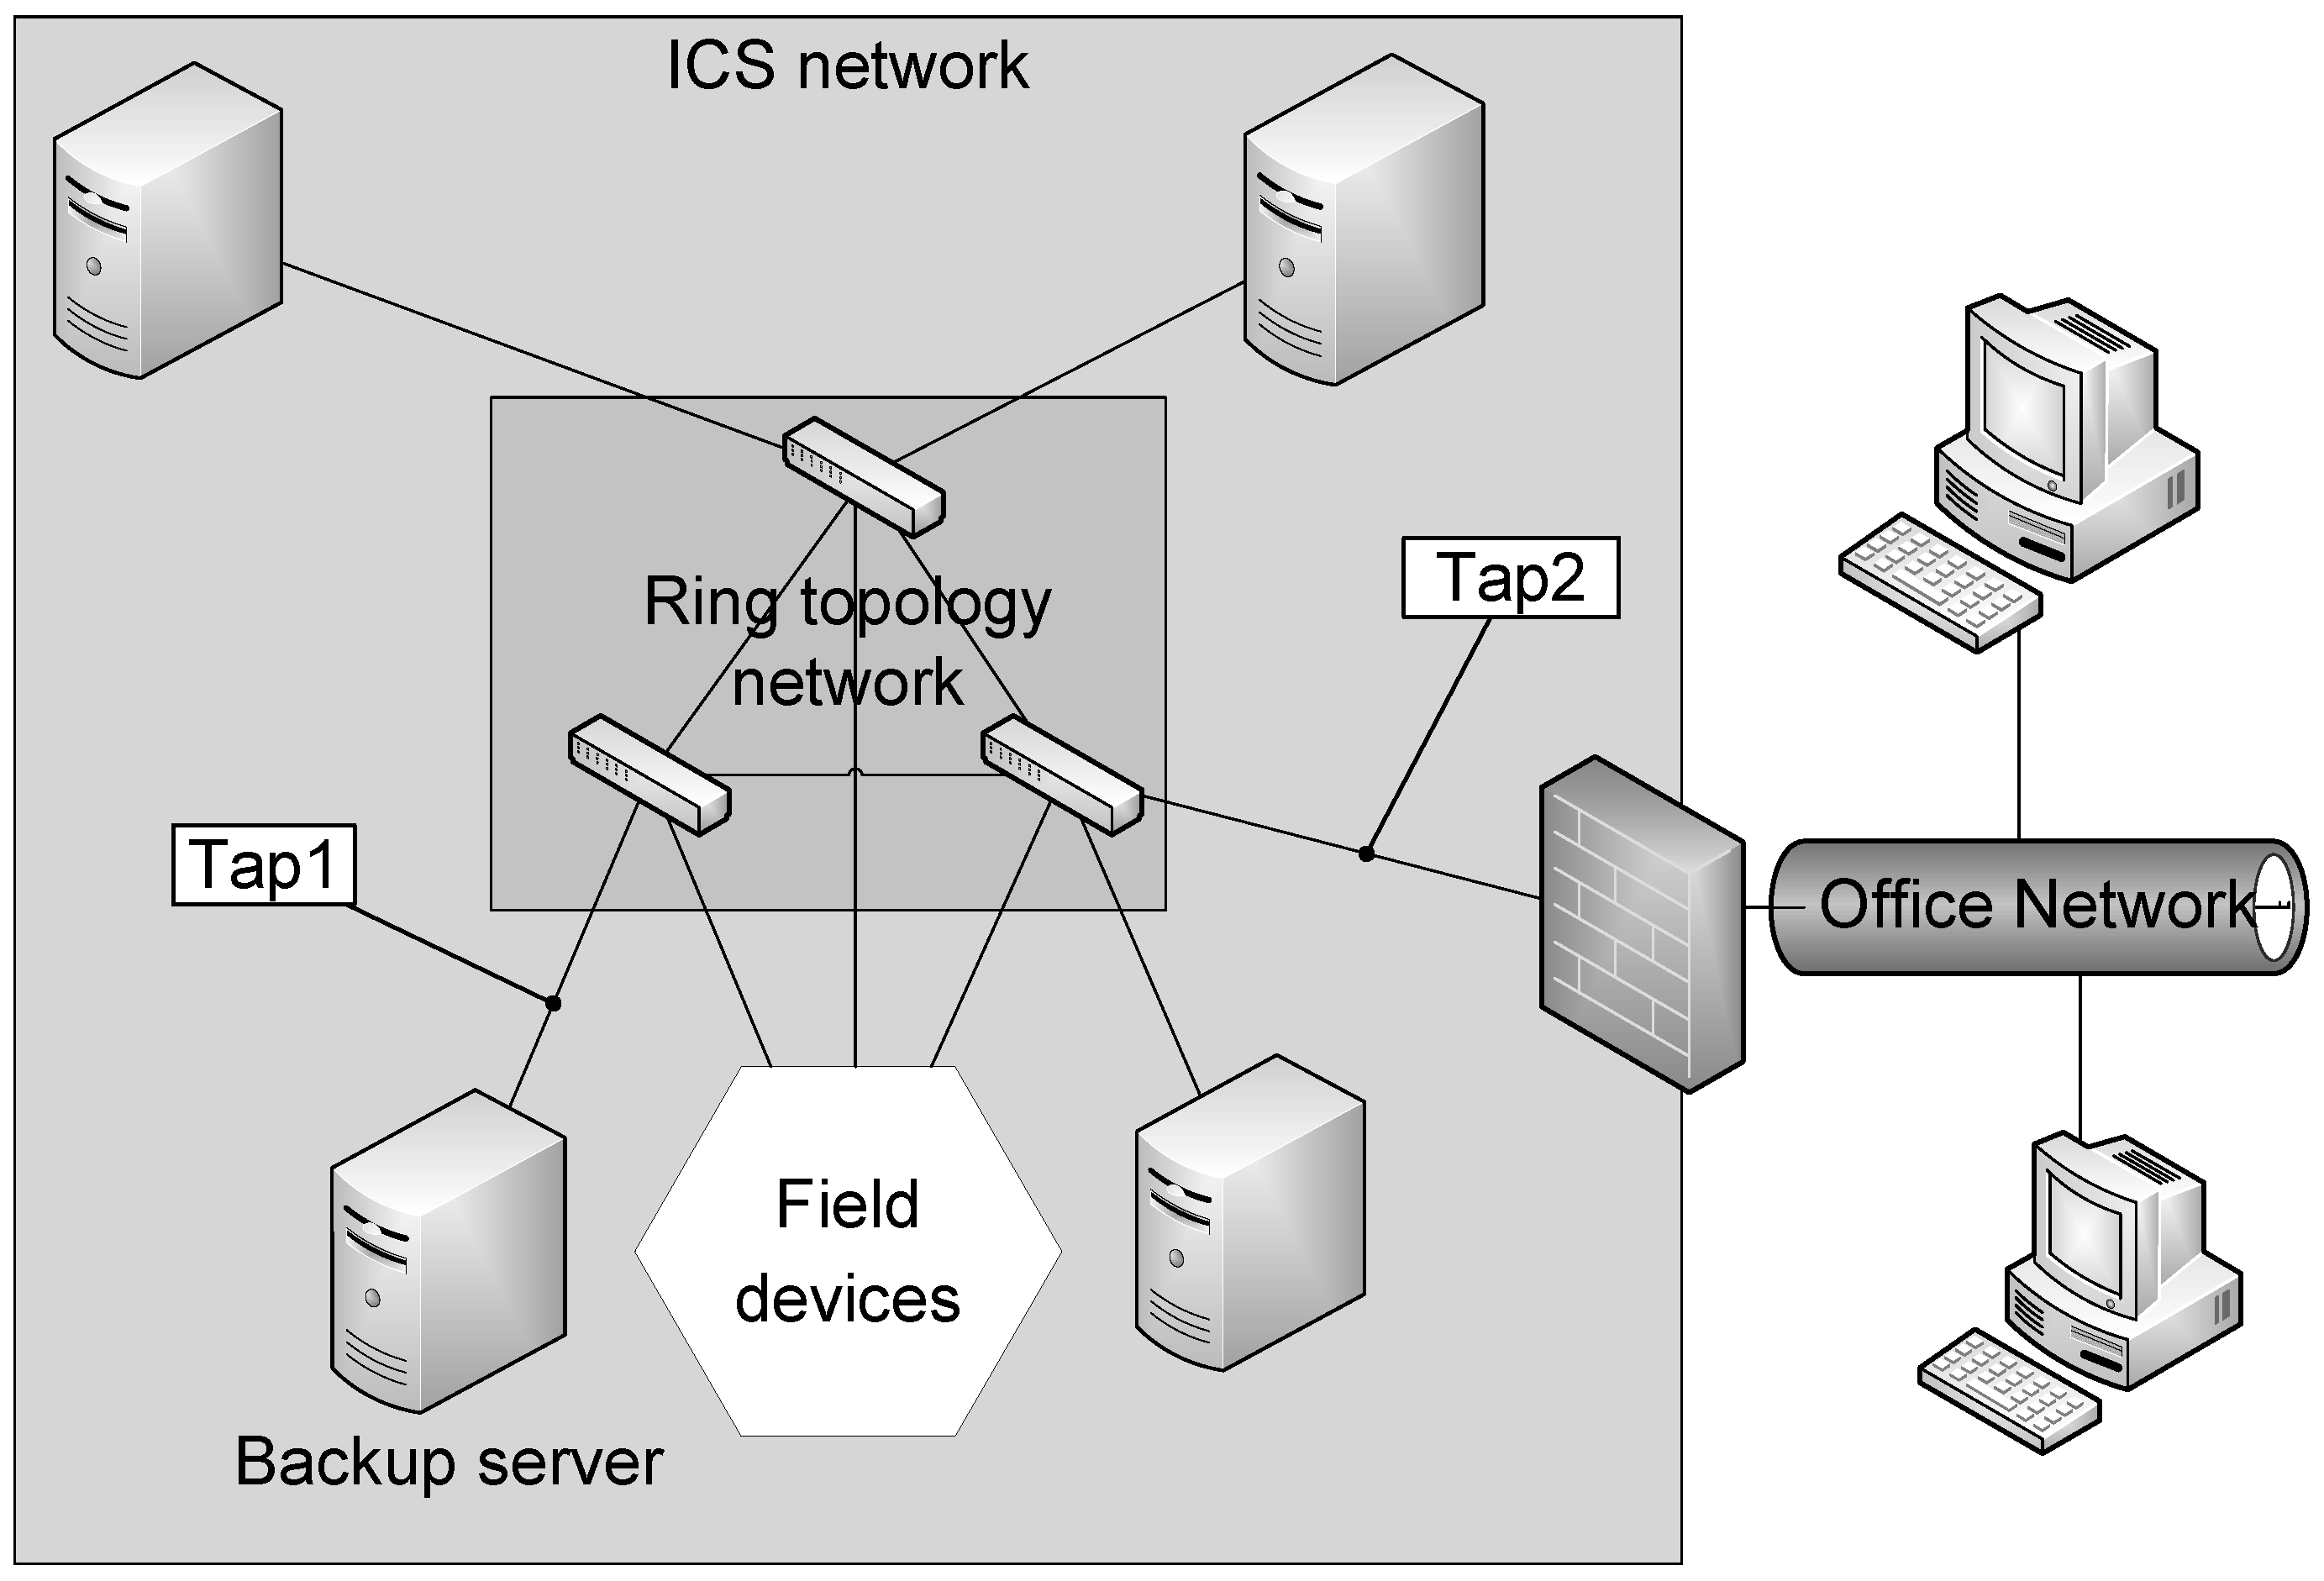
The target network is a ring topology ethernet network depicted in
Figure 1. The network does not follow the recommended structure for demilitarized zones and separated communications, but does have an firewall between the ICS network and the office network. Multicast is used for most communications. The usage of multicast has a significant impact on the possible features to be used for the machine learning anomaly detection system.
The usage of the functional layers as presented in [
17] for defining a separate set of features for each of the layers is not a straight-forward task in this environment. The use of multicast communication and ring topology network results in a situation where traffic from different functional levels is present in monitoring locations such as Tap1 and Tap2. For defining a separate set of features for each functional level the traffic in the network would have to be further analyzed and categorized, which would require considerable additional work.
Figure 1.
Overview of the network structure of the factory site.
Figure 1.
Overview of the network structure of the factory site.
Available network traffic consists of traces captured from a live factory environment as well as traces captured from a laboratory environment with ICS equipment. The traces captured from the network are hour long and from two different locations: Tap1 and Tap2. Tap1 and Tap2 are within the ring topology ethernet network used mainly with multicast for control traffic. In the first capture, only traffic within the ICS network used for controlling the production systems and related traffic is visible. The location of this first capture is the Tap1 as depicted in
Figure 1. For the Tap2, also depicted in
Figure 1 we see the same multicast traffic as from Tap1 plus the non-multicast traffic to and from the office network that is separated from the control network via a firewall.
Traffic from Tap1 included a total of 3,168,660 packets. From Tap2 a total of 2,838,227 packets was recorded. Average packet size for Tap1 recorded traffic was 135.10 bytes with data byte rate of 109,257.90 B/s and for Tap2 134.23 B/s with data byte rate of 83,525.07 bytes/s. Packet capture duration was 3918 s for Tap2 and for Tap1 it was 4561 s. This information is depicted in the
Table 1. The capture files were also sliced into shorter segments for statistical analysis using editcap tool which is distributed with Wireshark [
19]. Statistics of these slices is found in
Table 2 and specifically for average packet slices in consecutive 600 s slices in
Figure 2.
Table 1.
Statistics of the packet captures, connection number without the RAID controller messages.
Table 1.
Statistics of the packet captures, connection number without the RAID controller messages.
| Attribute | Capture location tap1 | Capture location tap2 |
|---|
| Duration of capture | 3,918 s | 4,561 s |
| No. of packets | 3,168,660 | 2,838,227 |
| Avg. size of packets | 135.10 bytes | 134.23 bytes |
| Avg. data rate | 109,257.90 bytes/s | 83,525.07 bytes/s |
| Capture size | 478,792,912 bytes | 426,382,869 bytes |
| Avg. packet rate | 808.70 packets/s | 622.26 packets/s |
| No. of connections | 613 | 930 |
| No. of TCP connections | 8 | 174 |
| No. of UDP flows | 598 | 713 |
| No. of ICMP flow | 0 | 36 |
| Portion of multicast packets | 92.38% | 96.97% |
The traffic included an amount of unencrypted control information for the system operators, visible in analysis by Tcpdump and Wireshark. This information included names of various systems, commands available for their operation as well as other information regarding their type. The traffic seen at the Tap2 includes traffic of all the three levels described in
Section 3.
A single device, a Promise RAID controller caused noise in the traffic. All of the traffic directed to port 712 was of this type. Of the total of 3,168,660 packets that made up the traffic captured from Tap1 2610 packets consisted of the Promise RAID controller messages with the following nearly static part: PROMISE_RAID#KB01#Hello World!
These messages made up a disproportionately large part of the connection log produced by the Bro NSM, of the total of 3216 connections logged 2610 were actually single instances of these messages, each of which registered as a new connection.
Table 2.
Statistics of the 600 s interval slices of the packet captures.
Table 2.
Statistics of the 600 s interval slices of the packet captures.
| t | Tap | Data byte rate (B/s) | Avg. packet size(B) | Avg. packet rate |
|---|
| 0s | Tap1: | 110,764.06 | 135.12 | 819.73 |
| Tap2: | 81,069.95 | 132.19 | 613.29 |
| 600 s | Tap1: | 112,781.12 | 135.16 | 834.73 |
| Tap2: | 81,336.13 | 132.15 | 615.48 |
| 1200 s | Tap1: | 109,876.51 | 135.06 | 813.55 |
| Tap2: | 87,409.34 | 138.72 | 630.12 |
| 1800 s | Tap1: | 108,285.54 | 135.09 | 801.58 |
| Tap2: | 83,917.03 | 133.33 | 629.39 |
| 2400 s | Tap1: | 107,414.70 | 135.09 | 795.11 |
| Tap2: | 85,160.06 | 133.65 | 637.20 |
| 3000 s | Tap1: | 107,521.36 | 135.07 | 796.06 |
| Tap2: | 83,499.59 | 133.01 | 627.75 |
| 3600 s | Tap1: | 107,203.58 | 135.14 | 793.27 |
| Tap2: | 80,870.29 | 132.31 | 611.23 |
| 4200 s | Tap1: | - | - | - |
| Tap2: | 85,885.34 | 141.26 | 608.00 |
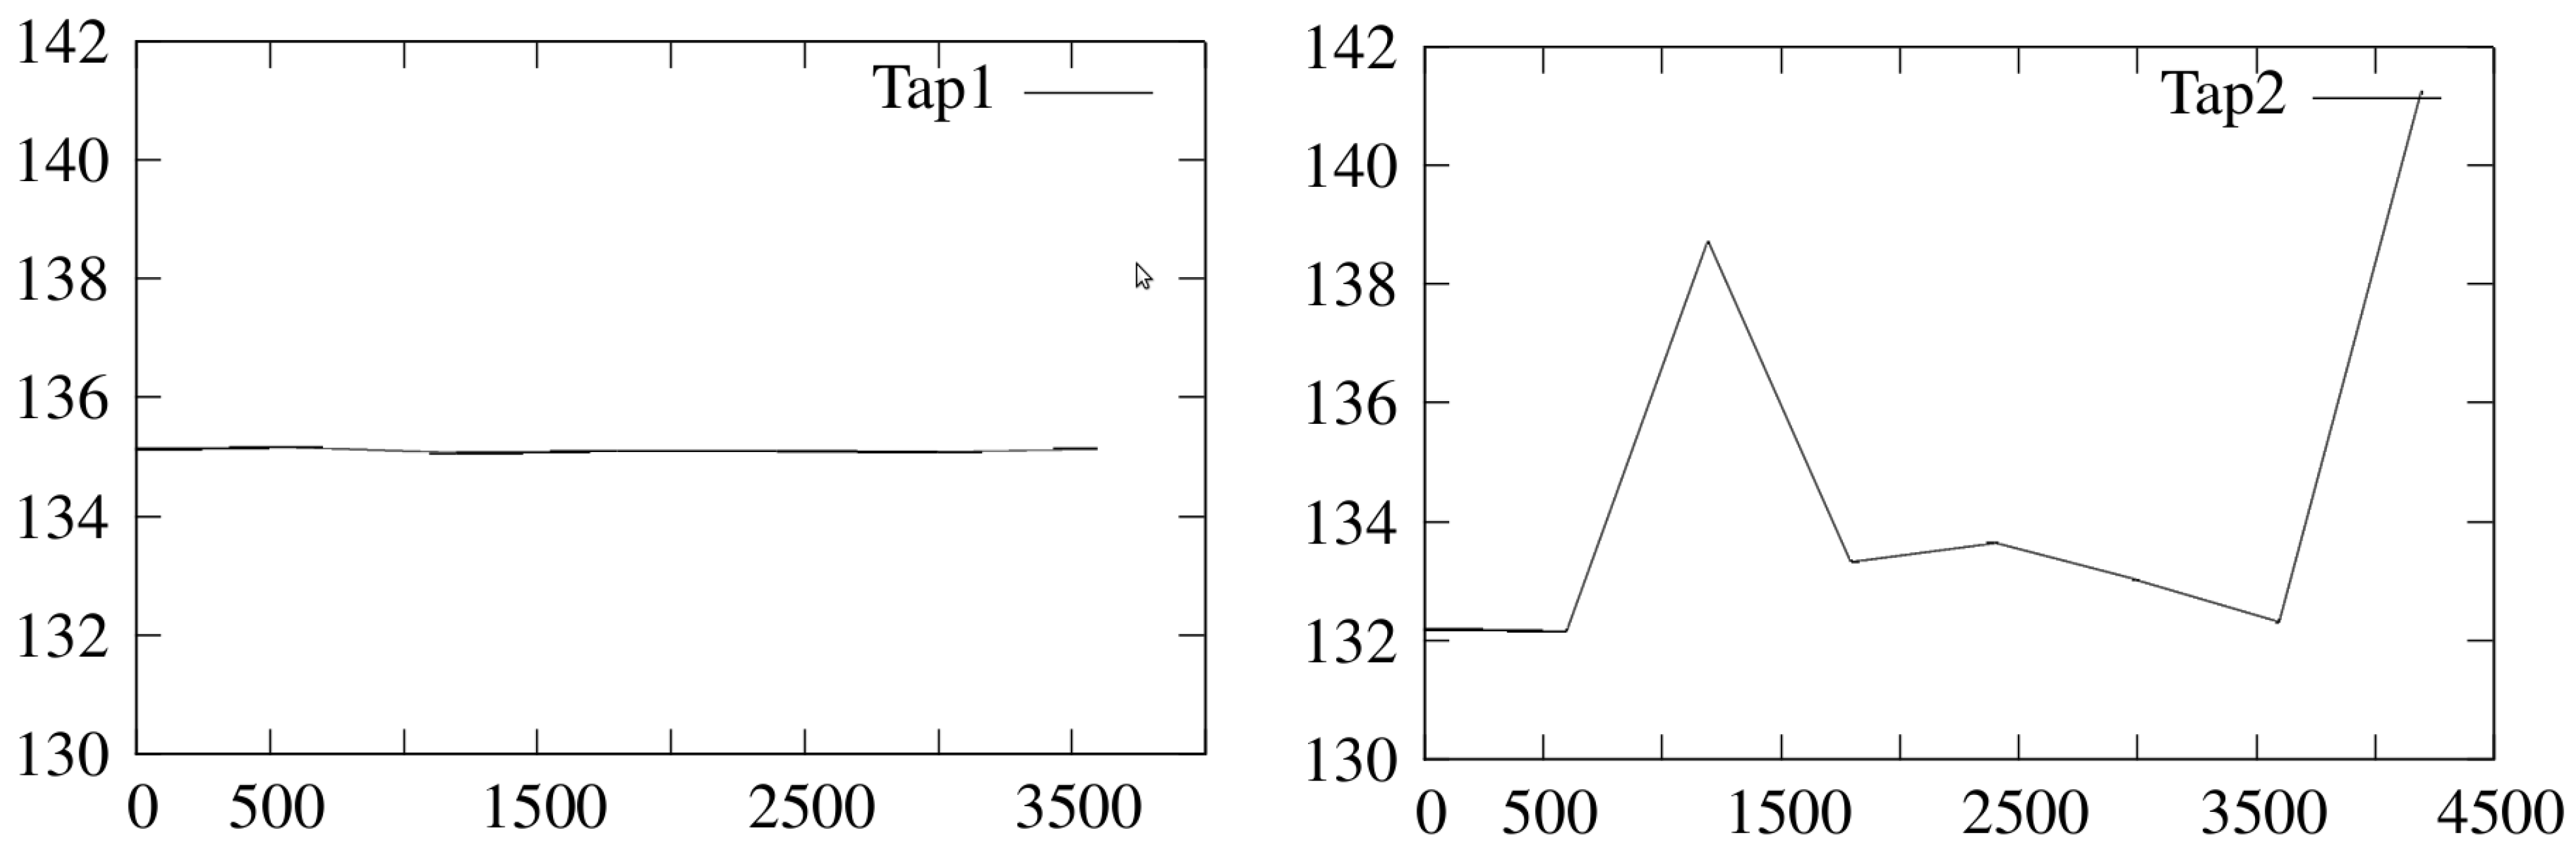
Figure 2.
Average packet sizes for the 600 s slices of packet capture from Tap1 and Tap2.
Figure 2.
Average packet sizes for the 600 s slices of packet capture from Tap1 and Tap2.
For the traffic recorded from Tap2, the total number of packets was 2,838,227 of which 3031 packets represented RAID controller traffic. 3223 connections were reported by Bro NSM of which again 3031 were RAID messages. For the duration of the packet capture and the location of the Tap2, 0.1% of the packets found in the network represented this type of unneeded traffic.
At a first glance, using Wireshark [
19], some very suspicious protocols were reported by the tool, such as eDonkey, a peer-to-peer protocol. However, after a short investigation, it was revealed that these very sporadic and sparsely appearing protocols were also in fact messages by Promise RAID controllers present in the network. This particular behavior by Promise RAID controllers turned out to be causing the false appearance of a number different protocols in Wireshark analysis. After weeding out the protocols caused by RAID controller messages, the list of protocols presented in
Table 1 remained.
No traffic in the network traces was found which would have been readily identified as being of a malicious origin. Hence all the traffic analyzed was assumed to be of benign origin, even if unnecessary or posing a risk. This assumption is critical for selection of possible features.
3.1.1. Protocols Presentation
The protocols listed in
Table 3 were found to be present in the network traffic. From some of the protocols several different versions were seen, such as was the case with IGMP. The data displayed a diversity in versions, a need for which was not immediately clear. For example the IGMP protocol traffic includes both versions 1 and 2. This coincides with our initial expectation that systems such as this that have been modified over a period of time include redundant versions of protocols that are either forgotten to be present in the network or kept for compatibility purposes due to old and non-updated systems.
Table 3.
Protocols seen in the traffic captures.
Table 3.
Protocols seen in the traffic captures.
| ARP | NBSS NetBIOS session service |
|---|
| CDP Cisco Discovery Protocol | NDPS Novell Distributed Print System |
| DCERPC | NetBIOS Name Service |
| DCOM OXID Resolver | NTP Network Time Protocol |
| DHCP | PARLAY General Inter-ORB |
| GIOP General Inter-ORB Protocol | RMI Java |
| HP Switch Protocol | RELOAD |
| HTTP | SMB |
| ICAP Internet Content Adaptation Protocol | SMB_NETLOGON |
| ICMP | SNMP |
| IGMP | SSDP |
| Intel ANS Probe | STUN Session Traversal Utilities for NAT |
| ISystemActivator | STP |
| LANMAN Remote Api | TCP |
| LLDP Link Layer Discovery Protocol | TPNCP TrunkPack Network Control Protocol |
| LLMNR Link-Local Multicast Name Resolution | UDP |
| Microsoft Windows Browser Protocol | VRRP Virtual Router Redundancy Protocol |
| MySQL | X11 |
| NBNS | |
3.2. Tools
For the analysis of the example traces in this paper we used tcpdump [
20], Wireshark [
19] and its associated tools, Bro Network Security Monitor (Bro) [
21,
22] version 2.1. During the initial investigations Netmate and NetAI as bundled in [
23] were used as well.
Netmate and NetAI were used to calculate flow statistics from the traffic captures to aid in the initial analysis of the packet capture data. At a later stage Bro was mostly used for generating the connection information and the usage of Netmate and NetAI was dropped.
Tcpdump was used to capture and manipulate the traffic from the test network depicted in
Figure 1. As the monitoring setup produced various packet capture files, we merged them in a bi-directional traffic file.
Wireshark, tcpdump and the included tools were used for calculating the statistics depicted in
Table 2,
Table 1 and
Figure 2 and deriving the protocol list in
Table 3. Wireshark and Tcpdump were also both used to investigate trace contents manually. This revealed additional information to the automatic analysis e.g. transmission of control information in plain text format.
Bro was used mainly to produce connection, domain name system and weird traffic logs in its network traffic analysis framework capability. Both the connection and domain name system logs proved very informative and would possibly be useful even without the added configuration of site-specific security policies written in the provided scripting language. The number of connections in
Table 1 reflect Bro interpreting UDP and ICMP flows as pseudo-connections, based on its own internal logic [
22].
The weird traffic log produced by Bro informed that the communication was triggering weird behavior events and would benefit from a closer look. The triggered weird events were of the following types listed below. Their cause and effect warrant further investigation into the network and its functionality, but is not in the scope of this paper. The events were:
| non_IPv4_packet | truncated_IP |
| above_hole_data_without_any_acks | connection_originator_SYN_ack |
| possible_split_routing | data_before_established |
| DNS_label_len_gt_pkt | DNS_truncated_ans_too_short |
3.3. Features
In the paper [
2] a selection of 12 features useful for machine learning approach to network security monitoring in ICS network were discussed.
We reviewed these potential features against the findings of the network traffic analysis with mixed results. Some of the features were applicable for this particular network, some decisively not, whilst the feasibility of some remained uncertain. We chose to split the longer packet captures into 600 s slices for simple statistical analysis. The selection of exactly 600 s was arbitrary, and other intervals could have been chosen.
3.3.1. Throughput
Feature feasibility: Stability of throughput is typical for ICS networks. Changes in throughput can be used to detect high traffic events (scanning, DoS, malfunction). Attacks with low traffic requirements are not detectable with monitoring throughput.
Our data: The average packet rates and sizes in both recording locations are depicted in
Table 2. From these it appears that there is some fluctuation in both locations within the total recording interval. Longer period of traffic recordings could provide us with further insight, but from this data it is difficult to assess whether the average packet rate would be usable.
3.3.2. IP Address—Port Pairs
Feature feasibility: In ICS networks that use static IP allocation, IP address—port pairs are expected to remain constant: appearance of new IP-port pair indicates a new service being started on the system containing the IP.
Our data: The initial and most simple features that would be usable are the address pairs of connections or packets consisting of source and destination internet protocol addresses and ports. This is simple to achieve and in a static environment would quickly bring to fore any sudden new addresses appearing.
Strong multicast environment poses real challenges for using IP – port pairs, as the multicast protocol obscures the destination data. However even in this environment, tracking IP – port pairs highlights the atypical unicast flows.
3.3.3. Average Size of Packets
Feature feasibility: Average size of packets is another good network behavior indicator. Many device level systems with high real time requirements send packets without extra buffering creating distinct average size statistics for these networks. In many networks the average size of packets can be considered to be a good indicator of normal behavior.
Our data: Average size of the packets looks like a feasible feature in the context and time frame of the packet captures. When the trace files where split into 600 s slices and further analyzed, it was clear that there was minimal fluctuation in the Tap1 recording which was not exposed to traffic coming and going to the office side. In the
Table 2 we can see that the Tap2 has a wider fluctuation in the average packet size and data rate. Average packet size over the total duration of both packet capture files can be found in
Table 1 Should the stability of the average packet size persist for longer periods of time as well during nominal operation of the ICS network, we argue that either increases or decreases in this value could signal an anomalous situation. Average packet sizes are visualized in
Figure 2 which clearly shows the difference in the variance of average packet sizes.
3.3.4. Timing
Feature feasibility: Packet timing and interval between packets from a network node is meaningful data for many ICS networks. The strict real time requirements of the system, especially in the device level of the network, make the timing statistics of the traffic stand out from typical application traffic.
Our data: We analyzed packet intervals and timing of packets. The packet intervals had great variation and showed no simple patterns or regularity. No patterns or useful behavior was detected in packet timing. Analysis of the most active network nodes showed no exploitable characteristics in individual systems packet intervals. Further analysis is required for usability of timing features, especially for single network nodes.
3.3.5. Flow Direction
Feature feasibility: Flow direction indicates which system initiates the connection. For typical operation, the flow is initiated by one system, requiring a service, after which the amount of data sent from one system to the other is likely to be predictable, especially when the service in question is known. Variance in this behavior indicates abnormal behavior.
Our data: In our samples, the usage of a multicast protocol makes it impossible to group messages to “conversations" as with unicast protocols. The destination data is a multicast address, not an IP address of a system.
3.3.6. Flow Duration
Feature feasibility: The duration of flow is typically the TCP session length. It represents the amount of time, that a system or service requires to conduct it’s network functions with it’s destination system. As the number of services in industrial network nodes is limited, the duration of flows is deemed to have little variance.
Our data: With multicast protocol, the flow duration could not be meaningfully used, and is not a plausible detection feature in the network under scrutiny.
3.3.7. Payload Form
Feature feasibility: Payload of packets for applications in a ICS environment are often strictly defined. The changes in payload form indicates a change in system behavior.
Our data: Analysis on the feasibility of payload form require further work.
3.3.8. Payload Data
Feature feasibility: Payload data can be used to detect misconfigured systems or malicious actions. Payload abnormalities are a good sign for detection. The usage of default user credentials should be avoided in an ICS network. This enables the detection of systems trying out default credentials as a first line of attack. Detection also exposes poorly configured legitimate systems.
Our data: Simple string detection discovered no flagrant default usage of most typical usernames and passwords in our traffic, but more work is required for a meaningful assessment of the feature. Analysis however detected both confidential data and data useful for attacker for identifying both network and SCADA hardware.
3.3.9. MAC—IP Mapping
Feature feasibility: MAC to IP mapping can be used in any LAN to detect changes in hardware components. The appearance of new MAC indicates that new hardware has appeared in the network. While MAC addresses can be forged, they are still usable for impersonation detection. It also helps the ICS network operator to be aware of all legitimate hardware in the system.
Our data: No MAC to IP mapping anomalies were detected in the traffic.
3.3.10. Network Protocol
Feature feasibility: The protocols used in the ICS network should be strictly defined and limited. Appearance of new protocols in the traffic indicate serious change in the network. If the networking protocol is identified using only port number, as is typical with Wireshark, the detection may be incorrect. Many systems use non-standard port addresses to conduct their network activity.
Our data: Network protocol using port numbers was not a feasible feature in this environment. The Promise RAID controller messages render it difficult to use as explained earlier in
Section 3.1. More advanced protocol identification might change the feature to be highly usable.
3.3.11. Protocol Settings
Feature feasibility: The protocols settings used in ICS networks are typically static, selected to guarantee the best performance of the ICS network. Monitoring the protocol settings of used protocols will detect misconfigured services and malicious activities.
Our data: The feasibility of protocol settings as a feature requires further research.
3.3.12. Connectivity Number
Feature feasibility: The number of connections for different systems is very static in most ICS networks. This depends widely on the role of the node.
Our data: Connectivity numbers are not usable in the network under scrutiny as the usage of multicast obscures the destination of data.

