1. Introduction
In certain scenarios, a 3G femtocell, Home Node-B (HNB) in 3GPP terminology, is a cost-effective alternative to providing indoor coverage compared to outdoor high power base stations [
1]. Furthermore, for incumbent operators with very limited spectrum resources and a great amount of fixed network installations, HNBs may be used to roll out significant cellular capacity. For such deployments, HNBs and wide area macro Node-Bs (MNB) often will need to co-exist in the same frequency band. This is the most challenging deployment scenario and therefore the one considered in this paper. For the co-channel case, a tradeoff among protecting macro users and boosting femto performance must be found, see e.g., [
1,
2,
3,
4] and embedded references. However, the proposed scheme also offers benefits for HNBs deployed on a dedicated carrier.
We consider both cases when the HNB is configured for open or closed subscriber access (OSG and CSG). While provisioning is equally important, some interference aspects are relaxed in the OSG case. However, even when HNBs are configured for open access by all macro users, their potential configuration and density can still pose a risk to e.g., macro uplink. For other considerations related to mobility performance and the recommended use of reserved macro-only carrier, the reader is referred to [
1].
Besides the physical deployment aspects, operators that deploy HNBs also have a sales and provisioning strategy that is based around the service level agreement defined with the end-customer. As examples, 3G HNB may be deployed as a voice coverage solution which supplements a parallel Wi-Fi solution for data, or it may be provisioned as a stand-alone mobile broadband solution. Any provisioned solution must fulfill end-customer requirements and at the same time meet operator requirements related to wide area performance, including robustness and data offload effect.
In this paper, our ultimate goal is to explore the extent possible for autonomous QoS (quality of service) self-provisioning and interference management. A key aspect which will receive continued growing research interest to drive down deployment cost of dense small cell networks in the future. Specifically, and from an operator’s viewpoint, we want to clarify if it is possible to control deployment by means of distributing only intuitive deployment parameters such as guaranteed coverage (in meters or dB) and downlink and uplink data rates for anyone connected to the 3G HNB. To do so, we make use of a light-cognitive element of the 3G HNB; e.g., the simple built-in user equipment (UE) receiver module that can be used to sense the surrounding network. This module enables what is known as network listen mode (NLM) [
1]. We want to see if by conducting advanced processing enabled by NLM we can ensure that deployed and uncoordinated HNB can fulfill the service level agreement while at the same time self-minimizing dead zones and remaining within an allowed interference budget to protect the wide area uplink performance.
For 3G HNBs, 3GPP does not specify interference management and provisioning techniques and these are left for proprietary implementation and thus an object for extensive research. Most common reference assumptions, also applied as references throughout this paper, is a full-power transmit mode as well as an interference management solution standardized for LTE but adapted for 3G here [
1]. Other research has pursued similar goals and considered interference management tradeoffs in co-channel deployments, ranging from general analysis in e.g., [
2,
5] to practical schemes that utilize NLM measurements combined with UE measurements in e.g., [
6] and uplink measurements in e.g., [
7] to gain more knowledge of the local deployment conditions prior to optimization. Closed-loop methods between macro and small cell layer have been considered to adapt uplink power control settings [
8,
9]. As such, the method in [
9] uses micro economic techniques to distribute feasible signal to interference and noise ratio (SINR) targets to femtocell optimizing overall network utility. However, in our work we focus on autonomous self-provisioning to avoid fast feedback mechanisms between the layers that can track the variations in user load as this is typical assumption to lower overall deployment costs. Furthermore, we are concerned with absolute QoS targets as this relates closely to end-user perception as well as agreements made between operator and said end-user. In addition, the method documented in this paper differentiates itself by (1) joint optimization of downlink and uplink interference parameters; and by (2) enabling an operator-controlled tradeoff among absolute setting for coverage and capacity in the femtocell according to service level agreement with end-users. Here we focus on the initialization of the HNB parameters but the approach can be combined effectively with e.g., time variant learning methods employing e.g., measurements from user devices similar to e.g., [
2,
6].
The paper begins with a description of the system model after which the autonomous QoS self-provisioning and interference management concept is introduced. Next, simulations are used to prove the validity of the concept and understand sensitivity to key system parameters. A key challenge surrounding any theoretical or analytical work regarding small cells are the uncertainties related to propagation and interference paths in indoor/outdoor co-channel deployments. Hence, we next show a partial verification of the noise rise estimation and femto coverage estimation of our concept obtained through practical field trials after which conclusions are drawn.
2. System Model and Design Objective
The assumed system model is based on the 3GPP defined High Speed Packet Access (HSPA) system [
1,
10], assuming co-channel deployment of all cells on a single carrier of 5 MHz bandwidth. A regular hexagonal grid of three sector macro base station sites is assumed as shown in
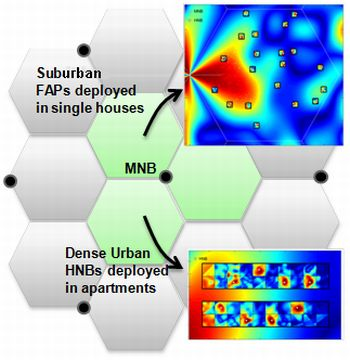
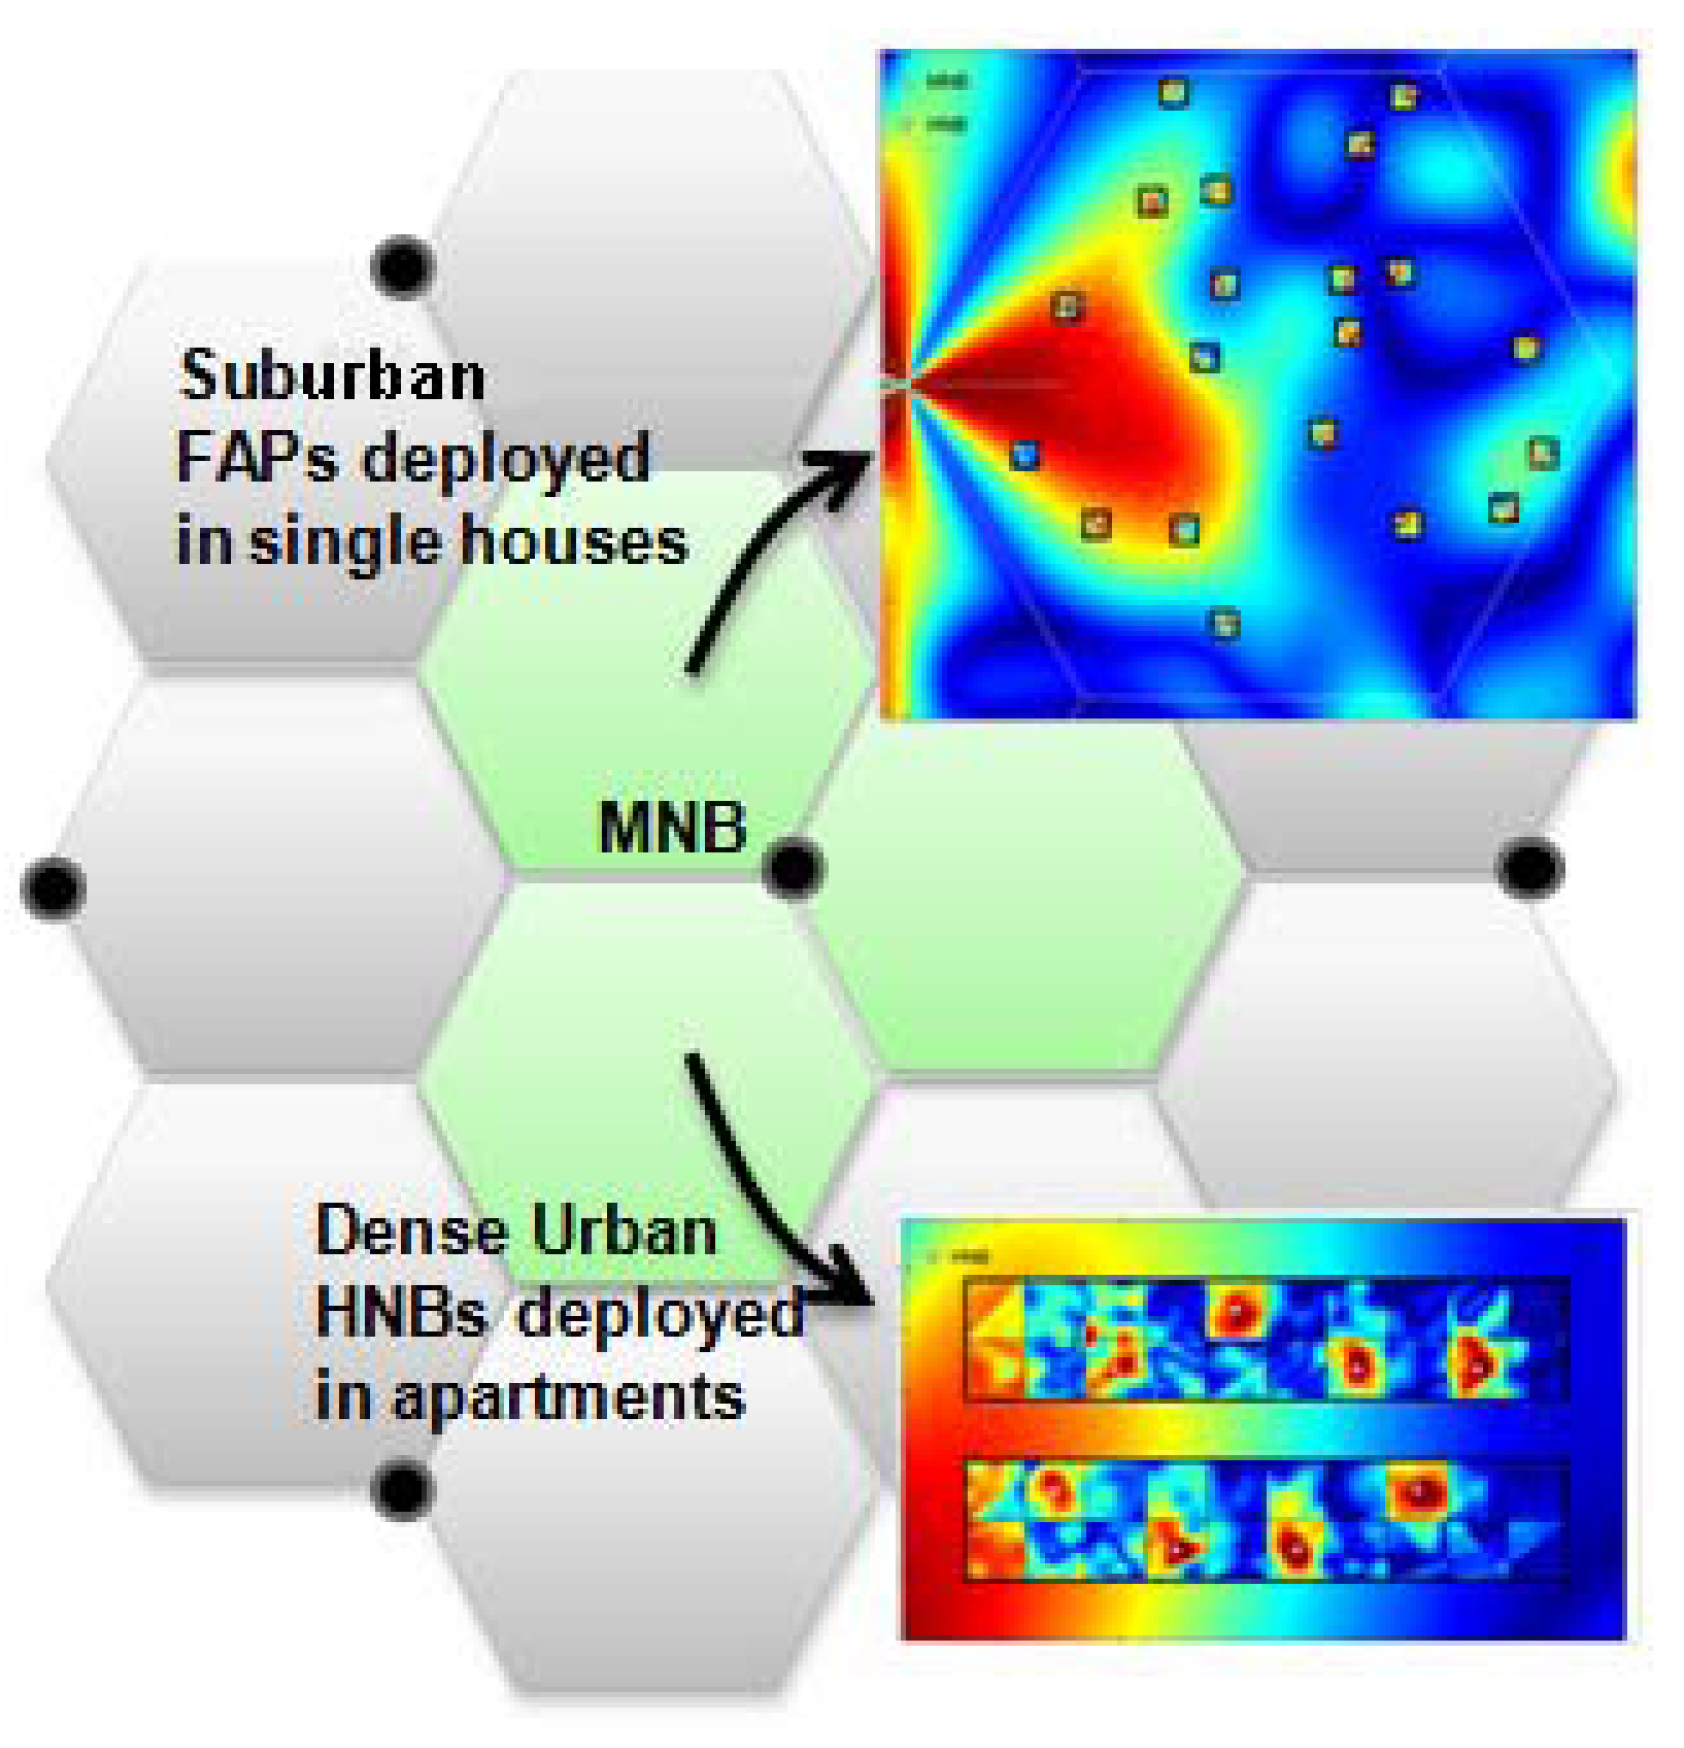
Figure 1, each having a downlink transmission power of 43 dBm per cell and a 14 dBi antenna gain. For the sake of simplicity, the MNBs are assumed to always transmit at their maximum power level with a constant transmit power for the primary common pilot channel (P-CPICH). In addition to the macro-layer, HNBs are deployed across the network area according to two basic deployment strategies: either in houses (suburban) or in apartments (dense urban). This system model provides some variability due to its indoor propagation model (based on indoor distance and internal walls). Moreover, the shadowing model ensures that there is variance between the effective propagation loss a femtocell connected user experiences to the nearest macro base station and the estimated propagation loss using the NLM method at the HNB.
Each HNB is serving a single cell with two 0 dBi omni directional antennas. The maximum HNB transmission power is assumed to be 15 dBm. Via NLM operation, the HNB is able to perform measurements in the downlink transmission band, including (i) received signal strength indicator (RSSI); and (ii) received signal pilot code power (CPICH RSCP) from other transmitting cells in the vicinity [
11]. Serving cell selection for each UE is based on UE measurements of RSCP,
i.e., the UE connects to the cell with strongest RSCP. A UE connected to an HNB is denoted an HUE and a UE connected to a MNB is denoted an MUE. When simulating with CSG HNBs, only UEs with matching CSG identity are allowed to connect. In this context, we consider any UE within an apartment or a house with an HNB to be part of the CSG, whereas any user outside of this space is unable to access the HNB. In the OSG case, there are no restrictions.
Figure 1.
Basic simulation model with hexagonal macro area and HNBs deployed in either single houses (suburban) or in apartments of three-floor buildings (dense urban).
Figure 1.
Basic simulation model with hexagonal macro area and HNBs deployed in either single houses (suburban) or in apartments of three-floor buildings (dense urban).
We include common channels such as the P-CPICH, the high speed shared control channel (HS-SCCH), as well as the high speed downlink shared channel (HS-DSCH) in our modeling. The HS-DSCH is a time-domain shared channel with hybrid automatic repeat request (H-ARQ) and fast modulation coding, ranging from QPSK with high effective coding rate to 64QAM with low effective coding rate. Assuming up to 15 high speed physical downlink shared channel (HS-PDSCH) codes, the maximum downlink data rate equals 21.1 Mbps [
1]. Each UE is assumed to be equipped with two uncorrelated receive antennas, using a standard linear minimum mean square error (MMSE) receiver. The packet scheduling is round robin type. For more information on downlink fast link adaptation and packet scheduling, the reader is referred to [
1,
12,
13].
Contrary to the downlink, the uplink uses dedicated channel transmission for each UE with fast closed loop power control with a 1.5 kHz command rate. The maximum UE transmission power equals 24 dBm, with the possibility for the network to configure lower maximum output power for some UE (also known as configuration of UE power capping) e.g., HUEs. Uplink reception is based on two receiver antennas with MMSE. The uplink packet scheduler is a standard best effort [
1]. For the MNB, the scheduling is furthermore subject to a maximum uplink noise rise (NR) target, as well as minimum data rate per user. The NR is defined as the total received power divided by the thermal noise power [
1], assuming a NR target of 6 dB for the MNB.
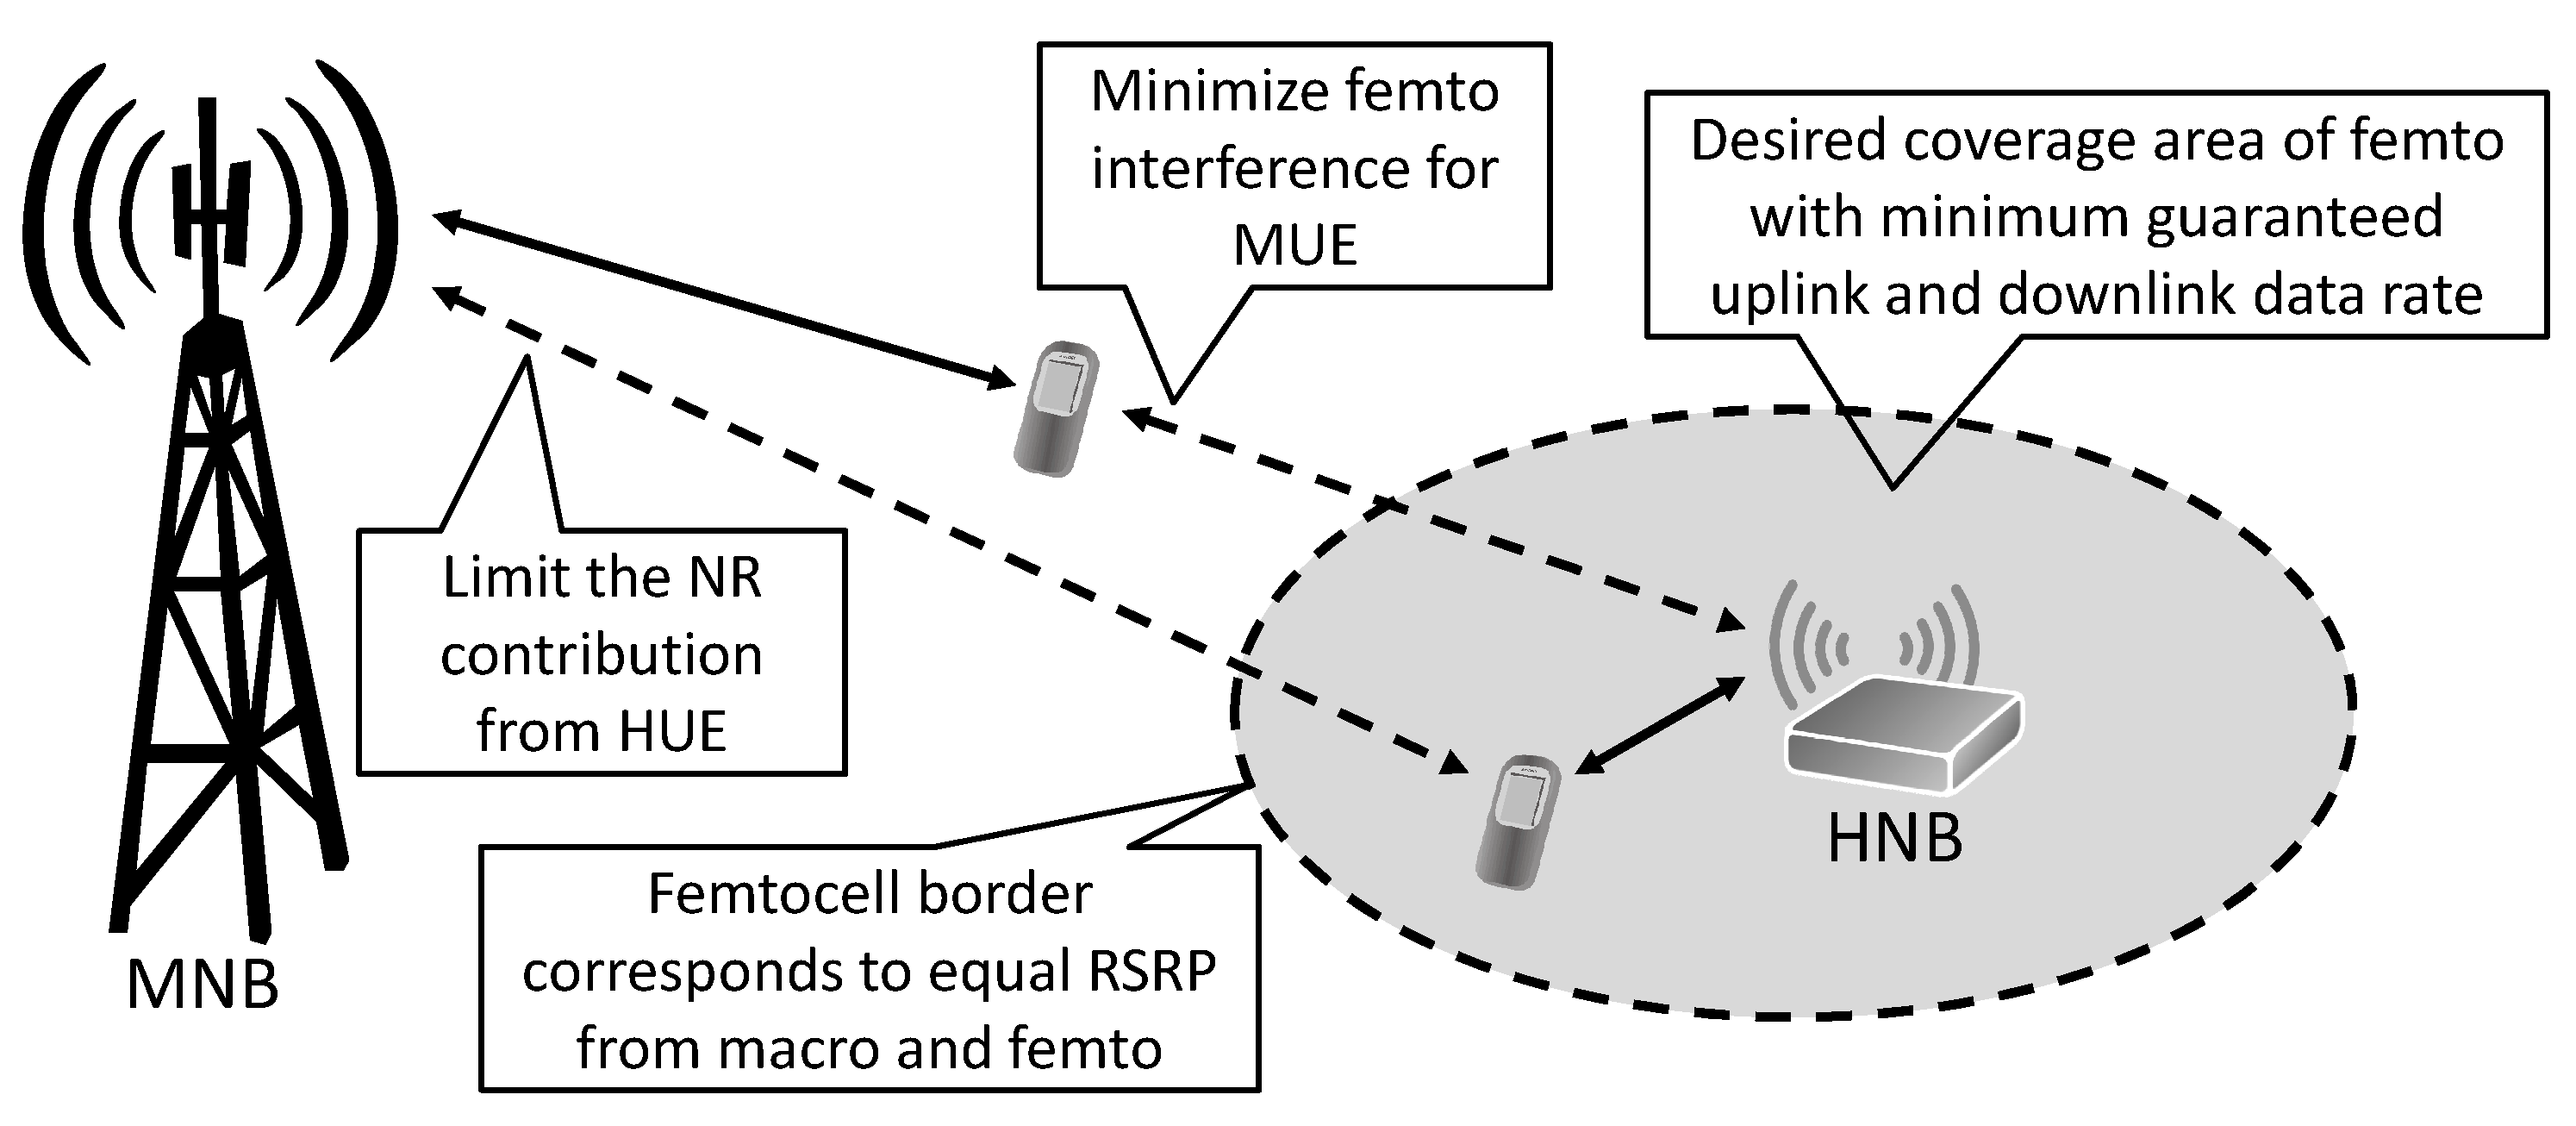
The overall design objective is summarized in
Figure 2. for a simple example with co-channel deployment of MNBs and HNBs, each serving one user. The objective is to adjust the HNB transmit powers of P-CPICH and HS-DSCH, as well as the HUE maximum transmit power, subject to the desired design criteria. The assumed design criteria in this study are the following:
- (i)
The femtocell coverage area shall correspond to
![Futureinternet 05 00168 i001]()
;
- (ii)
HUEs shall be offered a minimum data rate of
![Futureinternet 05 00168 i002]()
and
![Futureinternet 05 00168 i003]()
for the downlink and uplink, respectively, in the entire home/apartment of the end-user.
![Futureinternet 05 00168 i002]()
and
![Futureinternet 05 00168 i003]()
are planning parameters;
- (iii)
The generated uplink NR at the nearest MNB from each HUE must be limited to
![Futureinternet 05 00168 i004]()
.
![Futureinternet 05 00168 i004]()
is a planning parameter that depends on the HNB density and the expected offload effect (for instance
![Futureinternet 05 00168 i005]()
divided by maximum number of simultaneously active HNBs per macrocell area);
- (iv)
After fulfilling the above requirements, the generated HNB interference towards the macro UEs shall be minimized (save power, improve macro performance).
Figure 2.
Overview of system model and design objectives.
Figure 2.
Overview of system model and design objectives.
In this paper, the femtocell coverage area is defined as the area where the RSCP of the specific femtocell is higher than the RSCP for all other cells. Even though only a single HNB is shown in the above figure, our proposed algorithm is not limited to the single HNB case. It is an advantageous design choice not to consider inter-HNB interference when calculating the HNB powers, as this prevents HNBs from entering a transmit power race where strongly coupled HNBs keep increasing the total transmit power. Such an event would not improve the target performance indicators in the region between the competing femtocells, but would in turn result in increased interference towards the macro network and, thus, lower the overall utility of the network.
Depending on the radio and interference conditions, it may be impossible to fulfill all of the listed design criteria. As an example, if the HNB coverage area is close to the MNB, fulfilling both the requirement on HUE uplink data rate and maximum generated NR towards the macro may be conflicting. In case of such conflicting requirements, it is considered most important to protect the macro performance. The interference management algorithm for dealing with these issues is derived in
Section 3.
Table 1 lists the parameters used in the derivation of the interference management algorithm in
Section 3.
Given the outlined design objectives, the key performance indicators (KPI) considered in this study are user experienced throughput in uplink and downlink, as well as the corresponding outage probabilities for experiencing data rates below certain targets. Such information is extracted from an empirical cumulative distribution function (cdf) of user data rates, obtained from extensive Monte-Carlo simulations. We also consider the transmission power aspects, both in terms of downlink transmission powers from the HNBs, as well as HUE uplink transmission powers.
Table 1.
List of used notation in the derivation of the proposed algorithm.
It is noted that the setting of the parameters depends on the deployment conditions and the provisioning strategy of the operator. We provide some examples in
Table 2 of how the algorithm can be configured for various deployment use-cases.
Table 2.
Hypothetical deployment scenarios and how they are controlled by algorithm parameters.
Table 2.
Hypothetical deployment scenarios and how they are controlled by algorithm parameters.
| Deployment goal | Access | ![Futureinternet 05 00168 i029]() | ![Futureinternet 05 00168 i030]() | ![Futureinternet 05 00168 i031]() |
|---|
| Rural voice service (safety) | OSG | Infinite | Mainly voice, e.g., 256 kbps | Mainly voice, e.g., 256 kbps |
| Rural voice service (safety) | CSG | According to SLA, building/area know-how | Mainly voice, e.g., 256 kbps | Mainly voice, e.g., 256 kbps |
| Urban voice service | CSG | According to SLA, building know-how | Mainly voice, e.g., 256 kbps | Mainly voice, e.g., 256 kbps |
| Data service | CSG | According to SLA, building know-how | According to SLA, e.g., 1 Mbps | According to SLA, e.g., 512 kbps |
3. QoS Self-Provisioning and Interference Management Concept
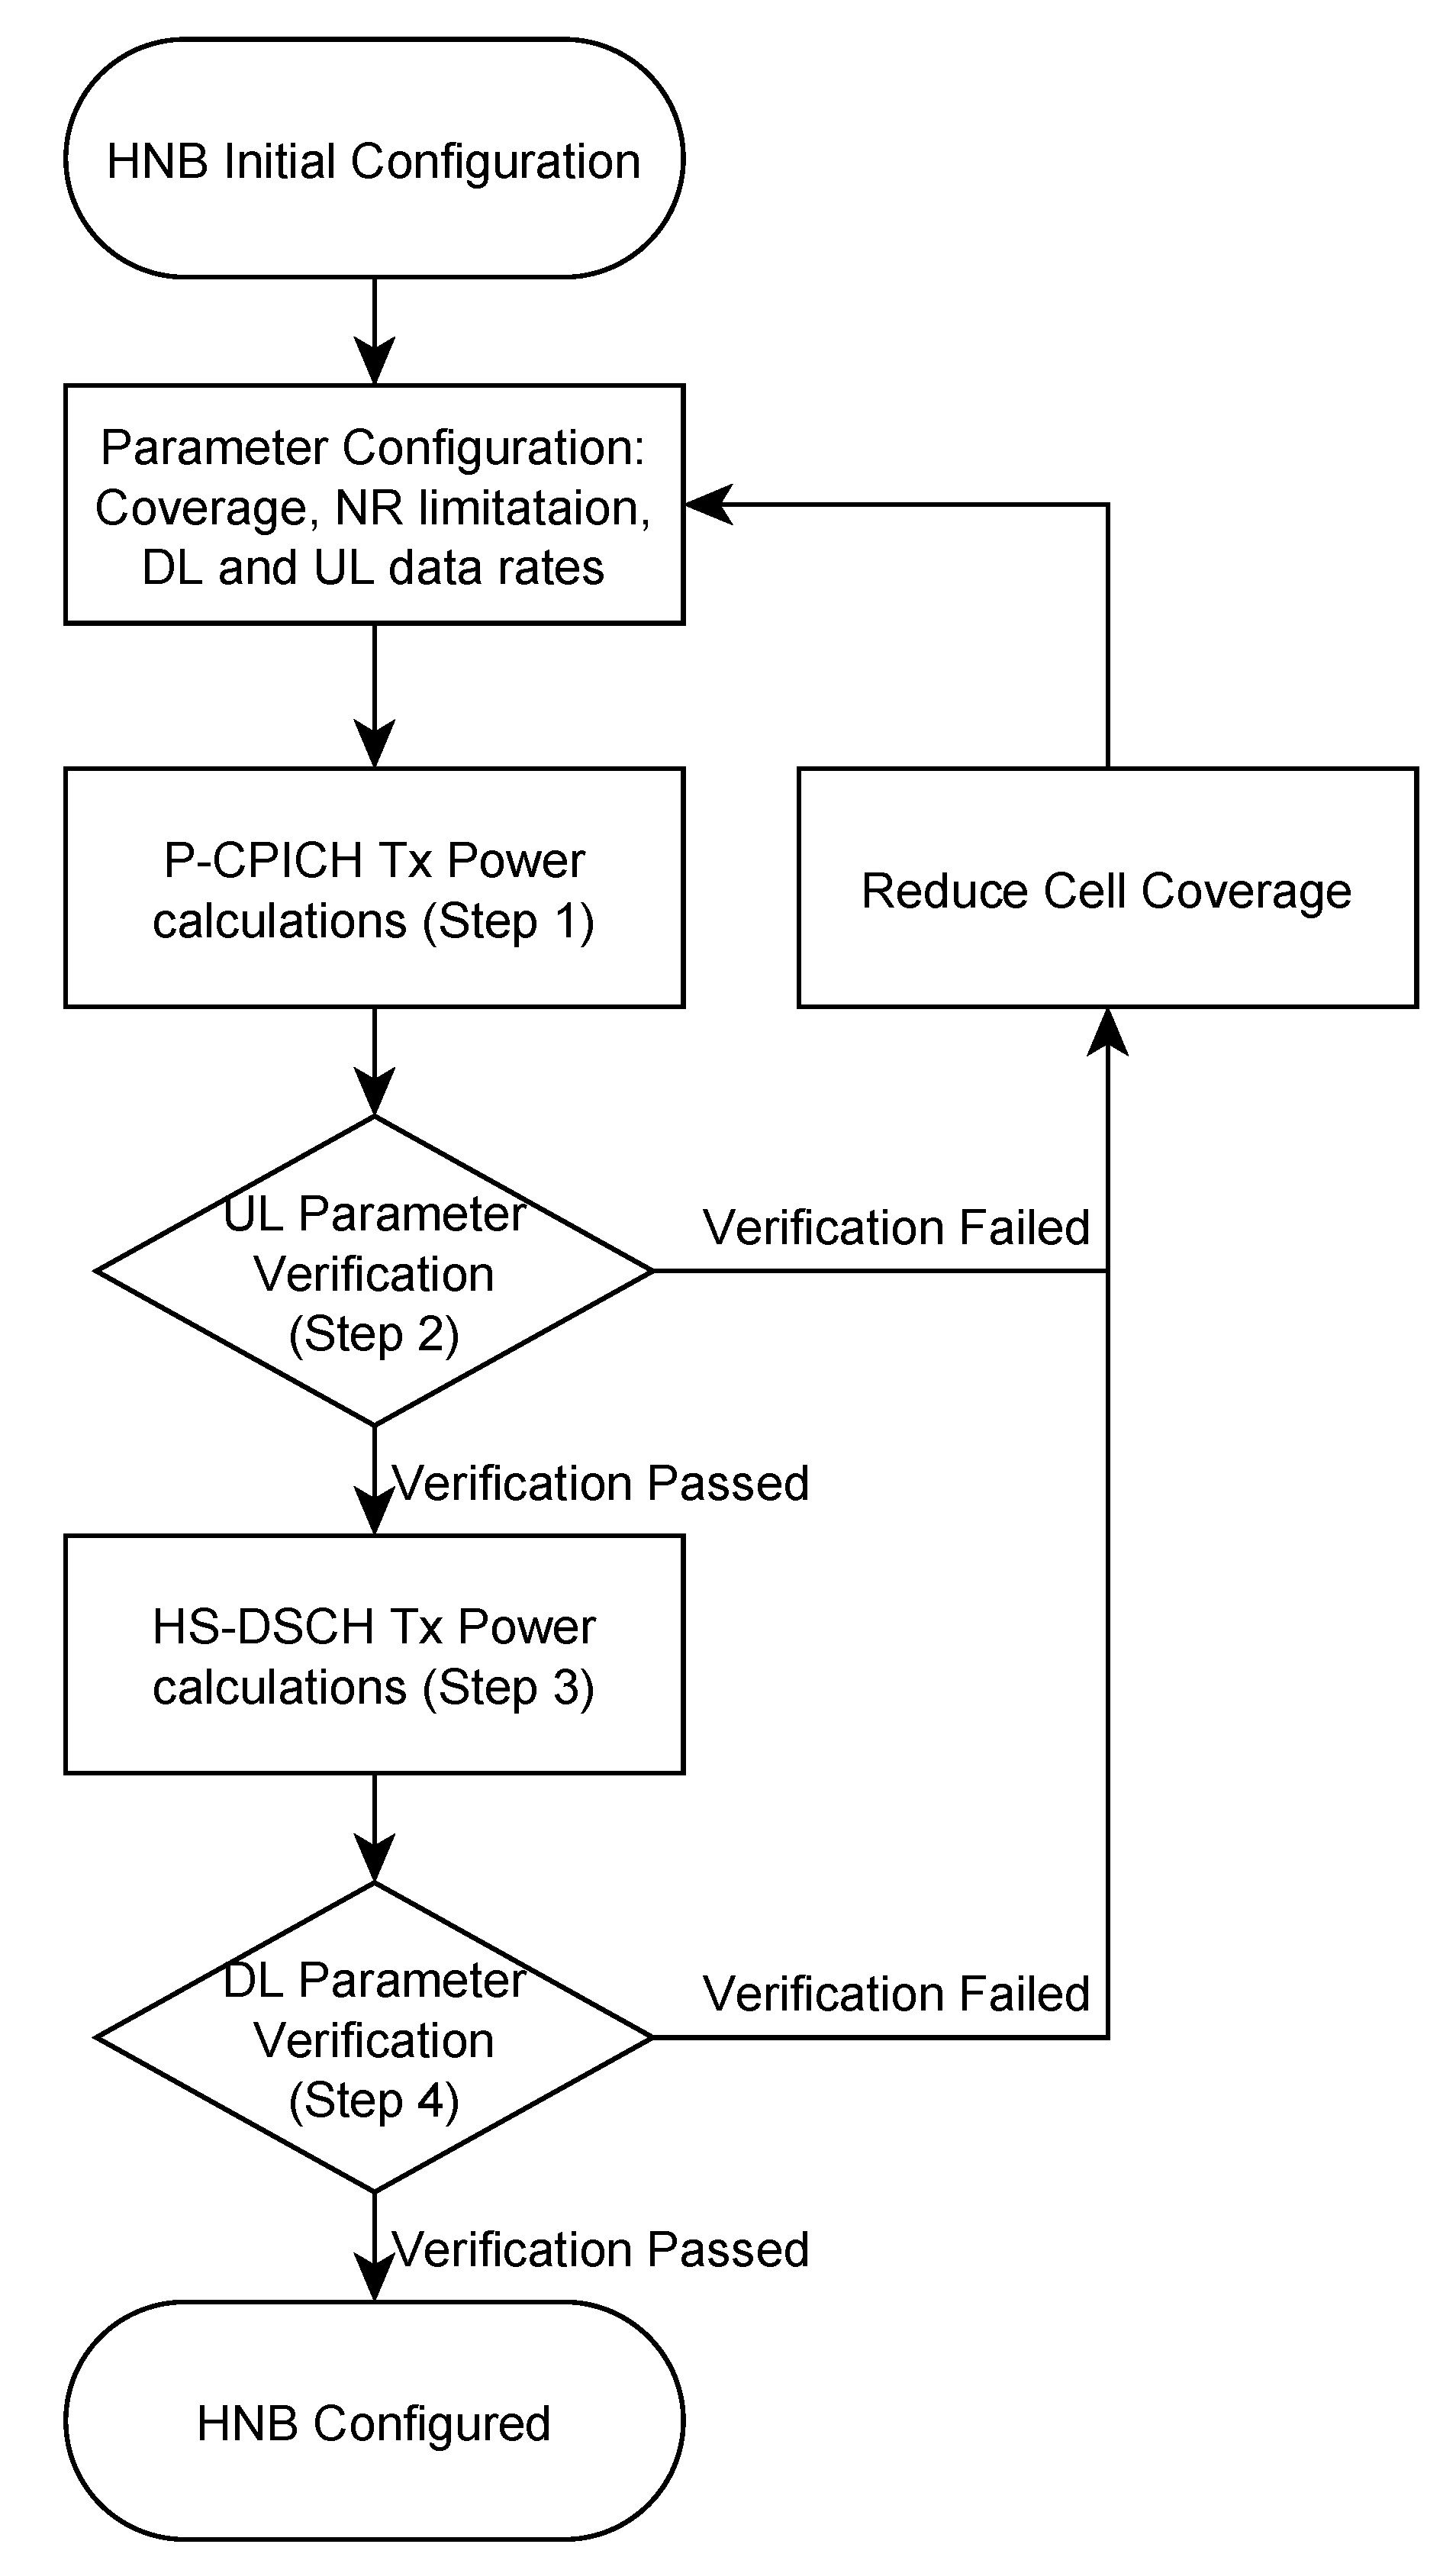
The high level diagram and algorithm flow of the proposed quality of service self-provisioning and interference management (QoS-SP-IM) concept is presented in
Figure 3.
Figure 3.
High level overview of the QoS self-provisioning and interference managing algorithm.
Figure 3.
High level overview of the QoS self-provisioning and interference managing algorithm.
The overall solution design includes four execution steps in order to configure the HNB. First of all, the P-CPICH is calculated with respect to the coverage requirements and the surrounding macrocell radio frequency (RF) environment in Step 1. In Step 2, the HUE power calculations are performed. All UL traffic in the overlaying macrocell is assumed at the femtocell edge and the corresponding interference towards the HNB can be computed. From this it is possible to configure the HUE power to meet the UL required throughput target. Moreover, it is checked if the NR from HUE exceeds the limit. If the NR limit is exceeded, the femtocell coverage area is reduced and the CPICH calculations in Step 1 are reiterated. If uplink verification is passed, the HS-DSCH transmit power is configured in Step 3. The HS-DSCH is configured such that end-users get the targeted downlink data rate, without exceeding it at the femtocell edge. Thus, the leakage to other base stations is effectively controlled. Finally, downlink requirement verification is performed in Step 4. Both the HUE coverage area and the HUE downlink data rates are checked. If not passed the HNB coverage area must be reduced and the CPICH power calculations in Step 1 are reiterated.
If the target requirements cannot be fulfilled in a real life deployment (e.g., the femtocell coverage is smaller than desired or target throughput rate not met), a warning report is generated and transferred to the operation and the maintenance system. Further development of the algorithm include dynamic power control based on UE feedback, however, the aim of this paper is the initialization of HNB power parameters.
3.1. Step 1—The P-CPICH Power Calculations
In order to determine the optimal P-CPICH transmit power,
![Futureinternet 05 00168 i032]()
, both the RSCP measurements at the HNB towards the strongest co-channel MNB,
![Futureinternet 05 00168 i033]()
, and the desired femtocell coverage range,
![Futureinternet 05 00168 i034]()
, are used. Optimal P-CPICH transmit power means configuration of pilot channel power in order to be able to obtain the required femtocell range. This range is defined where the users exactly sees the same RSCP from the target femtocell and from the nearest undesired cell (macrocell). We therefore estimate the required P-CPICH transmit power as
3.2. Step 2—Uplink Parameter Verification
Next, it is assumed that a single virtual MUE representing all uplink traffic generated towards the overlaying macrocell is located just outside the femtocell coverage. Such a case corresponds to the situation where the HNB is exposed to the highest possible uplink interference from overlaying MUEs, hence it is the worst-case scenario. This step is necessary to properly evaluate the dependencies between pilot channel configuration and uplink QoS agreed between end-user and an operator. Secondly, it is assumed that the femtocell boundary is a single apartment or house. The path loss from MNB to HNB can be computed from the known macro CPICH power and the measured macro RSCP at the HNB. Therefore, in order to estimate the path loss from MNB to MUE, and according to the assumptions the virtual MUE is located at femto cell edge and outside the building, the path loss from MNB to MUE,
![Futureinternet 05 00168 i036]()
, is described as
where
Lp is the external wall penetration loss and
![Futureinternet 05 00168 i038]()
is the common pilot channel transmit power of the surrounding macro. The external wall penetration loss is included here since we assume that the desired femtocell coverage area is confined to the indoor space. If the femtocells are installed outdoor with a certain desired coverage area, the value of
Lp should be set to 0 dB.
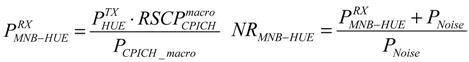
This virtual MUE is having a transmission power in the way that it contributes to the full macro-layer noise rise within its own macrocell. The total power from this virtual MUE received at the nearest macro is thus calculated taking into account the allowed NR and the NR consumed from othercell interference, which is not mapped into the virtual MUE. The received power at the nearest macro from the virtual MUE can thus be estimated as
where the constant
![Futureinternet 05 00168 i040]()
is the thermal noise power measured at the MNB which equals −102.7 dBm. The parameter
iF represents the other macrocells interference to own macrocell interference ratio and is further described in [
1]. Knowing the path loss from the virtual MUE to the MNB as well as an assumed fading margin,
![Futureinternet 05 00168 i041]()
, needed to accommodate the expected fading observed by the MUE, we get to the final expression for virtual MUE transmit power as
The transmission power of the virtual MUE has a significant impact on the interference reception at the HNB and has an influence on the transmission power of the HUE in order to guarantee a certain femto uplink performance. Still assuming the virtual MUE being located just outside the femto house/apartment received power from the virtual MUE at the target HNB,
![Futureinternet 05 00168 i043]()
, is computed as
Not only does the virtual MUE cause interference at the HNB, also MUEs connected to other macrocells create interference to the HNB as the virtual MUE only represents the UL traffic for the overlaying macrocell. Therefore, the received power at the HNB from other MUEs is also calculated,
![Futureinternet 05 00168 i045]()
. Knowing the other to own macrocell interference ratio, the thermal noise power and the allowed noise rise for macrocells,
![Futureinternet 05 00168 i045]()
is calculated as
In addition, the total received power at the HNB,
![Futureinternet 05 00168 i047]()
, is a sum of all observed interferer and noise powers,
i.e.,
Knowing the total received interference and noise power at the HNB it is possible to calculate the required transmission power of the HUE,
![Futureinternet 05 00168 i049]()
, to satisfy the required uplink data rate at the cell border:
where sinr(...) is a mapping function from required uplink data rate to required SINR.
Next, the NR generated by the HUE towards the nearest MNB is checked. Based on the assumption that the path loss from the MNB to any location inside the femtocell equals the path loss from MNB to HNB, the HUE generated noise rise,
![Futureinternet 05 00168 i051]()
, is calculated as:
where
![Futureinternet 05 00168 i054]()
is the received power from HUEs at the strongest MNB and
![Futureinternet 05 00168 i051]()
is the NR contribution from HUEs transmitting with required minimum uplink data rate. Moreover, it is checked whether the generated NR is within the allowed target
If the NR from HUEs exceeds the NR target, the femtocell range is reduced according to the following iterative expression
where ∆
step is the reduction of the desired femto path loss and
![Futureinternet 05 00168 i057]()
is the previously assumed value of the femto path loss. After reduction of the desired femto path loss according to Equation (11), the calculations from Equation (1) and onwards are repeated. Finally, when Equation (10) is fulfilled it is ensured that the computed HUE transmission power does not exceed the HUE power capping constraint
If the HUE power capped constraint is violated, the desired femto path loss has to be reduced according to Equation (11) and the algorithm has to be re-calculated from Equation (1). If both the NR and HUE power capping constraints are fulfilled the next step is the HS-DSCH power calculation.
3.3. Step 3—The HS-DSCH Power Calculations
The data channels power of the HNB has direct impact on the data rate available for HUE connected to the HNB. Thus, calibration is based on agreed requirements, e.g., data rates expected at the femtocell edge. The transmission power of the data channels,
![Futureinternet 05 00168 i059]()
, to reach the required downlink throughput at the cell edge is calculated as
where
IHNB is the interference measured by the HNB and
SF is the spreading factor and equals 16 for the HS-DSCH. It is assumed that the interference level from the surrounding network is the same in the whole femtocell area, which is only an estimate since it depends especially on whether interference from other femtocells is strongly present.
Estimating this interference is rather complicated as it depends on the active load. We therefore base the estimation on the RSCP CPICH NLM measurements of all macrocells in the vicinity:
![Futureinternet 05 00168 i061]()
. We only consider macrocells not to put neighboring femtocells into a race condition where they keep increasing their power to fulfill cell edge rates. This would only lead to worse network performance and similar cell edge data rates for the competing femtocells. Utilization of RSCP makes the approach independent on network load during NLM measurements and we can then apply modification afterwards. The interference at the HNB,
![Futureinternet 05 00168 i062]()
, is estimated as
where
Fload is the assumed average load of the surrounding cells and
![Futureinternet 05 00168 i064]()
is the assumed ratio between the average total transmit power of a base station and its pilot power. We assume
![Futureinternet 05 00168 i065]()
for the simulations but it is a parameter that is set by the operator depending on the macro network configuration.
3.4. Step 4—Downlink Parameter Verification
Finally, the total transmit power configuration of the HNB must satisfy the following inequality
where
![Futureinternet 05 00168 i067]()
is the power of the common control channels and
![Futureinternet 05 00168 i068]()
is the hardware limitation on maximum HNB transmission power. If Equation (16) is not satisfied the femtocell coverage is reduced according to Equation (11). The new configuration requires execution of algorithm with new configuration parameters from Equation (1).
The end-user required uplink or downlink throughput is not guaranteed in the entire apartment/house if Equations (10), (12) and (15) are not all fulfilled in the first iteration of the proposed QoS-SP-IM algorithm. If Equations (10), (12) and (15) are not fulfilled the femtocell range was reduced during the execution of the algorithm. However, from an operator’s point of view, the macro performance in the surrounding macrocells is preserved and is not degraded due to dense HNB deployment but at the cost of higher outage in femtocell performance. Tradeoffs are shown in the next section.
3.5. A Note on Parameter Initialization versus Adaptation
As mentioned earlier, we are focused in this paper on the initialization on the HNB parameters. The above method will typically be repeated when the HNB is idle or every time interval which commonly is configured by the HNB vendor or its management system (could be e.g., every few hours). It should be noted that the initialization will be the best network configuration possible given information we have at the HNB location. However, as users connect to the system, the imperfections of the modeling will become visible. For instance, while an HNB may see good isolation to a macrocell, a connected HNB user may be standing in a window opening with different coupling to the nearest macrocell. Also, load conditions which are assumed for the provided algorithm will vary over time which may lead to HUEs getting excessive or inadequate throughput compared to the targets.
Hence, a method as devised here will be combined with adaptation, e.g., using observed throughput levels for its connected users as well as collecting neighbor interference reports (e.g., handover triggered measurements) to fine-tune the parameters compared to the initial settings. In this paper, we focus only on the initialization but we are to some extent including dynamic imperfections as we add users to the system. We have e.g., shadowing models as well as indoor modeling with wall counts which mimic the situation that some HNB users have a different path loss to its neighbors compared to the value predicted by the NLM method. Given our user distribution method, we also have varying network load conditions. As shall be seen by the simulation results, our method is robust against these variations. Further work will integrate and clarify the value of further dynamic adaptation.
4. Simulation Results
Extensive quasi-static system level simulations are conducted in order to assess the performance of the proposed scheme. The basic simulation methodology is in coherence with the 3GPP guidance for HetNet simulations [
14], including simulation of both downlink and uplink and the major RRM algorithms such as packet scheduling, power control (PC), link adaptation,
etc. [
13]. Cases with co-channel deployment of OSG and CSG HNBs in line with assumptions outlined in
Section 2 are simulated. We primarily focus on dense urban environments with 500 meters macro inter-site distance, and the case with CSG HNBs deployed inside multi-floor buildings. The so-called dual-stripe 3GPP model is adopted, simulating two adjacent three-floor building blocks, each consisting of 2 × 10 apartments of 10 × 10 meters per floor [
14].
It is assumed that 30 HNBs with different CSGs are randomly placed inside those two building blocks, one HNB per four apartments, with the constraint of a maximum of one CSG HNB per apartment. Each apartment with a CSG HNB also has at least one HUE with matching CSG identity. In addition, MUEs are randomly placed, assuming that 80% of those are located inside the building blocks. If an MUE is dropped inside an apartment with an HNB, the MUE is considered an HUE with CSG identity matching the HNB. Except for the former constraints, serving cell selection corresponds to the cell with strongest RSCP for the UE. Thus, a UE with configured CSG identity may also connect to the macro-layer if it is subject to higher RSCP from that layer as compared to the HNB with matching CSG identity. In order to further evaluate the scalability of the proposed QoS-SP-IM algorithm, we also present example performance results from a suburban residential scenario. The suburban environment is characterized by a larger macro inter-site distance of 1732 meters and CSG HNBs placed inside separate single-floor residential family homes. More information on the simulation assumptions for both the dense urban and suburban scenario is available in [
15,
16].
In addition to simulation of the derived QoS-SP-IM algorithm in
Section 3, two simpler cases are also simulated in order to have baseline results to compare against. The baseline cases include: (i) no power control (NOPC), where the HNBs simply transmit at their maximum power of 15 dBm; and (ii) an adaptive HNB PC scheme where the HNB Tx power is adjusted depending on RSCP from the strongest macro-cell. The latter method is referred to as “3GPP,” as this solution has recently been adopted by 3GPP for the LTE femtocells [
15]. To be more specific, the 3GPP solution for the HNB transmission power expressed in dBm equals
![Futureinternet 05 00168 i069]()
, where
![Futureinternet 05 00168 i070]()
is the RSCP from the strongest received macro at the HNB (measured using NLM) and
Pmax equals the maximum HNB transmission power. For both NOPC and 3GPP cases, it is assumed that the CPICH to total transmit power equals −10 dB. Recall from
Section 3 that with QoS-SP-IM, the CPICH power is adjusted dynamically. For the simulations, we assume that the desired HNB coverage in terms of equivalent path loss equals 56 dB and 62 dB for the dense and suburban environments, respectively. These values can be estimated based on typical size of apartment/homes as, building types, and maximum separation between HUE and HNB.
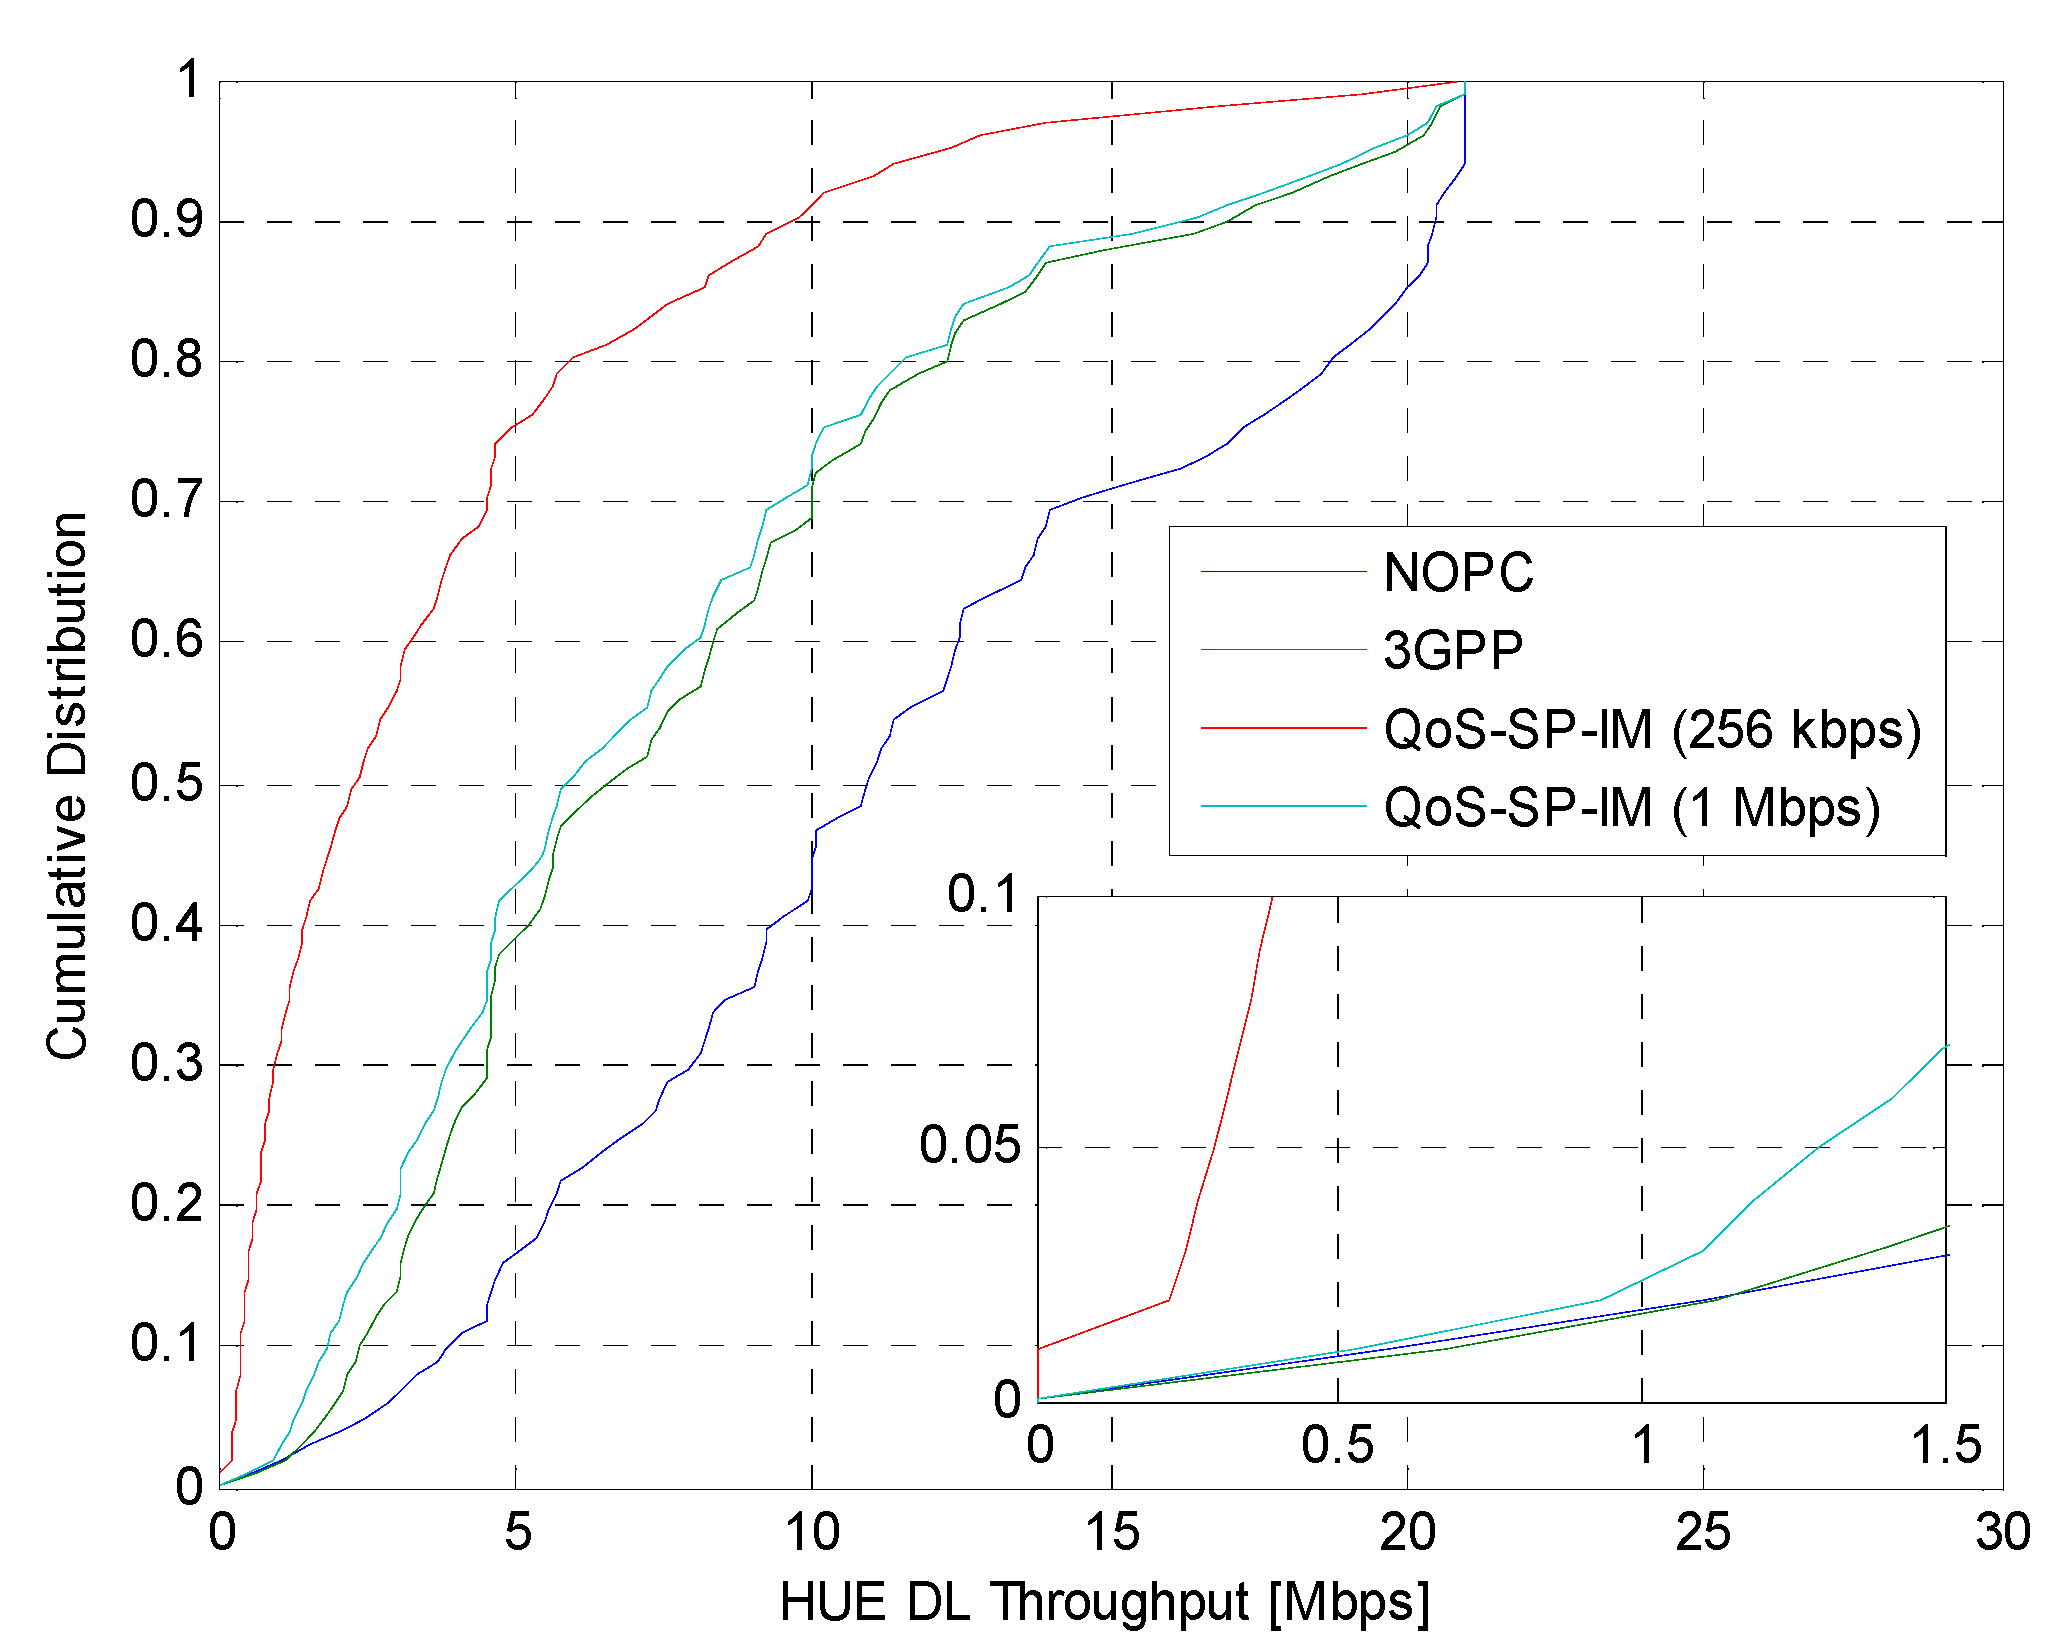
Figure 4 shows the cumulative distribution function (cdf) of the experienced downlink end-user throughput for HUEs. As expected, the best HUE performance is observed for the NOPC case,
i.e., HNB transmitting at its maximum power. The results for the QoS-SP-IM algorithm with a desired throughput guarantee of 256 kbps and 1 Mbps shows accurate adjustment according to those targets. It is observed that the outage probability only equals 3%–4% for the QoS-SP-IM algorithm,
i.e., first evidence of the QoS-SP-IM algorithm’s ability to self-adjust the HNB transmission power to fulfill the minimum QoS target. For the considered case, the scheme with 3GPP HNB PC seems to result in performance close to that of the QoS-SP-IM algorithm with 1 Mbps downlink target. Looking at the 50th percentile or 90the percentile throughput, it is observed that HUEs often experience much higher end-user throughputs as compared to their minimum guaranteed throughput in the service level agreement.
Figure 4.
Cumulative distribution function of experienced HUE downlink throughput in dense urban for different HNB Tx power configuration schemes.
Figure 4.
Cumulative distribution function of experienced HUE downlink throughput in dense urban for different HNB Tx power configuration schemes.
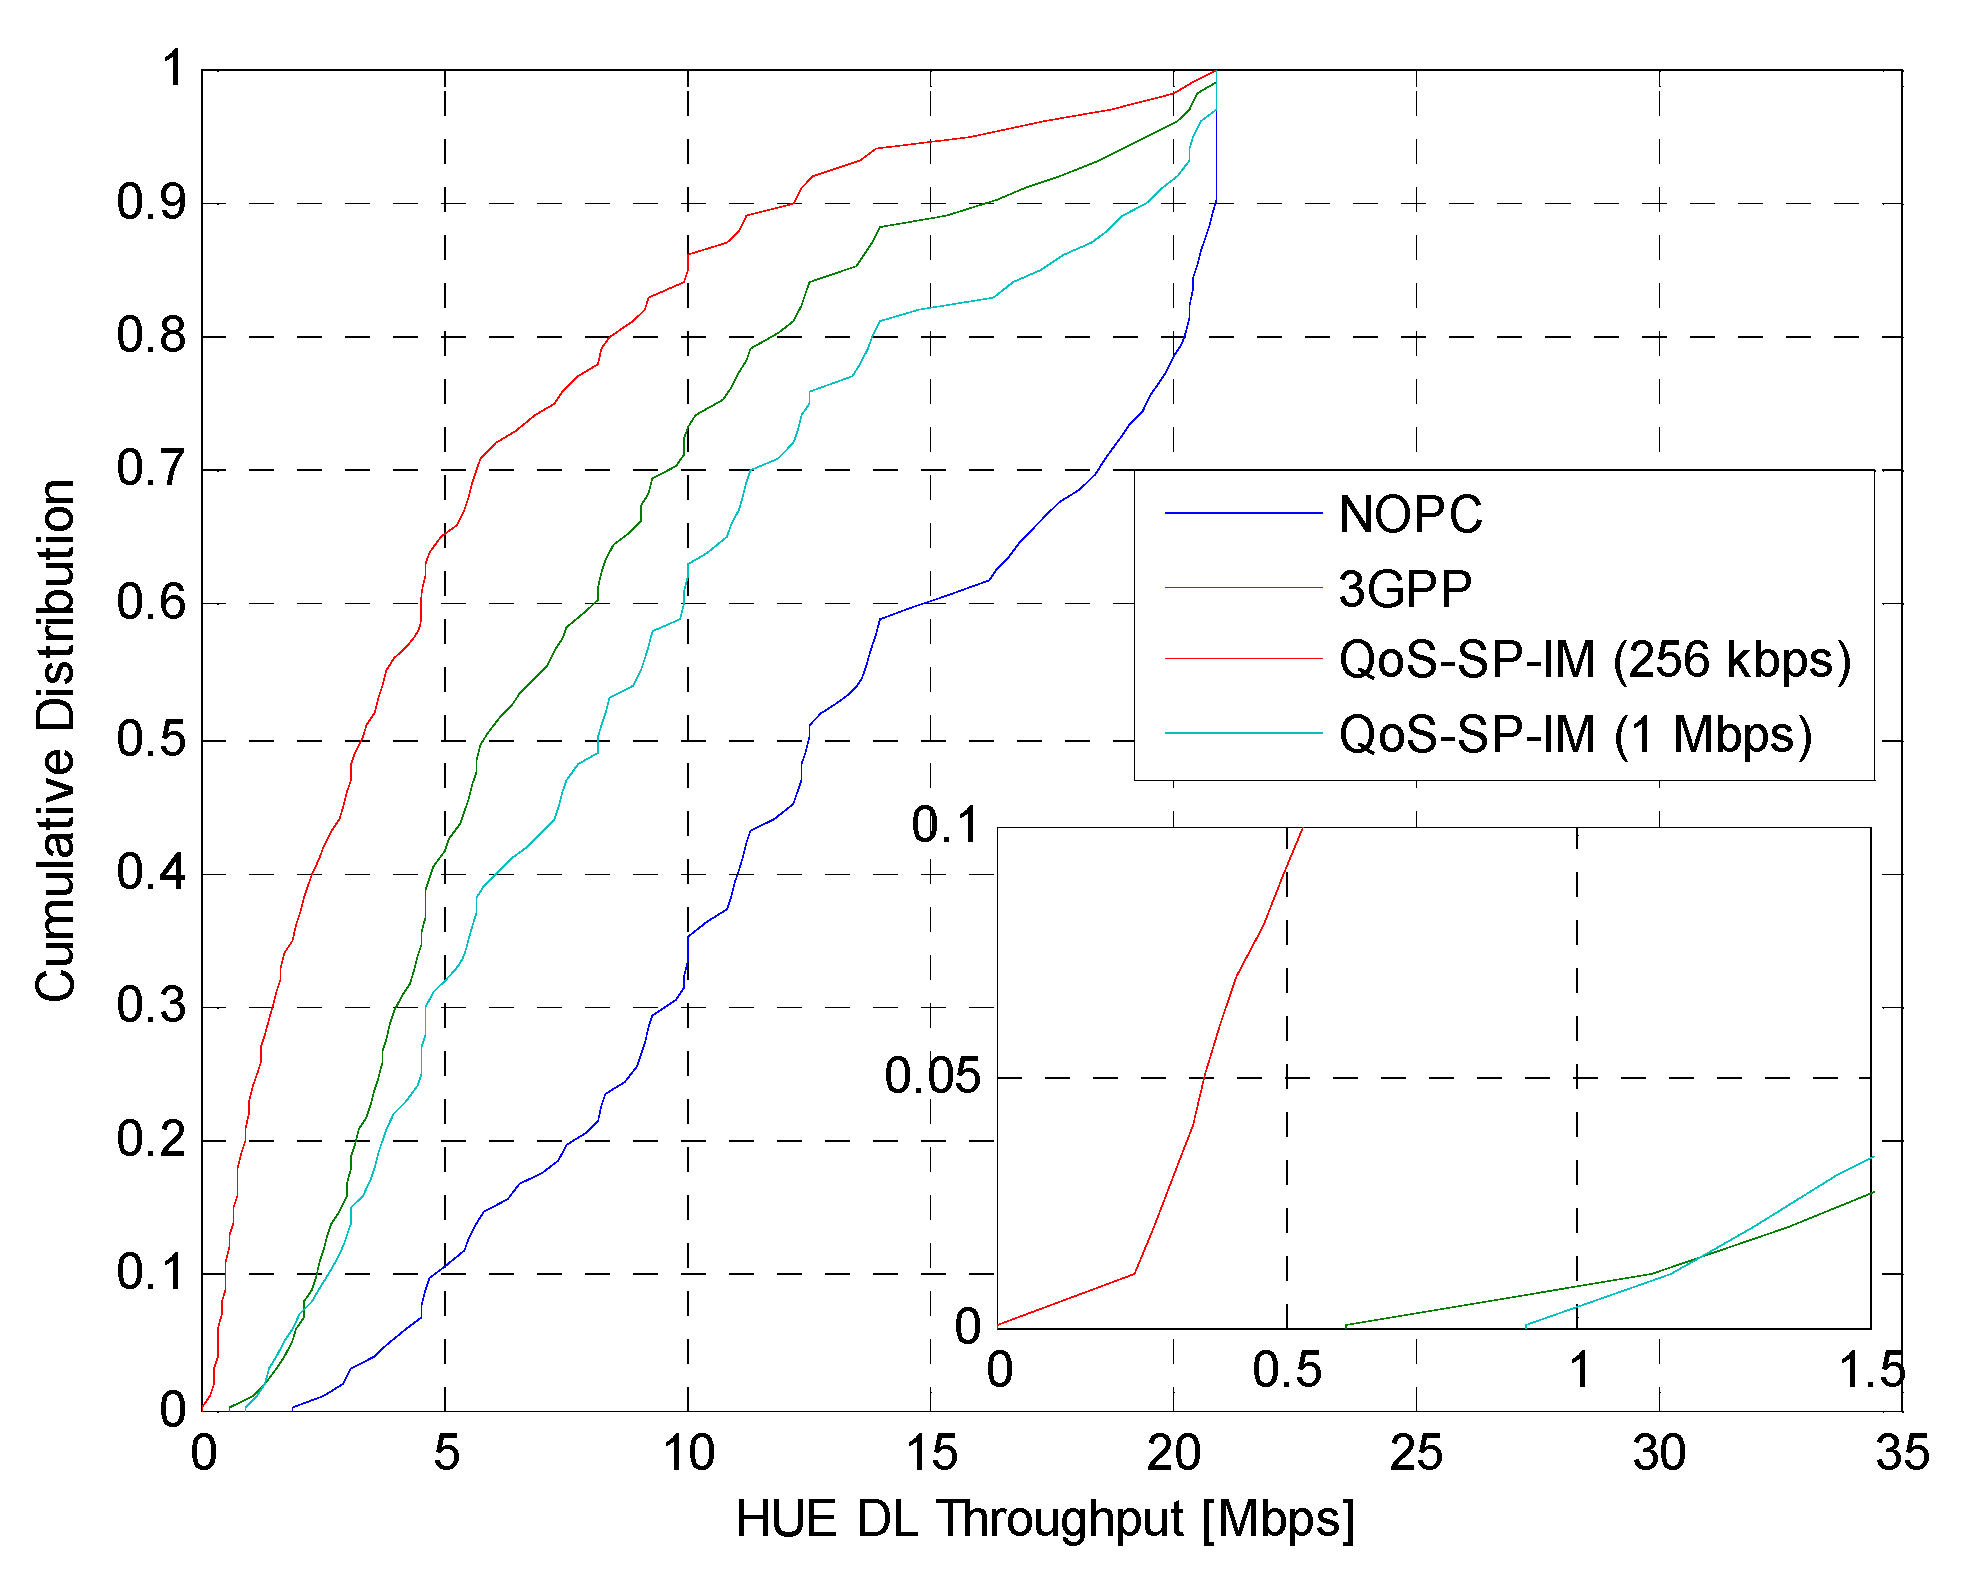
In order to demonstrate the scalability of the proposed QoS-SP-IM algorithm to self-adjust for different environments, similar results as in
Figure 4 are pictured in
Figure 5 for the suburban scenario. Again it is observed that the QoS-SP-IM algorithm efficiently self-adjusts so the outage probability for the desired throughput targets of 256 kbps and 1 Mbps equals only on the order of 1%. Despite the many differences between the dense and suburban environments, it is interesting to note that the experienced HUE throughput in
Figure 4,
Figure 5 is actually fairly close.
Figure 5.
Cumulative distribution function of experienced HUE downlink throughput in suburban for different HNB Tx power configuration schemes.
Figure 5.
Cumulative distribution function of experienced HUE downlink throughput in suburban for different HNB Tx power configuration schemes.
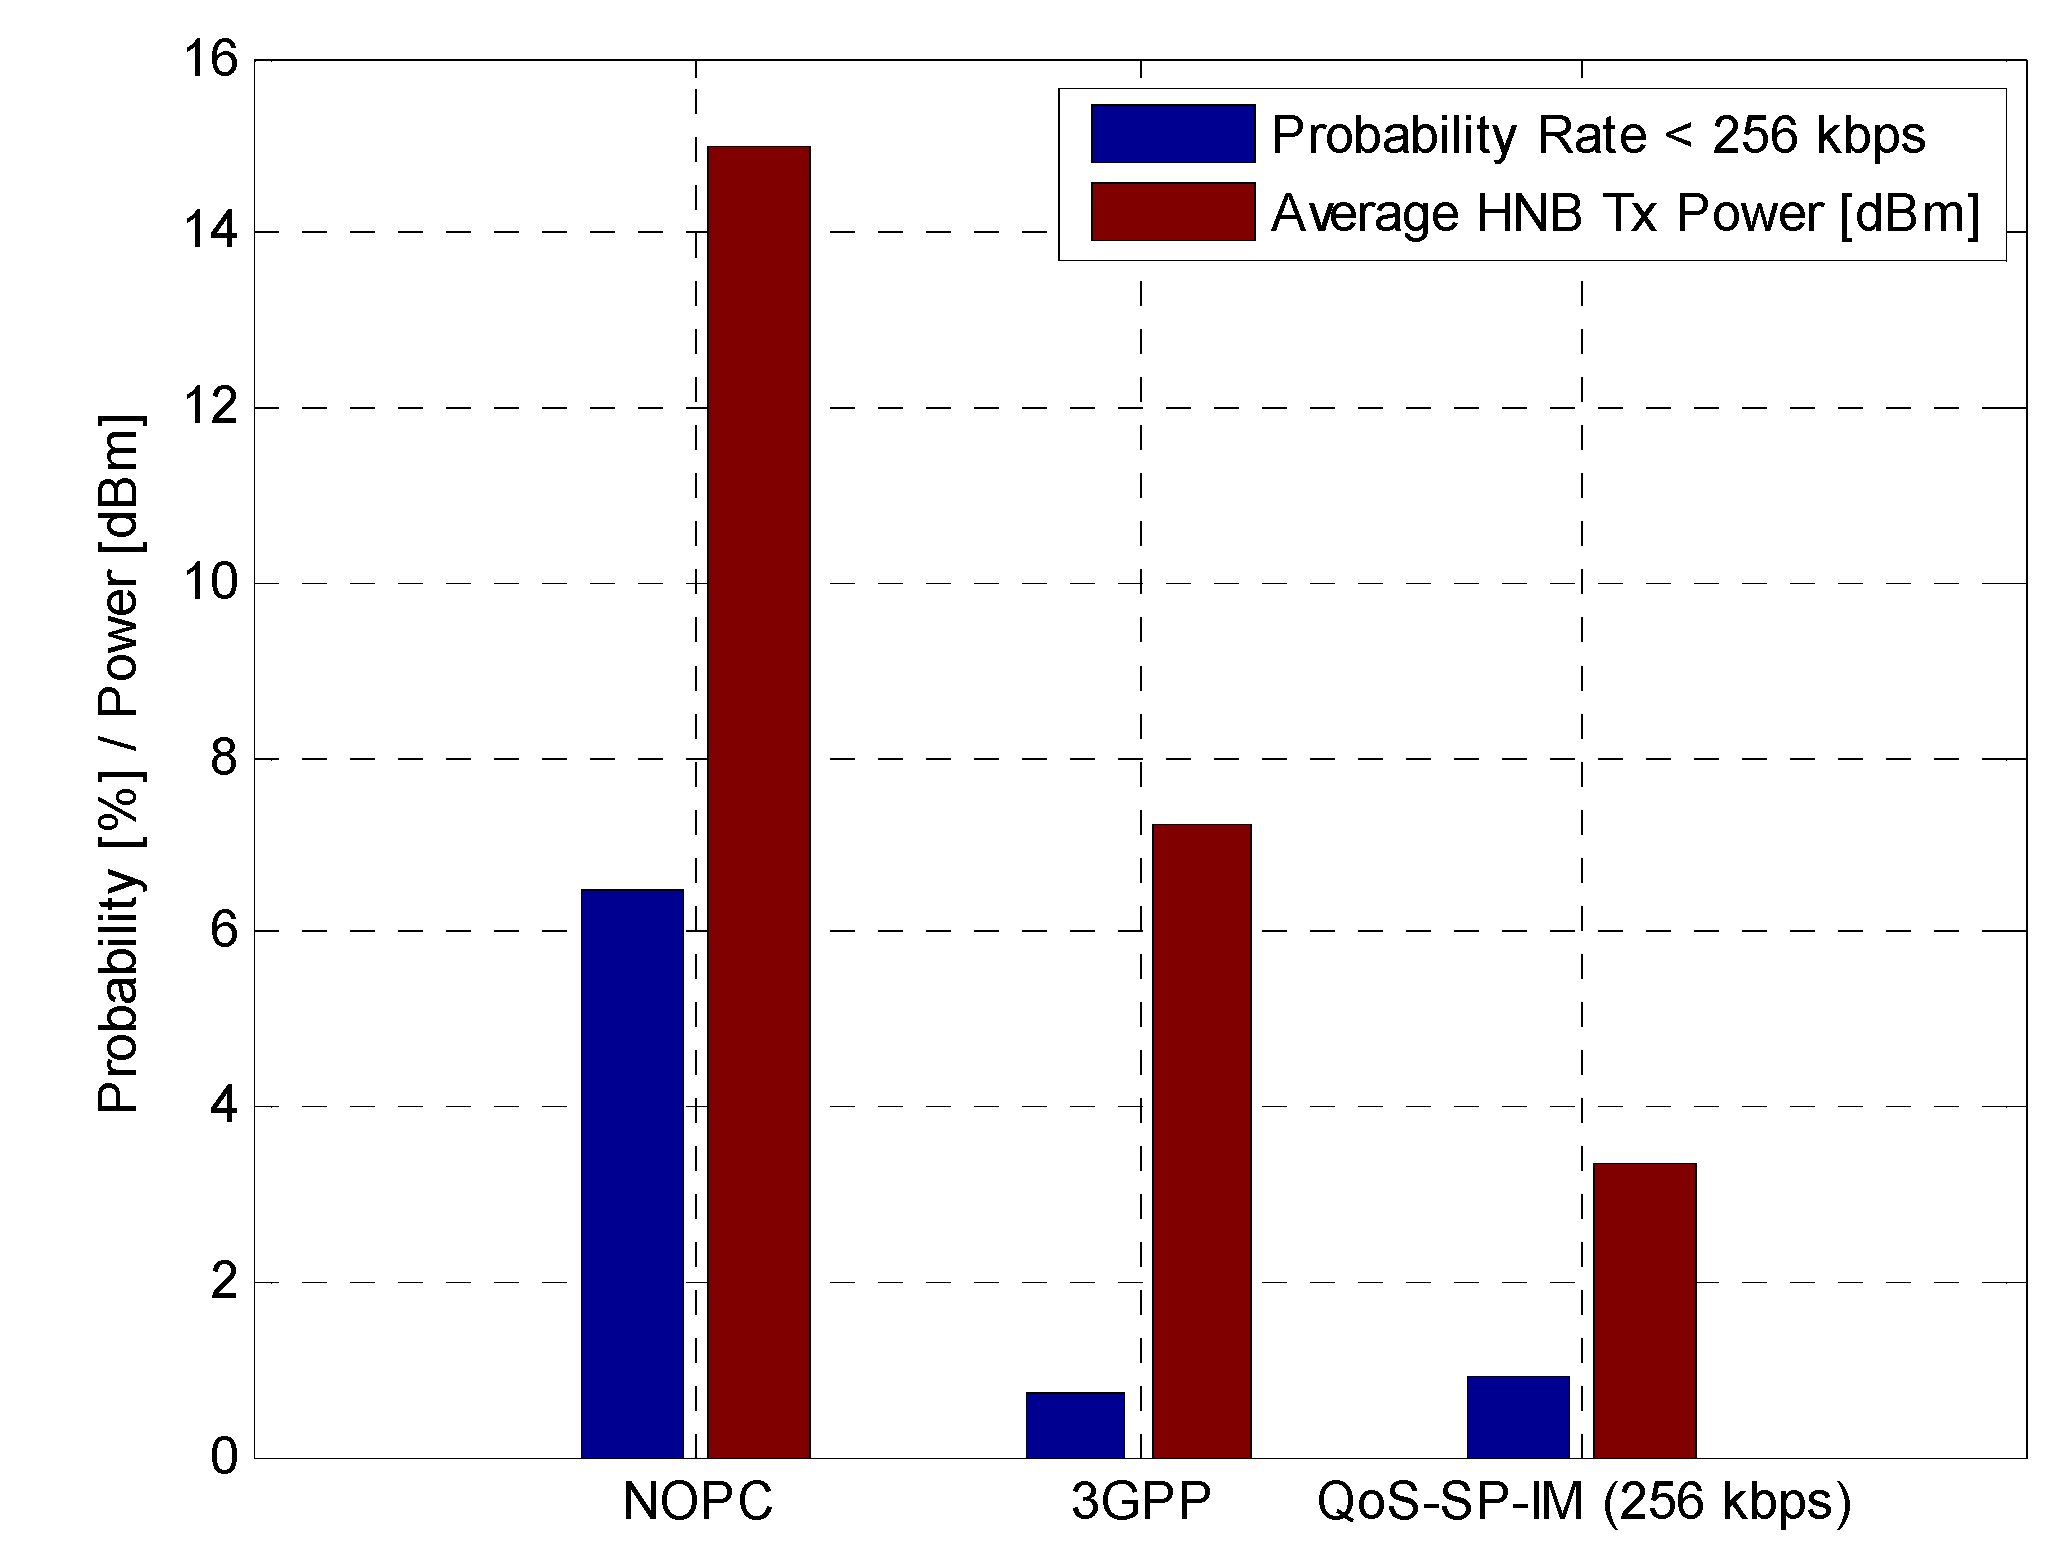
Next, we look in more detail towards outage defined inside the home or the apartment. We extend our outage definition considering that any user in an HNB home/apartment would be interested to connect to the HNB (e.g., for the case with different charging policies) or that the operator wants to offload the user from the macro network. We therefore look across the whole area of the apartment or home where an HNB is installed and we report the outage defined as where the user is unable to get a minimum throughput of 256 kbps from neither the MNB nor the HNB. This outage probability for the dense urban scenario is reported in
Figure 6. Also the average HNB Tx power resulting from each scheme is reported in
Figure 6. The QoS-SP-IM algorithm displays very high performance, with only ~1% probability of not connecting to the HNB or experiencing too low a throughput. The former is achieved with less than 4 dBm HNB Tx power. The higher performance of the QoS-SP-IM algorithm is obtained by adjusting CPICH power to desired coverage, while afterwards setting the HS-DSCH power to meet the minimum throughput requirement. The NOPC case naturally uses 15 dBm Tx power, but despite the relative high power, there is 6% probability of experiencing too low a throughput. The latter comes from not having all UEs connecting to their own HNB, but instead connecting to the outside macro-layer not being able to offer the desired throughput. This behavior is observed because the HNB CPICH Tx power is too low (−10 dB compared to the total HNB Tx power), thus leading to less coverage but higher cell throughput performance. The 3GPP HNB PC solution shows comparable performance to the QoS-SP-IM algorithm in terms of outage probability, but at the expense of using 4 dB higher transmit power.
Figure 6.
Displayed key performance metrics for the three considered HNB Tx power setting methods in the dense urban scenario: (a) Probability that a UE with matching CSG identity inside the same apartments as its own HeNB experience a downlink throughput lower than 256 kbps; (b) average HNB transmit power.
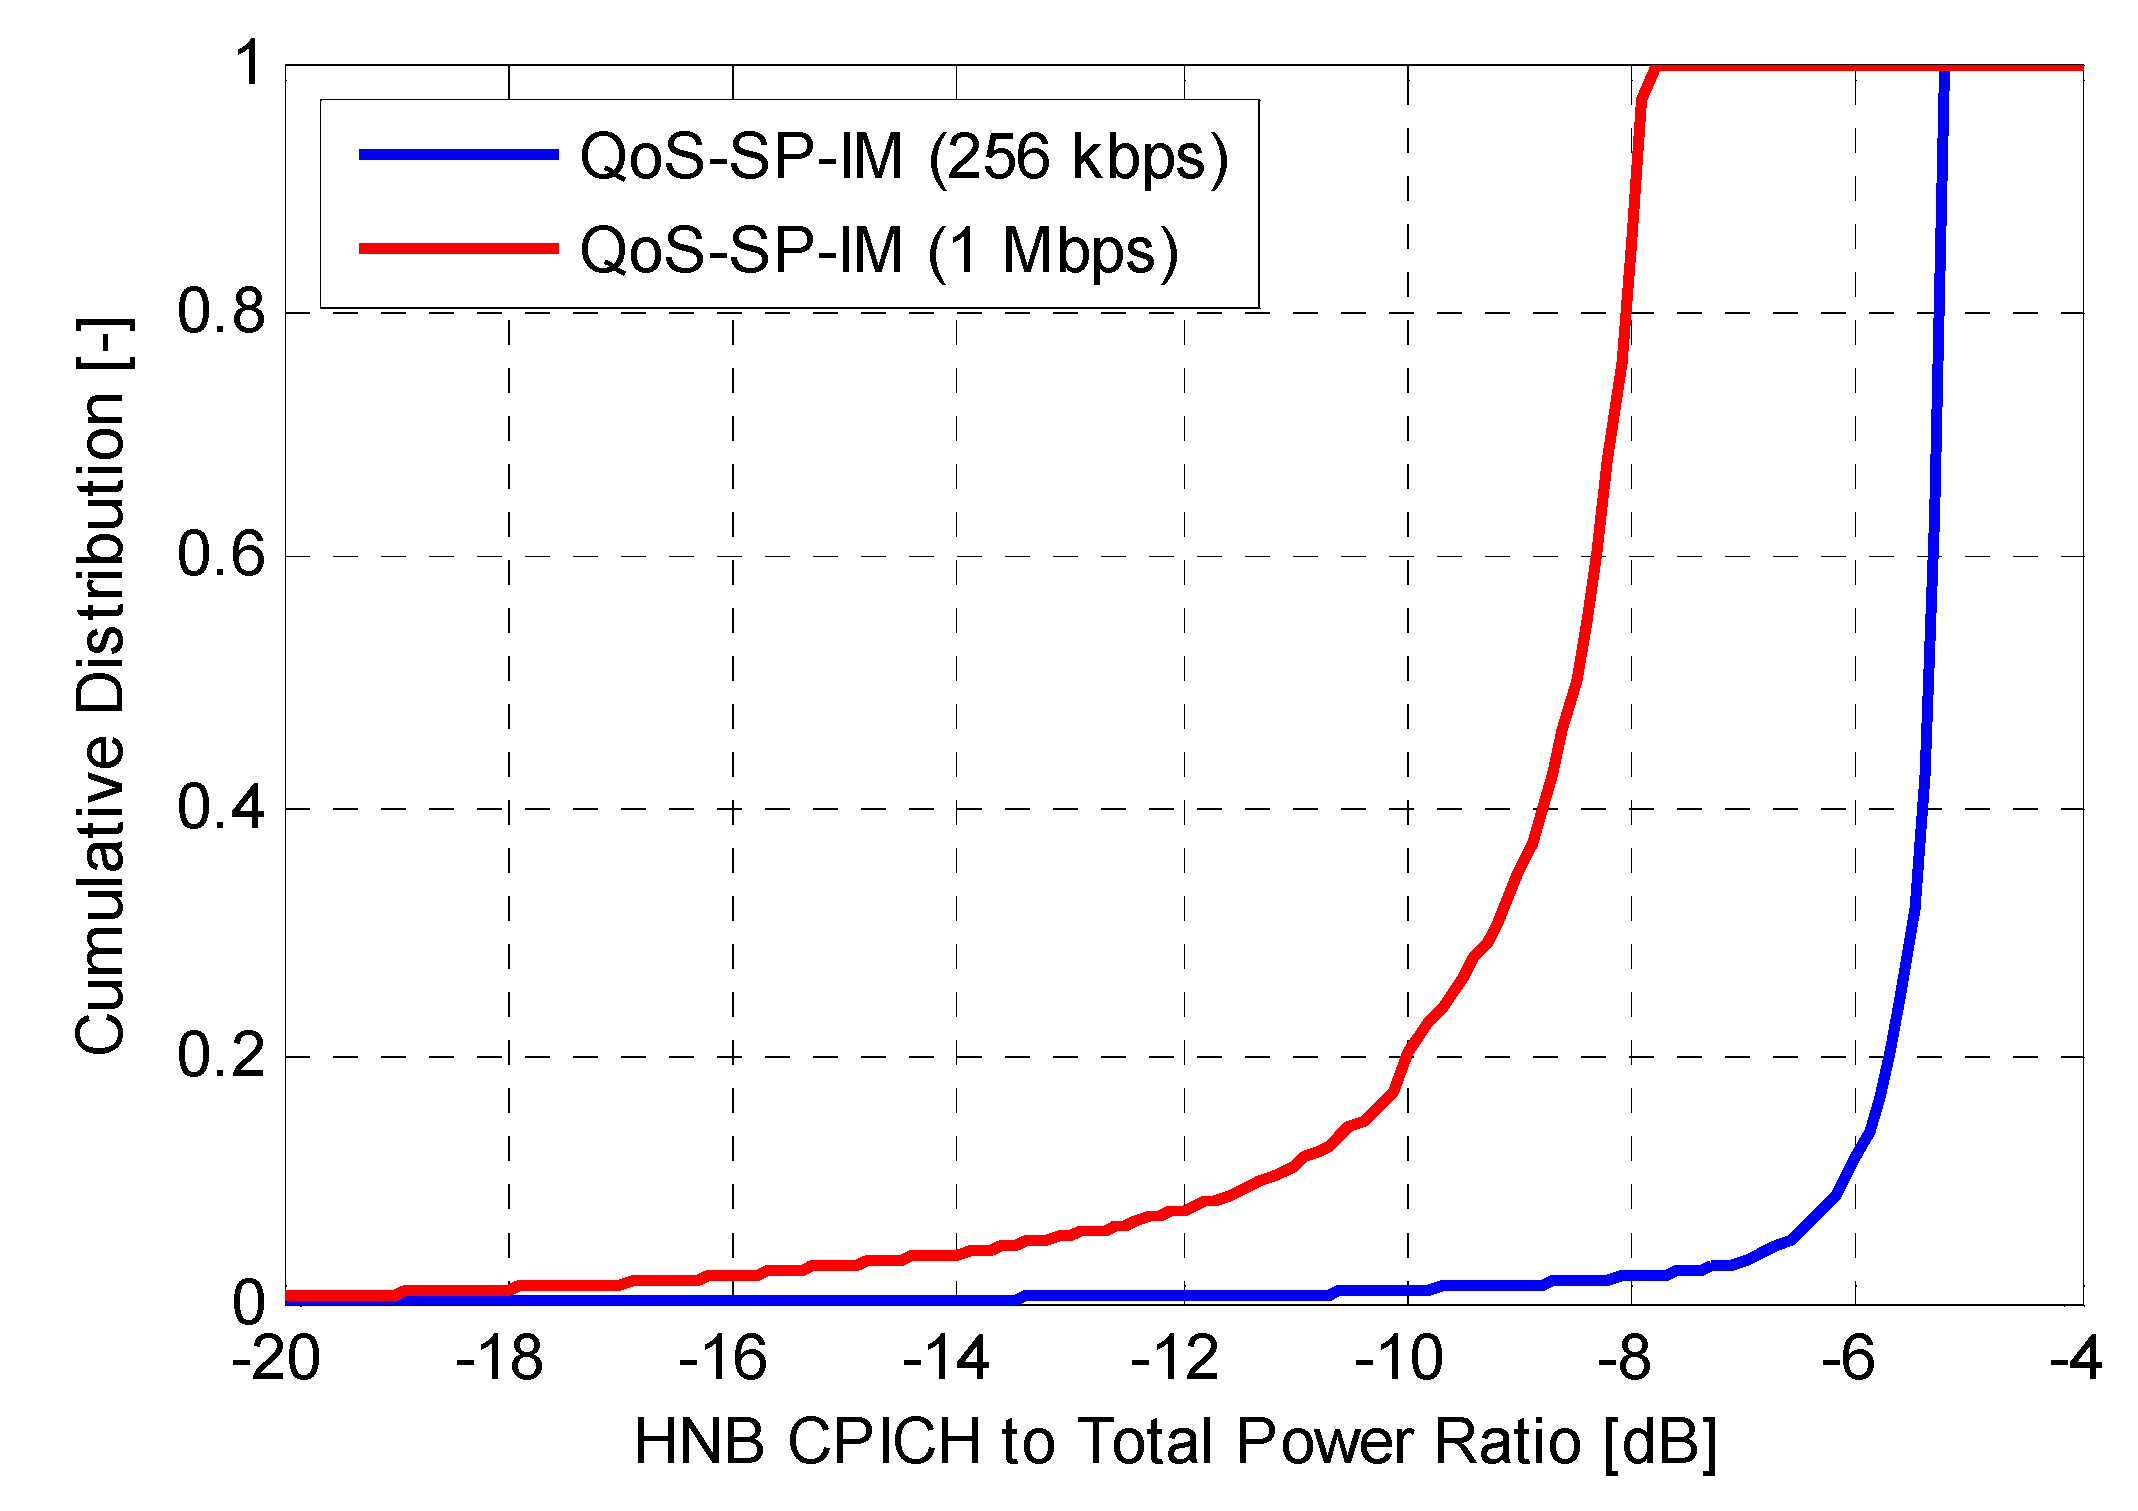
As commented earlier, one of the merits of the derived QoS-SP-IM algorithm is its ability to dynamically adjust the CPICH and data channel HNB Tx power to achieve the desired objectives in terms of coverage and minimum target data rate. Thus, while the CPICH to total HNB Tx power is fixed at −10 dB for cases with NOPC and 3GPP PC, the QoS-SP-IM algorithm computes these power settings for each HNB. The cdf of the CPICH to total HNB TX power for the QoS-SP-IM algorithms is reported in
Figure 7 for the dense urban scenario. Here it is, among others, visible how the HNB decreases the data channel power as the minimum target bit rate is decreased from 1 Mbps to 256 kbps.
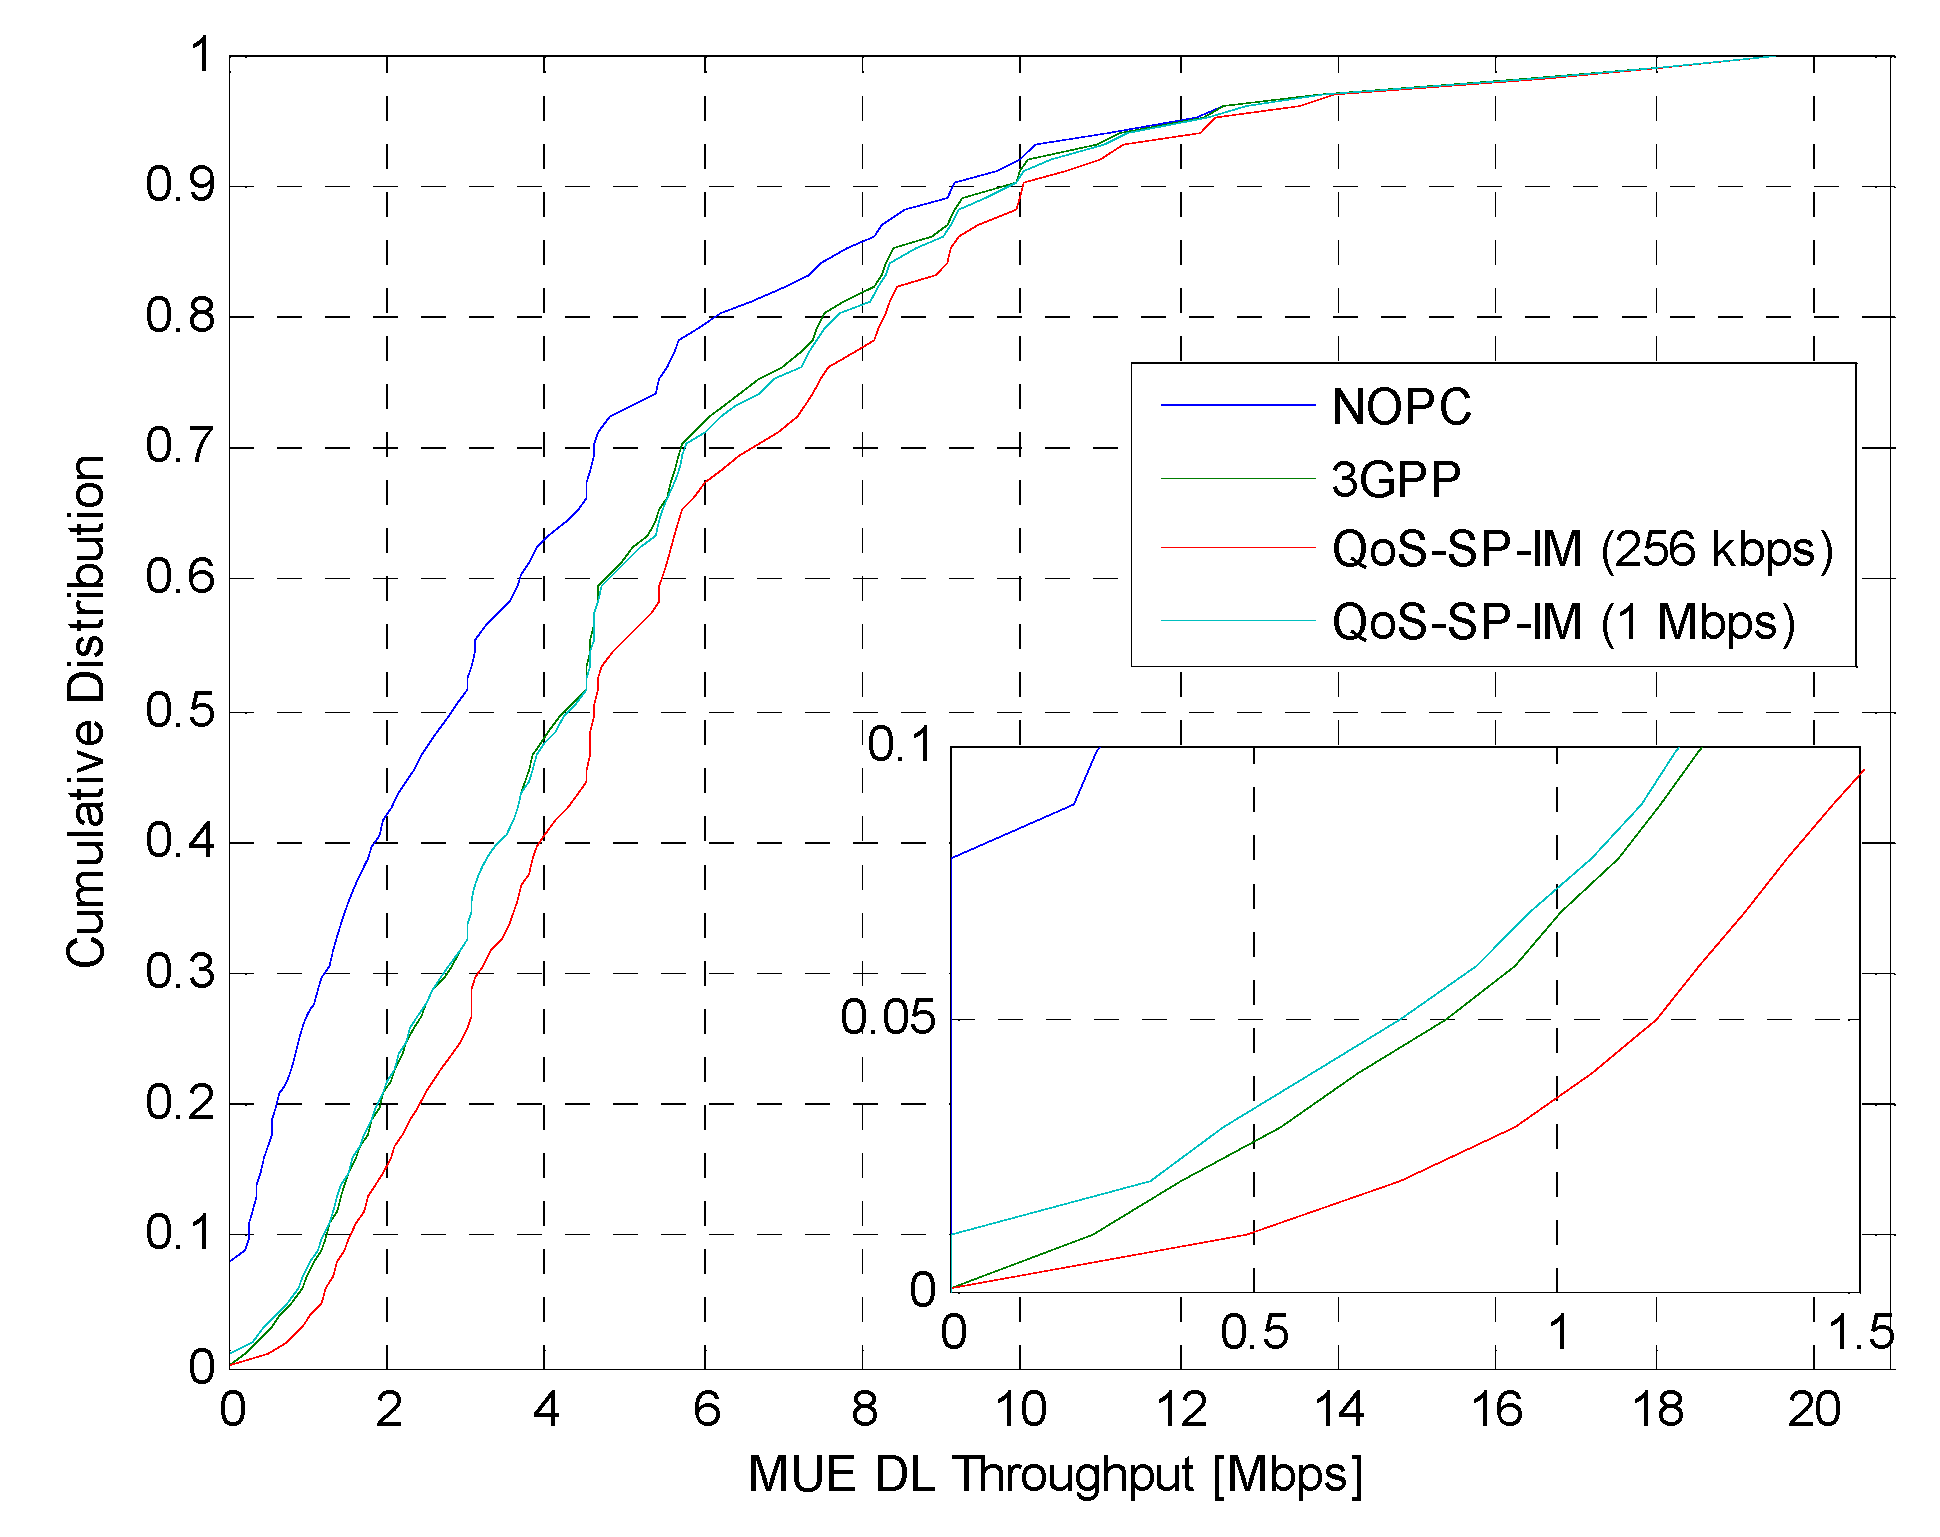
The impact on MUE performance is shown in
Figure 8. Here, it is clearly demonstrated that the use of NOPC for CSG HNBs have significant influence on MUE performance, showing that 8% of the MUE gets no service (zero throughput). The latter is naturally a result of experiencing too high interference from nearby CSG HNB(s), causing macro-layer coverage holes, or dead-zones as it is also sometimes called. The best MUE performance is clearly observed for QoS-SP-IM algorithm. Here it is also visible that the cost of increasing the minimum target throughput inside their home with an accessible HNB comes at a cost of lower throughput for MUEs.
Figure 7.
Cumulative distribution function of HNB CPICH to total Tx power for the dense urban scenario.
Figure 7.
Cumulative distribution function of HNB CPICH to total Tx power for the dense urban scenario.
Figure 8.
Dense urban downlink performance of macro users versus algorithm for setting transmission powers (CSG case).
Figure 8.
Dense urban downlink performance of macro users versus algorithm for setting transmission powers (CSG case).
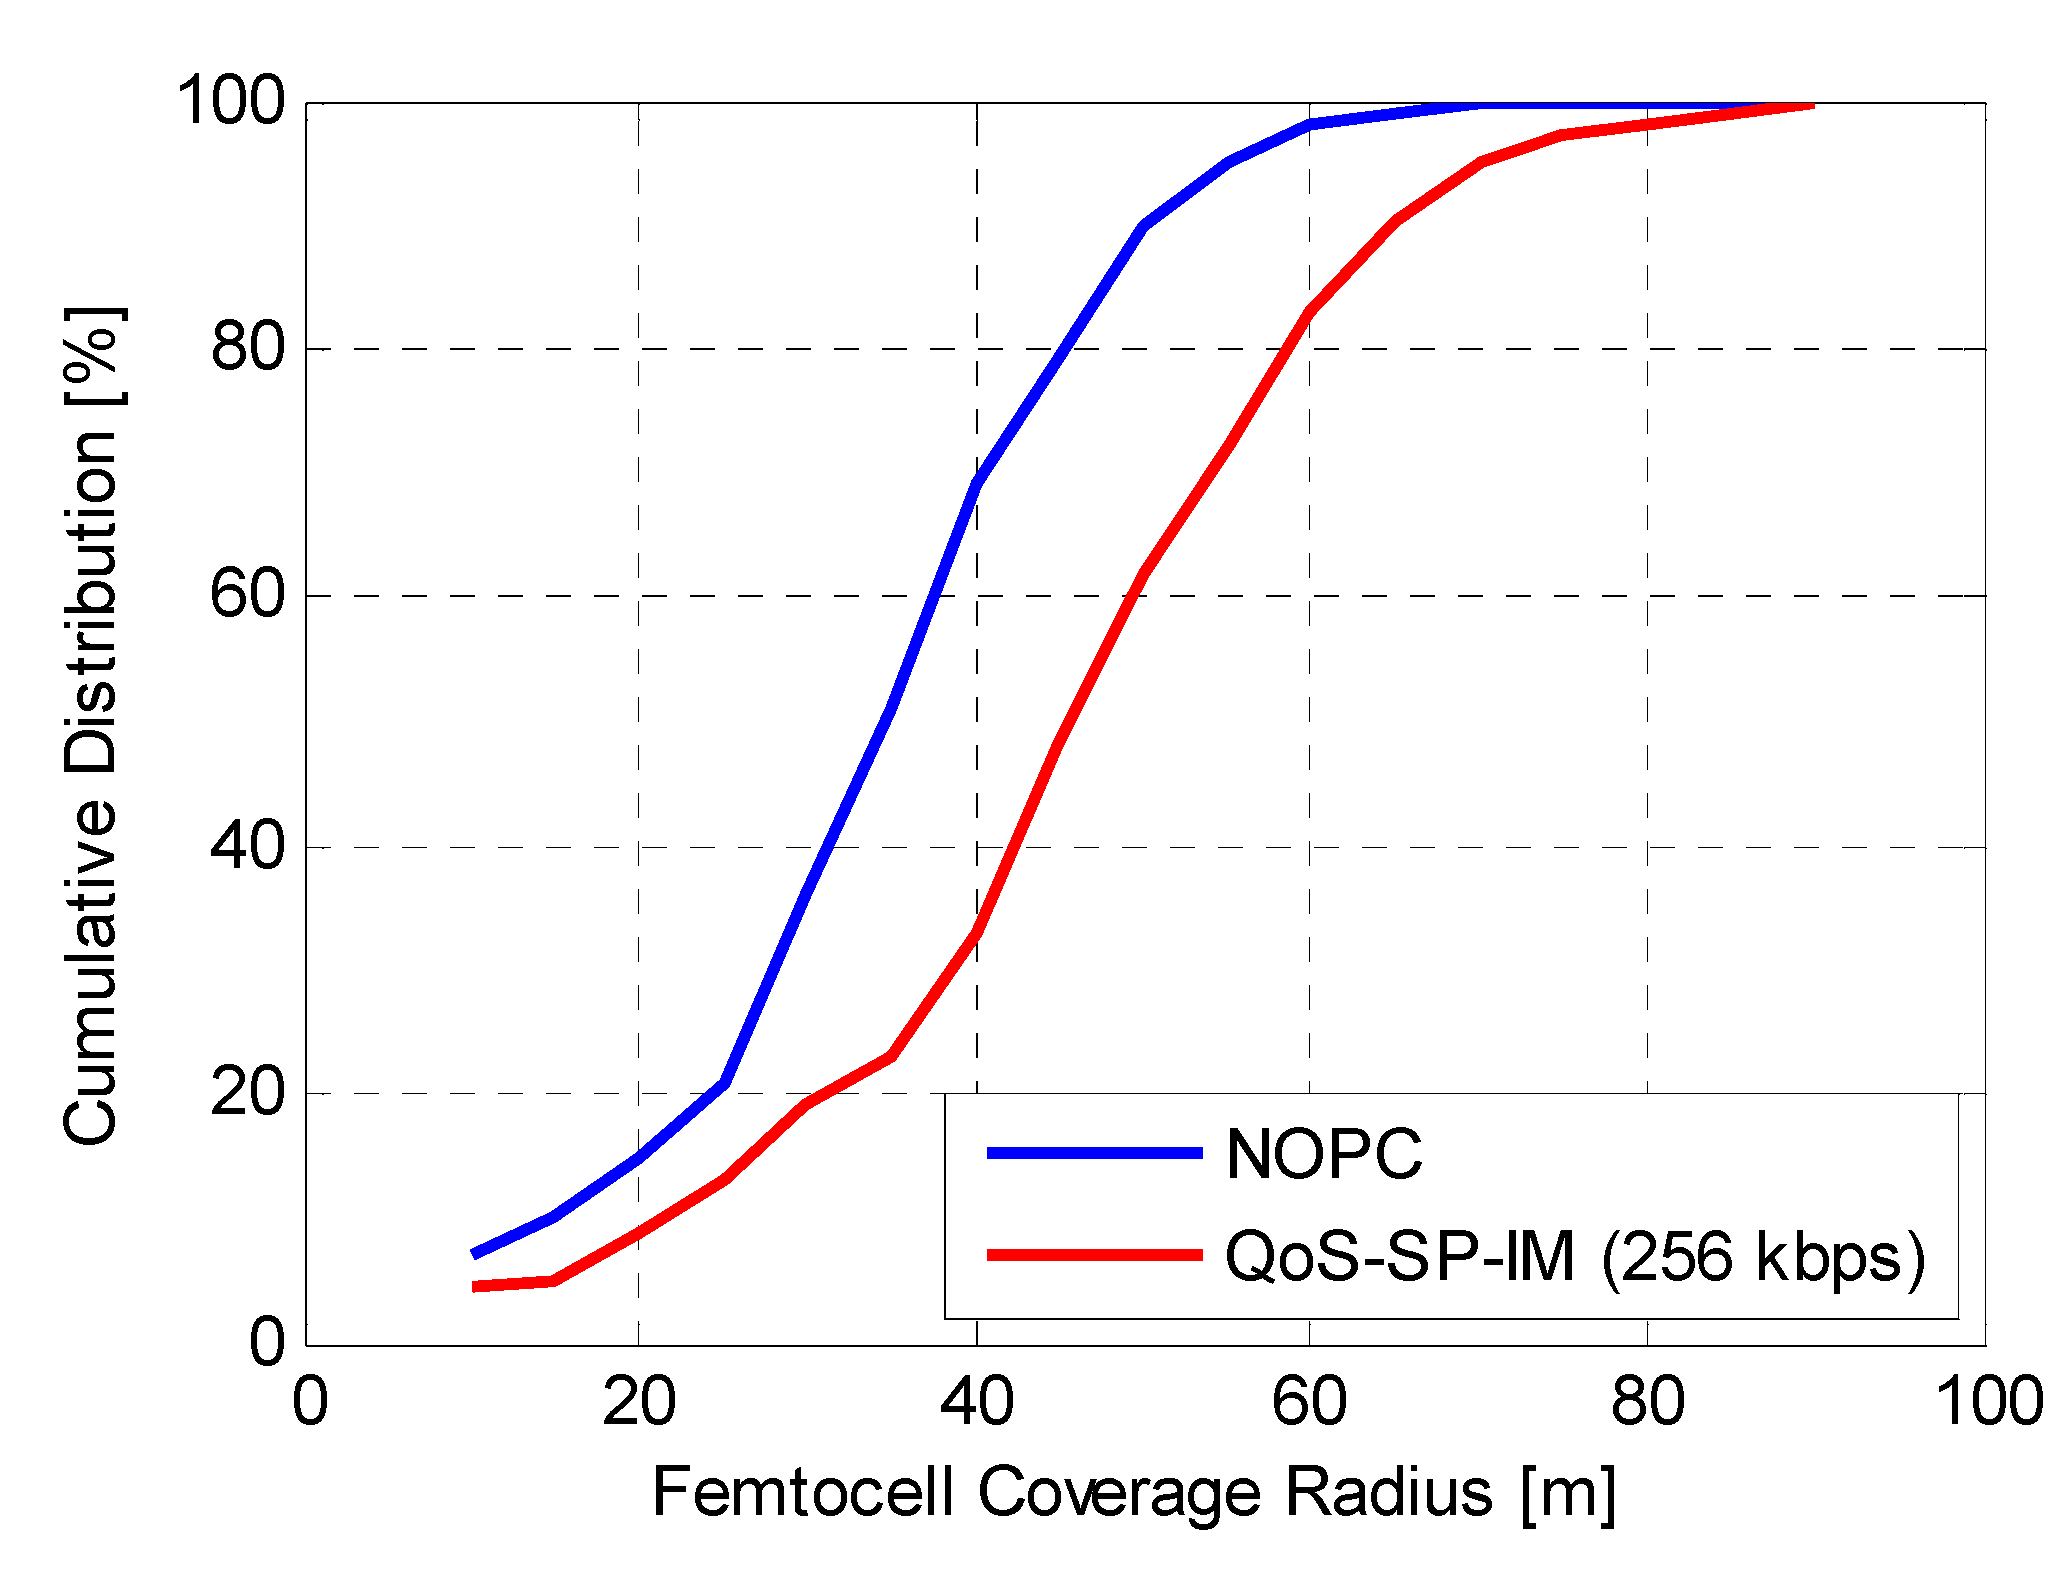
As discussed earlier, a key benefit of our proposed algorithm is the dynamic adaptation of the CPICH and the HS-DSCH powers to reach optimal tradeoff among coverage and capacity.
Figure 9 illustrates the potential of our proposed algorithm in the suburban case when compared to NOPC. In the method here, the target coverage of the algorithm is set to infinite which automatically instructs the algorithm to maximize the cell coverage to the point where target QoS in both downlink and uplink can still be maintained and ensuring that NR conditions are still met (see e.g.,
Table 2). Compared to the NOPC algorithm, we now also accept the use of maximum transmit power in the femtocell but we redistribute it optimally to the control and data channels to get the right balance. The result is clear: A net coverage gain of 10–15 meters is obtained in most cases. This is a clearly perceived advantage for remote buildings where femtocells are deployed mainly for coverage and safety (e.g., for emergency calls).
Figure 9.
Effective femtocell coverage versus algorithm (coverage target of QoS-SP-IM set to ∞).
Figure 9.
Effective femtocell coverage versus algorithm (coverage target of QoS-SP-IM set to ∞).
As stated earlier, the joint optimization of downlink and uplink is important in order to scale the capacity and coverage of the cell (downlink parameters) while ensuring that the allowed budget for NR contribution as well as uplink performance of the femtocell is critically met. To simulate the different approaches, we deploy a large set of uplink users and they attempt to get a 3.8 Mbps uplink service (to test high noise rise risks). If a user gets reliable connection but less SINR, it is allocated the possible maximum uplink data rate. The NR statistics at the MNB is compiled and results are shown in
Table 3.
Table 3.
Uplink simulation results in a dense urban scenario.
Table 3.
Uplink simulation results in a dense urban scenario.
| Uplink Interference Metrics | No power control, HUE allowed to transmit up to 24 dBm | No power control, HUE power capping of −20 dBm | QoS-SP-IM (256 kbps), Adaptive uplink power capping |
|---|
| Noise rise from worst-case HUE, found across all simulated cells | 23.95 dB | 0.21 dB | 0.14 dB |
| Mean noise rise from worst-case HUE found in each simulated cell | 8.48 dB | 0.02 dB | 0.02 dB |
| Mean per HNB NR contribution across all HUE in all cells | 4.82 dB | 0.01 dB | 0.01 dB |
It is seen that without any uplink protection, the macro network is severely impacted by the presence of the HUE population. Across all simulations and cell locations, a NR of nearly 24 dB was experienced by a single HUE at the nearby MNB. Numbers are smaller on average but still significantly high to pose a threat to the macro-layer. With a fixed power capping of −20 dBm, the noise rise contribution is effectively controlled, i.e., contributions in the 0.01 dB range. It is seen that the dynamic method of our solution, although it provides higher HUE transmit powers and performance when conditions are right, still effectively controls the NR contribution from the HNBs. The difference is that it still allows the uplink QoS to be part of the dimensioning process and thus guaranteed.
When exploring in more detail the uplink performance
versus the QoS target, we need to compare uplink throughput available to UE
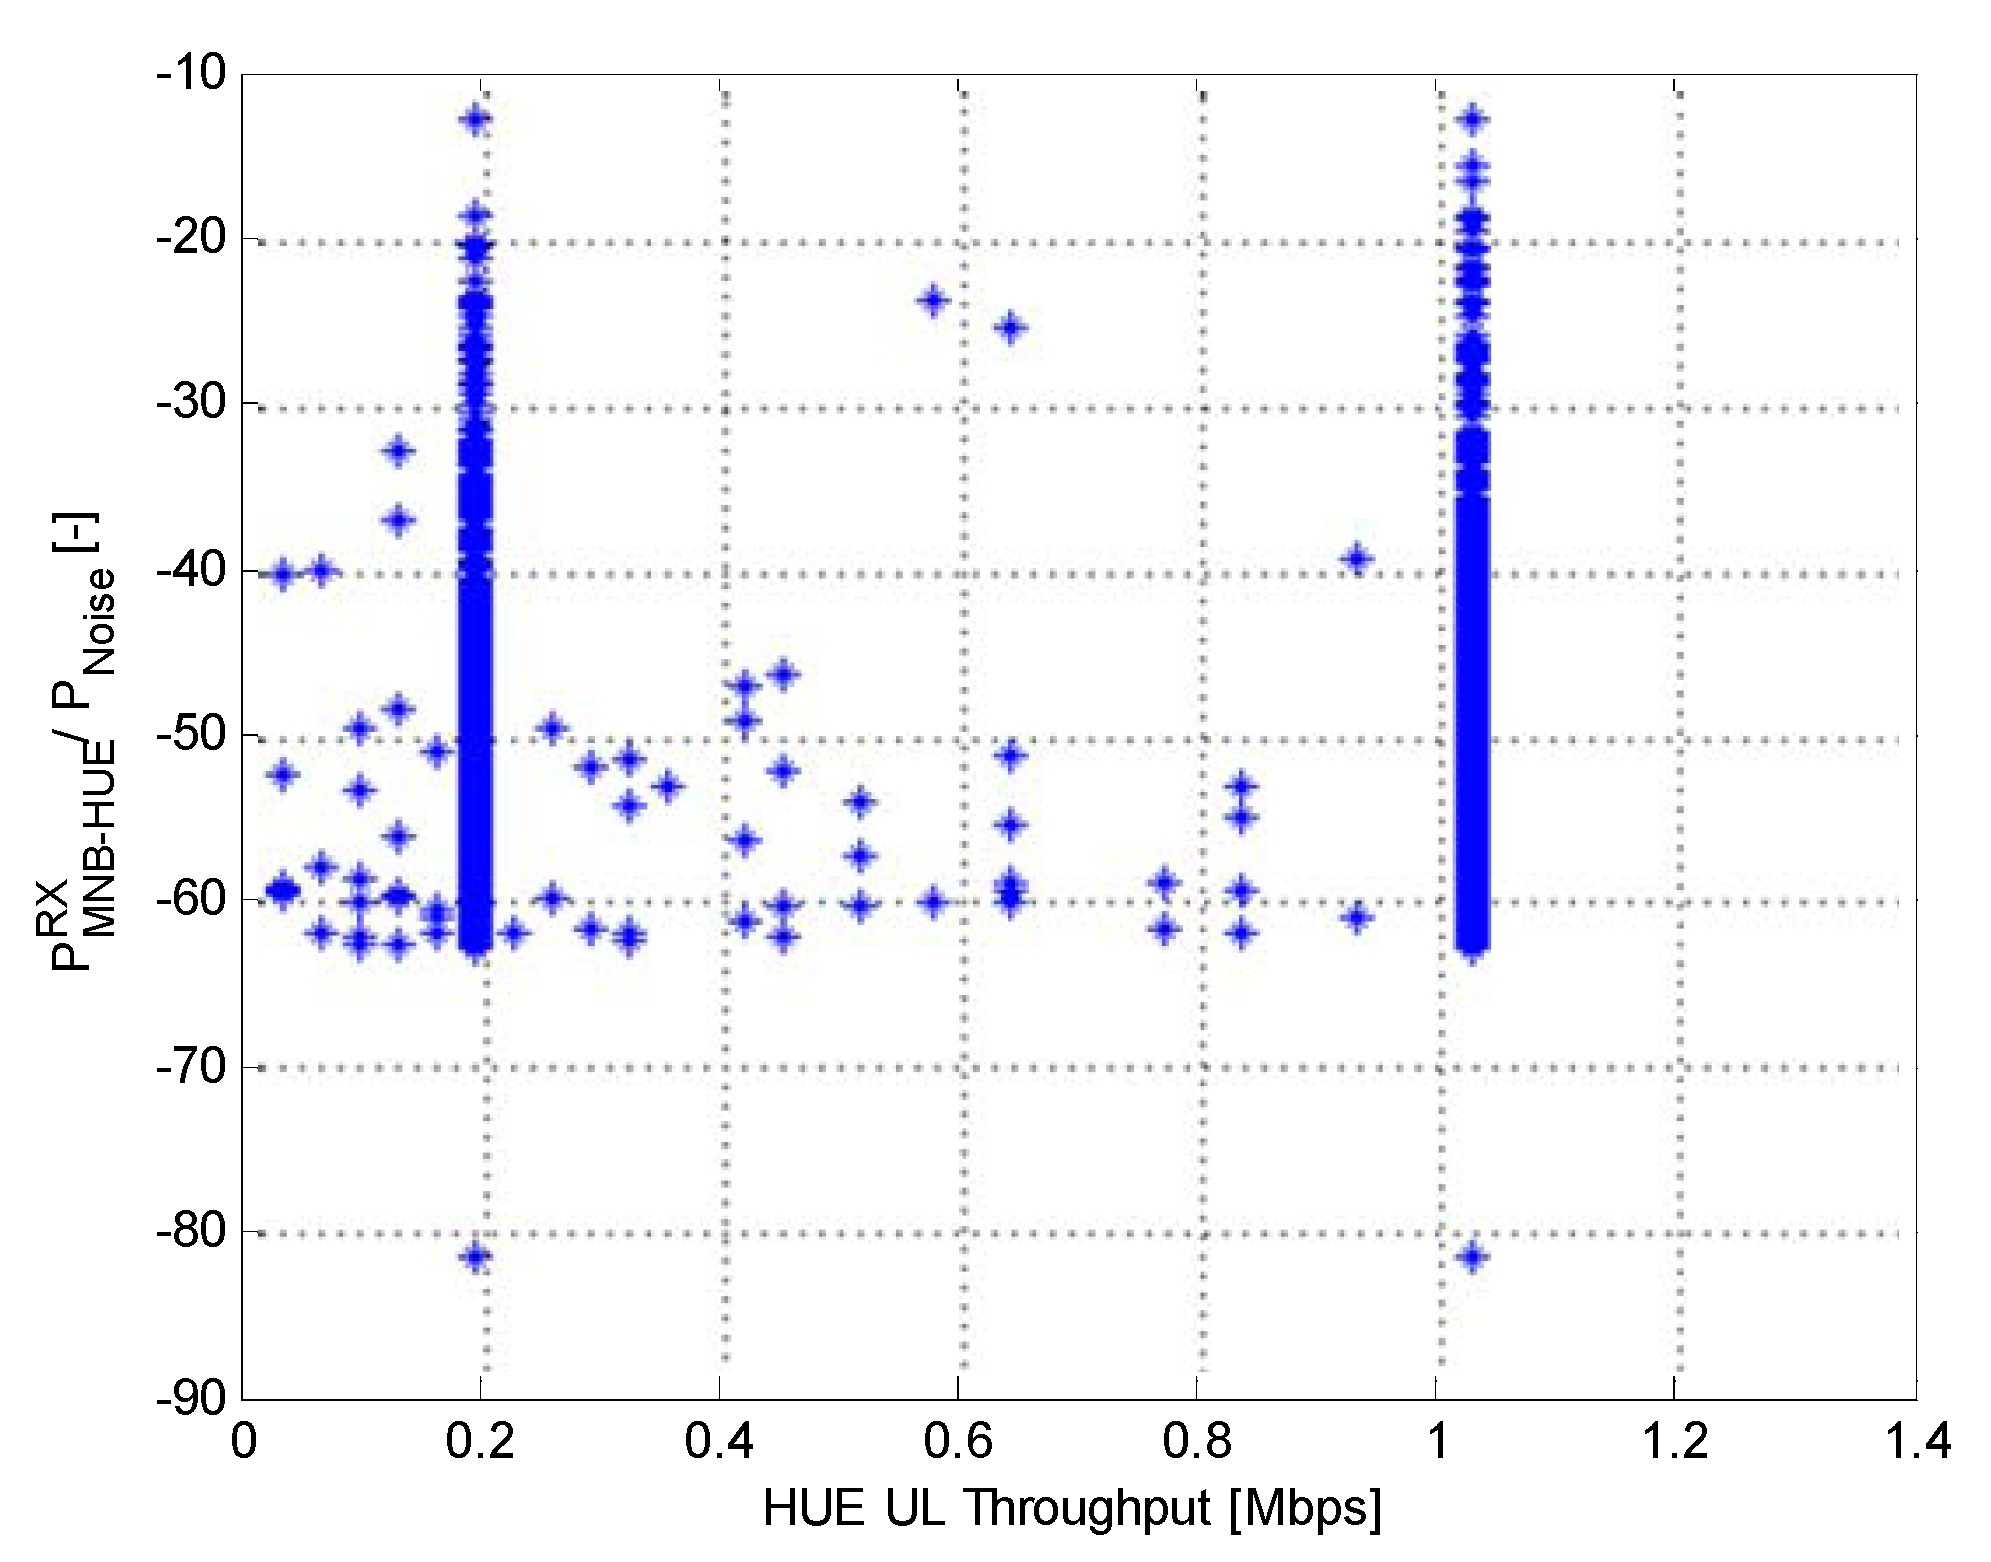
versus what NR that UE produces towards the overlay macro. For the settings here, we have allocated to each HNB an own interference contribution to nearest MNB of −11.7 dB compared to the noise floor. We achieve this value by reserving 3dB noise rise for MUEs and then divide the remaining noise rise contribution (3 dB) to 30 simultaneously active HNBs per macro site. We combine simulations for 200 kbps and 1 Mbps QoS target respectively and the per-HUE interference at MNB is plotted in
Figure 10.
Figure 10.
HUE interference at nearest macro site versus achieved uplink throughput.
Figure 10.
HUE interference at nearest macro site versus achieved uplink throughput.
Investigating the user statistics, the outage for the 200 kbps case is 3.8%, thereby indicating good accuracy of the algorithm. As we are achieving a compromise between desired downlink coverage and desired uplink rate in the algorithm, we are slightly sacrificing the uplink performance when setting the QoS target to high values. For the 1 Mbps case, we observe that 76% of users are able to achieve the uplink throughput. 90% of users exceed 500 kbps and 95% of users achieve 256 kbps. The reported HUE UL performance is found reasonable, considering that the proposed QoS-SP-IM algorithm preserves the MUE UL performance, see
Table 2. For both scenarios we can see from
Figure 10 that no HUE exceeds the set NR limit.
5. Verification by Field Measurements
In order to verify the core functionality of the proposed QoS-SP-IM concept, a measurement campaign was carried out. Verifying the full concept requires extensive measuring trials across a large region so our measurement results focus on the femto coverage area and uplink noise rise contribution from HUEs
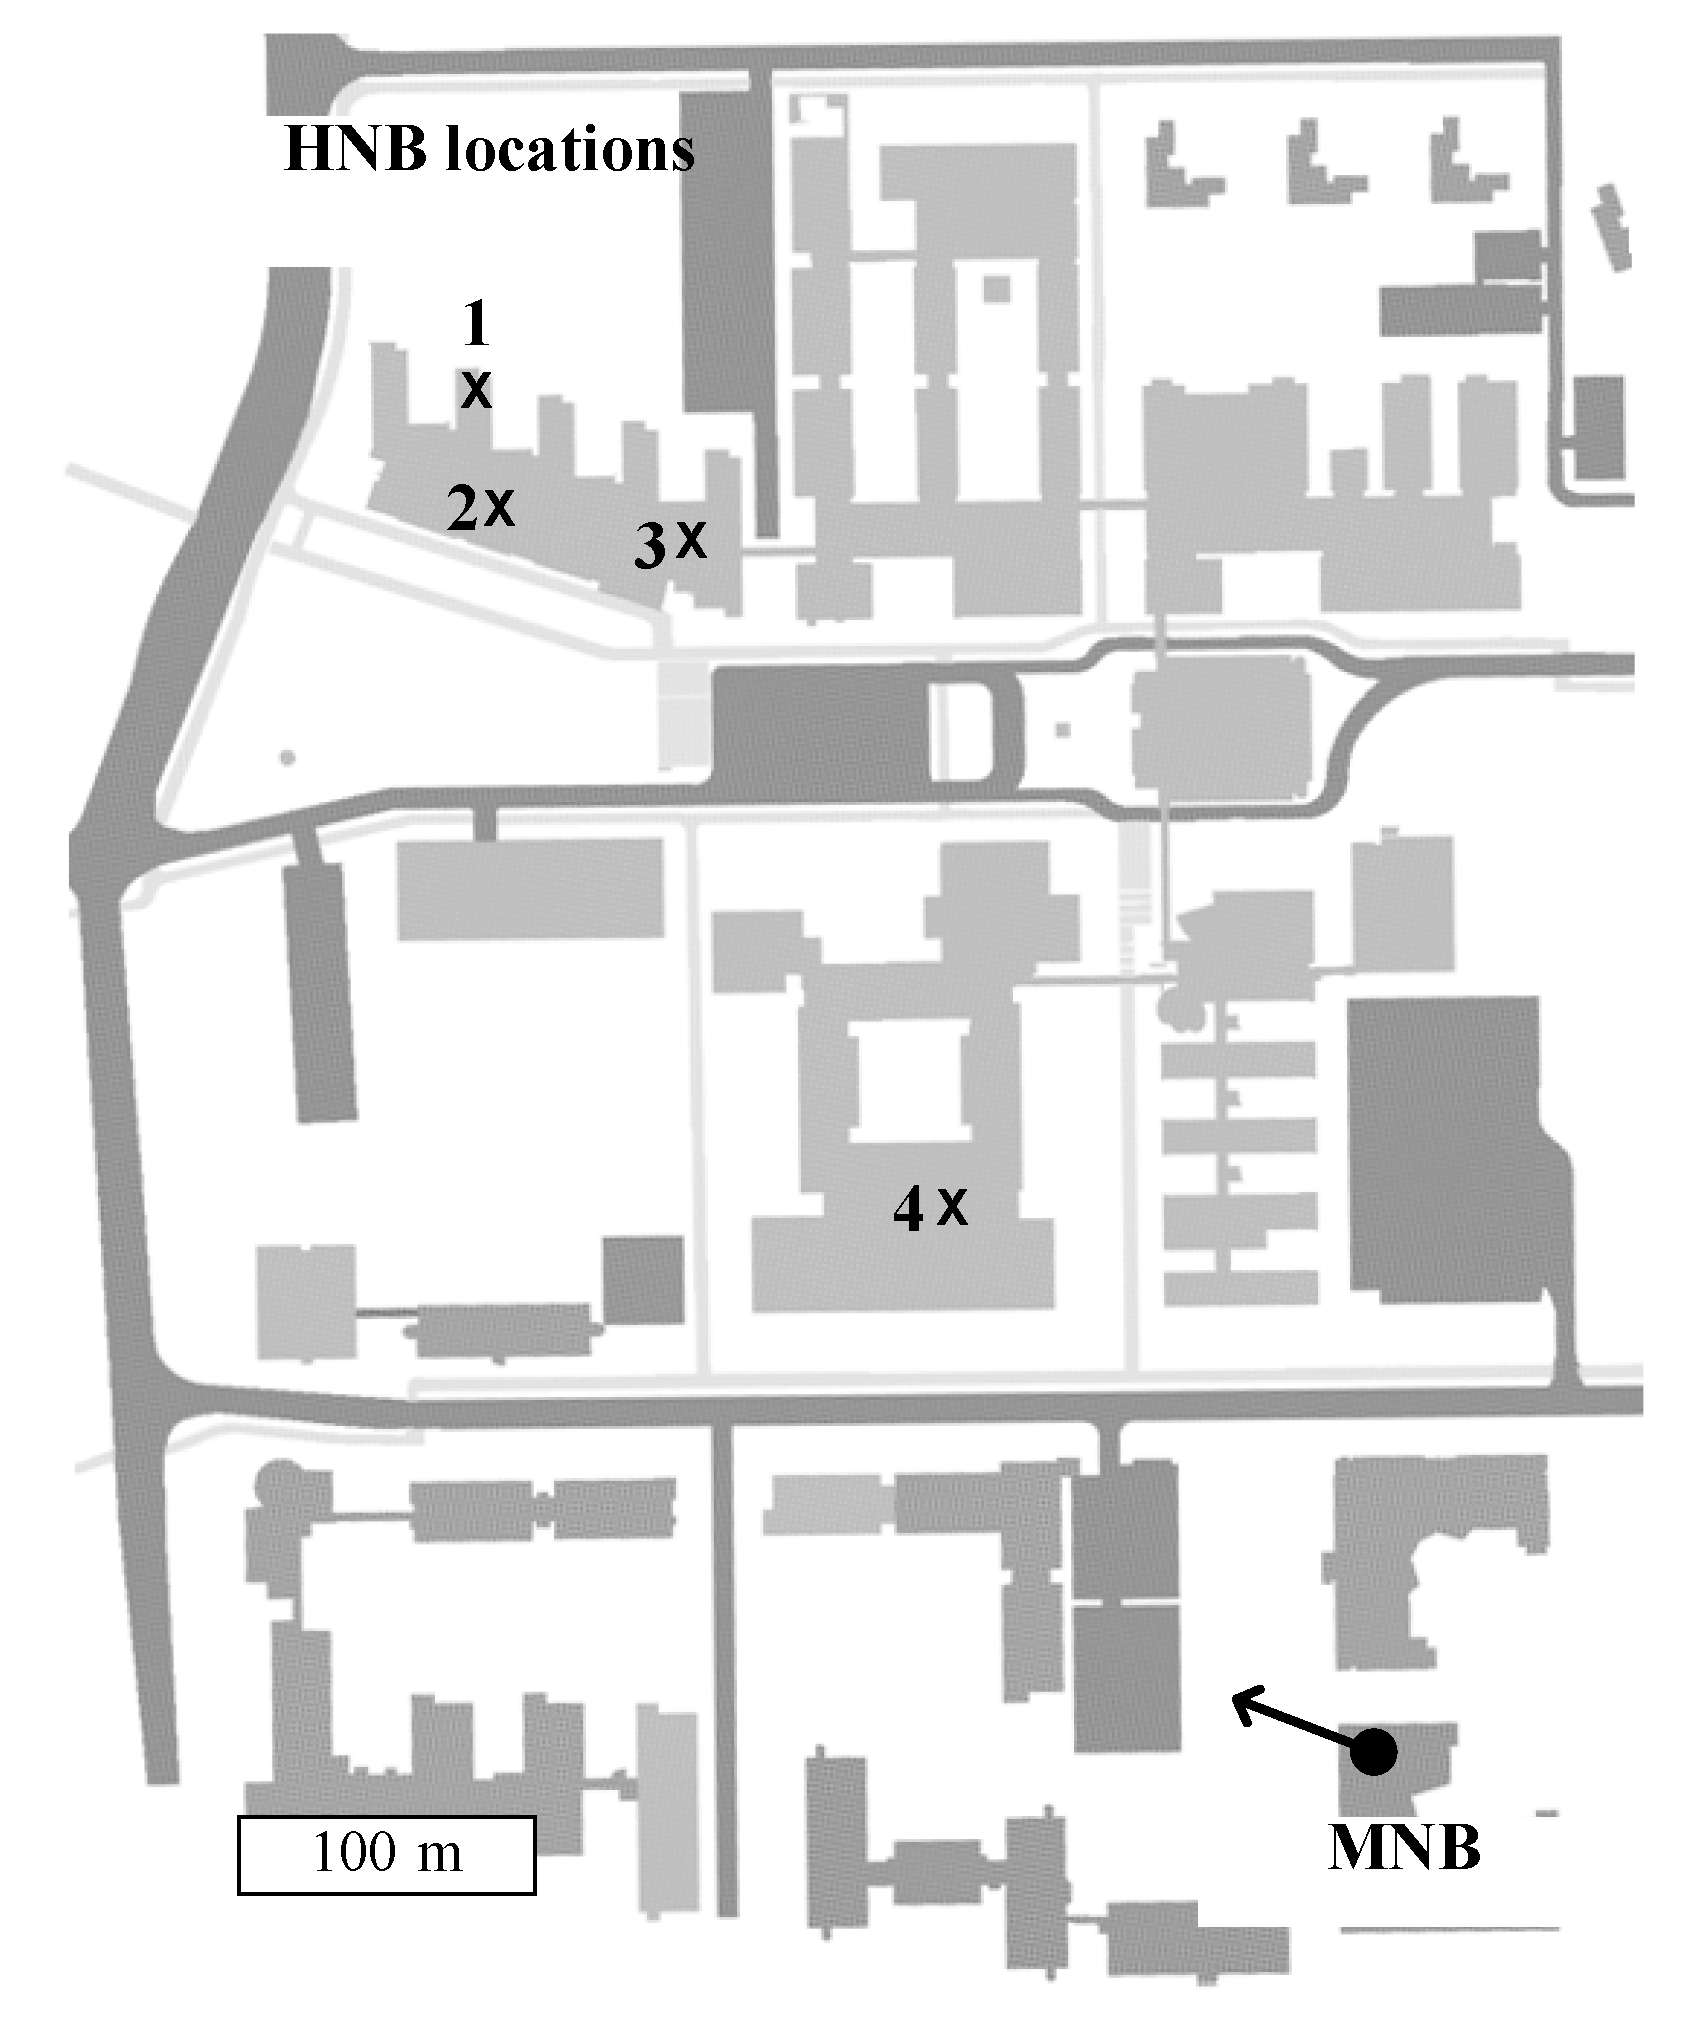
versus power settings, as well as interference scenario. We have performed co-channel measurements with a femtocell and a macrocell in the same frequency band (2132.4 MHz) and have ensured a very wide dynamic range of interference level from macro in our measurements, by performing the measurements at macrocell edge and macrocell center. The measurement campaign was carried out at the campus area of Tampere University of Technology (TUT). A Nokia Test Network (NTN) macrocell base station (3GPP Release 6) provided macro coverage to the entire TUT campus area. As the NTN is only used for test purposes, the network is considered empty after office hours and is ideal for simulation verification. The sector antenna of the macrocell base station was mounted on top of a nearby four-storey office building. For the measurement campaign, the HNB was deployed in offices, lecture rooms, or hallways at TUT and the chosen locations of the MNB and the HNB are shown in
Figure 11.
Figure 11.
HNB locations and MNB sector direction.
Figure 11.
HNB locations and MNB sector direction.
There are no buildings between the MNB and HNB location 4, hence LOS propagation, while a four-storey building is located in between the macro site and femto location 1, 2, and 3. Moreover, the distance between the MNB and the HNB locations varies between 250 m (Location 4) and 600 m (Location 1), while the MNB to HNB path loss was measured to 120 dB and 100 dB, for HNB location 1 and 4, respectively.
Throughout the measurement campaign, a single HNB was deployed at the measurement location and the backhaul was public internet via TUT network. Most measurements were performed after office hours to minimize the possibility of having other active UEs in the network,
i.e., minimize the uplink noise rise error. The HNBs, measurement UEs, and the measurement software were all 3GPP Release 8 compliant [
17,
18,
19,
20].
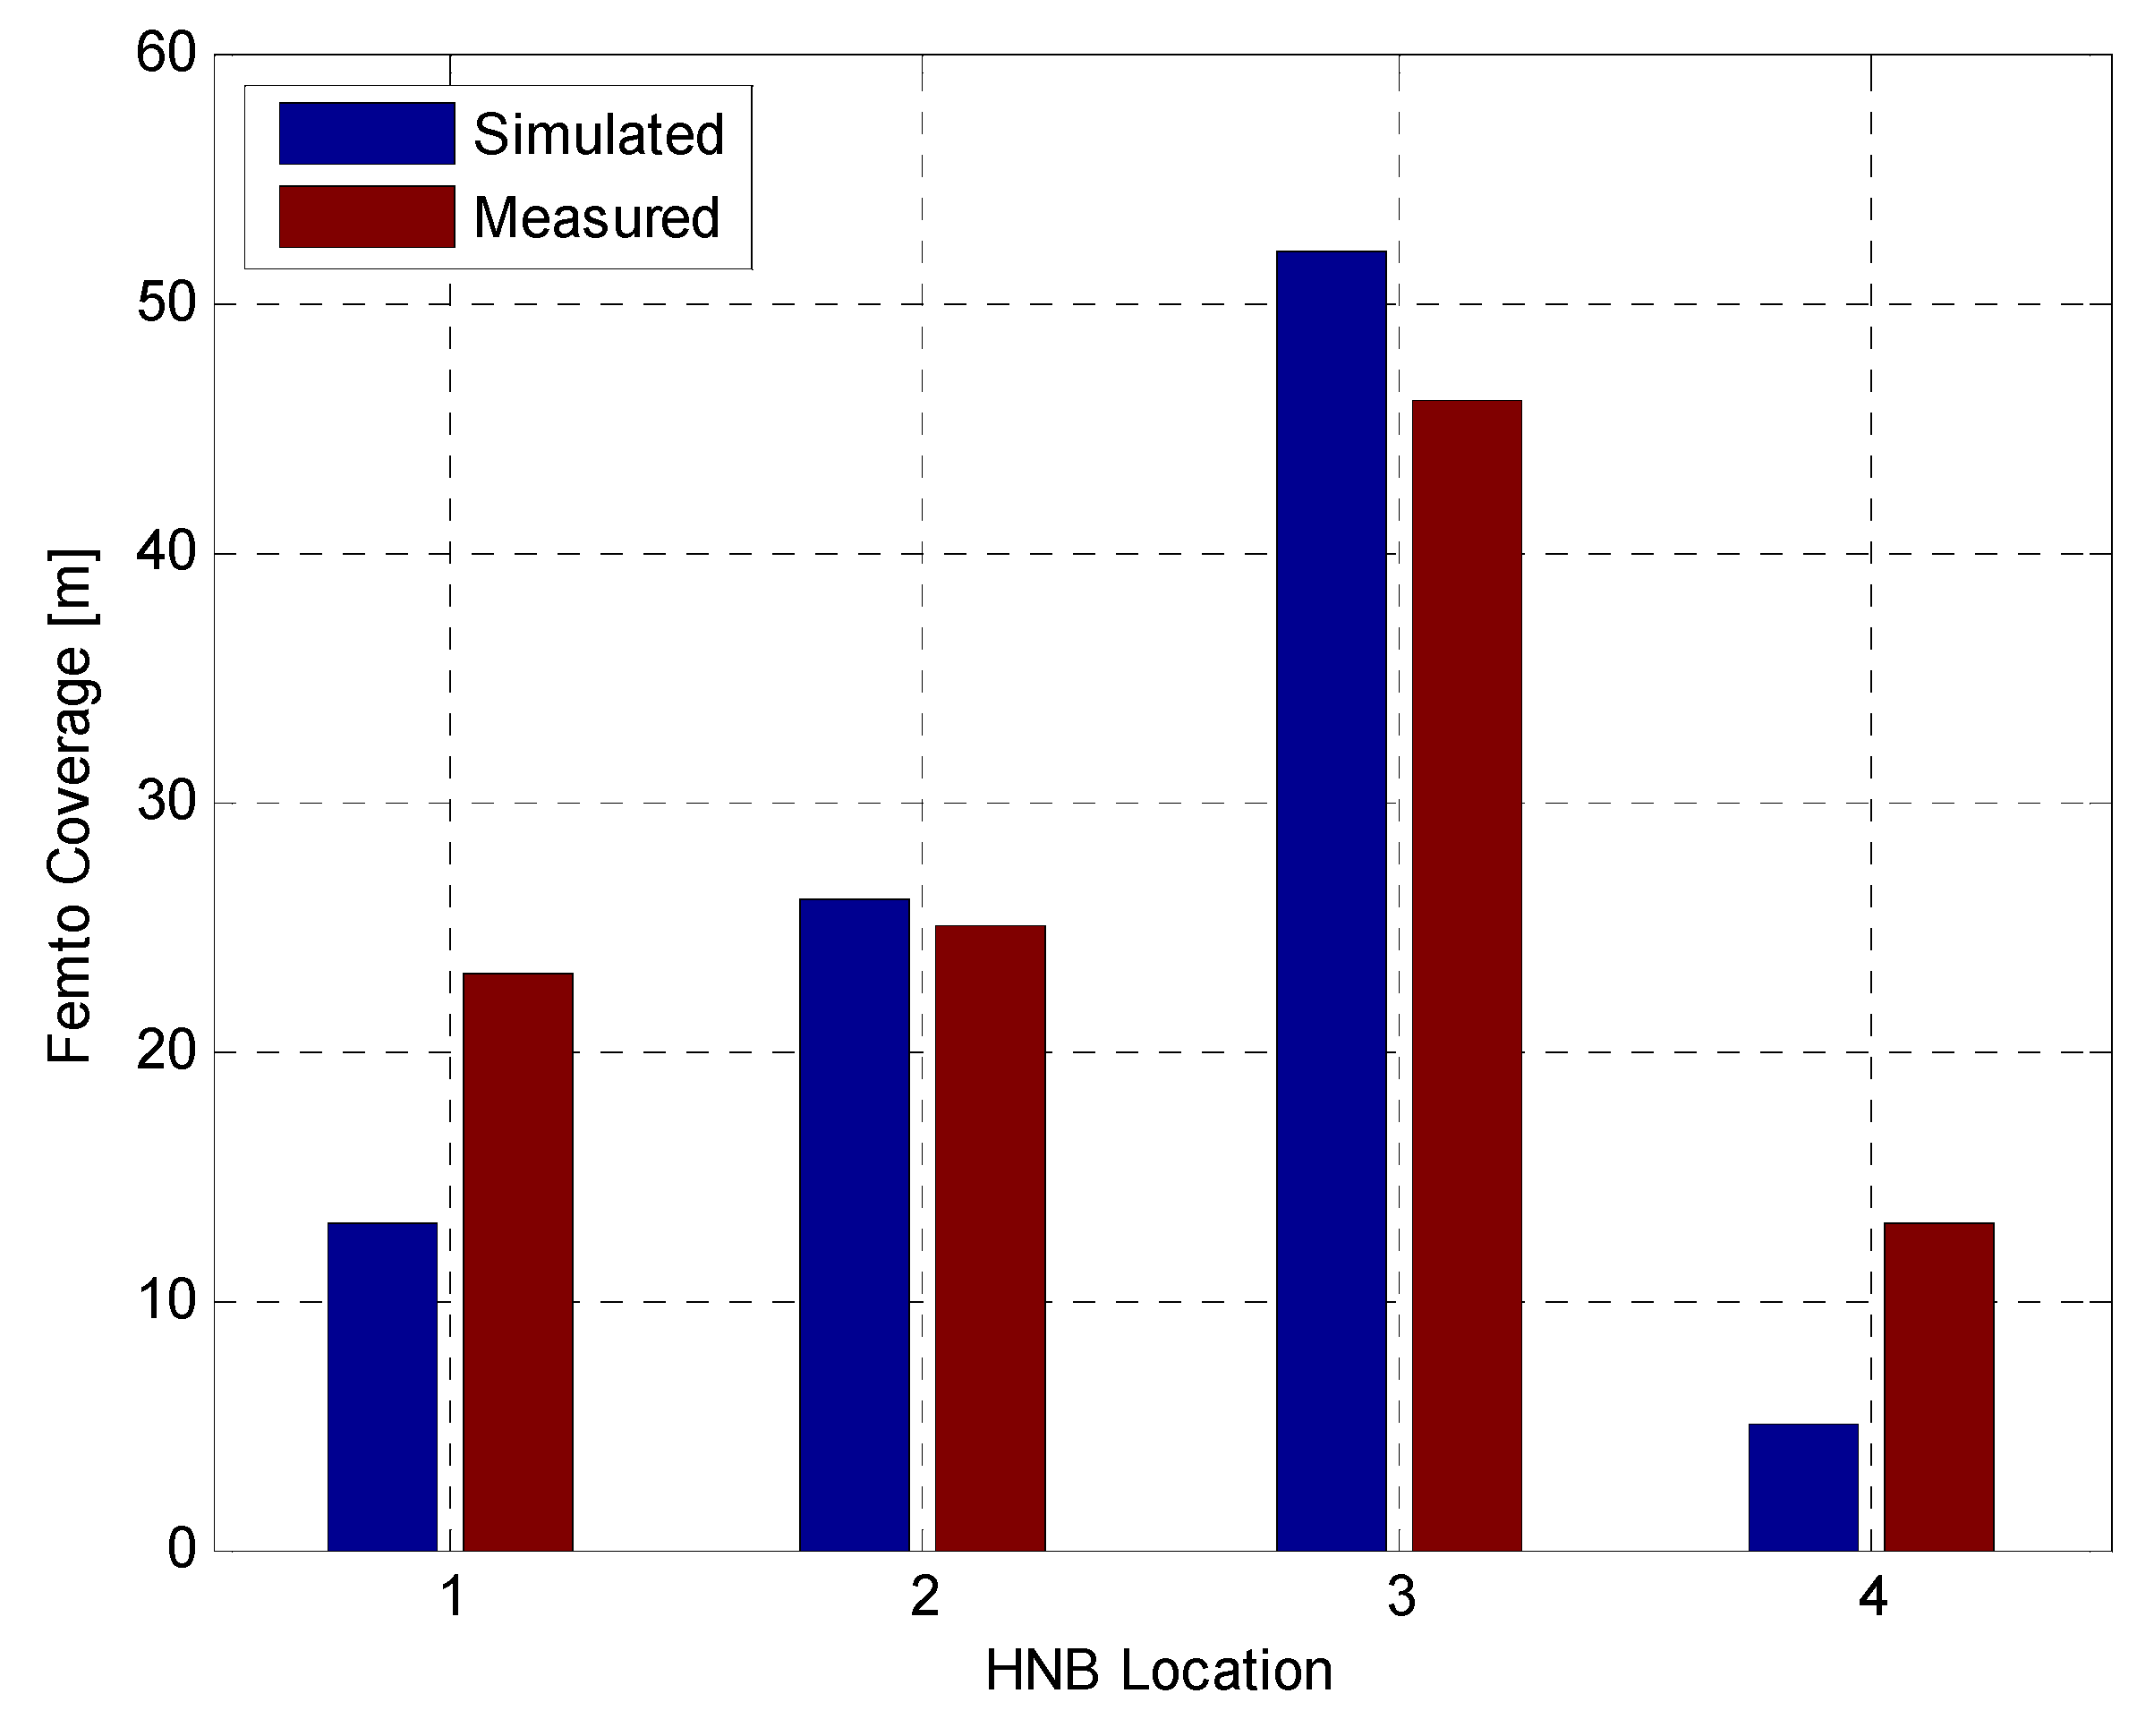
A key element for verification is the ability to predict the femtocell coverage zone accurately as function of set pilot and data power ratios. The CPICH power of the HNB was set to −10 dBm. Next, the femto indoor coverage was measured at all four HNB locations with very different macro interference levels. The measurement UE was placed close to the HNB and connected to the HNB. The femto coverage was measured by walking away from the HNB while the UE was kept in connected mode. The distance was measured to the location where the measurement UE lost femto coverage or handed over to the surrounding macrocell. This procedure was repeated three times and the femto coverage was determined by averaging the three measurements.
Figure 12 shows the measured femto coverage and the simulated femto coverage for similar RF conditions.
Figure 12.
Measured and simulated femto coverage.
Figure 12.
Measured and simulated femto coverage.
Despite the small differences the simulation results are considered verified by the measurement results. For example, in the simulations, the femto antenna patterns are assumed to be omnidirectional, though, in reality, this is not true. Due to practical implementation imperfections, the actual antenna pattern varied up to ±10 dB when measured in an anechoic radio chamber—the antenna pattern measurements are not presented in the paper. Consequently, the femto coverage area varies accordingly to the actual rotation of the HNB. Therefore, from
Figure 12, the measurement and simulation results show a good match given the expected accuracy, with some underestimation happening when HNB is near to the macro center.
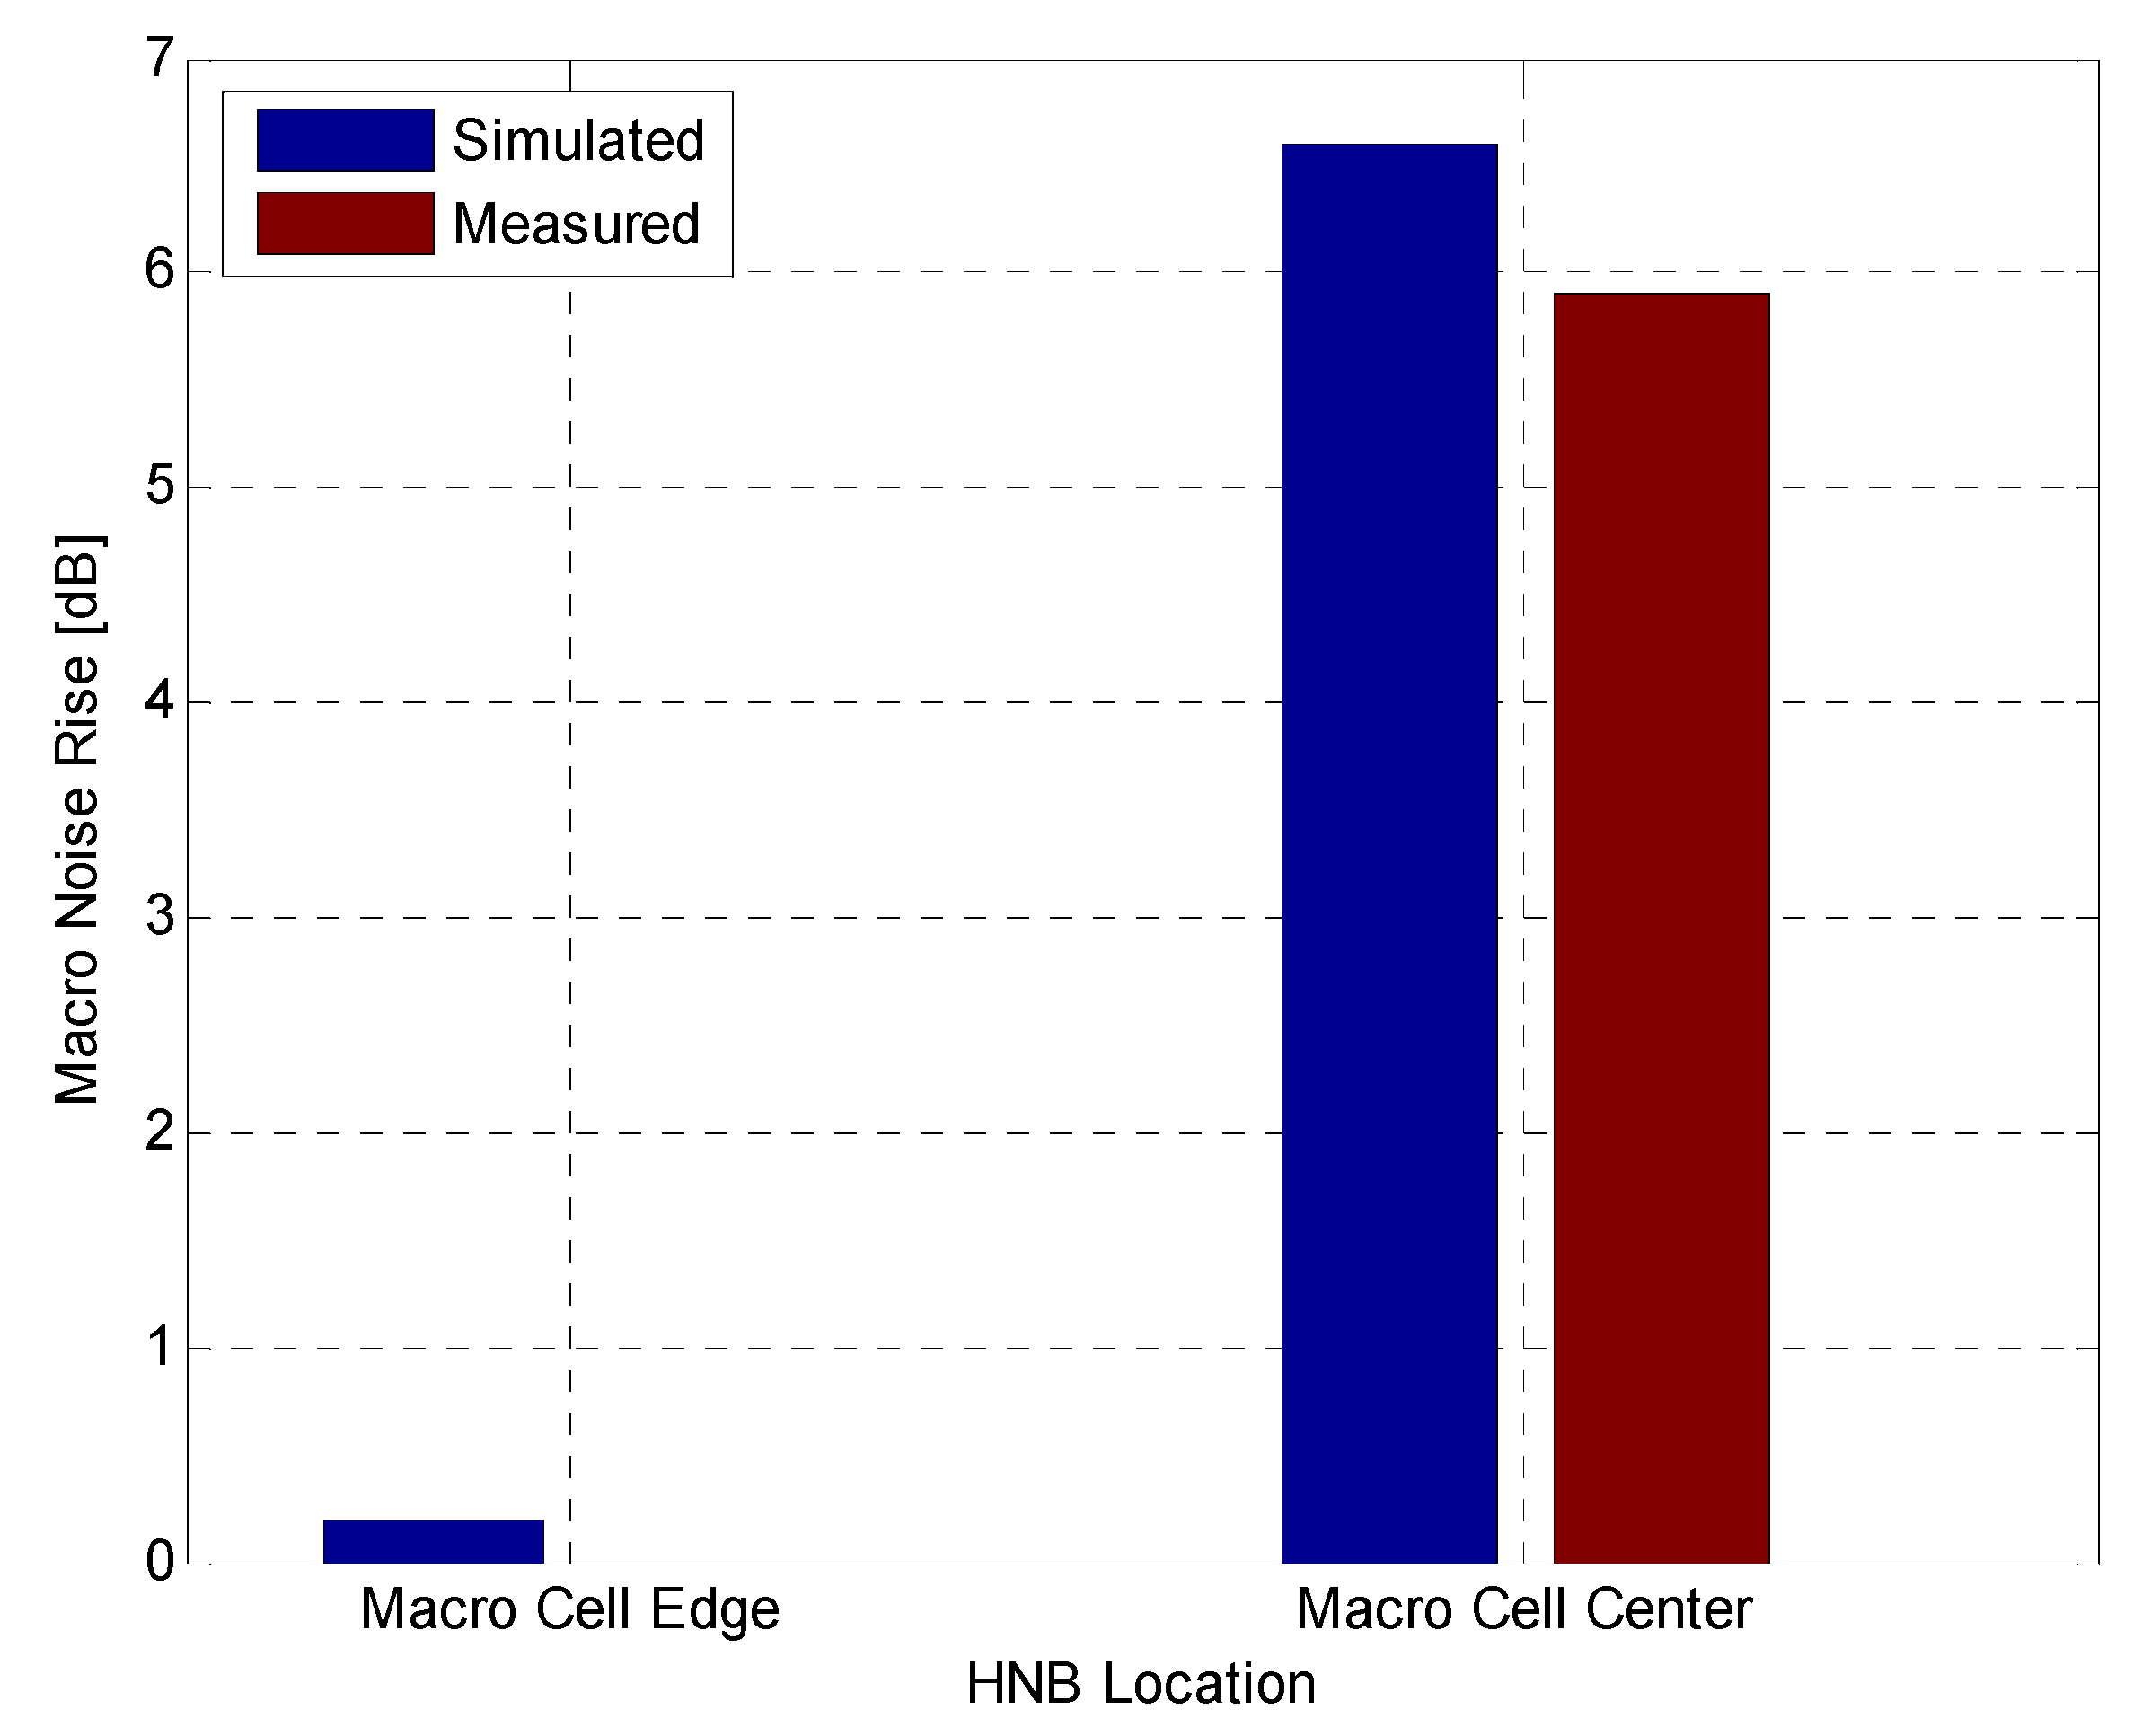
Next, it was verified whether uplink noise rise from HUE is effectively predicted by the algorithm, (1.9). The uplink noise rise caused by a single HUE was measured at locations 1 and 4. These locations were selected as they represent the extremes in terms of HNB to MNB path loss, as location 1 is located at macrocell edge and location 4 is located at the macrocell center with LOS propagation conditions. The measurements were performed by starting a HSUPA data session while the measurement UE was connected to the HNB and then forcing the HUE to transmit at the maximum allowed transmission level (0 dBm during the measurements), by walking away from the HNB, before leaving the femto building, still connected to the HNB, and causing the HUE to generate maximum possible uplink interference in the surrounding macrocell. By accessing radio network controller (RNC) data from the measurement time span, the potential uplink noise rise is found. The femto CPICH transmit power was 10 dBm during the measurements (e.g., case with rather aggressive coverage enhancement for the femtocell). The uplink noise rise measurements where performed at macrocell edge and at macrocell center.
Figure 13 shows the measured noise rise and the simulated noise rise.
The measurement and simulation results show a good match. The small differences between measured and simulated values are within the measurement accuracy and can be explained by the varying UE transmit power during the measurements due to the fading characteristics of the transmission channel between the HUE and the MNB and between the HUE and the HNB.
Figure 13.
Measured and simulated noise rise in the macrocell.
Figure 13.
Measured and simulated noise rise in the macrocell.
6. Conclusions
In this paper, we provided a framework for QoS self-provisioning for 3G small cells based on a lightly cognitive approach—the network listen mode. The QoS self-provisioning and interference management method utilizes network measurements to optimally configure power configuration of its different downlink channels, as well as the suitable uplink transmit power limits for connected users. The method works for both dedicated and shared carrier deployment of femtocells as well as for both open and closed subscriber group modes. However, in this paper, we have chiefly focused our attention on the most challenging shared channel and restricted access modes.
It is shown that our algorithm controls the target data rates with high accuracy and good robustness against the modeled dynamic effects which cannot be predicted by the HNB-only based method. Examples have shown only few percent outages of up to 1 Mbps downlink throughput and additionally guaranteed across the whole intended femtocell coverage zone. In uplink, fair rates around 256–512 kbps can be guaranteed, but beyond these rates, tradeoffs need be established. Besides controlling the desired femtocell service levels to tight margins, the solution offers additional benefits in terms of required downlink transmit power. Compared to not using power control and a fixed data to pilot power ratio, the proposed method provides 9 dB transmission power saving and better outage performance. Compared to a 3GPP reference method, the outage is very similar, but a power saving close to 4 dB is still achieved. By a simple parameter setting (coverage target set to infinity), the method automatically boosts the femtocell range while maintaining the QoS requirements at the cell edge. For the case where a 256 kbps service is sufficient, the method offers approximately 15-meter coverage radius increase compared to a no power control reference with a fixed and typical transmit power ratio.
The framework was partially verified by field measurements in an existing network deployment with femtocell deployed on same carrier as macro. The results show a good match between predicted and offered coverage in real network with test equipment for macrocell edge deployment of small cell. Furthermore, the assumptions related to uplink noise rise dimensioning were verified. The predicted NR contribution from a single user connected to the small cell was checked depending on the small cell geographical position during extensive measurement campaign. While not being a full verification of the proposed method, it verifies the main assumptions behind the algorithms. Future work will focus on moving beyond the initial parameter initialization to further enhancements that could be made possible by collecting measurements of end-users session throughputs and measurement reports from connected devices.


 , both the RSCP measurements at the HNB towards the strongest co-channel MNB,
  , and the desired femtocell coverage range,
  , are used. Optimal P-CPICH transmit power means configuration of pilot channel power in order to be able to obtain the required femtocell range. This range is defined where the users exactly sees the same RSCP from the target femtocell and from the nearest undesired cell (macrocell). We therefore estimate the required P-CPICH transmit power as

 , is described as

 is the common pilot channel transmit power of the surrounding macro. The external wall penetration loss is included here since we assume that the desired femtocell coverage area is confined to the indoor space. If the femtocells are installed outdoor with a certain desired coverage area, the value of Lp should be set to 0 dB.
 is the thermal noise power measured at the MNB which equals −102.7 dBm. The parameter iF represents the other macrocells interference to own macrocell interference ratio and is further described in [1]. Knowing the path loss from the virtual MUE to the MNB as well as an assumed fading margin,
  , needed to accommodate the expected fading observed by the MUE, we get to the final expression for virtual MUE transmit power as

 , is computed as

 . Knowing the other to own macrocell interference ratio, the thermal noise power and the allowed noise rise for macrocells,
 , is a sum of all observed interferer and noise powers, i.e.,

 , to satisfy the required uplink data rate at the cell border:

 , is calculated as:
 is the received power from HUEs at the strongest MNB and

 is the previously assumed value of the femto path loss. After reduction of the desired femto path loss according to Equation (11), the calculations from Equation (1) and onwards are repeated. Finally, when Equation (10) is fulfilled it is ensured that the computed HUE transmission power does not exceed the HUE power capping constraint

 , to reach the required downlink throughput at the cell edge is calculated as

 . We only consider macrocells not to put neighboring femtocells into a race condition where they keep increasing their power to fulfill cell edge rates. This would only lead to worse network performance and similar cell edge data rates for the competing femtocells. Utilization of RSCP makes the approach independent on network load during NLM measurements and we can then apply modification afterwards. The interference at the HNB,
  , is estimated as

 is the assumed ratio between the average total transmit power of a base station and its pilot power. We assume
  for the simulations but it is a parameter that is set by the operator depending on the macro network configuration.
 is the power of the common control channels and
  is the hardware limitation on maximum HNB transmission power. If Equation (16) is not satisfied the femtocell coverage is reduced according to Equation (11). The new configuration requires execution of algorithm with new configuration parameters from Equation (1).
 , where
  is the RSCP from the strongest received macro at the HNB (measured using NLM) and Pmax equals the maximum HNB transmission power. For both NOPC and 3GPP cases, it is assumed that the CPICH to total transmit power equals −10 dB. Recall from Section 3 that with QoS-SP-IM, the CPICH power is adjusted dynamically. For the simulations, we assume that the desired HNB coverage in terms of equivalent path loss equals 56 dB and 62 dB for the dense and suburban environments, respectively. These values can be estimated based on typical size of apartment/homes as, building types, and maximum separation between HUE and HNB.