Abstract
While the Internet increasingly permeates everyday life of individuals around the world, it becomes crucial to prevent unauthorized collection and abuse of personalized information. Internet anonymization software such as Tor is an important instrument to protect online privacy. However, due to the performance overhead caused by Tor, many Internet users refrain from using it. This causes a negative impact on the overall privacy provided by Tor, since it depends on the size of the user community and availability of shared resources. Detailed measurements about the performance of Tor are crucial for solving this issue. This paper presents comparative experiments on Tor latency and throughput for surfing to 500 popular websites from several locations around the world during the period of 28 days. Furthermore, we compare these measurements to critical latency thresholds gathered from web usability research, including our own user studies. Our results indicate that without massive future optimizations of Tor performance, it is unlikely that a larger part of Internet users would adopt it for everyday usage. This leads to fewer resources available to the Tor community than theoretically possible, and increases the exposure of privacy-concerned individuals. Furthermore, this could lead to an adoption barrier of similar privacy-enhancing technologies for a Future Internet.
1. Introduction
The Internet increasingly permeates everyday life of individuals around the world. On the other hand, information technology allows data analysis to a degree which was inconceivable a few years ago. Simultaneously to the increasing amount and availability of information about Internet users, new information retrieval, data mining and further technologies allow to automatically collect, filter and analyze personal information and to draw conclusions based on this process. Democratic societies should further advocate environments that respect user privacy for citizens and should support individuals who face repressive censorship to access public information without being identified or traced. In political regimes, where personal rights, the freedom of speech, and in particular free access to information is restricted, these possibilities of modern data collection can lead to persecution of individuals if their identity is unveiled. Another restraint is censorship, which may be used to restrict free access to information [1].
By using anonymization tools such as the Tor onion routing network [2,3], Internet users can conceal their virtual tracks to a certain degree by obfuscating their IP addresses, allowing for a more anonymous Internet access. With Tor, application messages are not directly routed to the receiver, but are encrypted and forwarded through ephemeral paths of Tor relays through an overlay network, using more complicated routes that are difficult to analyze for third parties. The more users participate, the harder it is to correlate senders and receivers, and the less likely it is for any user to raise suspicions simply by using Tor: “Anonymity loves company" [4]. The anonymity provided within the Tor network attracts many different groups of users, such as journalists and activists or business, governmental, military, and private users [5,6]. A recent study showed significant growth of Tor users in China as the governmental censorship increased and also in Iran when the riots after the presidential election took place [7].
However, due to usability problems caused by Tor, many “average" Internet users refrain from using it. This causes a negative impact on the potential overall privacy provided by Tor, since it depends on the size of the user community and availability of shared resources such as Tor relays. Besides one-time installation and configuration efforts, the main usability loss when using an anonymization tool such as Tor is an increase in latency. Several authors already discussed technically why Tor is slowing down a client’s Internet speed and proposed how to improve the performance [7,8,9]. However, detailed comparative measurements about the performance of Tor are crucial for assessing and solving this issue.
This paper presents distributed measurements on Tor latency and throughput for surfing to 500 popular websites from several PlanetLab nodes around the world during the period of 28 days (PlanetLab [10] provides a globally distributed testbed for network research). Furthermore, we compare these measurements to critical latency thresholds gathered from web usability research, including our own user studies. The resulting expected user cancelation rate—i.e., the percentage of users who abandon the wait during a certain time interval—is an indicator how easy it would be to keep existing users and to attract new, “average” Web users to Tor for increasing their own anonymity as well as the anonymity of the whole user community. Our results could also be relevant for integrating similar privacy-enhancing technologies into a “Future Internet".
The structure of the paper is the following. We present related work in Section 2, followed by a description of our measurement setup in Section 3. The experimental results are presented in Section 4. An interpretation of those results from the perspective of web usability is given in Section 5. Section 6 discusses limitations and future work. Section 7 concludes the paper.
2. Related Work
Even though Internet privacy is increasingly being covered in the media, many Internet users are still not aware of the attacks that threaten the privacy of their daily communication links. One important countermeasure against attacks on communication privacy is anonymization [11], the obfuscation of the identity of communication partners, especially of clients contacting a public server. As an important example, the Tor onion routing network provides privacy for Internet users by fundamentally enhancing their anonymity when using the Internet [2].
However, a fundamental problem associated with many of today’s security and privacy solutions is not primarily that the level of security they provide is insufficient, but rather their lack of usability. If the usability for certain security features is too low, end users are not willing to apply them, increasing the users’ personal risk of exposure to adversary attacks. Recent studies indicate that too complex security features are not applied unless they are mandatory, see for example the usage of security in banking scenarios [12]. The amount of time or money users are willing to spend for more security is restricted and differs individually.
There exist two ways to foster a broader application of security mechanisms: either (i) to increase the awareness of security risks in order to raise the willingness to pay money or time; or (ii) to increase the usability of the security features. In the case of Tor, we argue that due to its poor usability in terms of network latency, Tor is not as frequently and intensively used as would be desirable. A larger user base—with proportionate number of additional Tor relays—could enhance the privacy of its users indirectly by making Tor traffic (i.e., connections to well-known relays) less rare and suspicious. This argument is supported by research on economic network effects and the role of usability in anonymity systems [4,13].
Moreover, generalizing from current Tor adoption to future privacy infrastructures, if anonymity mechanisms are to be deployed to protect user privacy in a Future Internet [14], the performance expectations of average users need to be respected.
An important aspect of usability is the latency overhead caused by anonymization systems. Classical anonymity systems are mix networks, which were invented by David Chaum for anonymous email [15] and were later generalized to arbitrary anonymous communication [16]. In comparison to mix networks, Tor already provides much lower latency because traffic of different senders is not stored for a time and sent out in batches in order to counter timing attacks [2]. Recent studies provide a simulation analysis of the interrelation of network topology, additional synchronization and dummy traffic against timing attacks, anonymity, and overhead [17]. Even though Tor does not (yet) apply these additional protection measures, end user latency is still high.
Several authors have already qualitatively discussed why Tor is by design slow, or have proposed ideas how to improve the performance, e.g., [9] or [8]. An analysis of the number and the reported bandwidth of Tor relay servers from 2006 until 2008 gives an aggregated view on global Tor capacity and actual load [9]. Another study investigates the impact of different Tor path selection algorithms on anonymity and performance [18]. Further studies investigate the performance of Tor hidden services [19] and [20], which is different from our focus on accessing standard websites through Tor. Related research also includes demographic studies on Tor, e.g., number and countries of exit nodes or estimation of user numbers and origin [7].
In the Tor Metrics project [21], statistics such as number of users, relays, and bridges are collected. Furthermore, the duration and percentage of timeouts and failures of downloading files over Tor from a few data repositories are measured. These statistics also indicate that the performance of Tor is in general volatile over time, but the measurement of latency overhead compared to a direct connection is not provided. Furthermore, the number of servers used for these measurements is very small. In an earlier pre-study, we conducted three-day experiments from Germany to 50 websites [22]. There is also a report on Tor usage, including performance measurements [23] and the software TorFlow, a toolset for onion router performance analysis and measurements [24]. Another study [25] experimentally reveals a principal reason of Tor’s weak performance, namely frequent delays (as high as a few seconds) contributed by single, overloaded onion routers with low bandwidths. An interesting twist of our problem at hand is discussed in [26], where the impact of different latency values on de-anonymizing communication partners is investigated.
In contrast to these studies, our current paper focuses on an extensive quantitative assessment of the latency overhead of Tor, comparing the latency of Internet access from several countries with and without the application of Tor, using a list of 500 popular websites. Furthermore, we provide an analysis and mapping of these measurements to latency acceptance studies. For this, we define measures in order to estimate when users cancel their Web page request, or in other words, how much waiting time users tolerate for a request. These measures are based on related work and previous user studies conducted by the authors [27].
In the area of e-commerce research, there is a common understanding that waiting time impedes online commerce [28,29,30,31], although the authors do not agree on a single, exact classification and threshold for latency acceptance. Table 1 summarizes the existing literature about critical latency thresholds for Internet users, showing the different classifications.

Table 1.
Classification of Critical Latency Thresholds.
| Author | Critical Latency Thresholds (s) | Description | Year | Source Classification |
|---|---|---|---|---|
| Tolia [32] | 1 | Thin client response time—annoying | 2006 | Journal |
| Nah [33] | 2 | For simple information retrieval tasks | 2004 | Journal |
| Tolia [32] | 2 | Thin client response time—unacceptable | 2006 | Journal |
| Tolia [32] | 5 | Thin client response time—unusable | 2006 | Journal |
| AccountingWEB [34] | 8 | Optimal web page waiting time | 2000 | Practical advise |
| Bhatti [35] | 8.57 | Average tolerable delay (but high standard deviation of 5.85) | 2000 | Conference |
| Selvidge [36] | 10 | Tolerable delay by users | 1999 | Practical advise |
| Nielson [28] | 10 | Optimal web page waiting time | 1999 | Practical advise |
| Galetta [37] | 12 | Start of significant decrease in user satisfaction | 2004 | Journal |
| Nah [33] | 15 | Free user from physical and mental captivity | 2004 | Journal |
| Ramsay [38] | 41 | Suggestion as cut-off for long delays | 1998 | Journal |
3. Measurement Setup
3.1. Introduction to Tor
Tor can be described as an anonymizing overlay network on top of the existing Internet protocol infrastructure. Tor nodes serve as additional intermediate “hops” that obfuscate the relation between a client and the application-layer messages it sends or receives, such as HTTP requests and responses while accessing a website. Each communication hop between Tor nodes during such a message exchange is protected by layers of encryption and authentication and involves a different IP address than the original IP address of the client, thereby enhancing client anonymity [2]. The final connection between an exit node, i.e., the last node of the Tor network that is used for the current communication flow, and the destination server is not protected by Tor. But during this step, the origin IP address is only that of the exit node, not of the original client. Since the connection via Tor usually involves more routers and a large amount of cryptographic operations (Figure 1), it is expected to be slower than the direct connection (Figure 2). Furthermore, analyses conducted by Tor developers [8] revealed several other contributing factors to slow performance such as negative interactions with TCP congestion control, abusive users, low Tor network capacity, and imperfect path selection. Our goal is to quantify the total performance overhead of Tor as it would be perceived by end users and to assess its impact on usability.
We use a distributed setup of web clients, each represented by a different computer and Perl scripts for automatically executing web requests (see Section 3.3). Those scripts will measure the performance of connections via the Tor network as well as of direct connections without Tor. In addition the exit node will be recorded providing the IP address and the country of origin. Table 2 is a summary view of our complete setup and the results we present within this paper. In the following we describe what metrics, locations, and time frame we chose, and why. In the next sections we present our measurement results.
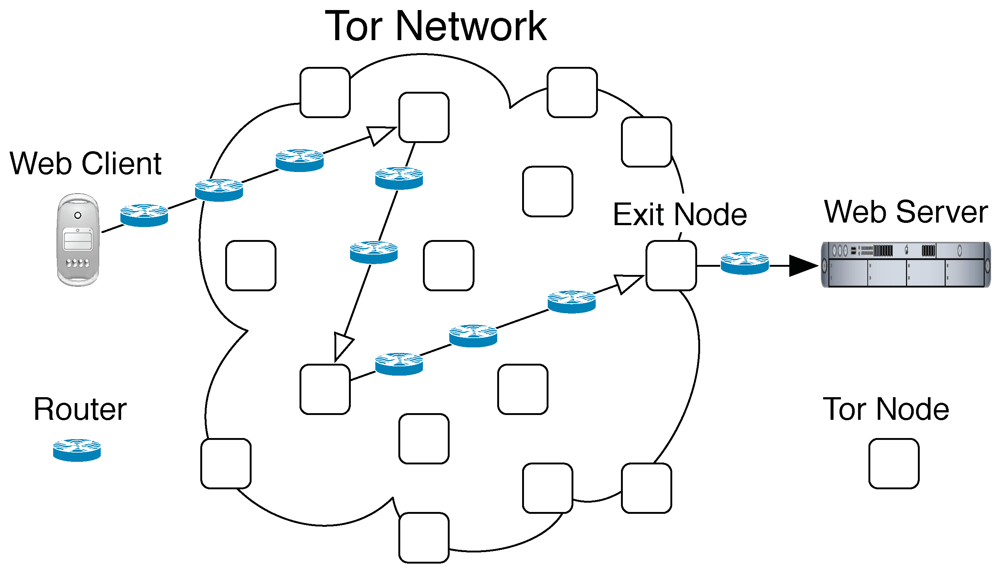
Figure 1.
Anonymous Web Access via Tor.

Figure 2.
Direct Web Access without Tor.
Table 2.
Setup Overview.
| Setup | ||||
| Metrics | Locations | Time frame | ||
| HTTP | Latency | Core | Australia | 28 days |
| Page | Brazil | |||
| Download Throughput | Canada | |||
| Germany | ||||
| Russia | ||||
| Taiwan | ||||
| UK | ||||
| USA (2 x) | ||||
| Results | ||||
| Tor vs. direct | Exit Nodes | Daytime Comparison | Mapping of User Cancelation Rates | |
3.2. Metrics
The most common use case for Tor is browsing web pages anonymously, which is supported by studies on Tor exit traffic protocols [23,39]. Therefore we focus on HTTP requests in our metrics. Moreover, in order to include bandwidth performance, we also measure throughput of upload and download requests. The throughput metric captures another important use case: transferring larger amounts of data from and to the web via the HTTP protocol.
The “anatomy” of requesting a website without Tor is shown in Figure 3. This figure displays line-by-line the corresponding exchange of network packets that could be captured by any router on the path between client and server. After the client (192.168.178.20) has learned the current IP address (95.100.157.15) of the web server (here an Akamai mirror of apple.com) via DNS (not shown in the trace), it establishes a TCP connection via a so-called three-way handshake (first three lines of the network trace). Now, the client issues the HTTP request for the main page with the “GET / HTTP/1.1” command, and the server returns an “OK” message as well as initial data. In later exchanges, the client requests additional data via further GET commands to download the complete web page.
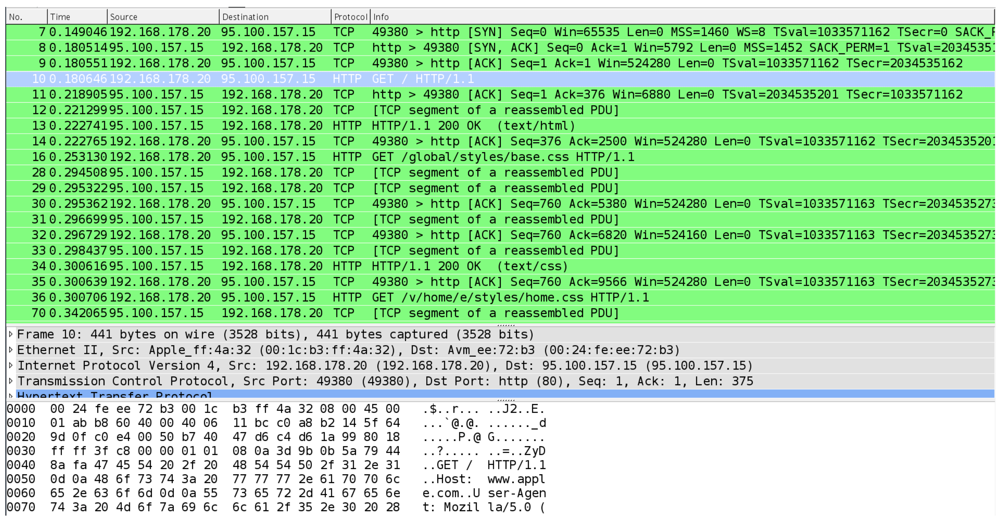
Figure 3.
Network Packets of a Direct Web Access.
3.2.1. Core Latency: Duration of the First HTTP Request
Core latency involves the time needed for the first HTTP request and the return of corresponding data (often, a basic HTML document only, without pictures). This is an indicator for a first data response that can indicate progress in the browser window. In order to measure the impact of Tor on surfing to important websites around the world, a Top 500 list of domains was selected. The list was provided by SEOmoz [40] and represents the 500 most linked-to websites on the Internet. During any single run of the experiment the Perl script triggers an HTTP request for each website (from the Top 500 list), measuring the performance once with Tor and once without Tor. All Tor requests were directed over the Socks proxy Privoxy. Privoxy then forwarded the request to the Tor network. The fact that current Tor client installations based on the Tor Browser Bundle do not need a proxy server increases ease of installation and use, but cannot significantly influence connection speed. Therefore, our results are transferrable to this case. Using the Privoxy filter option could slow down the browsing experience because every page is first completely downloaded by Privoxy and than forwarded. However, we did not activate Privoxy filters during our experiments, therefore pages were directly and continuously transferred.
Tor clients were running as daemons on our nodes over the whole time of the experiment. There might be some influence on certain measurements (temporarily increased latency) in the moment when Tor builds new circuits. Nevertheless, this reflects best the browsing experience since also in normal web browsing the user will be confronted with Tor building new circuits. Static data like images, videos or Javascript files were excluded from the experiment. For each request, date, time, request duration and received bytes were logged. This script was built in order to run until it has made a request to all 500 web sites.
3.2.2. Page Latency: Duration of a Complete Web Page Download
Page latency is an estimated measure for the download time of the complete web page (including pictures, scripts, external content etc.), an indicator for whole web page presentation in the browser window. There are many uncontrollable factors that have an influence on page latency, including current dynamic content, script execution, externally hosted content (mash-up), server reaction time, and the kind and version of web browser used.
In order to provide a reproducible and browser independent estimate for extrapolating page latency from core latency, we utilized the GNU Wget tool for downloading multiple complete web pages of the Top 500 lists via the command line. Our comparison is based on the wget and wget -p commands, where wget -p serves as an estimator for retrieving entire web pages including inline images, sounds, and referenced stylesheets.
We calculated an extrapolation factor 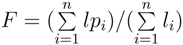 , where n is the number of web pages (here 500), lp the latency with wget -p, and l the latency with wget. Both latencies were measured 5 times in order to flatten one-time effects. Our results indicate an extrapolation factor F of 2.4, which means that on the average the following approximation holds: Page Latency
  Core Latency. Parallel control experiments using the Yslow plugin for Firefox indicated that this approach provides a good estimation in the average case for our set of websites. However, current web browser download web pages via parallel connections which should speed up the download of a complete web page.
, where n is the number of web pages (here 500), lp the latency with wget -p, and l the latency with wget. Both latencies were measured 5 times in order to flatten one-time effects. Our results indicate an extrapolation factor F of 2.4, which means that on the average the following approximation holds: Page Latency Core Latency. Parallel control experiments using the Yslow plugin for Firefox indicated that this approach provides a good estimation in the average case for our set of websites. However, current web browser download web pages via parallel connections which should speed up the download of a complete web page.To take this into account, we repeated our calculation of the extrapolation factor with the Parallel URL fetcher (puf) which is comparable in usage and functionality to wget and is able to retrieve web pages with parallel connections. The results show that with puf -p the extrapolation factor is in average 20% lower due to the use of parallel connections. Although parallel connections simulate a more realistic browsing experience because all common web browsers support them, we also have to take into account this could underestimate the loading of a complete web page. The reason for this is the inability of both wget -p and puf -p to retrieve all page-requisites a browser would need, since for example they will not gather any content requested via Javascript. Therefore, we have a reason why wget -p would overestimate the extrapolation factor (no use of parallel connections), but also why it would underestimate this factor (content not retrieved). For the purpose of this paper and backed by initial tests, we suppose that these inaccurate estimations on the average balance each other, and therefore adhere to the extrapolation factor calculated by using wget -p.
3.2.3. Download Throughput via HTTP
For download throughput, we compare the transfer time with and without Tor while downloading 50 KB and 1 MB of data via HTTP. Pre-tests showed that 50 KB and 1 MB are sufficient in order to have a good throughput indicator. Furthermore, these are also steps chosen by the Tor metrics project [21]. By choice, the target URL for this part of the experiment was fixed throughout the experiment, since download of arbitrary files from multiple sites could lead to practical problems and could cause random errors. The downloaded file was located on Google’s servers (http://dl.google.com/picasa/picasa3-setup.exe). Since this file is larger then required, the download was canceled after 1 MB. In this paper, throughput is used in the sense of effective “goodput”, referring to application-layer throughput and not the actually larger amount of bytes sent via the network. Transmission overhead such as a TCP header is not being considered according to the definition of goodput [41]. The Perl script was executed twice an hour in order to measure the traffic being downloaded. This was once done directly and once using Tor via the Socks proxy Privoxy.
3.3. Experimental Setup on PlanetLab
The aim of our experimental setup is to provide a long-time and international measurement of the performance of Tor compared to a direct connection. Therefore, we compare the direct access of multiple clients to multiple servers on the Internet with the same connections established via the Tor network. (Note that this is the case of page latency measurements. For the download experiments we used only one target server.) Moreover, we deploy clients internationally with the help of the network research platform PlanetLab (http://www.planet-lab.org/) [42]. For this, PlanetLab nodes from most continents were chosen. It was not possible to find reliable PlanetLab nodes in Africa during the time of our experiment.
Table 3.
Experimental Statistics.
| PlanetLab Nodes as Web Clients | Country | Uptime (days) | HTTP Requests | Downloads |
|---|---|---|---|---|
| pl2.eng.monash.edu.au | Australia | 38 | 592,773 | 43,212 |
| planetlab2.pop-parnp.br | Brazil | 38 | 525,863 | 42,712 |
| mercury.silicon-valley.ru | Russia | 38 | 605,313 | 44,850 |
| planetlab2.aston.ac.uk | United Kingdom | 36 | 418,217 | 37,023 |
| planetlab2.wiwi.hu-berlin.de | Germany | 33 | 464,604 | 37,700 |
| planet-lab1.cs.ucr.edu | USA (West Coast) | 30 | 325,305 | 38,759 |
| orbpl1.rutgers.edu | USA (East Coast) | 25 | 279,339 | 24,684 |
| planetlab02.erin.utoronto.ca | Canada | 24 | 355,481 | 32,747 |
| adam.ee.ntu.edu.tw | Taiwan | 23 | 252,936 | 25,598 |
Each PlanetLab node provides its users with a minimal Fedora Core 8 Linux installation [10]. For our experiments, additional software needed to be installed. On all PlanetLab nodes we used Tor in version 0.2.0.32, Privoxy in version 3.0.6, Perl in version 5.8.8, Perl-CPAN in version 1.76_02, and LWP::UserAgent in version v5.835.
Table 3 shows the PlanetLab nodes that were selected for the experiment and experimental statistics. All nodes were capable of executing the Perl scripts for our experiments. Some other nodes we initially selected had to be excluded from the experiment. For example, our supposition why a PlanetLab node in China was not able to connect to the Tor network via public relays is that since September 2009 Chinese authorities started to block the Tor network in China [43,44].
3.4. Time Frame
In order to gain representative data from the tests, a time span of 28 days was chosen, starting on the 20th of December 2010. For the purpose of a direct comparison we had to leave out days when not all of the nodes were running. Observing such a long period, however, will prevent a biasing of the results caused by random load effects of PlanetLab nodes and their network connections. Initially, nodes started the HTTP script twice and the throughput scripts four times within an hour. Because some of the nodes provided only a very slow connection and the scripts would not finish before the next was started, this frequency was reduced. The HTTP script was then started once and the throughput scripts twice during an hour. But even with this change in the setup, scripts were sometimes started a second time before the last script was finished, but this did not impair the quality of the measurements.
4. Measurement Results
Each of the following subsections will describe the results of one of our metrics (http, download). Furthermore, we will present results concerning specific nodes and a comparison between different times of the day.
4.1. HTTP Requests
In this section the speed of usual web browsing between Tor and a direct connection is compared. The speed and duration were measured by executing an HTTP request. Table 3 provides an overview of all PlanetLab nodes, their uptime, and number of successful requests.
Figure 4 compares the durations of a request run with Tor and without Tor, displaying the 25% and 75% quantile of all requests. In this figure, all nine nodes are listed and it shows that all Tor connections are by far slower than a direct connection irrespective of the request’s origin. Only the node in Canada sticks out because it took 4.7 s for the 75%-quantile of direct connection requests, which is by far the highest value for a direct connection. The figure also shows a comparison between the several median durations of a request. It shows that Tor requests from Canada are by far the slowest in our experiment. When comparing direct requests with requests tunneled through Tor, one can observe that the ratio (Tor/direct), which yields 4.8, is similar to the ratios measured at the other PlanetLab nodes. An explanation for this phenomenon could be a high traffic load that slowed down both the Tor connection and the direct connection. The average ratio of HTTP request durations (Tor/direct) of all nine PlanetLab nodes is 4.1.
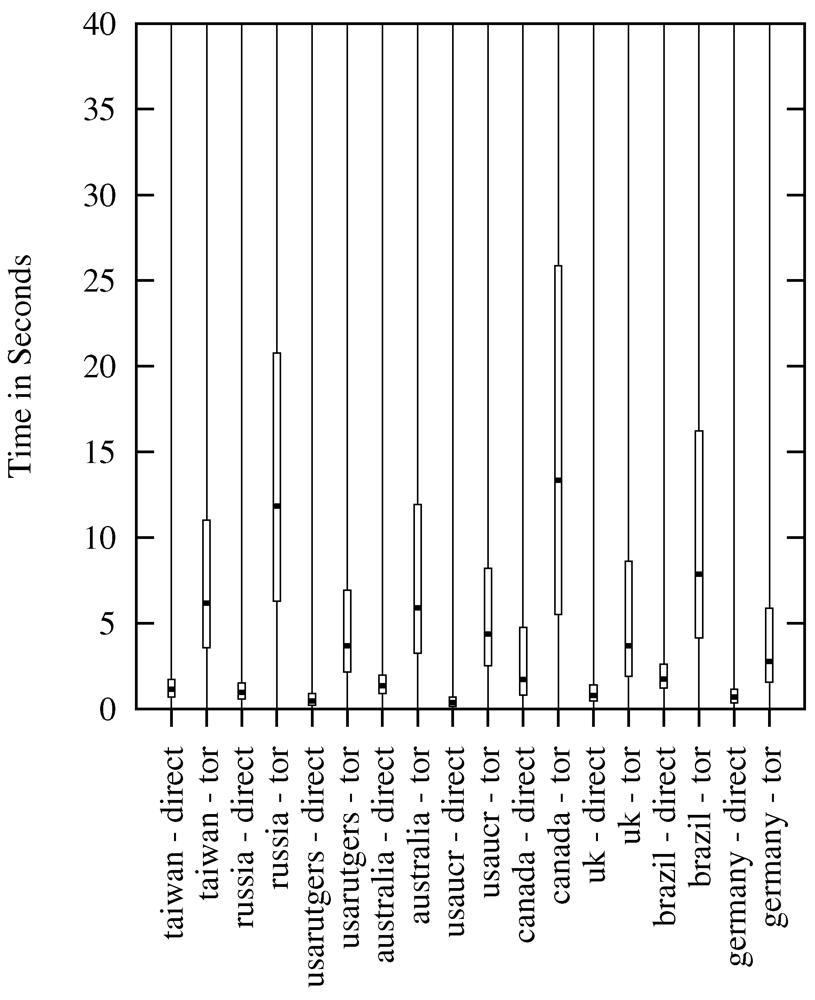
Figure 4.
Averages of Core Latency for HTTP Requests.
Another observation is that the four nodes located in Germany, UK, and USA always have the fastest Tor connection compared to the other nodes—only these four nodes have the 75%-quantile below 8.7 s, and all other nodes are at least above 11 s up to 25.9 s. When regarding the median time of a request through the Tor network, the nodes located in Taiwan and Australia are almost as fast as the aforementioned four. Only the PlanetLab nodes in Brazil, Russia and Canada were significantly slower in terms of average, median and quantiles. The fact that connections from Germany, UK and USA are the fastest could probably be related to the fact that more than 50% of all Tor nodes are located in these countries [45]. One reason supporting this supposition might be a smaller geographical distance for the first entry point. Other studies showed that distance influences latency [24,46].
4.2. Download Requests
Figure 5 and Figure 6 show a comparison between the two connection types (with/without using Tor) from every PlanetLab node and the time it took to download 50 KB (Figure 5) and 1 MB (Figure 6). Most of the nodes have nearly the same median download speed, which is contributed by the fact that Google makes the downloaded file accessible with high download speed around the world, rendering the location of the node less significant [47,48]. Similar to the HTTP request results, the node in Canada was the slowest one, confirming the hypothesis that it had a lower bandwidth available for this experiment. This is also indicated by the median connection times.
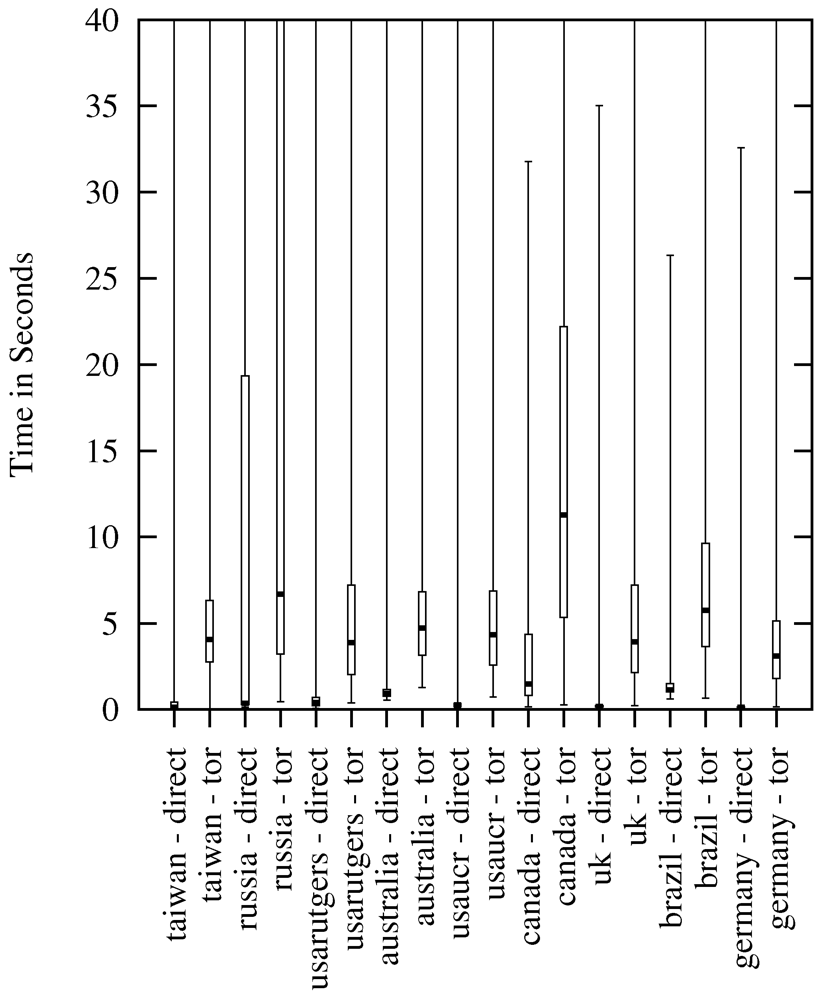
Figure 5.
Average Download Throughput (Time for 50 KB).
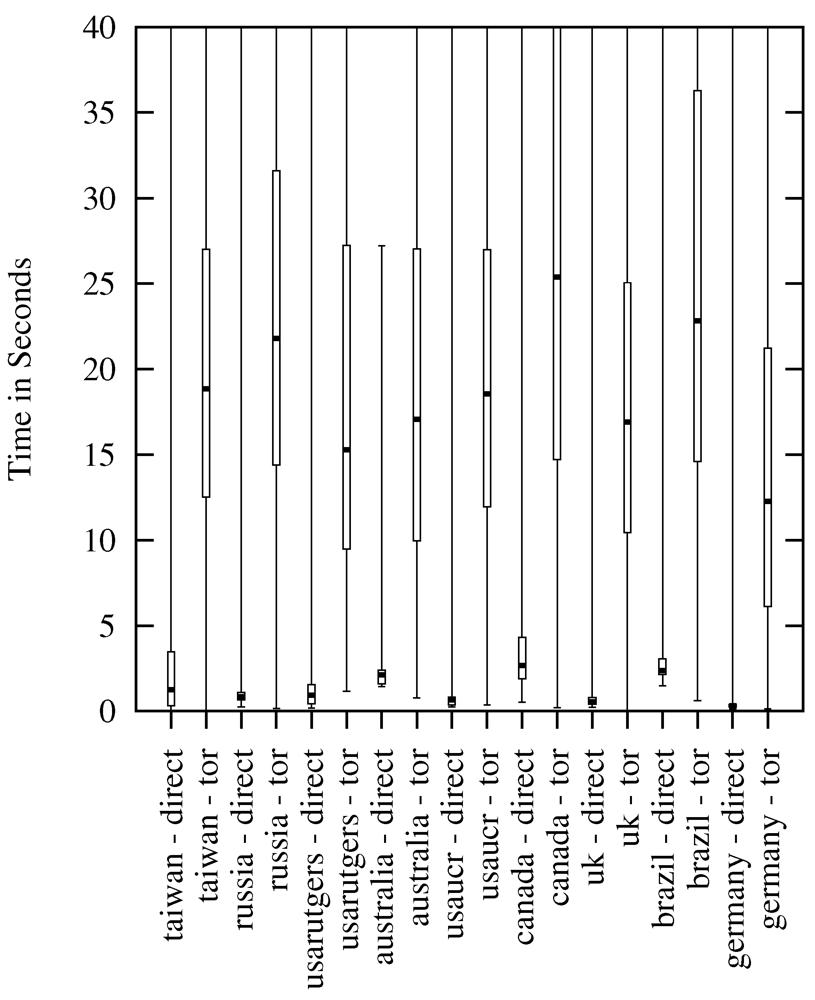
Figure 6.
Average Download Throughput (Time for 1 MB).
Download measurements (from different web servers) are also conducted by the Tor metrics project [21]. During the timeframe of our experiments, the median value for downloading of 50 KB was reported as between 3 and 4 s, and for downloading of 1 MB between 9 and 15 s. Our results of downloading 50 KB were between 3 and 11 s (median), and for the download of 1 MB between 12 and 26 s (median). We see them as comparable. The difference is that the Tor metrics results were measured on the same nodes and differ in time, whereas our results differ in nodes and are averaged over time, probably causing a higher variation.
4.3. Exit Nodes
In order to empirically verify Tor statistics in practice, we also measured the exit node distribution depending on the source of the request. For each Tor request, the IP address of the exit node was recorded. Exit node locations were identified with the help of Utrace [49]. During the experiment, over 2.2 million records for exit nodes were recorded, which were located in 65 different countries.
With respect to the two connection types (HTTP single request, download), no significant differences were noticed. An intuitive explanation is that the Tor architecture and route calculation is the same for all connection types. Taking the usage of the exit nodes into account, we observe that the distribution of exit nodes used during the experiment is proportional to the distribution of exit nodes of the whole Tor network as reported by official Tor statistics. Comparing the amount and usage of exit nodes, one can confirm that exit nodes in countries known to be hosting a lot of Tor nodes were in fact used more frequently than nodes in countries hosting only a few. Figure 7 shows where the exit nodes were located during the entire experiment.
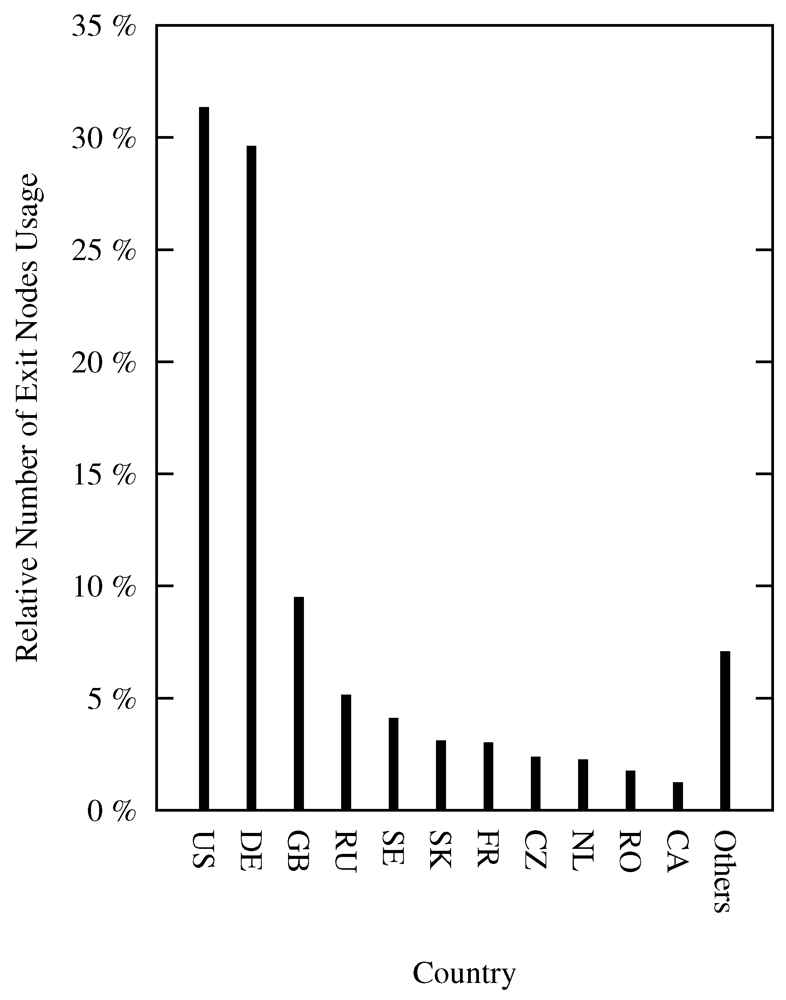
Figure 7.
Exit Node Distribution.
4.4. Daytime View
In the following, we investigate if and to what extent the daytime has an effect on the performance of a request of the two connections types, i.e., via the Tor network and the direct connection. In Figure 8, the average core latency of all nine nodes for every hour of a day for both connection types (Tor and direct) is displayed. (We tested for the node in Germany that the average has a similar progression like the median, the 25% and the 75% quantile.) The other metrics show very similar results, therefore we did not visualize them. In order to allow for a better comparability and to take the time shift of the geographical location of the nodes into account, we represented the timestamps for every request in GMT. Furthermore, we highlighted the local time at noon by means of a vertical dotted line in Figure 8.
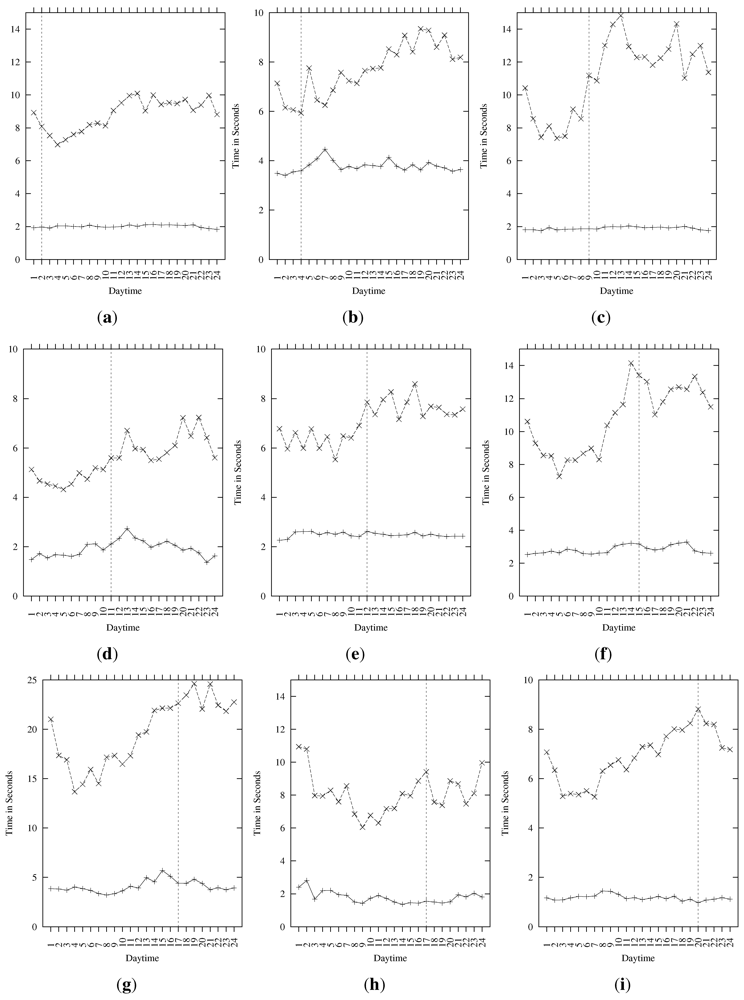
Figure 8.
GMT Daytime Comparison (Core Latency; +: Direct, x: via Tor). (a) Australia; (b) Taiwan; (c) Russia; (d) Germany; (e) UK; (f) Brazil; (g) Canada; (h) USA (East Coast); (i) USA (West Coast).
Our results indicate that the latency of direct connections is nearly constant over time of the day on most nodes. Especially Australia, Russia, UK, Brazil and USA (West Coast) show very little differences regarding the performance during different hours of a day. Only the nodes in Germany and Taiwan have a noticeable peak after noon (local time). The node in Canada shows a peak at 10 AM local time, and in the USA at 9 AM local time. The other metric, download throughput, confirms these results. We argue that this stability of the performance of the direct connection is provided by the mature backbone infrastructure of the Internet which has enough capacity available for web access even during Internet “prime-time” when approximately 25% of all traffic is generated [50] and Internet traffic is about 72% higher than during an average hour [51].
Comparing both connection types, i.e., the direct connection and through Tor, we can state that the daytime has a stronger influence on the Tor network than it has on the direct connection. This finding is consistent for all metrics. The Tor connection does not show a stable performance and seems to be affected by daytime. There does not seem to exist an exact common pattern explaining the performance variation of the Tor connection (cf. Figure 8). However, in general the overall performance appears to be decreasing during GMT evening hours independently of the location of the PlanetLab node.
Contrasting this with the results for direct connections, we argue that this effect is more dependent on the performance of Tor than on the geographical location of the client nodes. Tor nodes are usually selected worldwide in a random fashion, without preference for nodes which are physically close [52]. Although it is not part of the Tor route selection process, traffic is often routed through nodes located in different countries, and every node adds some latency. Since Tor nodes are not evenly distributed around the globe, Tor speed could correlate with the current local daytime of the majority of nodes in use (such as UK and Germany). This leads us to the conclusion that the diurnal behavior of Tor latency is in general more influenced by global factors than by local factors at the client.
5. Interpretation of Results with Respect to Usability
In this section, we focus on the combination of our technical measurements with studies of user behaviour while browsing the web. The aim is to reason about the influence of the latency that we measured on user acceptance. We already introduced critical latency values gained from experimental research (cf. Section 2). According to this related work, in particular in Table 1, we assume that user tolerance of waiting for web-page requests decreases after 2 s; it falls sharply within the interval between 7 s and 15 s, and ends with 50 s when the user stops waiting. In our opinion, the related research conducted by Nah et al. [33] is best suited for our experiment due to its empirical grounding and most recent data in comparison to the other studies. However, we extend these experimentally measured lab results [33] with results stated by users from our own survey [27].
Figure 9 shows four different scenarios with cancelation rates over time. The curve labeled “Nah without FB” is referencing the “first-attempt waiting” scenario of Nah in which the user is confronted with a broken link while not getting any feedback from the web browser [33]. Here, an important metric is introduced: the percentage of users who abandoned the wait during the time interval specified.
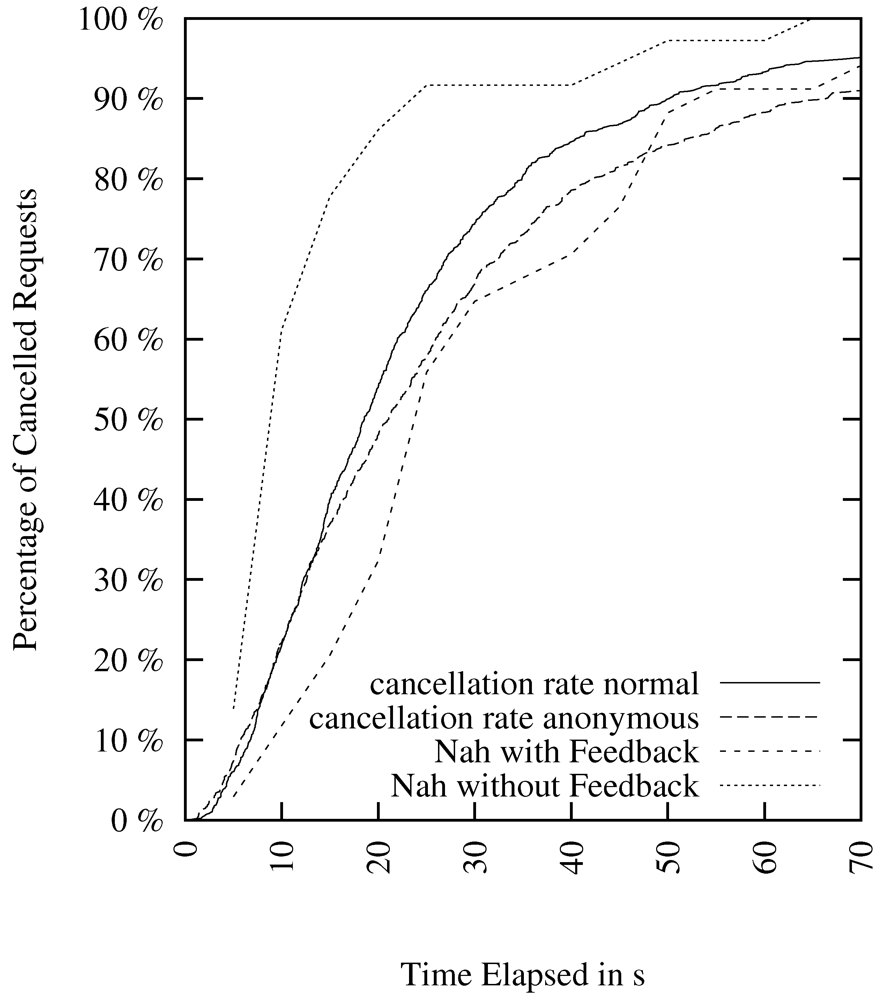
Figure 9.
Cancelation Rate of Different Scenarios.
We adopt this cancelation rate as a good indicator for the user’s waiting tolerance in our setting. The curve labeled “Nah with Feedback” is referencing the first attempt waiting scenario in which the user is confronted with a broken link while getting feedback in form of a progress bar from the web browser [33]. The other two scenarios are derived from our own survey and show stated tolerated waiting times for normal and anonymous web browsing. Those two cancelation rate curves indicate that people surfing anonymously have a higher tolerance in terms of latency. Nevertheless, the gap between the curves is small: The correlation is 0.989, the medians are 18.556 and 21.096 s, respectively. There are 948 data points. The maximum difference D between the cumulative distributions according to the Kolmogorov–Smirnov comparison is: 0.0854, with a corresponding p-value of: 0.002 (statistically significant at 0.5% level). Furthermore, we note that our survey results also confirmed the results of Nah’s lab experiments.
In order to reason about expected cancelation rates for browsing the web via Tor, we map our technical latency results to corresponding user cancelation rates. On the technical side, we apply our core and page latency measurements for both direct connections and connections over Tor. Page latency, estimated by the applying the measured factor 2.4 to core latency, increases the median of core latency for HTTP requests via Tor from 13.36 s to 32.06 s. The median of HTTP requests without Tor increases from 1.72 s to 4.13 s.
From a usability perspective, we are provided with stated as well as experimentally measured user cancelation rates. As stated cancelation rates, we have statements for direct connection and anonymized connection. Experimental cancelation rates can be divided in those with and without feedback. Out of the  possible combinations, Table 4 shows the meaningful mappings. The results from the lab experiment with feedback can be mapped to page latency because the user is given feedback during loading of the page (the page builds up stepwise). The lab experiment without feedback should be mapped to core latency because the user gets no detailed visual progress feedback until first data is retrieved.
possible combinations, Table 4 shows the meaningful mappings. The results from the lab experiment with feedback can be mapped to page latency because the user is given feedback during loading of the page (the page builds up stepwise). The lab experiment without feedback should be mapped to core latency because the user gets no detailed visual progress feedback until first data is retrieved.
Table 4.
Comparing Cancelation Rates from User Studies to our Latency Measurements.
| Type of Cancelation Rate | Direct, Core Latency | Tor, Core Latency | Direct, Page Latency | Tor, Page Latency |
|---|---|---|---|---|
| Lab with Feedback | – | – | X | X |
| Lab without Feedback | X | X | – | – |
| Stated Direct | X | – | X | – |
| Stated Anonymous | – | X | – | X |
In Figure 10, Figure 11, Figure 12, Figure 13, we present our mappings of technical latency results (LT) and corresponding user cancelation rates (CR) of Figure 9. Each of the four figures describes a different type of cancelation rate and the meaningful mappings for technical latency (from Table 4). The extrapolated page latency (full page download) is referenced by PAGE, the core latency (HTTP request duration) by CORE, while requests directed via the Tor network are referenced by Tor, and direct requests by Direct.
The mapping in Figure 10 shows technical measurements of page latency (i.e., page loading time) and the resulting cancelation rates of users who are provided with feedback while loading the page. This figure indicates a high increase in user cancelation when sending requests via Tor. The median of page latency via Tor corresponds to a median of 67% cancelation rate, while user frustration for the median of direct page latency maps to only 2% cancelation. This gap between cancelation rates indicates a critical jump in expected user cancelation when using the Tor network, which we aim to investigate further by our own set of user studies in future work.
Moreover, the user cancelation rate follows a saturation curve. Therefore, early user loss (in terms of cancelation rates) caused by latency is massive. Lowering the page latency via Tor by 7 s would decrease the user cancelation rate by 12%. A reduction of Tor-based page latency by 12 s would reduce the cancelation rate by 33%. Hence, an only minimal optimization of the Tor network latency will not gain a substantial effect. Only if the optimization is massive, a real improvement would be made.
In Figure 11, a mapping is provided between technical measurements of core latency and the resulting cancelation rates of users who are not provided with feedback while loading the page. This indicates an even higher, disproportionate increase in user cancelation when sending requests via Tor. The median of the core latency via Tor maps to a median of 78% cancelation rate, while user frustration for the median of direct page latency maps to 14% cancelation (lowest measured cancelation rate, we assume an even lower cancelation rate here if cancelation rate data would be more precise).
Lowering core latency via Tor by 3 s would decrease user cancelation rate by 17%. A reduction of Tor-based core latency by 8 s would reduce the cancelation rate to the same level as when using a direct connection—of course with the caveat of non-exact measurement data of the laboratory studies for direct access. These results indicate an expected massive gain in user acceptance if Tor network latency is reduced significantly. Both mappings provide a combined line of argument. Their results indicate the same amount of performance improvements necessary for Tor.
The results shown in Figure 10 and Figure 11 do not distinguish between user acceptance of anonymous vs. non-anonymous browsing because this was not tested in the lab studies we refer to.
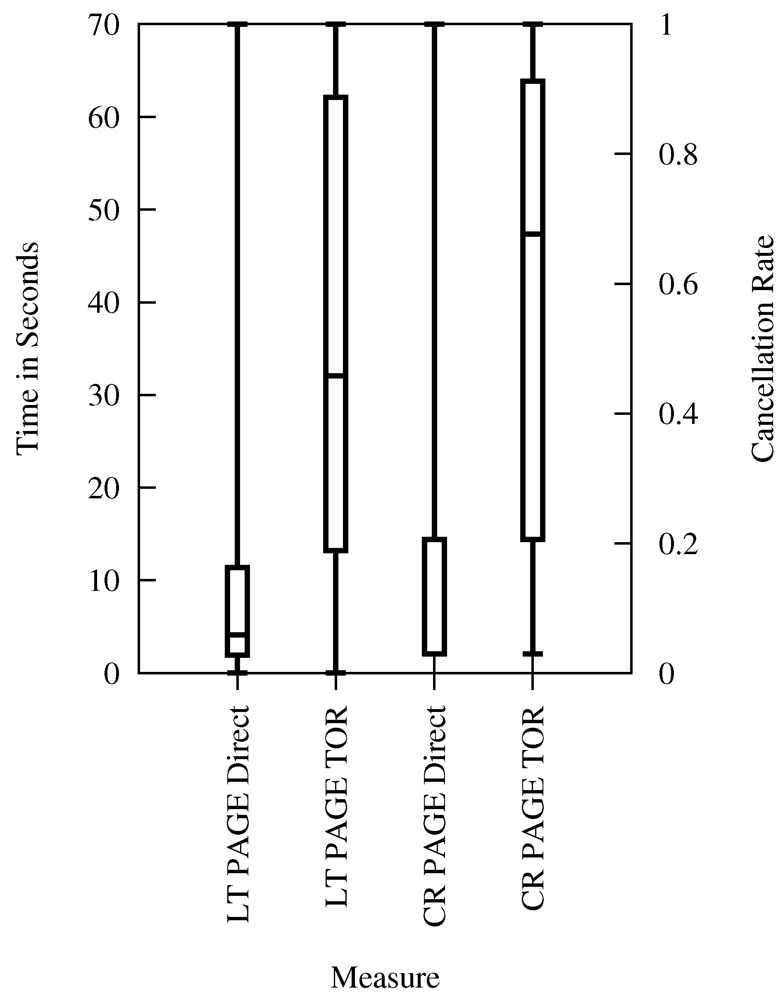
Figure 10.
Page Latency and Cancelation Rate (Lab Experiment with Feedback).
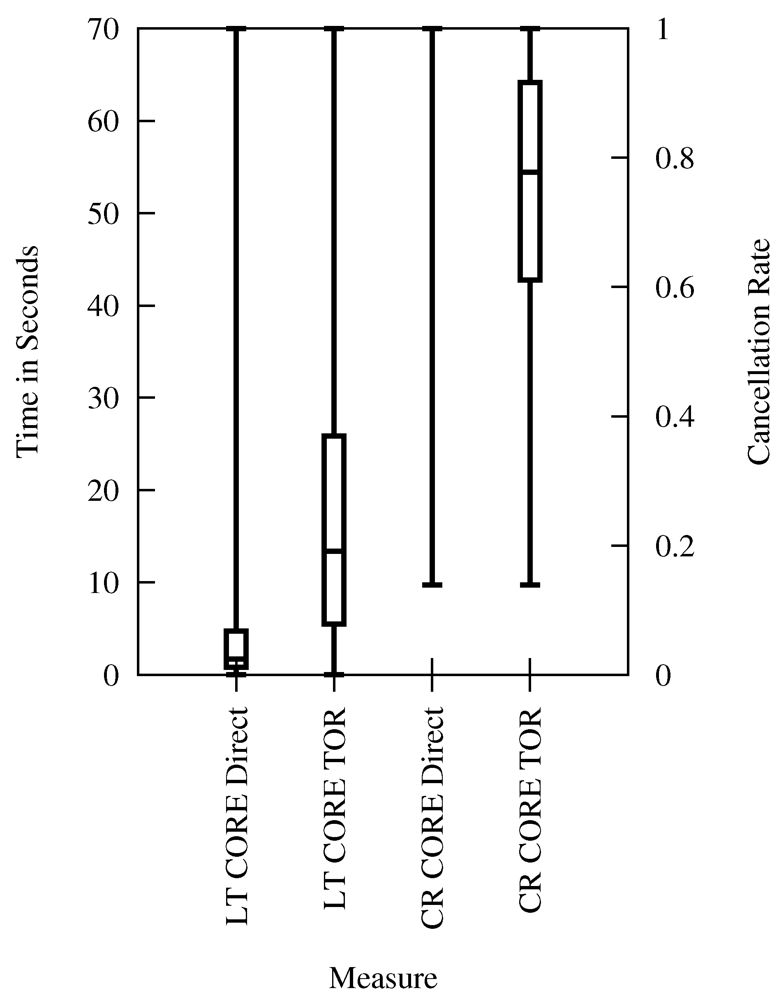
Figure 11.
Core Latency and Cancelation Rate (Lab Experiment without Feedback).
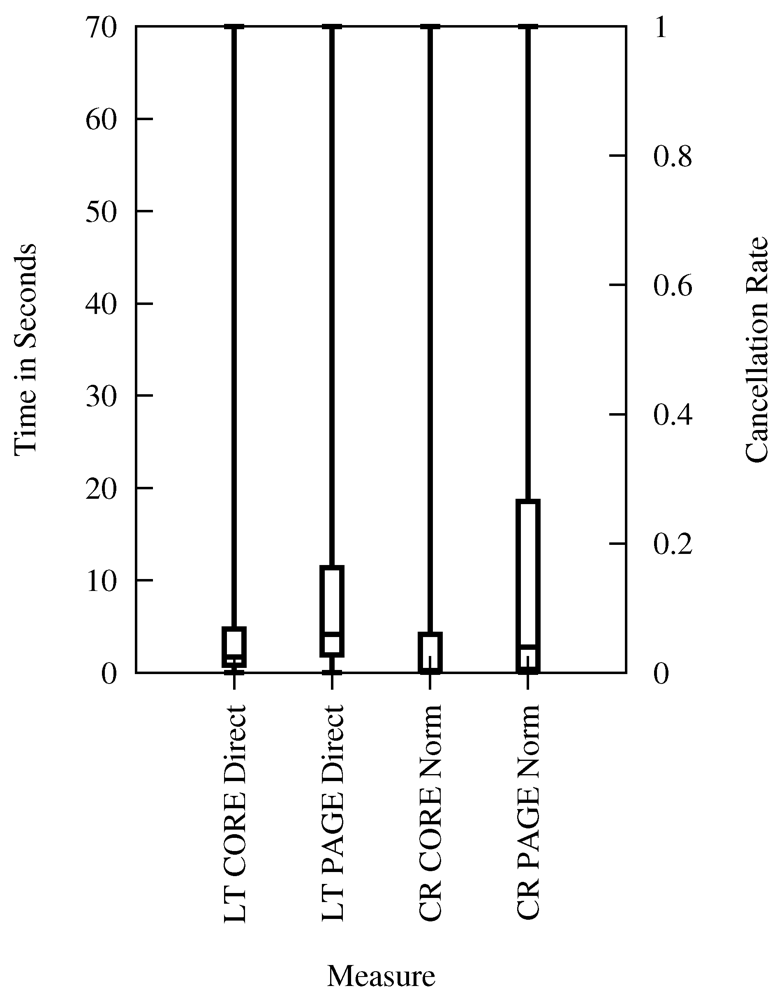
Figure 12.
Latency and Cancelation Rate for Normal Web Browsing (Survey Statements).
Figure 12 displays technical measurements of core and page latency using a direct connection, which are mapped to the resulting cancelation rates of users asked for their acceptance of latency during normal browsing (referenced by Norm). This mapping indicates that core and page latency of an average direct connection are accepted by more than 96% of the users.
Finally, Figure 13 shows the mapping of technical measurements of core and page latency using a connection over Tor to the cancelation rates of users who have been asked for their acceptance of latency while browsing anonymously (referenced by Anon). The resulting cancelation rates indicate that core and page latency of an average connection over Tor are accepted only by less than 30% of the users. The reason for the low acceptance are that only a few people are willing to wait longer in order to surf anonymously, while anonymous web browsing using the Tor network has a massively adverse effect on latency.
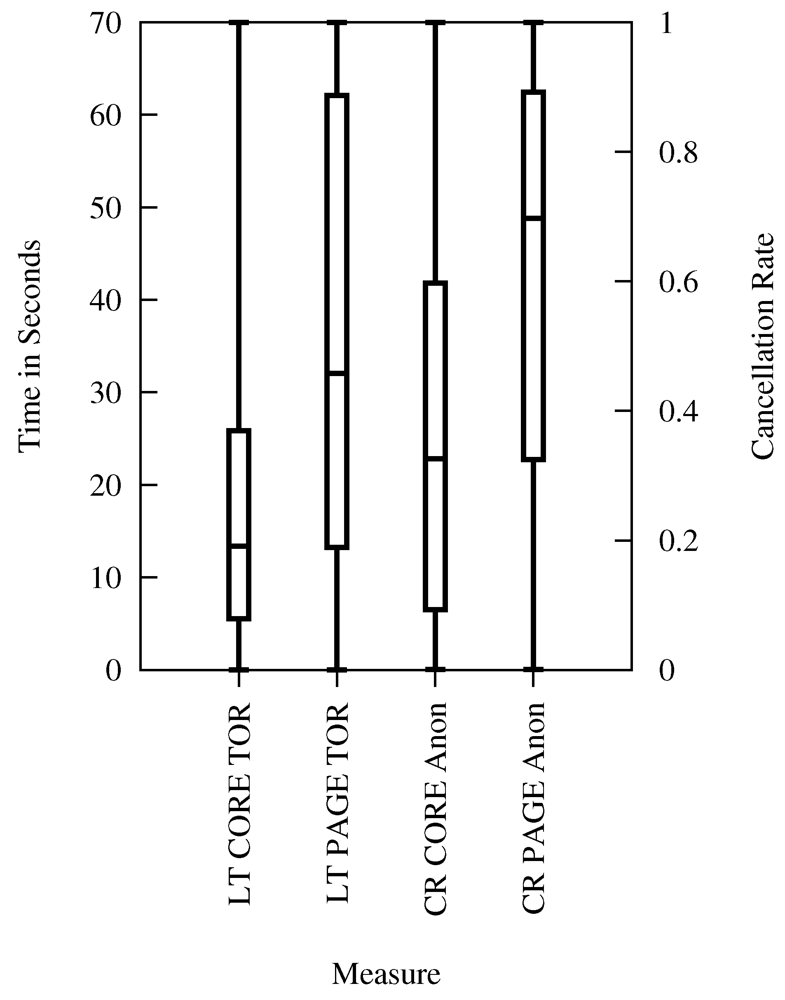
Figure 13.
Latency and Cancelation Rate for Anonymous Web Browsing (Survey Statements).
6. Limitations and Future Work
In order to assess usability implications on a global scale, we treated Tor explicitly as a “black box” in this paper. We measured what end users around the world are confronted with in terms of performance. Our experiments do not aim for a detailed white-box analysis of Tor or technical improvements for latency, but serve as basis for assessing Tor usability based on tolerated waiting time. Important related literature on the technical details of improving Tor is presented in the Section 2.
Moreover, the global experiments we conducted have some limitations in terms of node reliability, comparability, and estimation of page latency. When using the PlanetLab environment, traffic generated by other experiments on the same node could influence the experiment results. During the execution of the test scripts, the resources of the nodes have been shared with other experiments. Accordingly, the overall traffic speed might not be accurate and the performance of the direct and Tor connections should only be compared against each other and are (quantitatively) not exactly comparable across machines. However, the results from experiments conducted on the same node (i.e., direct vs. Tor) are still comparable since both traffic types used the same connection and the ratio between them was considered for analysis. On the one hand, our experiments might be overestimating the speed of normal web browsing, e.g., at home, because the PlanetLab environment provides in most cases server-grade computers with a good Internet connection. On the other hand, they may be underestimating the speed of normal web browsing because of the heavy load these PlanetLab nodes suffer. Though we suppose that these differences between PlanetLab nodes and common personal computers are insignificant, further research should include tests to strengthen this hypothesis. All in all, the relative ratio of both traffic types will be comparable.
Our approach for calculating the extrapolation factor for downloading complete web pages, though most suited for our experimental setting, has some limitations: (i) The results vary between different websites, while extrapolating does not cover this issue. We do not consider this as crucial due to the fact that we focus on page latency; (ii) When downloading the complete web page, additional variations in terms of time and coverage for different browsers and individual browser settings may be experienced. An alternative method, which could better reflect a real user’s browsing behavior, would be to provide a Tor exit node and use the requested websites for live measurement experiments. However, even though such alternative experiments could in theory be conducted without affecting the privacy of Tor users, this could nonetheless raise strong privacy concerns and potentially also cause legal issues in our university environment.
We focused on clear-cut technical metrics that can be measured via automated requests. In the real world, the perceived latency of the user depends on various other aspects. Additional studies about influence factors for perceived latency such as cultural issues, the task at hand, or individual user settings of the browser or operating system could provide valuable information about how latency is experienced by users and what countermeasures could be applied, such as introducing a loading progress bar for Tor users. In future work, we plan a set of user studies on capturing those further, more individual or subjective aspects of latency acceptance and usability. In addition, we will investigate user acceptances correlation to educational and ethnical background and if IT knowledge has an influence on users acceptance. Furthermore, we will ask if risk awareness and risk aversion have an influence on the willingness to use Tor. First results in this direction were recently published by us [27].
Future research will also focus on performance improvements, which according to our studies will help to gain a wider user acceptance. We would like to investigate if changing parameters such as the number of hops in an anonymization network could have a positive influence on anonymity and usability, e.g., decreasing the number of hops could result in lower latency. This could result in broader user acceptance, leading to more users and increasing anonymity in general, but possibly leaving routes much more open to compromise. Another approach could be a performance-oriented one in which the behavior of the anonymization network is not focused on guaranteeing a certain degree of anonymity, but on a guarantee of performance. For example, one could include statistics such as number of participants and latency of nodes when calculating the route within the anonymization network. Such an approach is adopted by the I2P anonymity system, which takes the performance of the peers into account when calculating routes through the network. This is of course a compromise between performance and privacy [53].
7. Conclusions
In this paper, we extended previous research on measuring Tor latency and usability: for the technical measurement in terms of diversification and duration and for the user acceptance in terms of user cancelation rates. We included further statistics from web usability studies and we included our own results based on an interactive survey. Both extensions helped us to improve the significance and clarity of the usability analysis of the Tor anonymization tool. In particular, we analyzed the performance of the Tor network by comparing direct Internet access against a Tor-anonymized Internet access. Those tests were performed on different nodes around the world to gather data based on various locations. Enormous amounts of data were accumulated during a period of 38 days totaling nearly 4.5 million requests for each connection type.
The experiment results quantitatively confirmed the common intuition that one has to accept performance losses while using the Tor network. User waiting times exhibit a large spread, ranging from taking twice as long as to nearly a hundred times longer while using the Tor network. The median ratio while using the Tor network is around 7.8 times slower. Concerning the loss of usability in exchange for improved anonymity while browsing the web via Tor, we can say that for core latency, the median of all Tor requests was 7.8 times higher than the median of the direct connection. Furthermore, the experiments revealed that Tor latency seems to fluctuate more, i.e., the actual duration of an HTTP request via Tor is harder to anticipate for the user. The overall latency that a user finally experiences is approximated by page latency, estimating the download of a complete web page. Our results indicate that at least 75% of all direct requests are faster than 75% of all Tor requests.
Based on the results of our experiments, we provided a mapping that measures the expected increase in web user cancelation rate while using Tor. Comparing page latency between Tor-based and direct requests, there is a difference of 64% or 65% according to the lab experiment, respectively the user survey, in expected cancelation rate. This is a strong indicator for potentially high user frustration when using the Tor anonymization network.
We suggest that a usability improvement in terms of a massive latency reduction would significantly increase the adoption of Tor by new users, and thereby increase the anonymity of current users as well. On the other hand, if anonymization technology should become part of a Future Internet [14], our research offers first steps towards an empirically grounded analysis of corresponding performance requirements.
References
- Amnesty International. Undermining Freedom of Expression in China. 2006. Available online: http://www.amnestyusa.org/business/Undermining_Freedom_of_Expression_in_China.pdf (accessed on 8 May 2012).
- Dingledine, R.; Mathewson, N.; Syverson, P. Tor: The Second-Generation Onion Router. In Proceedings of the 13th USENIX Security Symposium, San Diego, CA, USA, 9–13 August 2004.
- Tor Project Web Site. 2010. Available online: https://www.torproject.org/ (accessed on 8 May 2012).
- Dingledine, R.; Mathewson, N. Anonymity Loves Company: Usability and the Network Effect. In Proceedings of the 5th Workshop on the Economics of Information Security (WEIS 2006), Cambridge, UK, 26–28 June 2006.
- Palme, J.; Berglund, M. Anonymity on the Internet. 2002. Available online: http://people.dsv.su.se/jpalme/society/anonymity.html (accessed on 8 May 2012).
- Vitone, D. Anonymous Networks. 2008. Available online: http://blag.cerebralmind.net/wp-content/uploads/2008/05/tor.pdf (accessed on 8 May 2012).
- Loesing, K.; Murdoch, S.J.; Dingledine, R. A Case Study on Measuring Statistical Data in the Tor Anonymity Network. In Proceedings of the Workshop on Ethics in Computer Security Research (WECSR 2010), Canary Islands, Spain, 28–29 January 2010.
- Dingledine, R.; Murdoch, S.J. Performance Improvements on Tor. 2009. Available online: https://www.torproject.org/press/presskit/2009-03-11-performance.pdf (accessed on 8 May 2012).
- Loesing, K. Measuring the Tor Network from Public Directory Information. In Proceedings of the 2nd Hot Topics in Privacy Enhancing Technologies (HotPETs), Seattle, WA, USA, 5–7 August 2009.
- PlanetLab User’s Guide. 2011. Available online: http://www.planet-lab.org/doc/guides/user (accessed on 8 May 2012).
- Wright, T. Security, privacy, and anonymity. ACM 2004, 11. [Google Scholar] [CrossRef]
- Mannan, M.; van Oorschot, P.C. Security and Usability: The Gap in Real-World Online Banking. In Proceedings of the 2007 Workshop on New Security Paradigms, North Conway, NH, USA, 18–21 September 2007; pp. 1–14.
- Acquisti, A.; Dingledine, R.; Syverson, P. On the Economics of Anonymity. In Proceedings of the Financial Cryptography (FC ’03); Wright, R.N., Ed.; Springer: Berlin, Germany, 2003; pp. 84–102. [Google Scholar]
- Bellovin, S.M.; Clark, D.D.; Perrig, A. A Clean-Slate Design for the Next-Generation Secure Internet. Available online: http://mars.cs.kent.edu/peyravi/Net208S/Lec/NextGenInternet.pdf (accessed on 10 May 2012).
- Chaum, D. Untraceable electronic mail, return addresses, and digital pseudonyms. Commun. ACM 1981, 24, 84–88. [Google Scholar] [CrossRef]
- Danezis, G. Mix-Networks with Restricted Routes. In Proceedings of the 3rd Privacy Enhancing Technologies Workshop (PET 2003); Dingledine, R., Ed.; Springer: Berlin, Germany, 2003; 2760, pp. 1–17. [Google Scholar]
- Diaz, C.; Murdoch, S.J.; Troncoso, C. Impact of Network Topology on Anonymity and Overhead in Low-Latency Anonymity Networks. In Proceedings of the 10th International Symposium on Privacy Enhancing Technologies (PETS 2010), Berlin, Germany, 21–23 July 2010.
- Murdoch, S.J.; Watson, R.N.M. Metrics for Security and Performance in Low-Latency Anonymity Networks. In Proceedings of the 8th International Symposium on Privacy Enhancing Technologies (PETS 2008); Springer: Berlin, Germany, 2008; pp. 115–132. [Google Scholar]
- Loesing, K.; Sandmann, W.; Wilms, C.; Wirtz, G. Performance Measurements and Statistics of Tor Hidden Services. In Proceedings of the 2008 International Symposium on Applications and the Internet (SAINT); IEEE CS Press: Turku, Finland, 2008. [Google Scholar]
- Lenhard, J.; Loesing, K.; Wirtz, G. Performance Measurements of Tor Hidden Services in Low-Bandwidth Access Networks. In Proceedings of the 7th International Conference on Applied Cryptography and Network Security (ACNS 09), Paris-Rocquencourt, France, 2–5 June 2009; 5536.
- Tor Metrics Portal. 2010. Available online: http://metrics.torproject.org/ (accessed on 8 May 2012).
- Fabian, B.; Goertz, F.; Kunz, S.; Müller, S.; Nitzsche, M. Privately Waiting—A Usability Analysis of the Tor Anonymity Network. In Proceedings of the 16th Americas Conference on Information Systems (AMCIS 2010); Springer: Berlin, Germany, 2010; 58. [Google Scholar]
- McCoy, D.; Bauer, K.; Grunwald, D.; Kohno, T.; Sicker, D. Shining Light in Dark Places: Understanding the Tor Network. In Proceedings of the 8th International Symposium on Privacy Enhancing Technologies (PETS 2008); Springer: Berlin, Germany, 2008; pp. 63–76. [Google Scholar]
- Perry, M. TorFlow: Tor Network Analysis. Available online: http://fscked.org/talks/TorFlow-HotPETS-final.pdf (accessed on 10 May 2012).
- Dhungel, P.; Steiner, M.; Rimac, I.; Hilt, V.; Ross, K.W. Waiting for Anonymity: Understanding Delays in the Tor Overlay. In Proceedings of the IEEE 10th International Conference on Peer-to-Peer Computing (P2P 2010), Delft, The Netherlands, 25–27 August 2010.
- Hopper, N.; Vasserman, E.Y.; Chan-Tin, E. How much anonymity does network latency leak? ACM Trans. Inf. Syst. Secur. 2010, 13. [Google Scholar] [CrossRef]
- Brecht, F.; Fabian, B.; Kunz, S.; Müller, S. Are You Willing to Wait Longer for Internet Privacy? In Proceedings of the European Conference on Information Systems (ECIS 2011), Helsinki, Finland, 9–11 June 2011.
- Nielson, J. “Top Ten Mistakes" in Web design—Revisited Three Years Later. Available online: http://www.useit.com/alertbox/990502.html (accessed on 8 May 2012).
- Rose, G.; Khoo, H.; Straub, D.W. Current technological impediments to business-to-consumer electronic commerce. Commun. AIS 1999, 1, 1. [Google Scholar]
- Ryan, G.; Valverde, M. Waiting online: A review and research agenda. Int. Res. Electron. Netw. Appl. Policy 2003, 13, 195–205. [Google Scholar] [CrossRef]
- Stockport, G.J.; Kunnath, G.; Sedick, R. Boo.com—The path to failure. J. Interact. Mark. 2001, 15, 56–70. [Google Scholar] [CrossRef]
- Tolia, N.; Andersen, D.; Satyanarayanan, M. Quantifying interactive user experience on thin clients. IEEE Comput. 2006, 39, 46–52. [Google Scholar]
- Nah, F.F. A study on tolerable waiting time: How long are web users willing to wait? Behav. Inf. Technol. 2004, 23, 153–163. [Google Scholar] [CrossRef]
- AccountingWEB. Is Your Web Site Too Big? 2000. Available online: http://www.accountingweb.com/item/29331 (accessed on 8 May 2012).
- Bhatti, N.; Bouch, A.; Kuchinsky, A. Integrating user-perceived quality into Web server design. Comput. Netw. (Amst. Neth. 1999) 2000, 33, 1–16. [Google Scholar]
- Selvidge, P. How Long is Too Long to Wait for a Website to Load? 1999. Available online: http://www.surl.org/usabilitynews/12/time_delay.asp (accessed on 8 May 2012).
- Galletta, D.F.; Henry, R.M.; McCoy, S.; Polak, P. Web site delays: How tolerant are users? J. AIS 2004, 5, 1–28. [Google Scholar]
- Ramsay, J.; Barbesi, A.; Preece, J. A psychological investigation of long retrieval times on the World Wide Web. Interact. Comput. 1998, 10, 77–86. [Google Scholar] [CrossRef]
- Huber, M.; Mulazzani, M.; Weippl, E. Tor HTTP Usage and Information Leakage. In Proceedings of the Communications and Multimedia Security; Springer: Berlin, Germany, 2010; 6109, pp. 245–255. [Google Scholar]
- SEOmoz: The 500 Most Important Websites on the Internet. 2011. Available online: http://www.seomoz.org/top500 (accessed on 8 May 2012).
- Wikipedia. Goodput. 2011. Available online: https://secure.wikimedia.org/wikipedia/en/wiki/Goodput (accessed on 8 May 2012).
- Peterson, L.; Pai, V.S. Experience-driven experimental systems research. Commun. ACM 2007, 50, 38–44. [Google Scholar] [CrossRef]
- Tor partially blocked in China. 2009. Available online: https://blog.torproject.org/blog/tor-partially-blocked-china/ (accessed on 8 May 2012).
- Talbot, D. China Cracks Down on Tor Anonymity Network. Technology Review. 2009. Available online: http://www.technologyreview.com/web/23736/ (accessed on 8 May 2012).
- Berger, M. Tor Nodes Statistics. 2011. Available online: http://www.dianacht.de/torstat/ (accessed on 8 May 2012).
- Panchenko, A.; Renner, J. Path Selection Metrics for Performance-Improved Onion Routing. In Proceedings of the 2009 9th Annual International Symposium on Applications and the Internet; IEEE Computer Society: Washington, DC, USA, 2009; pp. 114–120. [Google Scholar]
- Map of all Google data center locations. Pingdom Blog. 2008. Available online: http://royal.pingdom.com/2008/04/11/map-of-all-google-data-center-locations/ (accessed on 8 May 2012).
- CDN performance. 2010. Available online: http://royal.pingdom.com/2010/05/11/cdn-performance-downloading-jquery-from-google-microsoft-and-edgecast-cdns/ (accessed on 8 May 2012).
- Utrace—Locate IP Addresses and Domain Names. 2011. Available online: http://www.utrace.de/ (accessed on 8 May 2012).
- New Cisco Study Reveals Peak Internet Traffic Increases Due to Social Networking and Broadband Video Usage. 2009. Available online: http://newsroom.cisco.com/dlls/2009/prod_102109.html (accessed on 8 May 2012).
- Cisco Visual Networking Index: Usage Study. 2010. Available online: http://www.cisco.com/en/US/solutions/collateral/ns341/ns525/ns537/ns705/Cisco_VNI_Usage_WP.html (accessed on 8 May 2012).
- Roger Dingledine and Nick Mathewson. 2011. Available online: https://git.torproject.org/checkout/tor/master/doc/spec/path-spec.txt (accessed on 8 May 2012).
- Herrmann, M.; Grothoff, C. Privacy-Implications of Performance-Based Peer Selection by Onion-Routers: A Real-World Case Study Using I2P. In Proceedings of the 11th International Symposium on Privacy Enhancing Technologies (PETS 2011); Springer: Berlin, Germany, 2011; pp. 155–174. [Google Scholar]
© 2012 by the authors; licensee MDPI, Basel, Switzerland. This article is an open-access article distributed under the terms and conditions of the Creative Commons Attribution license (http://creativecommons.org/licenses/by/3.0/).