In Situ Focused Beam Reflectance Measurement (FBRM), Attenuated Total Reflectance Fourier Transform Infrared (ATR-FTIR) and Raman Characterization of the Polymorphic Transformation of Carbamazepine


Abstract
:1. Introduction
2. Material and Methods
2.1. Preparation of Pure Carbamazepine Polymorphs
2.2. Polymorphic Transformation during Seeded Isothermal Crystallization
3. Results and Discussion
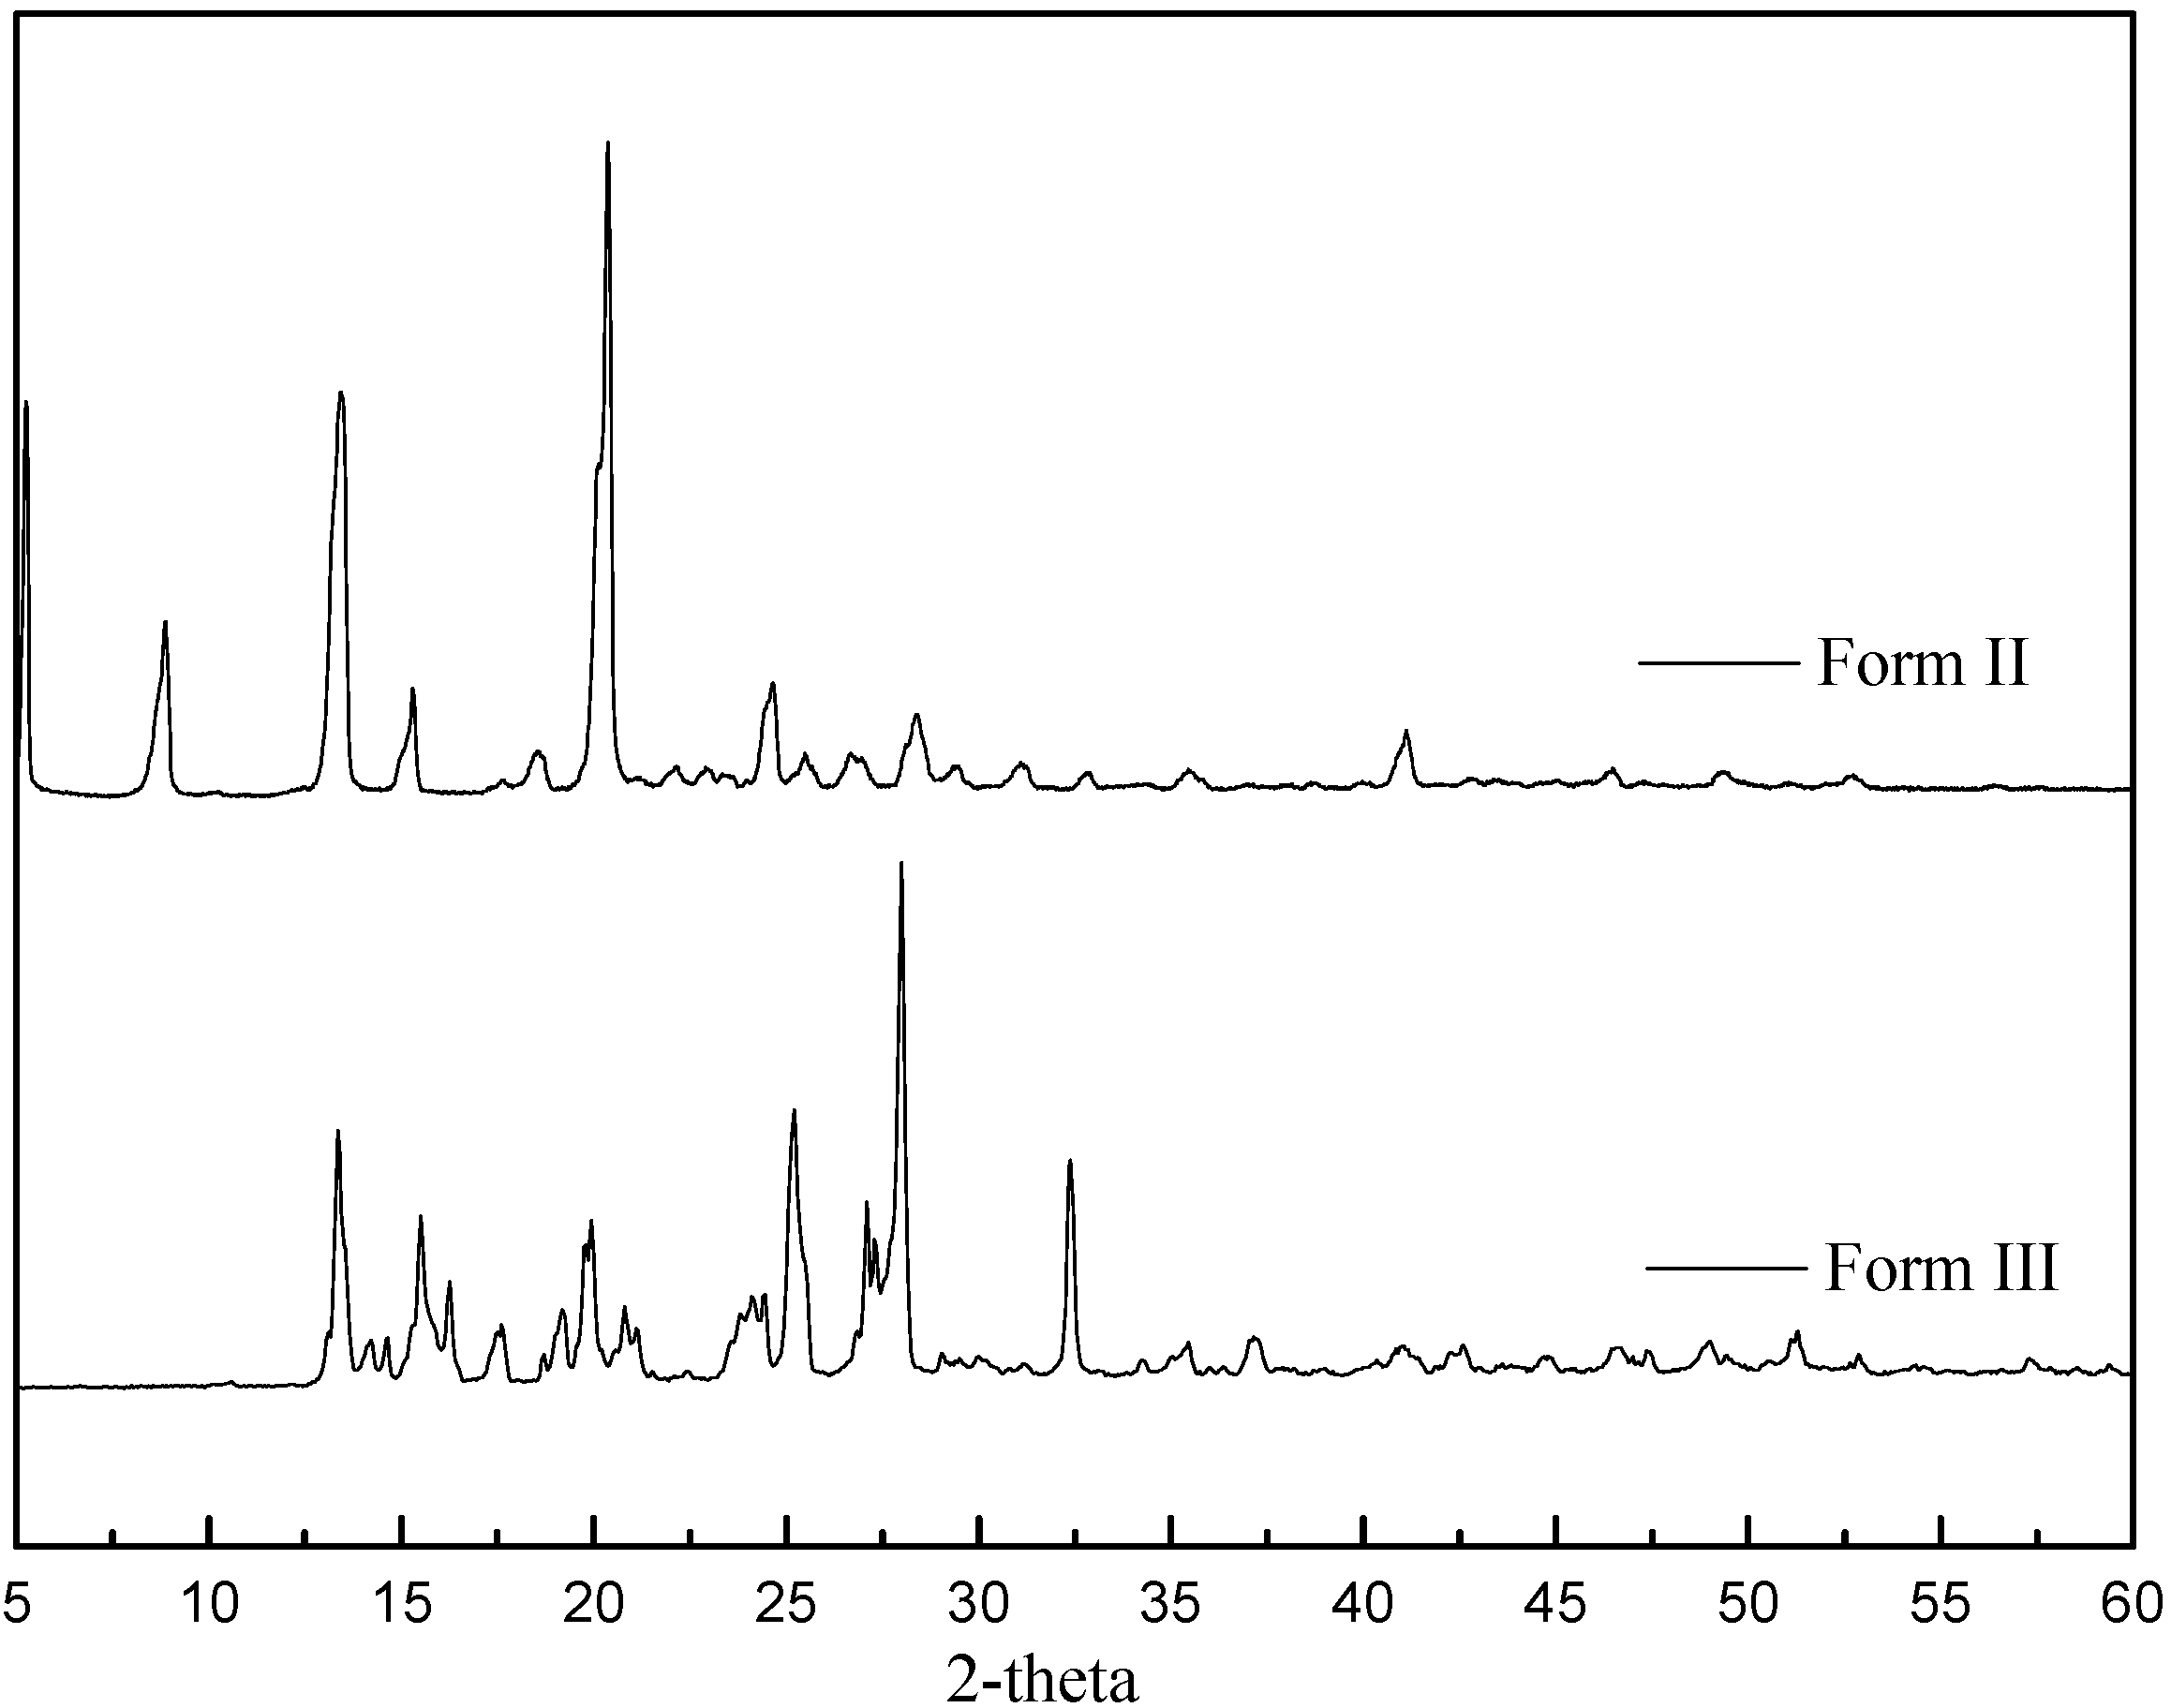
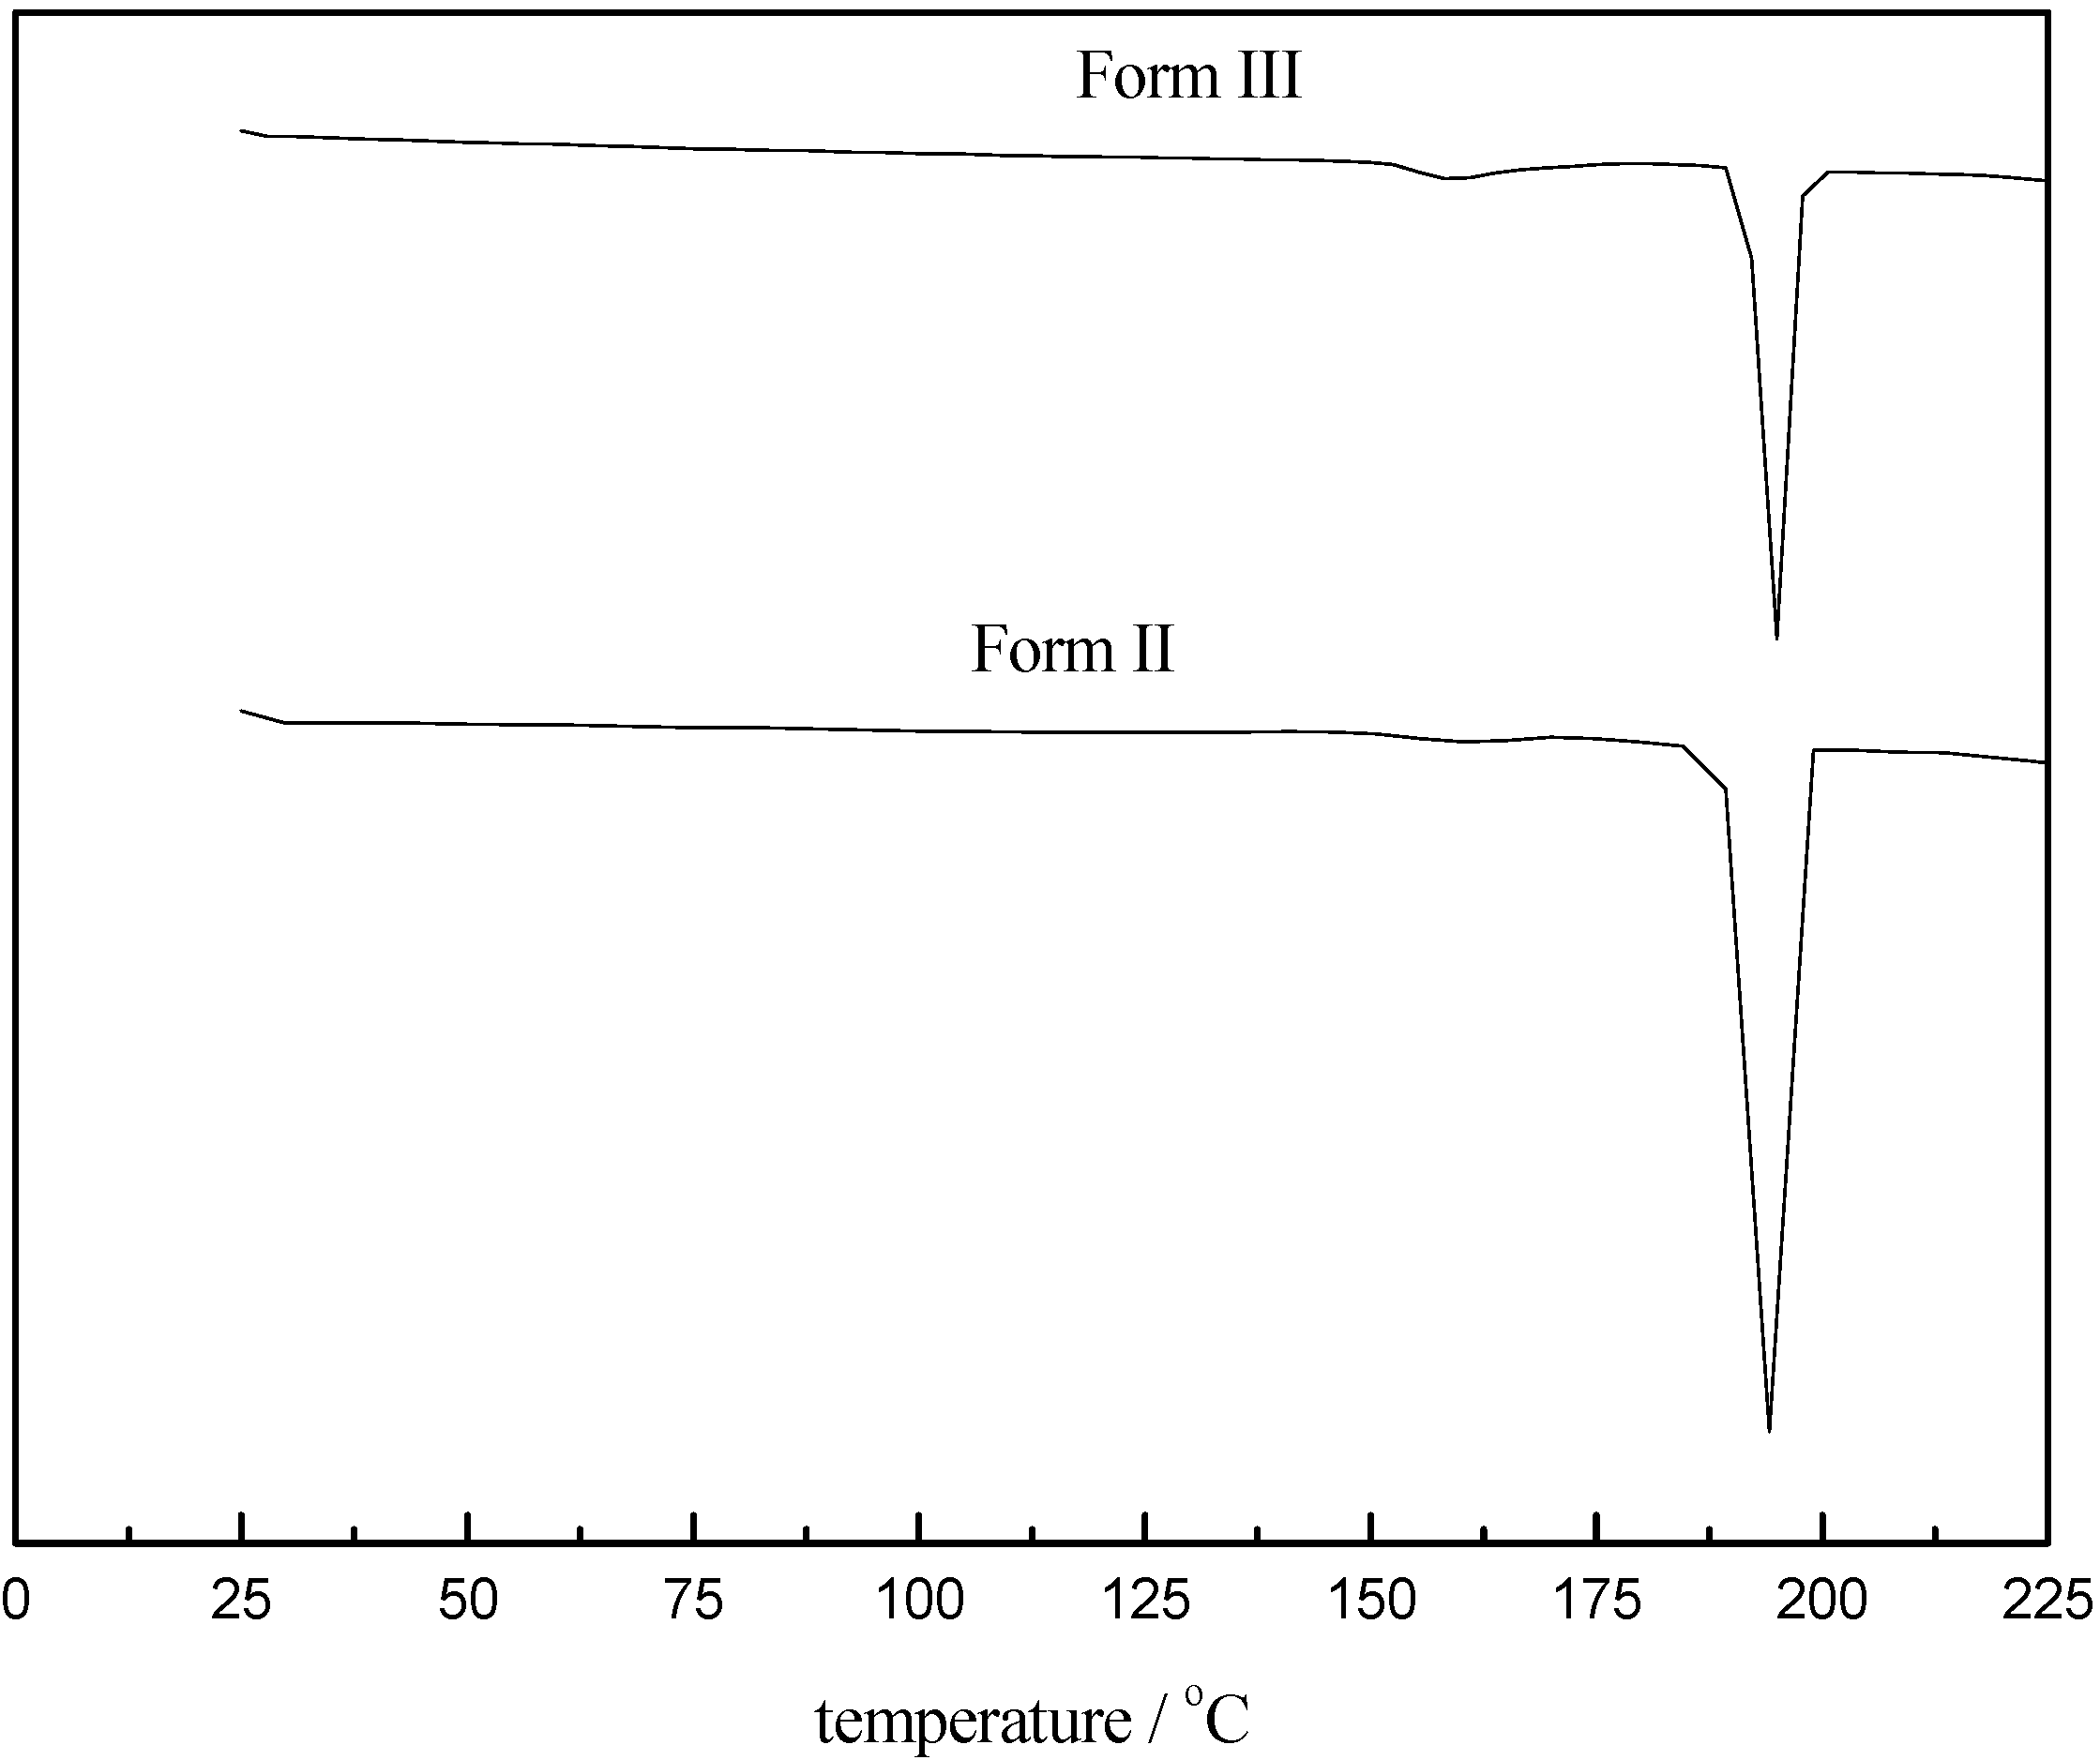
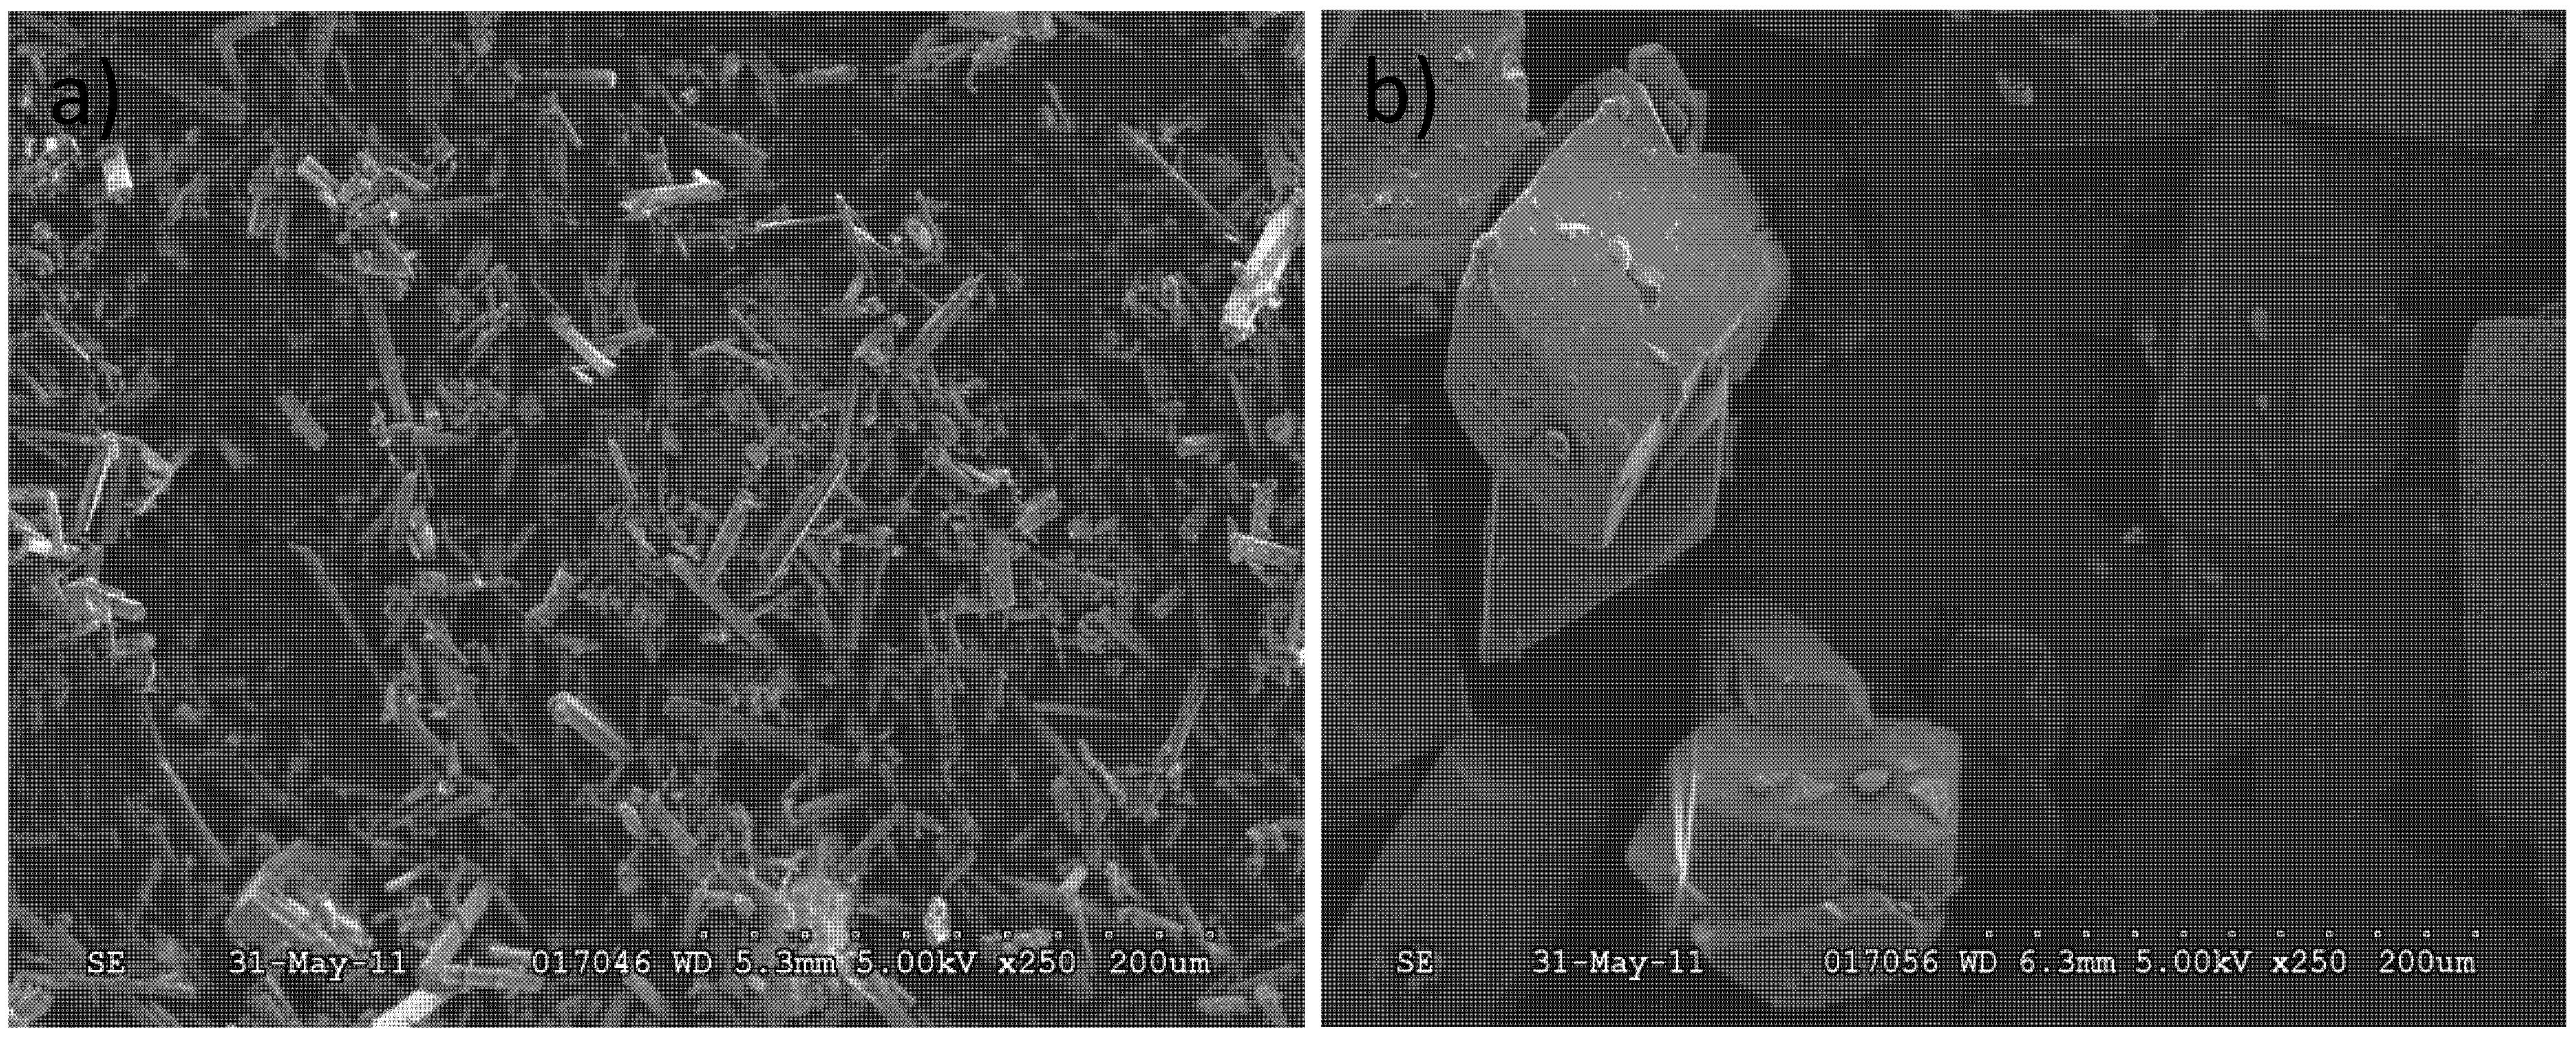
3.1. Characterization of Carbamazepine Polymorphs


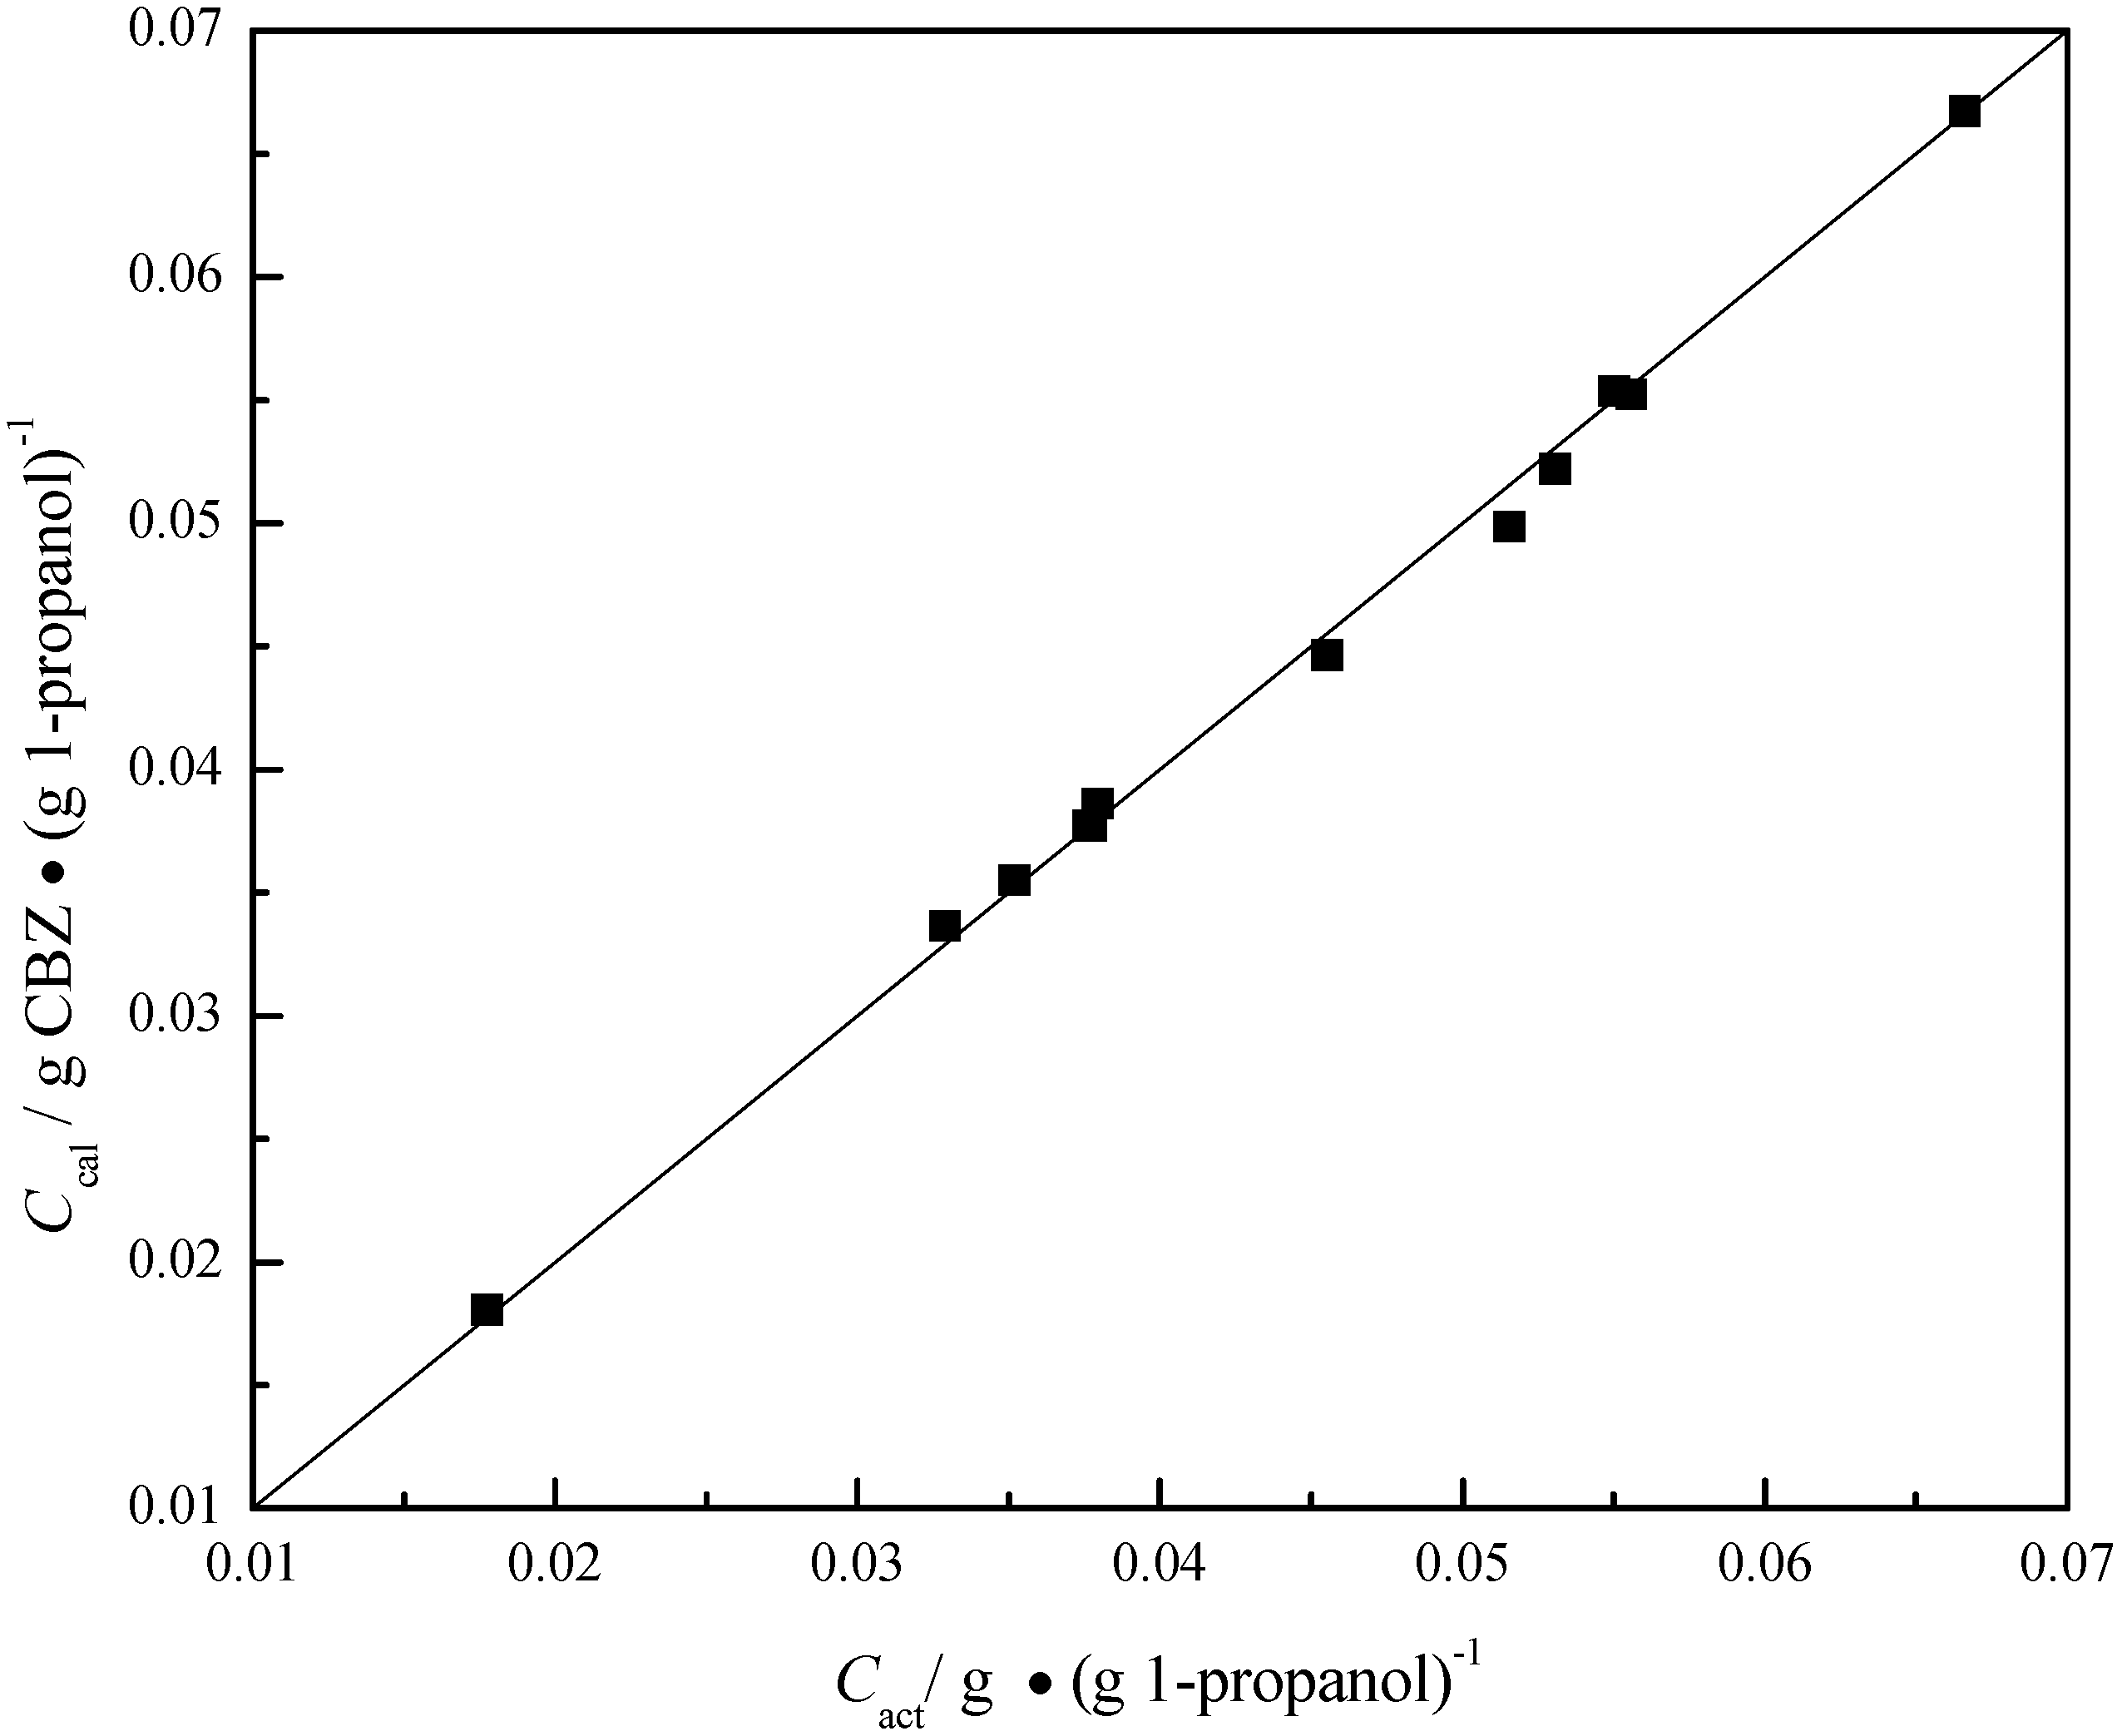
| T/°C | Cact/g ∙ (g 1-propanol)−1 | Ccal/g ∙ (g 1-propanol)−1 |  |
|---|---|---|---|
| 25.0 | 0.0177 | 0.0181 | 0.018 |
| 43.0 | 0.0329 | 0.0337 | 0.023 |
| 40.0 | 0.0352 | 0.0355 | 0.008 |
| 47.0 | 0.0376 | 0.0377 | 0.003 |
| 46.0 | 0.0377 | 0.0377 | 0.001 |
| 45.0 | 0.0379 | 0.0386 | 0.017 |
| 49.0 | 0.0455 | 0.0446 | 0.020 |
| 50.0 | 0.0515 | 0.0498 | 0.033 |
| 56.0 | 0.0531 | 0.0522 | 0.016 |
| 54.0 | 0.0550 | 0.0554 | 0.006 |
| 50.0 | 0.0556 | 0.0552 | 0.006 |
| 58.0 | 0.0666 | 0.0667 | 0.002 |
3.2. Solubility of Carbamazepine Polymorphs
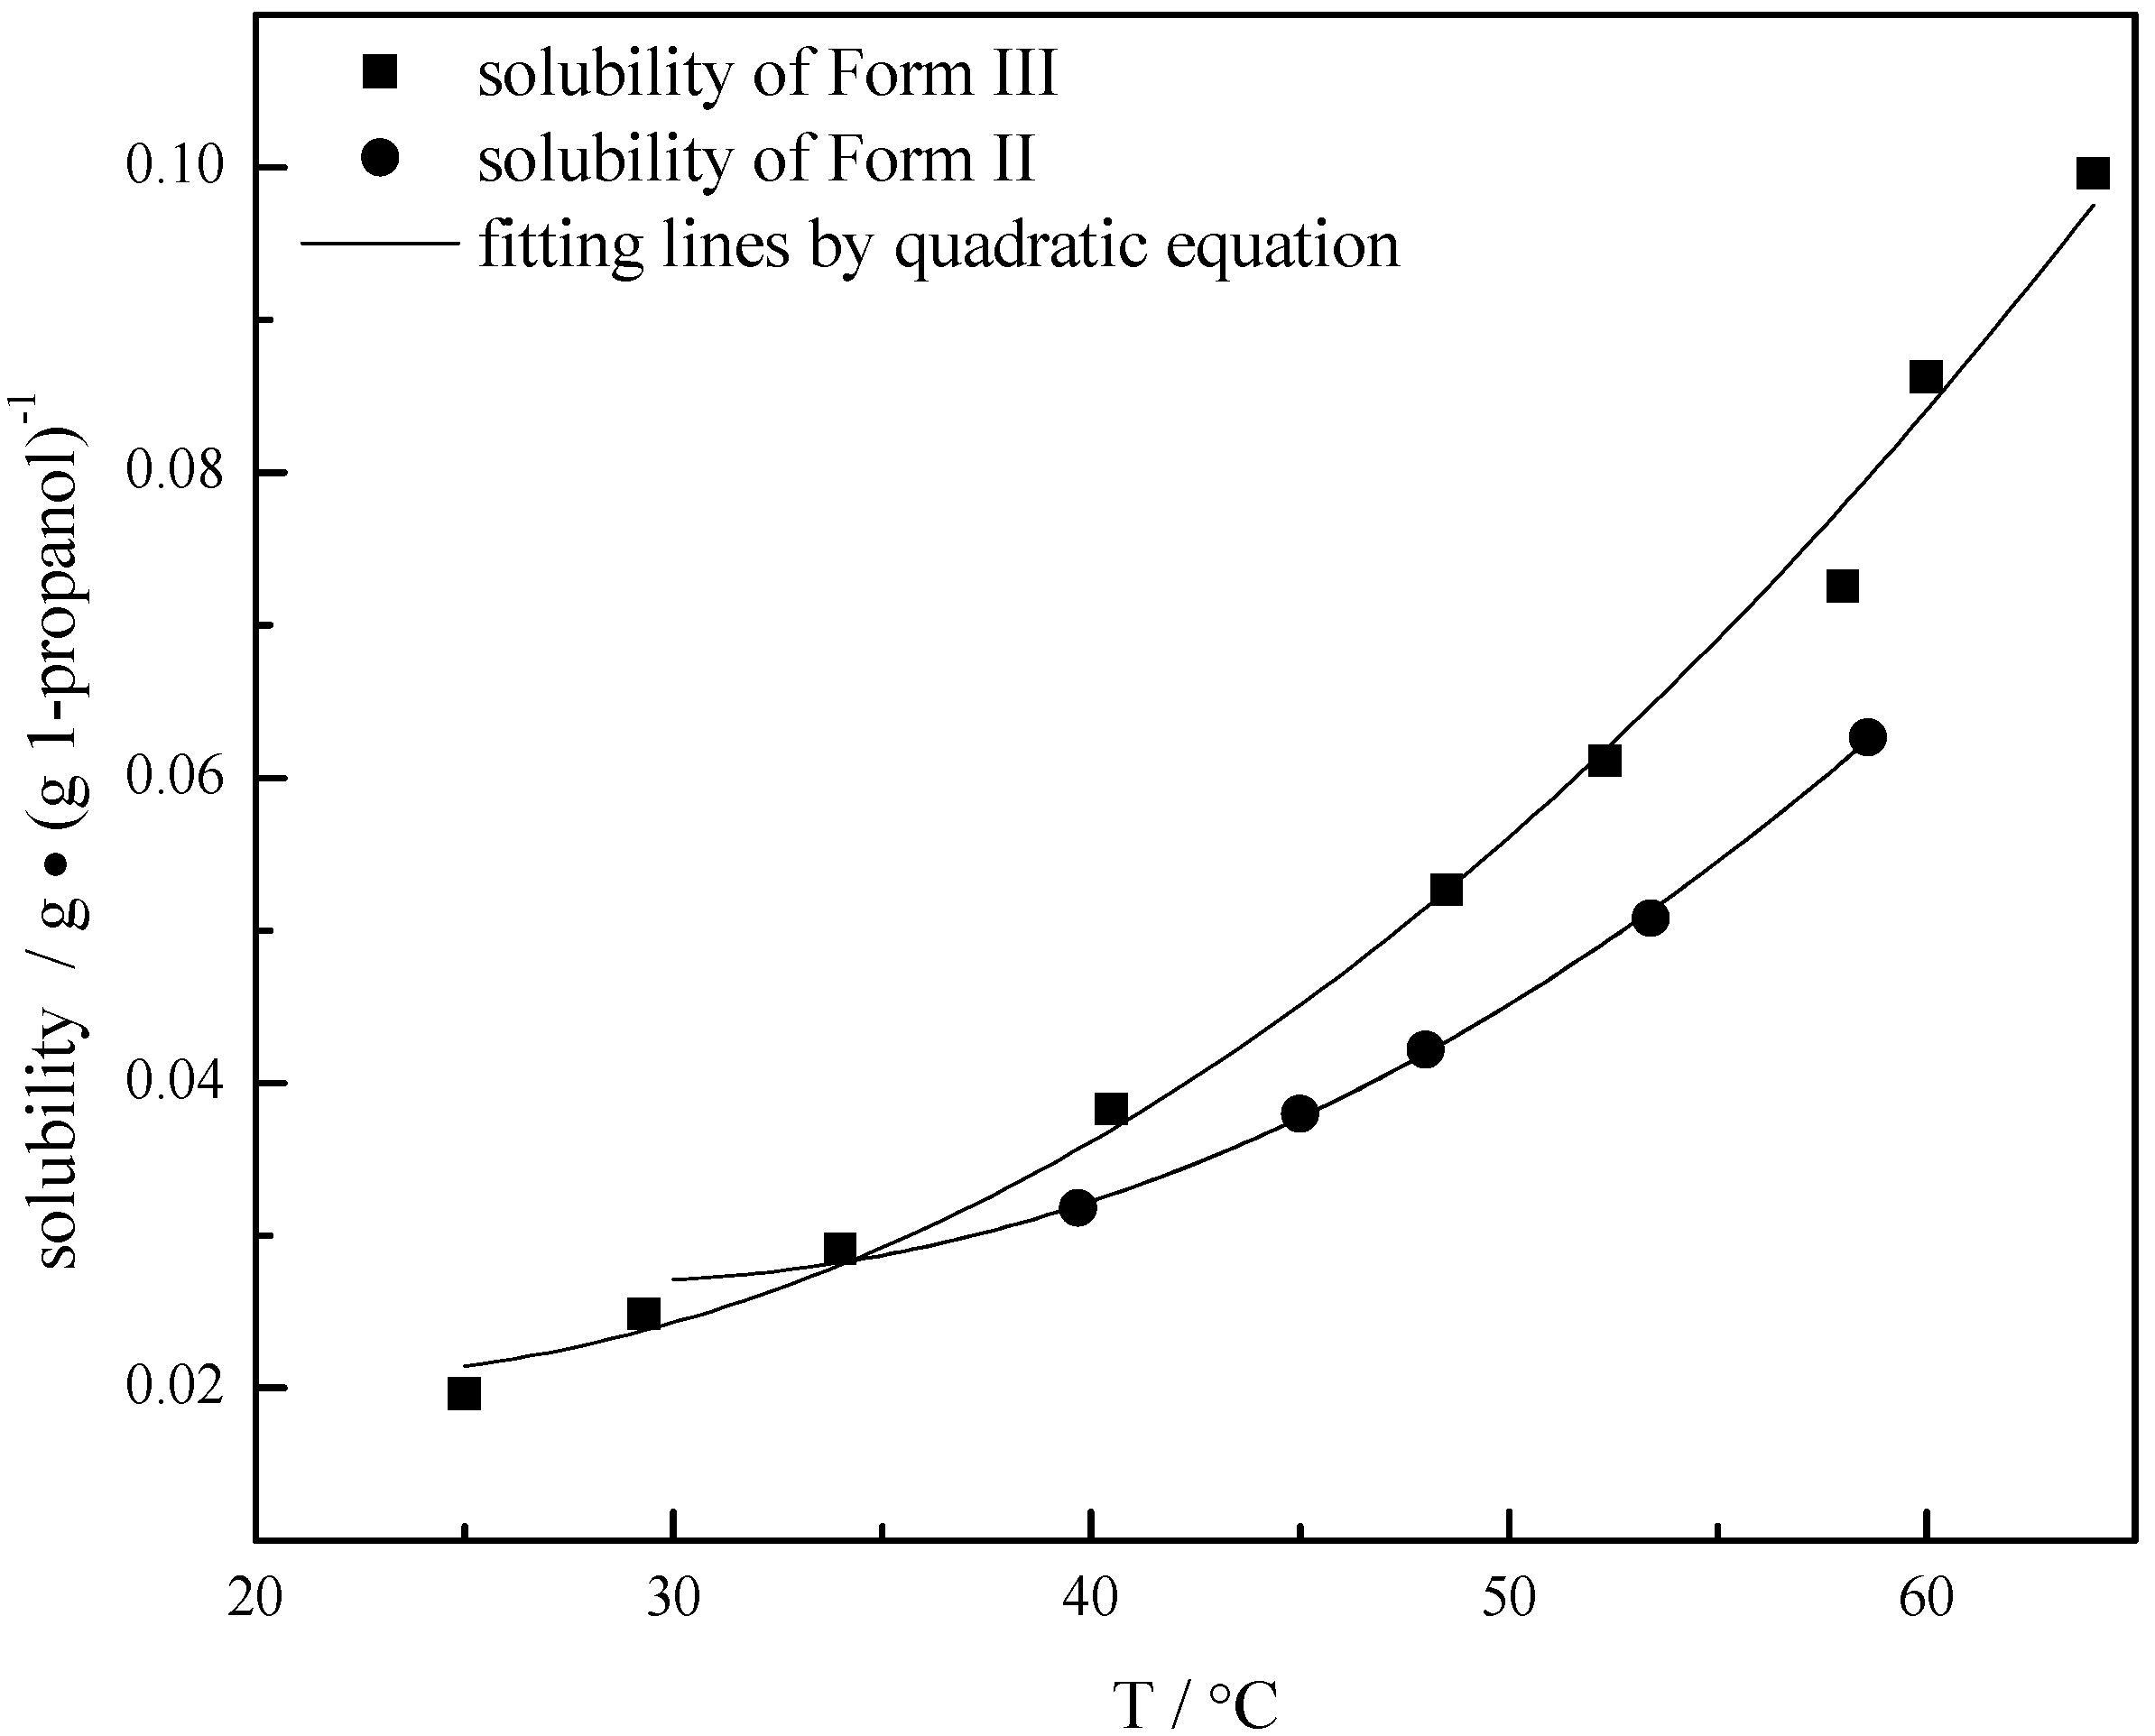
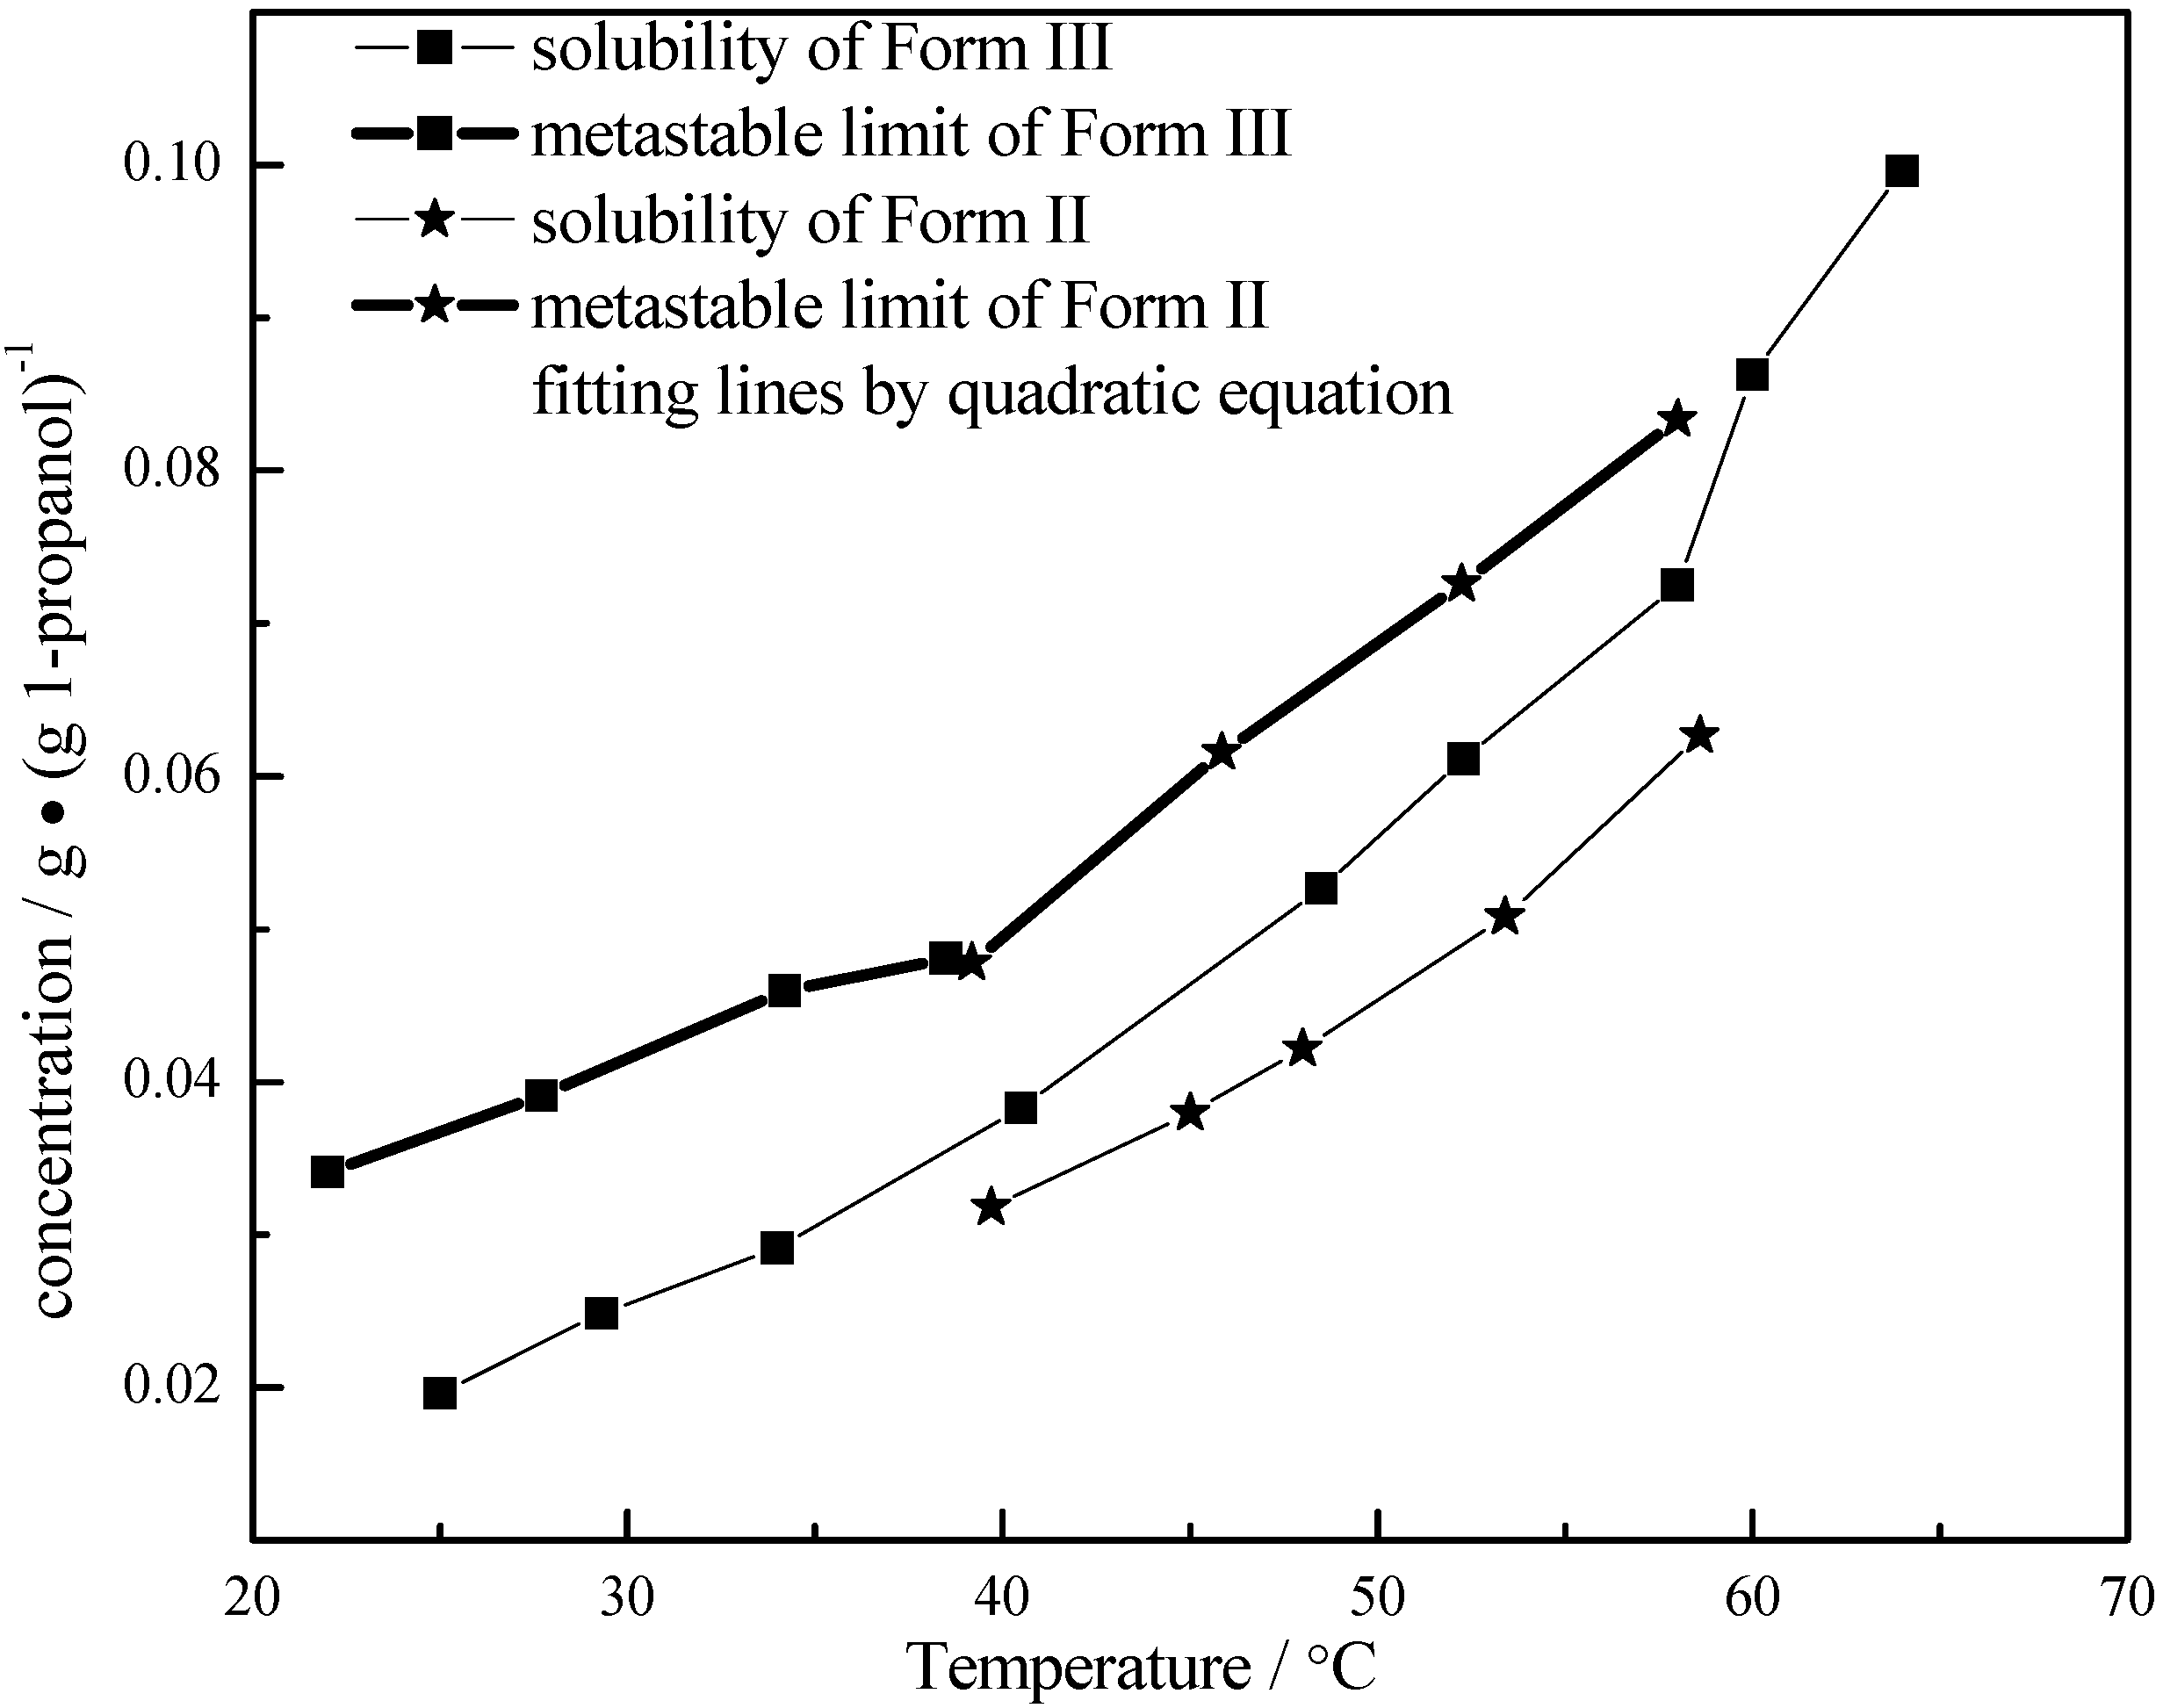
| T/°C | Solubility of Form II/g ∙ (g 1-propanol)−1 | T/°C | Metastable limit of Form II/g ∙ (g 1-propanol)−1 | T/°C | Solubility of Form III/g ∙ (g 1-propanol)−1 | T/°C | Metastable limit of Form III/g ∙ (g 1-propanol)−1 |
|---|---|---|---|---|---|---|---|
| 39.7 | 0.0318 | 39.2 | 0.04777 | 25.0 | 0.0196 | 22.0 | 0.03407 |
| 45.0 | 0.03796 | 45.9 | 0.06155 | 29.3 | 0.02485 | 27.7 | 0.03909 |
| 48.0 | 0.04215 | 52.3 | 0.07261 | 34.0 | 0.02909 | 34.2 | 0.04595 |
| 53.4 | 0.05077 | 58.0 | 0.08335 | 40.5 | 0.03831 | 38.5 | 0.04806 |
| 58.6 | 0.06267 | -- | -- | 48.5 | 0.05267 | -- | -- |
| -- | -- | -- | -- | 52.3 | 0.06111 | -- | -- |
| -- | -- | -- | -- | 58.0 | 0.07252 | -- | -- |
| -- | -- | -- | -- | 60.0 | 0.08632 | -- | -- |
| -- | -- | -- | -- | 64.0 | 0.09961 | -- | -- |
3.3. Metastable Limits of Carbamazepine Polymorphs
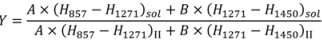
| Parameters | A | B | R^2 |
|---|---|---|---|
| values | 9.71 × 10⁻⁶ | 7.51 × 10⁻⁴ | 0.998 |
| error | 3.87 × 10⁻⁶ | 0.545 × 10⁻⁴ |
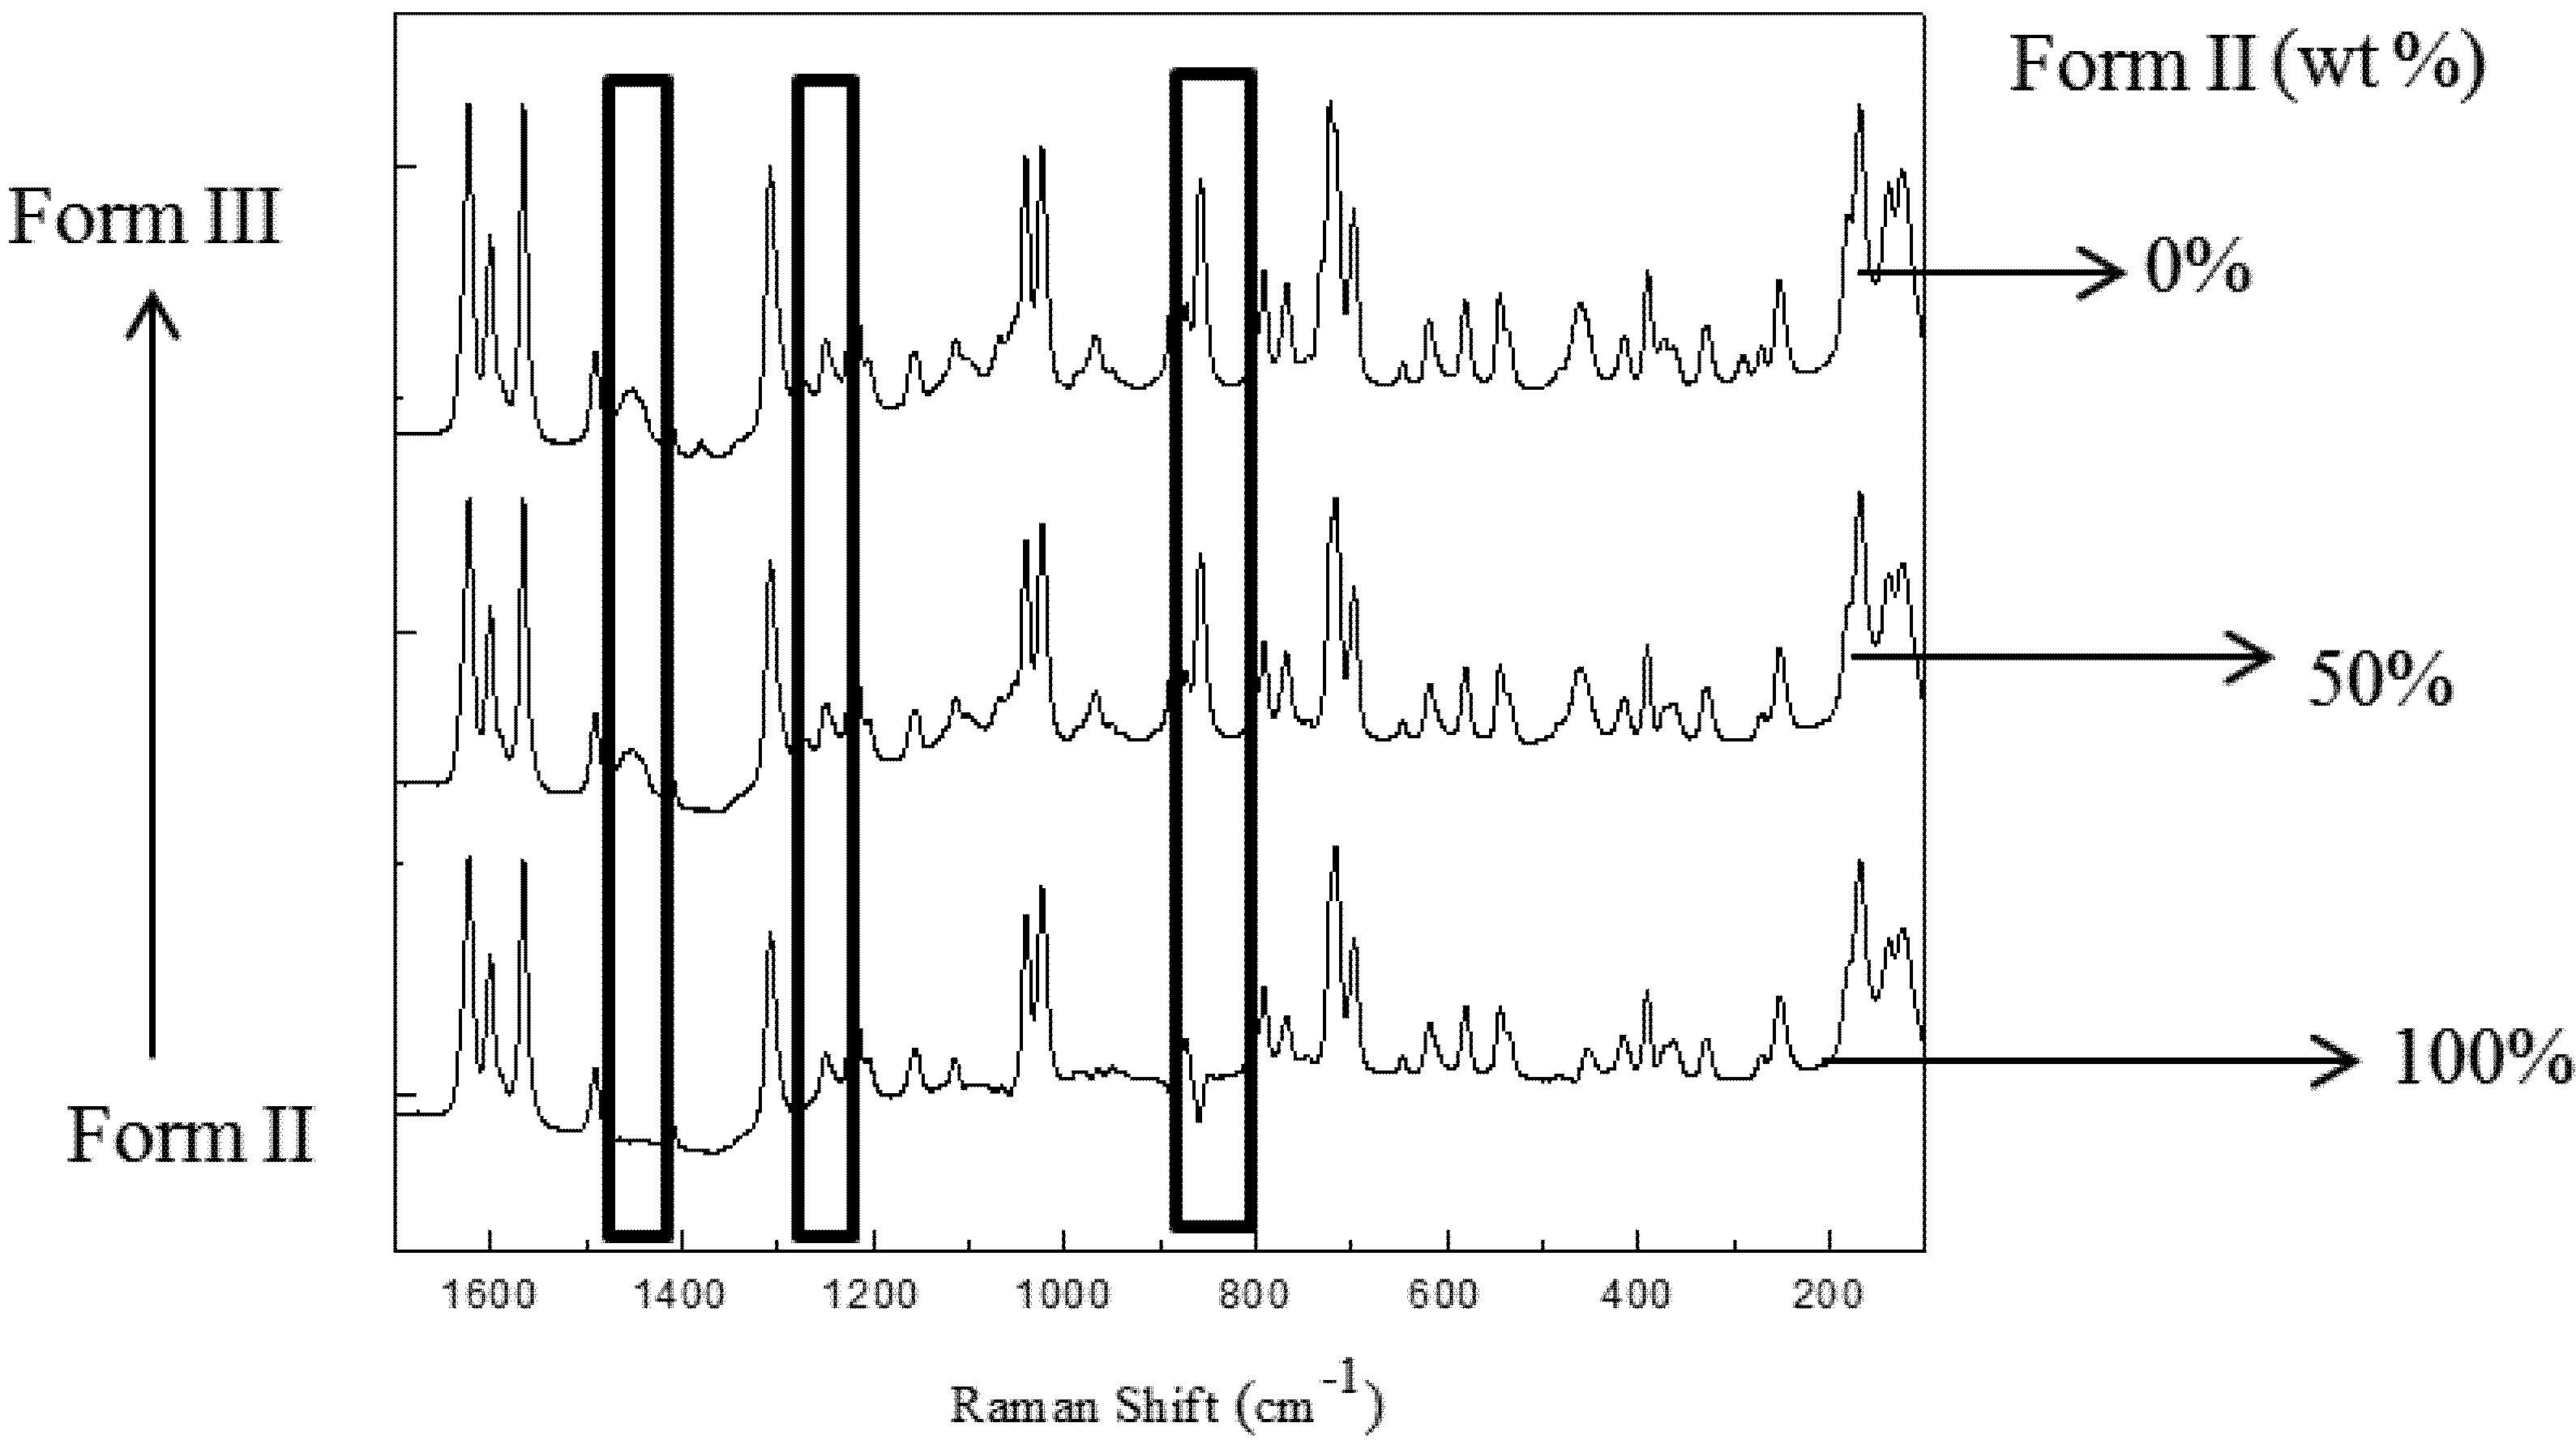
3.4. Quantitative Analysis of Polymorphic Transformation
3.5. Real-Time Monitoring of Polymorphic Transformation of Carbamazepine during Seeded Isothermal Crystallization
| Run Number | Initial solution concentration (g/g 1-propanol) | Supersaturation for Form III (g/g) | Relative seed mass of Form II (g Form II/g solute) |
|---|---|---|---|
| 1 | 0.0275 | 0.2791 | 7% |
| 2 | 0.0275 | 0.2791 | 10% |
| 3 | 0.0275 | 0.2791 | 15% |
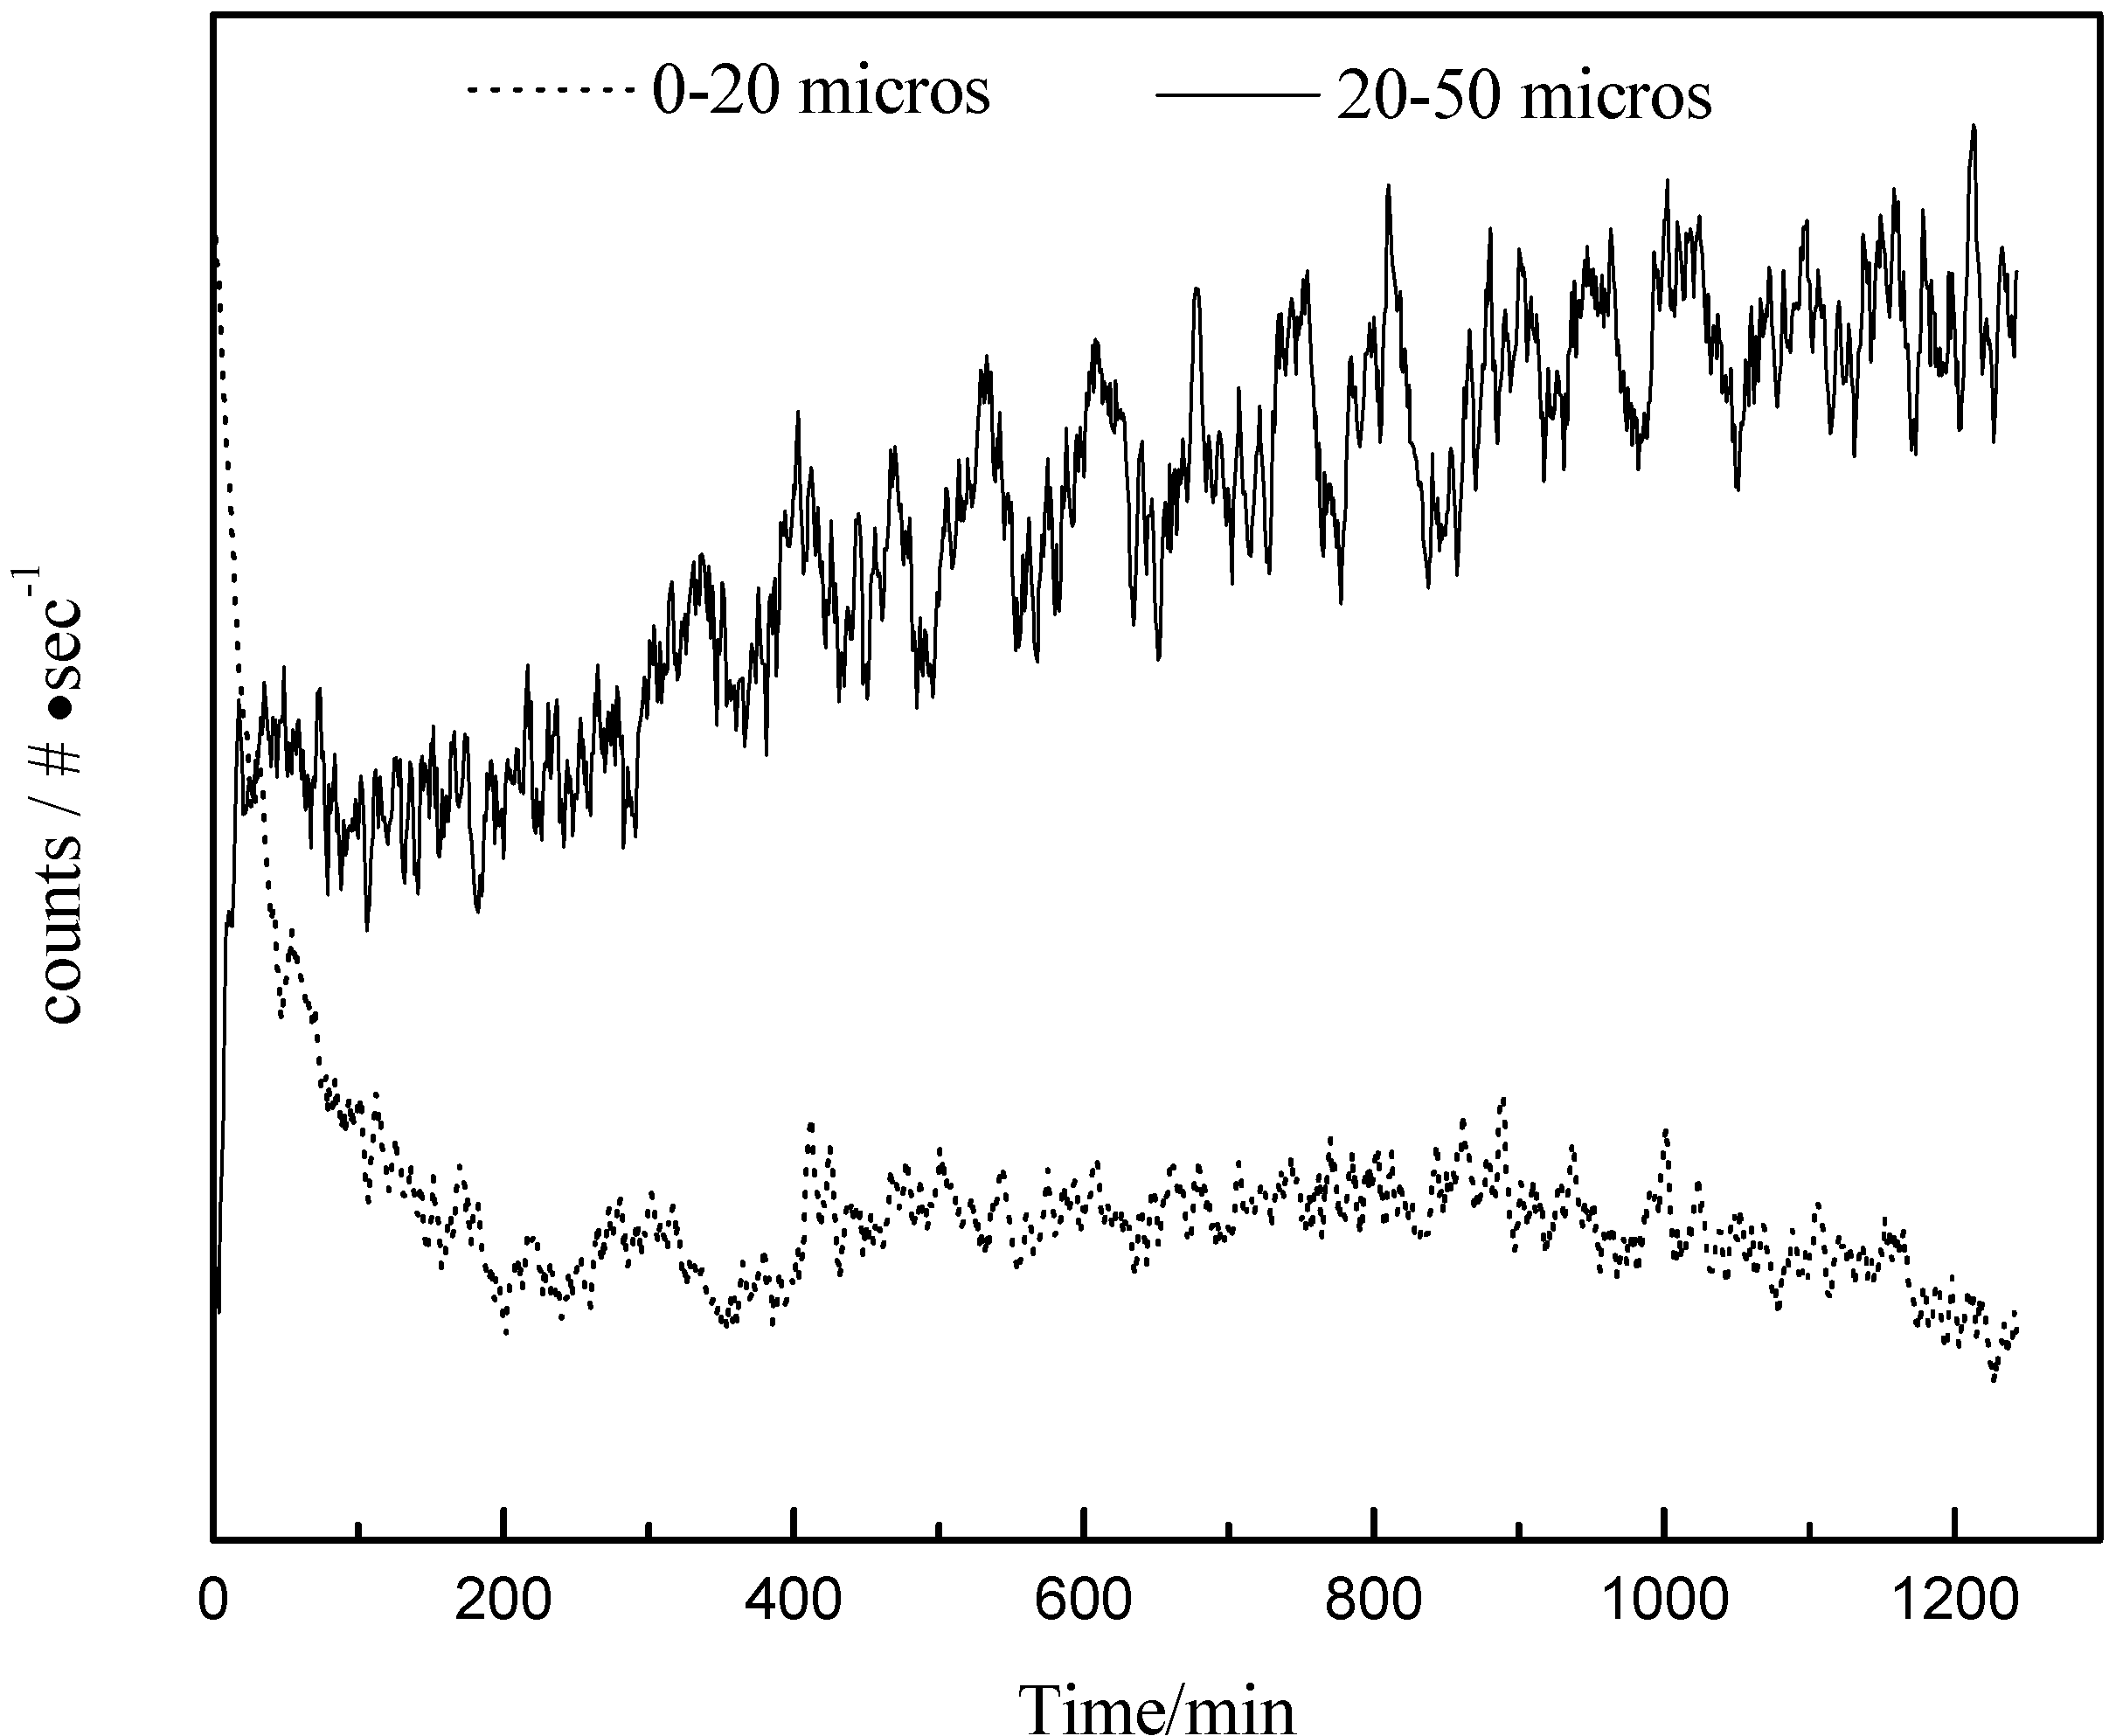
3.5.1. FBRM Results of Polymorphic Transformation in Seeded Isothermal Crystallization


3.5.2. Raman and FTIR Results of the Polymorph Transformation in Seeded Isothermal Crystallization
 and
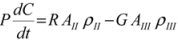
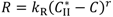
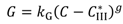
and  are solubilities of Form II and Form III respectively, g/g 1-propanol; R is the dissolution rate for Form II and G is the precipitation rate for Form III, both as g m−2 s−1; kR and kG are rate coefficients respectively. If it is assumed that AII and AIII are constant with time (a sweeping assumption) and both the dissolution and growth processes are first order (r = 1; g = 1), substituting Equation (4) and Equation (5) into Equation (3) and integrating gives:
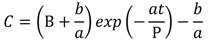
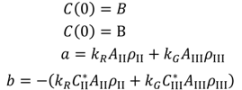
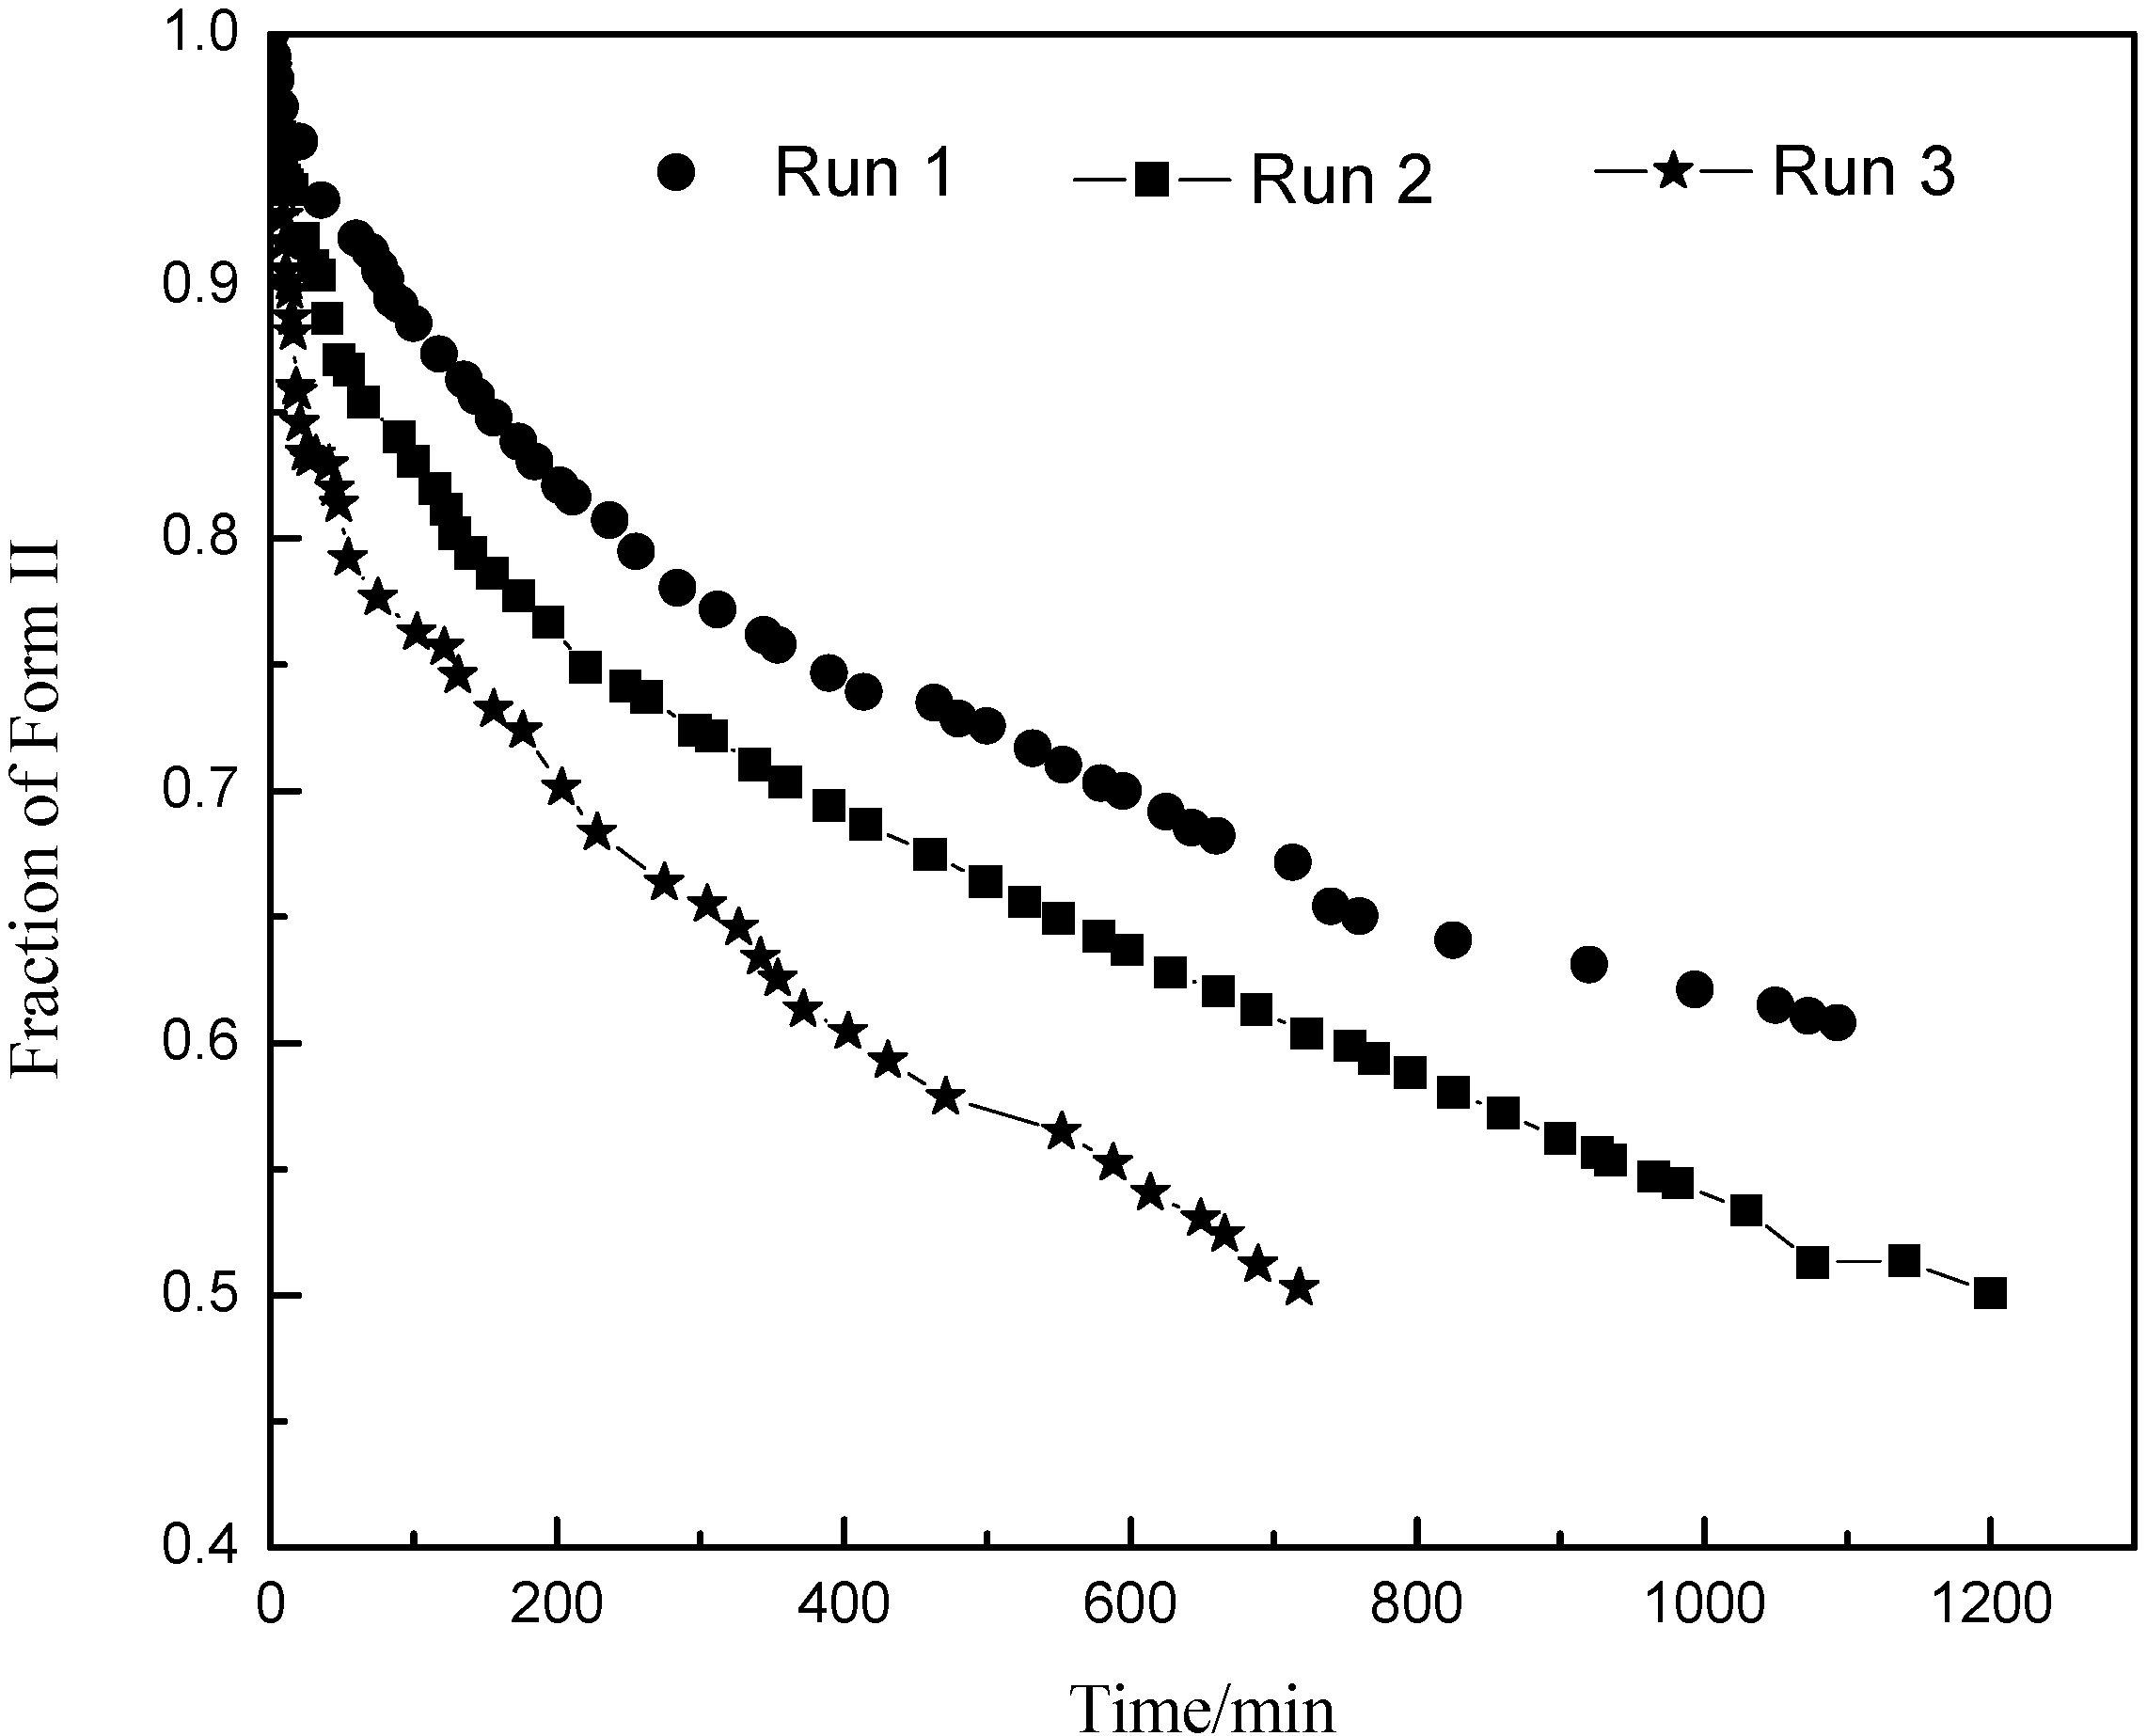
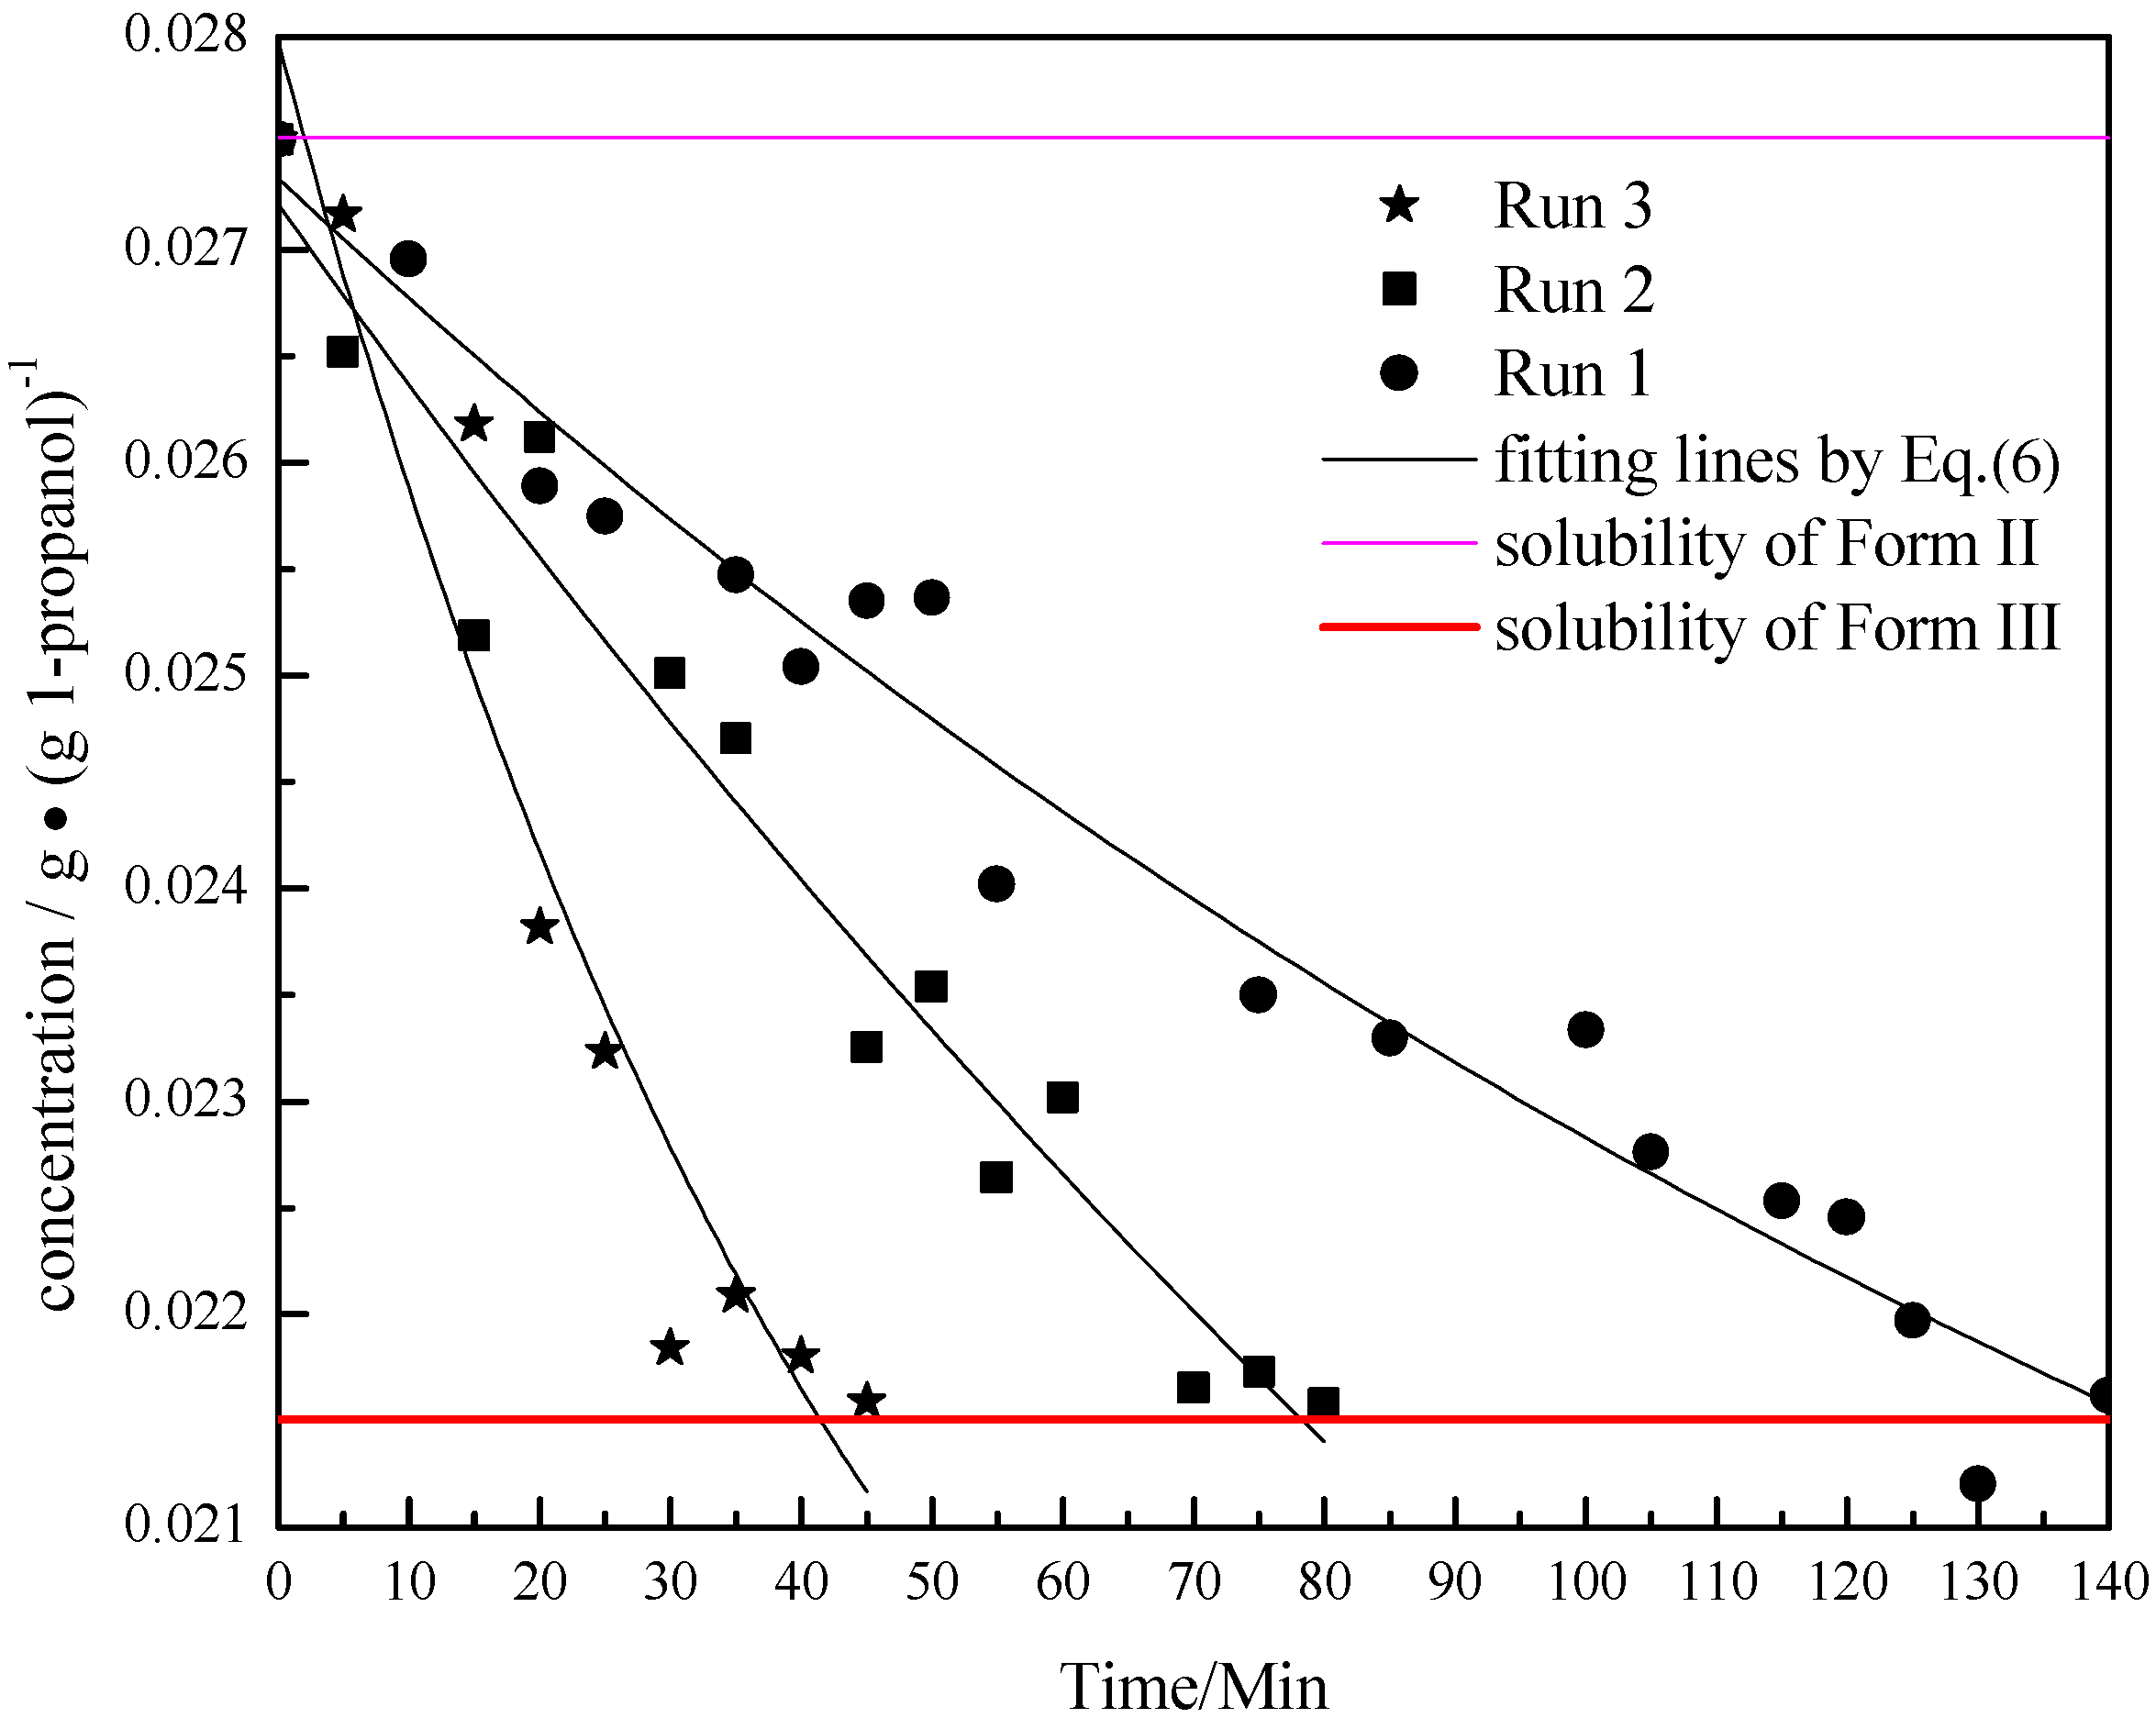
 . As the amount of seeds is increased the depletion curves (Figure 10) falls faster. The calculated values were also fitted by Equation (6), all the corresponding R^2 were above 0.90. Using the definition above for a, the model indicates that as more seed is added, AII and thus a would increase and so the concentration would fall faster for higher amounts of seed, as shown in Figure 10. Note that by assuming AII and AIII do not very with time, the model is highly approximate. The ratio of the two forms suspended in the solution can also be calculated from Raman spectra and compared with Figure 11. From Figure 8,Figure 9,Figure 10,Figure 11, we can conclude that the nucleation of Form III started immediately after Form II seeds were added in the saturated solution and the dissolution of Form II seeds followed thereafter.
4. Conclusions
References
- Chapman, D. The polymorphism of glycerides. Chem. Rev. 1962, 62, 433–456. [Google Scholar]
- Fried, E.; Gurtin, M.E. Dynamic solid-solid transitions with phase characterized by an order parameter. Phys. D 1994, 72, 287–308. [Google Scholar]
- Cardew, P.; Davey, R. The kinetics of solvent-mediated phase transformations. Proc. R. Soc. Lond. A 1985, 398, 415–428. [Google Scholar]
- O’Sullivan, B.; Barrett, P.; Hsiao, G.; Carr, A.; Glennon, B. In situ monitoring of polymorphic transitions. Org. Process Res. Dev. 2003, 7, 977–982. [Google Scholar] [CrossRef]
- O’Sullivan, B.; Glennon, B. Application of in situ FBRM and ATR-FTIR to the monitoring of the polymorphic transformation of D-mannitol. Org. Process Res. Dev. 2005, 9, 884–889. [Google Scholar]
- Ono, T.; Ter Horst, J.; Jansens, P. Quantitative measurement of the polymorphic transformation of L-glutamic acid using in-situ Raman spectroscopy. Cryst. Growth Des. 2004, 4, 465–469. [Google Scholar]
- Tian, F.; Zeitler, J.A.; Strachan, C.J.; Saville, D.J.; Gordon, K.C.; Rades, T. Characterizing the conversion kinetics of carbamazepine polymorphs to the dihydrate in aqueous suspension using Raman spectroscopy. J. Pharm. Biomed. Anal. 2006, 40, 271–280. [Google Scholar]
- Chen, Z.P.; Fevotte, G.; Caillet, A.; Littlejohn, D.; Morris, J. Advanced calibration strategy for in situ quantitative monitoring of phase transition processes in suspensions using FT-Raman spectroscopy. Anal. Chem. 2008, 80, 6658–6665. [Google Scholar]
- Vankeirsbilck, T.; Vercauteren, A.; Baeyens, W.; van der Weken, F. Applications of Raman spectroscopy in pharmaceutical analysis. TrAC Trends Anal. Chem. 2002, 21, 869–877. [Google Scholar]
- Liu, W.; Wei, H.; Black, S. An investigation of the transformation of carbamazepine from anhydrate to hydrate using in situ FBRM and PVM. Org. Process Res. Dev. 2009, 13, 494–500. [Google Scholar]
- Hartley, R.; Aleksandrowicz, J.; Ng, P.; McLain, B.; Bowmer, C.; Forsythe, W. Breakthrough seizures with generic carbamazepine: a consequence of poorer bioavailability? Br. J. Clin. Pract. 1990, 44, 270–273. [Google Scholar]
- Edwards, A.D.; Shekunov, B.Y.; Kordikowski, A.; Forbes, R.T.; York, P. Crystallization of pure anhydrous polymorphs of carbamazepine by solution enhanced dispersion with supercritical fluids (SEDS™). J. Pharm. Sci. 2001, 90, 1115–1124. [Google Scholar]
- Yoshihashi, Y.; Yonemochi, E.; Terada, K. Estimation of initial dissolution rate of drug substance by thermal analysis: Application for carbamazepine hydrate. Pharm. Dev. Technol. 2002, 7, 89–95. [Google Scholar]
- Burger, A.; Ramberger, R. On the polymorphism of pharmaceuticals and other molecular crystals. I: Theory of thermodynamic rules. Microchim. Acta 1979, 72, 259–271. [Google Scholar] [CrossRef]
- Ostwald, W. Studies of the formation and transformation of solid substances. Phys. Chem. 1897, 22, 289. [Google Scholar]
- Kaneko, F.; Sakashita, H.; Kobayashi, M.; Suzuki, M. Infrared spectroscopic and chemical etching study on the crystallization process of the B and E forms of stearic acid: Roles of dislocations in single crystals. J. Phys. Chem. 1994, 98, 3801–3808. [Google Scholar]
- Brittain, H.G. Polymorphism in Pharmaceutical Solids; Marcel Dekker, Inc.: New York, NY, USA, 1999; Volume 95. [Google Scholar]
- McCrone, W.C. “Polymorphism,” Chapter 8 in Physics and Chemistry of the Organic Solid State; Fox, D., Labes, M.M., Weissberger, A., Eds.; Interscience: New York, NY, USA, 1965; Volume 11. [Google Scholar]
- Grzesiak, A.L.; Lang, M.; Kim, K.; Matzger, A.J. Comparison of the four anhydrous polymorphs of carbamazepine and the crystal structure of form I. J. Pharm. Sci. 2003, 92, 2260–2271. [Google Scholar]
- Mao, S.; Zhang, Y.; Rohani, S.; Ray, A.K. Kinetics of (R, S)-and (R)-mandelic acid in an unseeded cooling batch crystallizer. J. Cryst. Growth 2010, 312, 3340–3348. [Google Scholar]
© 2012 by the authors; licensee MDPI, Basel, Switzerland. This article is an open-access article distributed under the terms and conditions of the Creative Commons Attribution license (http://creativecommons.org/licenses/by/3.0/).
Share and Cite
Zhao, Y.; Bao, Y.; Wang, J.; Rohani, S. In Situ Focused Beam Reflectance Measurement (FBRM), Attenuated Total Reflectance Fourier Transform Infrared (ATR-FTIR) and Raman Characterization of the Polymorphic Transformation of Carbamazepine. Pharmaceutics 2012, 4, 164-178. https://doi.org/10.3390/pharmaceutics4010164
Zhao Y, Bao Y, Wang J, Rohani S. In Situ Focused Beam Reflectance Measurement (FBRM), Attenuated Total Reflectance Fourier Transform Infrared (ATR-FTIR) and Raman Characterization of the Polymorphic Transformation of Carbamazepine. Pharmaceutics. 2012; 4(1):164-178. https://doi.org/10.3390/pharmaceutics4010164
Chicago/Turabian StyleZhao, Yingying, Ying Bao, Jingkang Wang, and Sohrab Rohani. 2012. "In Situ Focused Beam Reflectance Measurement (FBRM), Attenuated Total Reflectance Fourier Transform Infrared (ATR-FTIR) and Raman Characterization of the Polymorphic Transformation of Carbamazepine" Pharmaceutics 4, no. 1: 164-178. https://doi.org/10.3390/pharmaceutics4010164
APA StyleZhao, Y., Bao, Y., Wang, J., & Rohani, S. (2012). In Situ Focused Beam Reflectance Measurement (FBRM), Attenuated Total Reflectance Fourier Transform Infrared (ATR-FTIR) and Raman Characterization of the Polymorphic Transformation of Carbamazepine. Pharmaceutics, 4(1), 164-178. https://doi.org/10.3390/pharmaceutics4010164