A Computational Procedure for Assessing the Dynamic Performance of Diffusion-Controlled Transdermal Delivery Devices

Abstract
: The dynamic performances of two different controlled-release systems were analyzed. In a reservoir-type drug-delivery patch, the transdermal flux is influenced by the properties of the membrane. A constant thermodynamic drug activity is preserved in the donor compartment. Monolithic matrices are among the most inexpensive systems used to direct drug delivery. In these structures, the active pharmaceutical ingredients are encapsulated within a polymeric material. Despite the popularity of these two devices, to tailor the properties of the polymer and additives to specific transient behaviors can be challenging and time-consuming. The heuristic approaches often considered to select the vehicle formulation provide limited insight into key permeation mechanisms making it difficult to predict the device performance. In this contribution, a method to calculate the flux response time in a system consisting of a reservoir and a polymeric membrane was proposed and confirmed. Nearly 8.60 h passed before the metoprolol delivery rate reached ninety-eight percent of its final value. An expression was derived for the time it took to transport the active pharmaceutical ingredient out of the polymer. Ninety-eight percent of alpha-tocopherol acetate was released in 461.4 h following application to the skin. The effective time constant can be computed to help develop optimum design strategies.1. Introduction
Controlled-release devices are manufactured to deliver a specific dosage of a medication over an extended period of time. Some of the advantages of transdermal drug-delivery systems (TDDS) are improved patient compliance and a smooth plasma drug concentration profile as compared to oral administrations. In the development of TDDS, reservoir and monolithic (matrix) type devices are two main designs that have received increased attention. In the reservoir system, the drug is enclosed in a compartment located between a backing layer and a membrane that is used to control the delivery rate. The drug diffusion coefficient (D), and the thickness and compositions of the polymer can be manipulated to achieve a desired flux. Fick's second law of diffusion is implemented to describe drug transport across the rate limiting barrier. A lag effect is usually observed in these devices and equations are available in the literature to estimate physicochemical parameters necessary to simulate the process [1]. In the matrix system, the drug molecules are dissolved or dispersed throughout the membrane. Fabrication methods are designed to achieve a homogeneous distribution of the particles. Mathematical treatments of these products can be found in several modeling contributions [2-4].
The analysis conducted in this work takes the skin membrane into account. Drug transport is affected by resistances in the polymer and skin membranes. Because a constant thermodynamic activity is sustained in the donor, a steady-state permeation rate is achieved when reservoir devices are employed. Governing equations are derived that help explain the concentration profiles in terms of physicochemical parameters of the reservoir-polymer-skin system (hereafter called TDDS 1). Closed-form solutions can be obtained using techniques, such as the Residue method, to simulate the effects of membrane and drug properties on the release profile. These factors are expected to influence both the steady-state release rate (jss) and the time it takes to attain the desired jss. Although the concept of an effective time constant (teff) has been applied to characterize single-layer heat conduction [5] and double-layer drug-release systems [6], an analytical expression has not been formulated in the literature for the TDDS 1. Such an equation would allow researchers and manufacturers of transdermal patches to select excipients needed to make sure that the target delivery rate is achieved within a prescribed time.
When the release kinetics is influenced by both, the stratum corneous and a monolithic film, a steady-state flux is not attained in the absence of a reservoir. Instead, the fraction of drug released from the matrix is monitored. The drug transport mechanism in these matrix-skin systems (hereafter called TDDS 2) has been studied by several researchers [2,4]. It is clear, from the findings, that factors, such as the polymer-skin partition coefficient and the drug diffusivities in the vehicle and the skin, direct the fractional release profiles. However, the time required for the drugs to be released from the matrix is usually not known a priori. This metric would help estimate when to replace the monolithic patch. Research shows that repeated applications of the device can be used as a strategy to maintain a steady-state flux [7], leading to an effective drug concentration in the blood stream [8,9]. Similar to the TDDS 1 device, a single time constant can also be derived to predict the time (teff) it takes to release the drugs from the matrix.
This contribution focuses on the calculation of teff for TDDS 1 and 2. The article is organized as follows: A brief description of the governing transport equations is provided. Section 2 describes published experimental data that are used to illustrate the applications teff in predicting how fast an equilibrium flux is achieved in TDDS 1 or the time required to release 98% of the drug in TDDS 2. The results are presented and discussed in Section 3.
1.1. Transport equations in TDDS 1
The transport equations through both devices have been applied in several publications. These expressions are repeated here for completeness and to lay the foundation for the approach proposed in the Results and Discussion section. The temporal change in drug concentrations in the membrane, C1, and in the skin, C2 are:
The boundary conditions associated with Eqs. (1) and (2) take the forms:
Equation (5) relates the concentration at −la to the donor concentration. The infinite source condition is adequate for applications in which the loading dose is well above the drug saturation limit in the donor. The equilibrium partition coefficient at x = −la is assumed to have a value of 1; Eq. (6) describes the continuity of flux at the membrane-skin boundary; Eq. (7) denotes an equilibrium condition at x = 0 where km is the partition coefficient. A perfect sink condition is expressed by (8).
1.2. Transport equations in TDDS 2
The governing equations are similar to the ones describing drug transport through TDDS 1 except for the following changes. Equation (3) is replaced by:
1.3. The notion of an effective time constant
A first-order system can be written as:
It can be shown that y is at 63.2% of its ultimate value after one time constant. At 4τp , the response has attained 98% of its final value (called the response time). In the tank heater case, the response time denotes the period elapsed before the temperature changes by 5.0 °F. Using the Laplace variable s, often used to analyze the dynamics of linear systems, the response becomes:
Without solving for y(t) directly in Eq. (11), an inspection of Eq. (12) shows the time constant. In addition, the steady-state value yss is easily obtained:
A similar approach can be adopted for processes in which the variable of interest can be approximated by a series:
2. Experimental Section
The experimental data used to analyze the TDDS 1 device are based on the release of metoprolol in hairless rats published in [10]. Drug transport was described in [11] and [12]. Metoprolol is known to help treat patients who suffer from hypertension and angina. Ouriemchi and Vergnaud examined a situation in which a constant concentration of 0.036 g/cm3 was maintained on the external side of a polymeric membrane 0.12-cm thick (Scotch Pack 1006, 3M Company, USA) [11]. The thickness of the skin was 0.038 cm and the drug diffusivity coefficients in the membrane and dermal layers were 4.4 × 10⁻⁵ cm2/s and 2.2 × 10⁻⁸ cm2/s, respectively. These parameters, when incorporated in a mathematical model, were able to simulate the permeation study conducted by Ghosh et al. [10].
Released data from the permeation of alpha-tocopherol acetate (ATA) were used to examine the performance of TDDS 2 [13]. The ester prodrug (ATA) is preferred over alpha-tocopherol (AT), a vitamin E homologue, for topical applications because of AT's particularly short shelf life. AT provides protection against mutagens and the deleterious effects of ultraviolet B (UVB) rays on the skin. Studies, conducted by Saral et al., led to similar conclusions concerning the role of ATA in protecting dorsal skin of guinea pigs from UVB-induced damage [14]. Mahamonghol et al. focused on five formulations of ATA [13]. This contribution uses the results from the permeation of 5% (w/w) ATA from isopropyl myristate. The experiments occurred in a redesigned Franz diffusion cell system (Crown Glass Company, Somerville, NJ) maintained at 37 °C. Cadaver skins were placed between the donor and receiver chambers. The permeability of ATA through the skin was 1.1 × 10⁻² cm/h; the thickness of the donor solution and the membrane were 0.56 cm and 0.005 cm, respectively. The initial concentration in the donor compartment was 50000 μg/cm3.
3. Results and Discussion
3.1. Derivation of teff for TDDS 1
The variables and original model equations are converted into their dimensionless counterparts:
Similarly, Eqs. (5) to (8) become:
If we define the normalized flux by:
The dimensional expression is:
It can be shown that the ratio of the flux to its steady-state value in the Laplace domain is:
3.2. Application of teff for TDDS 1 to experimental data
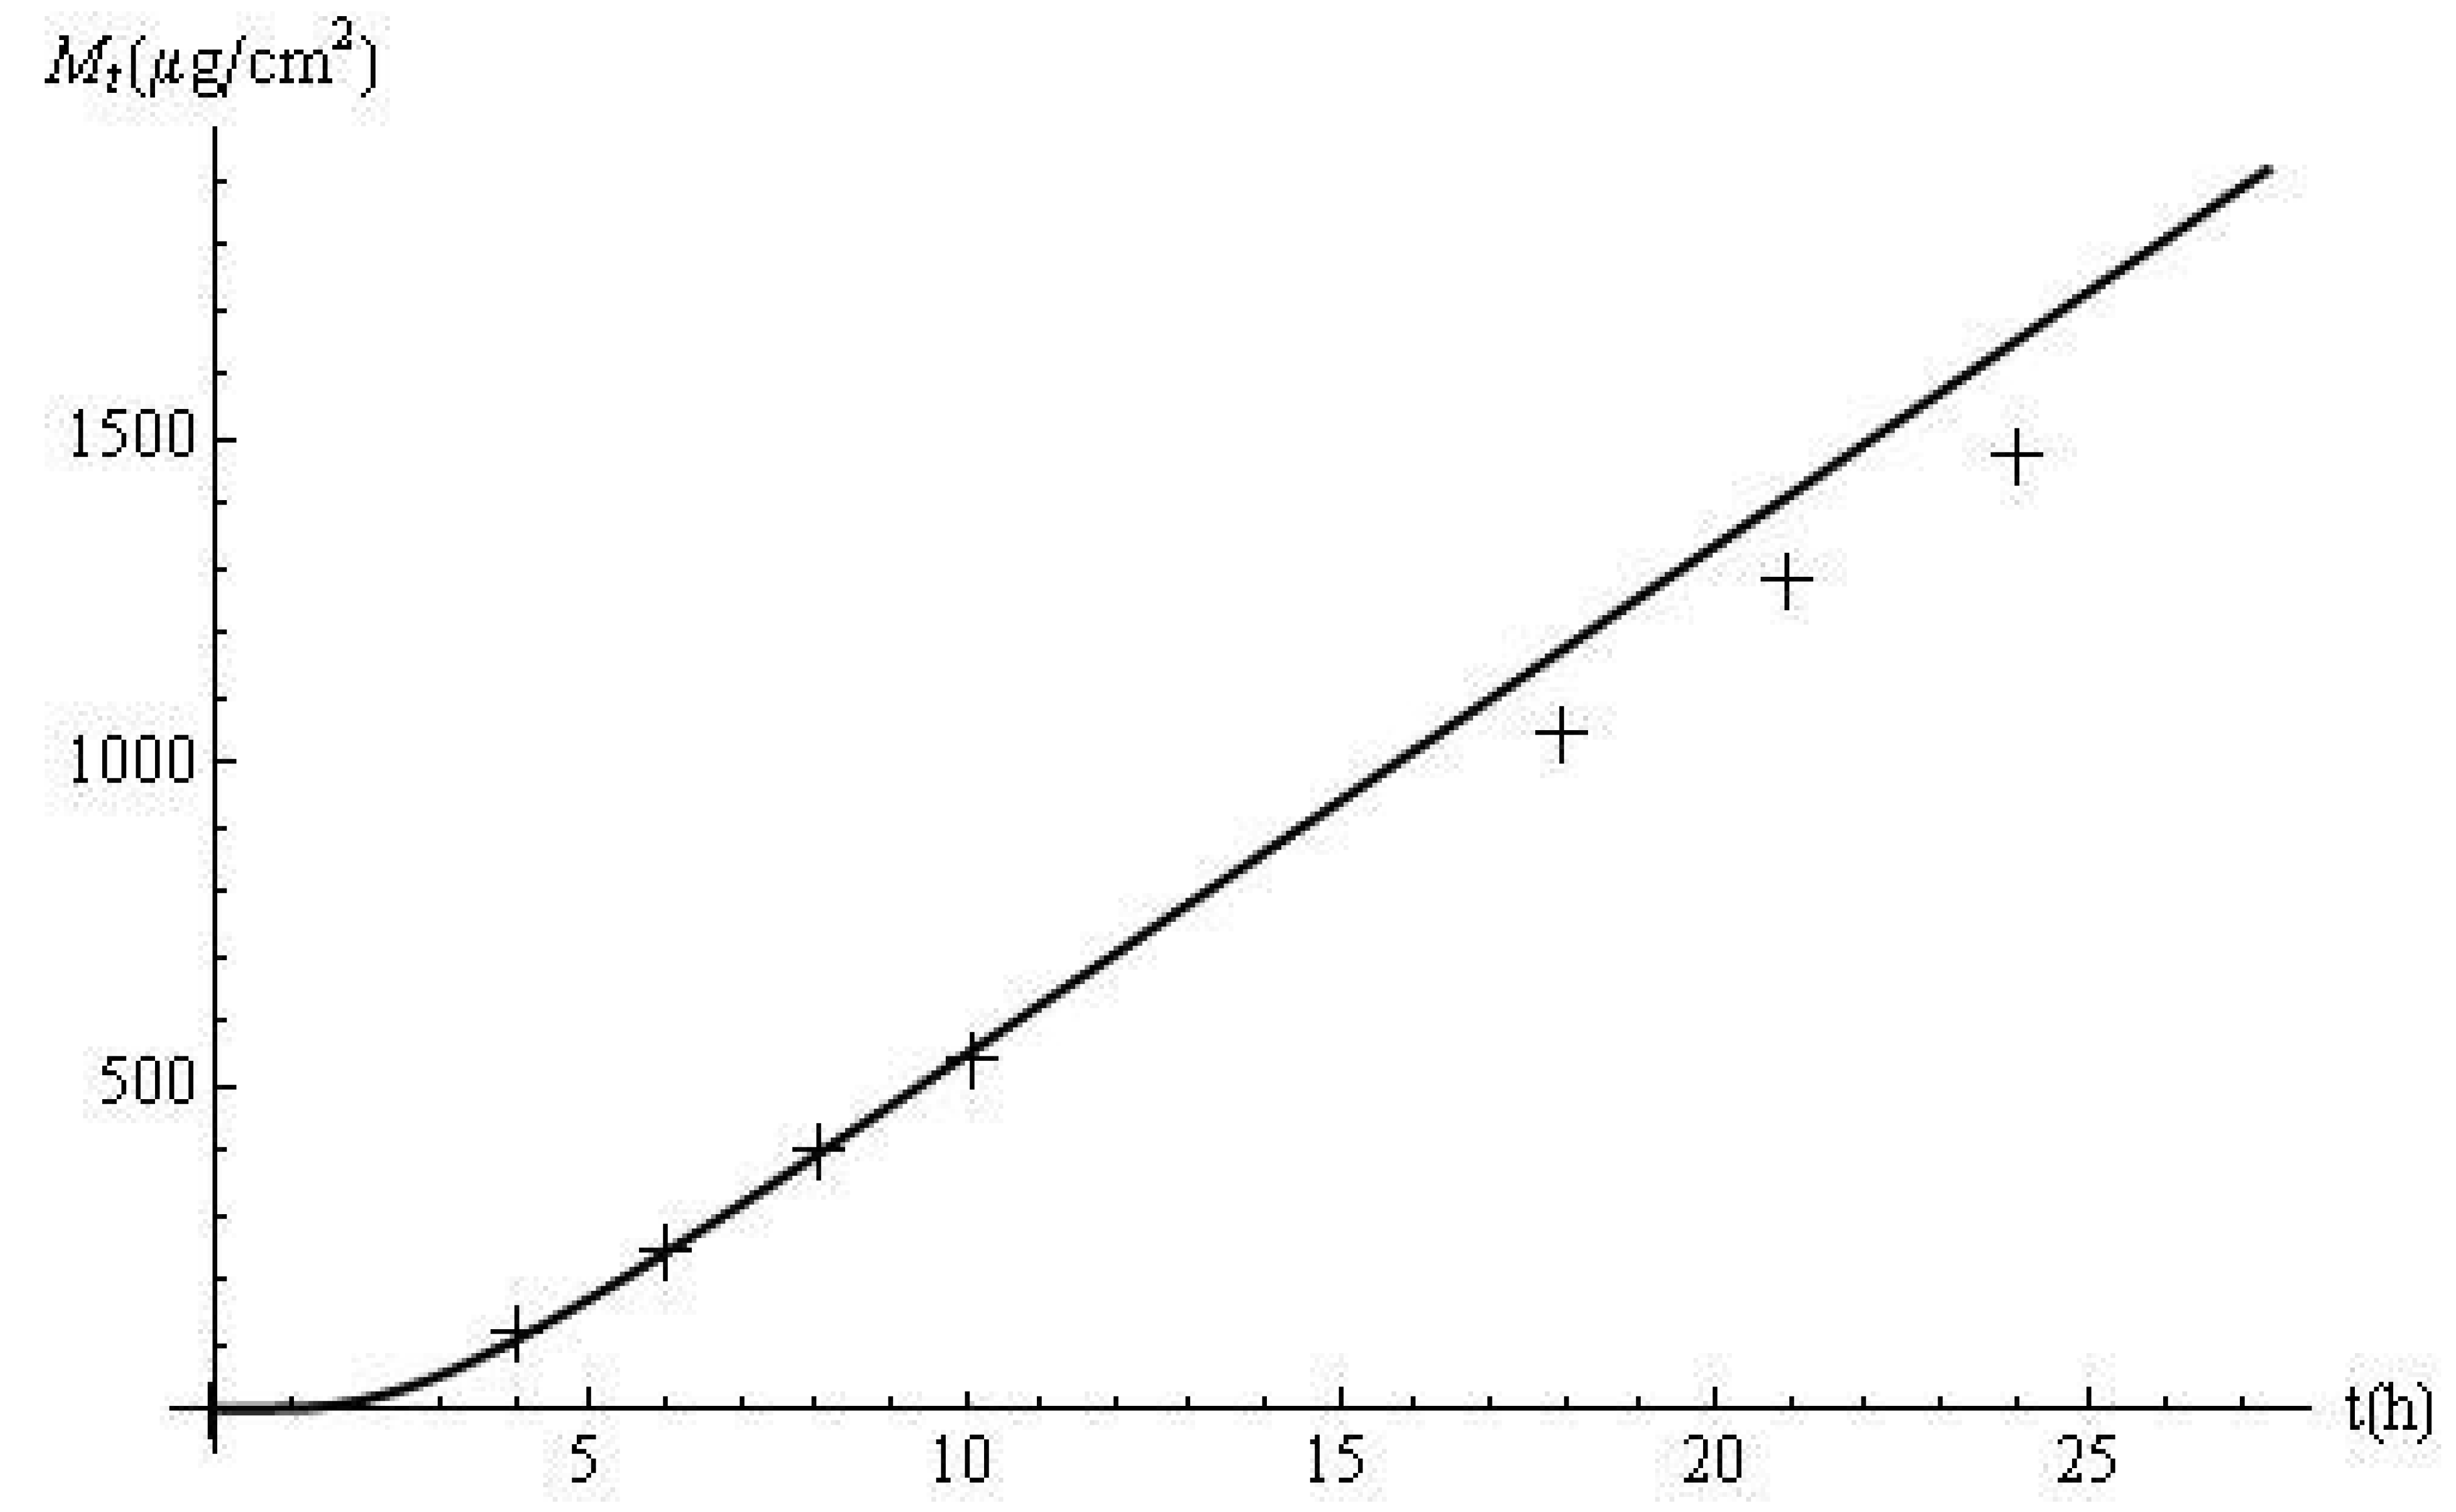
The model parameters were obtained from [11]: C0 = 0.038 g/cm3, D 1 = 4.4 × 10⁻⁵ cm2/s, D2 = 2.2 × 10⁻⁸ cm2/s, la = 0.12 cm, lb = 0.038 cm and km = 1 (i.e., β = 1.58 × 10⁻³, p = 200.5). Data published in [10] were used to validate the mathematical approach. The experimental and calculated cumulative amounts of drug released:
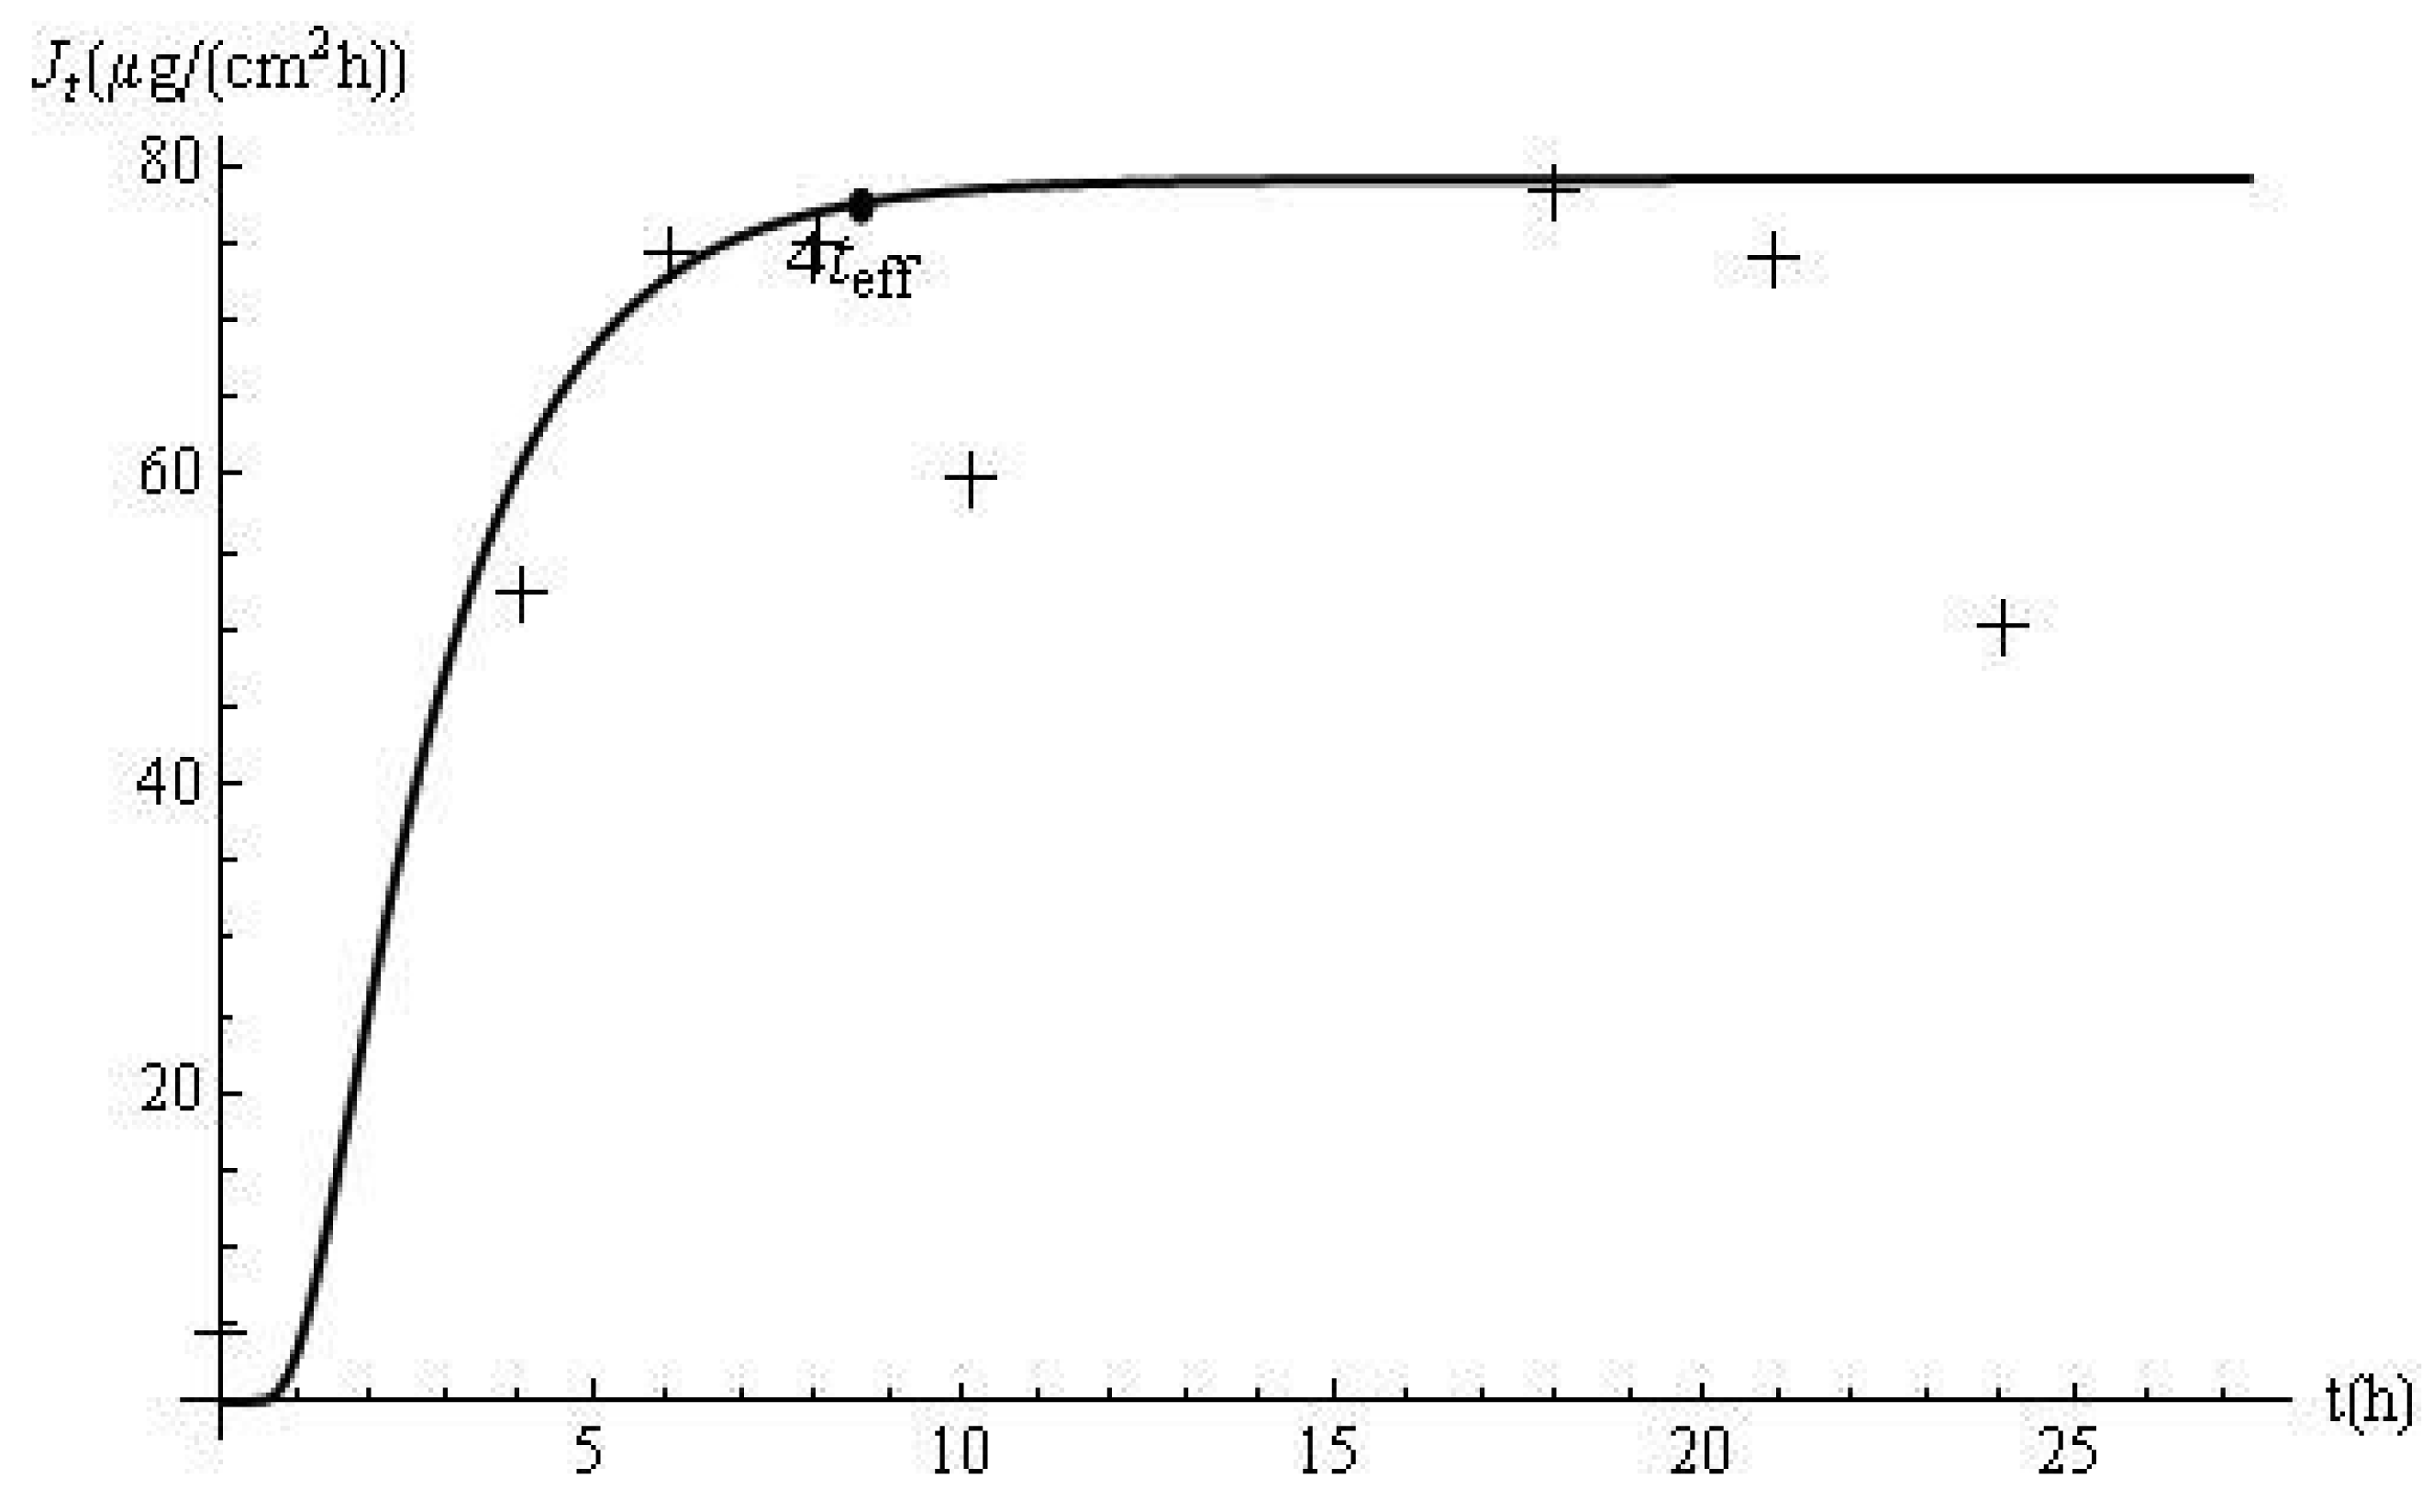
The flux profiles are shown in Figure 2. The experimental delivery rate was obtained after applying a cubic spline to the data. The disagreement between the model predictions and the laboratory data, observed in Figure 1, is accentuated by the use of the derivative approximation. In this case, teff and the response time (i.e., 4teff) are 2.15 h and 8.60 h, respectively. Based on this approach, it can be estimated, from the membrane and skin properties alone, that it should take approximately 8.60 h for the flux to reach 98% of its steady-state value of 79.2 μg/cm2 h. This prediction is confirmed by Figure 2. In addition, computations with Jt show that the delivery at this time (i.e., J8.60) is 77.62 μg/cm2 h, which is 98% of the ultimate value of the flux.
The time lag (tlag) is often calculated to determine the diffusion and partition coefficients for molecular transport through a flat membrane assuming perfect sink and infinite source conditions. In such a case, the steady-state flux is achieved after 2.7 × tlag. However, for the TDDS 1, the expression for tlag would involve the diffusion coefficients in the two layers, among other parameters. In addition, how this measurement is correlated with the onset of jss is not as well established as in the case of the one-layer model. The effective time constant is adopted in this contribution.
3.3. Derivation of teff for TDDS 2
The normalized equations for TDDS 1 are also appropriate for TDDS 2 with the following modifications. Equations (20) and (22) are changed to:
The cumulative amount of drug released is:
Considering that:
3.4. Application of teff for TDDS 2 to experimental data
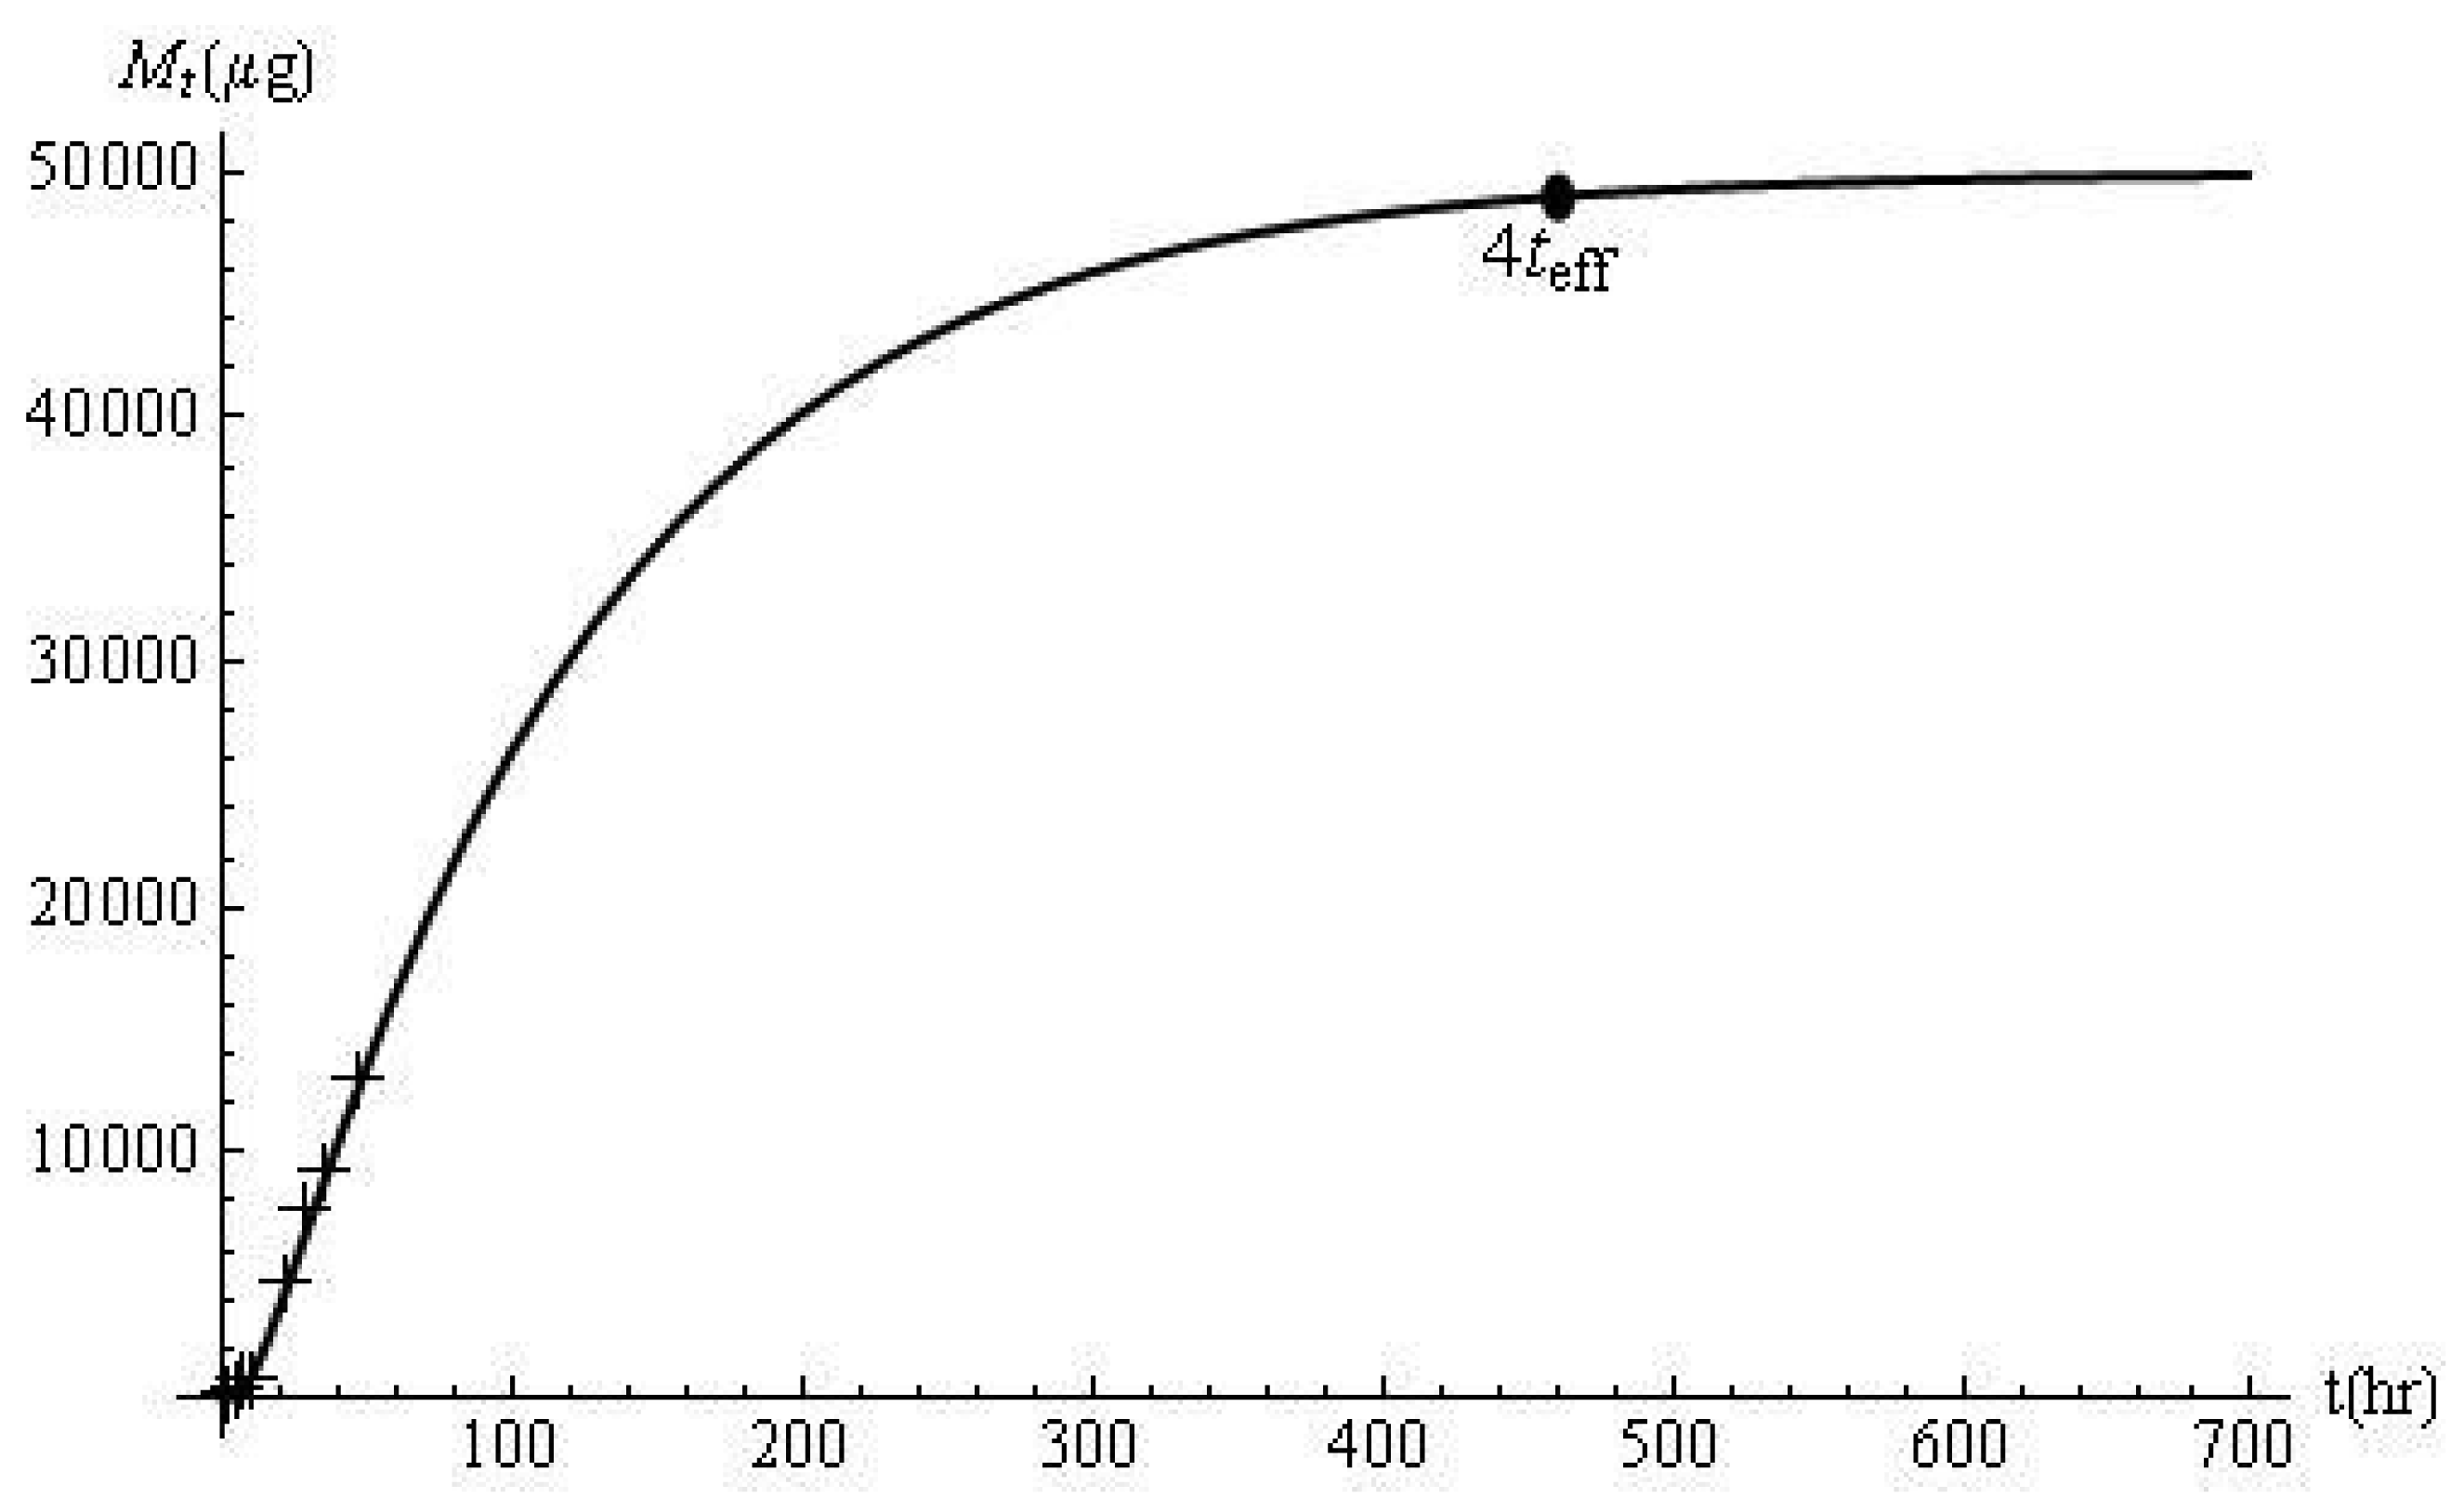
Mahamongkol et al. (2005) provided permeation data which were analyzed, via the method outlined in [16], to determine the following parameters: D 1 = 2.27 × 10⁻³ cm2/h, D2 = 4.30 × 10⁻⁷ cm2/h, km = 7.81 × 10⁻³ Additional data were obtained from [13]: la = 0.56 cm, lb = 0.005 cm and C0 = 50000 μg/cm3 (i.e., β = 3.81, p = 0.41). Good agreement was observed between predicted and experimental Mt profiles measured in the first 50 min (Figure 3). Based on a calculated teff of 115.3 h, it would take 461.4 h to release 98% of ATA from the device (i.e. 0.98 AlaC1,0 = 49,000 μg). The same fraction of drug was estimated by calculating Mt/M∞ at t = 461.4 h.
Product designers can use the effective time constant to estimate the performances of TDDS 1 and TDDS 2. The method provides manufacturers with an analytical tool to help estimate the time it takes the medication to begin working after the application of a patch of type TDDS 1. In studies involving removal and reapplication of transdermal matrix systems [8,9,17], the method developed for TDDS 2 can be adapted to estimate how long a person has to wear the patch. In addition, calculation of teff is straightforward and does not involve the solution of a system of partial differential equations. This approach can be applied to help design novel drug-delivery products where both the steady-state delivery rate and the effective time constant are controlled. The methods implemented do not rely on a short-time approximation of the original equations. Instead, the complete transient behavior of the process is included in the analysis. As a result, the effective-time-constant technique offers broad practical applications and may help researchers assess both short-term and long-term dynamic performances of a drug-delivery device. The framework also provides the possibility for investigating the effects of design specifications on teff. Diffusion coefficients and the membrane thickness can be manipulated to produce a desired teff value and satisfy end-user requirements. Because closed-form expressions are provided, sensitivity analysis can be conducted to identify which parameters influence the release time of a drug the most.
4. Conclusions
The time to reach a steady-state flux and to release the drug from the polymer matrix was derived for two types of devices TDDS 1 and TDDS 2. Although the methodology used the original partial differential equations (PDEs) and Laplace transforms, the final formulas contain user-friendly expressions that can be easily coded in spreadsheet packages. The effective time constant computed for the reservoir-polymer-skin system (TDDS 1) correctly predicted the period required to attain an equilibrium steady-state delivery rate of metoprolol in hairless rats. Analysis of data collected from the delivery of alpha-tocopherol acetate in an isopropyl myristate vehicle shows that it would take 461.4 h to release 98% of the drug. This estimation was in agreement with the numerical solution of the governing PDEs. The approach can be implemented in cases such as repeated applications of a patch and the optimal design of controlled release devices.


Conflict of Interest
The authors declare no conflict of interest.
References
- Crank, J. Mathematics of Diffusion, 2nd ed.; Oxford University Press: New York, NY, USA, 1975; pp. 44–68. [Google Scholar]
- Hadgraft, J. Calculations of drug release rates from controlled release devices: The slab. Int. J. Pharm. 1979, 2, 177–194. [Google Scholar]
- Kalia, Y.N.; Guy, R.H. Modeling transdermal drug release. Adv. Drug Deliv. Rev. 2001, 48, 159–172. [Google Scholar]
- Fernandes, M.; Simon, L.; Loney, N.W. Mathematical modeling of transdermal drug-delivery systems: Analysis and applications. J. Membrane Sci. 2005, 256, 184–192. [Google Scholar]
- Collins, R. The choice of an effective time constant for diffusive processes in finite systems. J. Phys. D: Appl. Phys. 1980, 13, 1935–1947. [Google Scholar]
- Simon, L.; Bolisetty, P.; Erazo, M.N. Dynamics of dissolution and diffusion-controlled drug release systems. Curr. Drug Deliv. 2011, 8, 144–151. [Google Scholar]
- Simon, L. Repeated applications of a transdermal patch: Analytical solution and optimal control of the delivery rate. Math. BioSci. 2007, 209, 593–607. [Google Scholar]
- Rohr, U.D.; Saeger-Lorenz, K. 17beta-estradiol matrixpatch removal and reapplication in postmenopausal women: theoretical predictions with an oscillating diffusion coefficient model. J. Pharm. Sci. 2002, 91, 822–844. [Google Scholar]
- Rohr, U.D.; Saeger-Lorenz, K. 17beta-estradiol matrixpatch removal and reapplication in postmenopausal women: experimental results. J. Pharm. Sci. 2002, 91, 810–821. [Google Scholar]
- Ghosh, T.K.; Adir, J.; Xiang, S.L.; Onyilofur, S. Transdermal delivery of metoprolol. II: In-vitro skin permeation and bioavailability in hairless rats. J. Pharm. Sci. 1995, 84, 158–160. [Google Scholar]
- Ouriemchi, E.M.; Vergnaud, J.M. Processes of drug transfer with three different polymeric systems with transdermal drug delivery. Comput. Theor. Polym. S 2000, 10, 391–401. [Google Scholar]
- Grassi, M.; Lamberti, G.; Cascone, S.; Grassi, G. Mathematical modeling of simultaneous drug release and in vivo absorption. Int. J. Pharm. 2011. [Google Scholar] [CrossRef]
- Mahamongkol, H.; Bellantone, R.A.; Stagni, G.; Plakogiannis, F.M. Permeation study of five formulations of alpha-tocopherol acetate through human cadaver skin. J. Cosmet. Sci. 2005, 56, 91–103. [Google Scholar]
- Saral, Y.; Uyar, B.; Ayar, A.; Naziroglu, M. Protective effects of topical alpha-tocopherol acetate on UVB irradiation in guinea pigs: importance of free radicals. Physiol. Res. 2002, 51, 285–290. [Google Scholar]
- Abate, J.; Valkó, P. Multi-precision Laplace transform inversion. Int. J. Numer. Meth. Eng. 2004, 60, 979–993. [Google Scholar]
- Bellantone, R.A.; Nicolettos, N.; Plakogiannis, F.M. Faster determination of membrane permeabilities without using the lag time method. Int. J. Pharm. 2002, 248, 81–92. [Google Scholar]
- Kubota, K.; Dey, F.; Matar, S.; Twizell, E.H. A repeated-dose model of percutaneous drug absorption. Appl. Math. Model. 2002, 26, 529–544. [Google Scholar]
© 2011 by the authors; licensee MDPI, Basel, Switzerland. This article is an open access article distributed under the terms and conditions of the Creative Commons Attribution license (http://creativecommons.org/licenses/by/3.0/).
Share and Cite
Simon, L. A Computational Procedure for Assessing the Dynamic Performance of Diffusion-Controlled Transdermal Delivery Devices. Pharmaceutics 2011, 3, 485-496. https://doi.org/10.3390/pharmaceutics3030485
Simon L. A Computational Procedure for Assessing the Dynamic Performance of Diffusion-Controlled Transdermal Delivery Devices. Pharmaceutics. 2011; 3(3):485-496. https://doi.org/10.3390/pharmaceutics3030485
Chicago/Turabian StyleSimon, Laurent. 2011. "A Computational Procedure for Assessing the Dynamic Performance of Diffusion-Controlled Transdermal Delivery Devices" Pharmaceutics 3, no. 3: 485-496. https://doi.org/10.3390/pharmaceutics3030485