Article

Comparative Drought Responses of Quercus ilex L. and Pinus sylvestris L. in a Montane Forest Undergoing a Vegetation Shift

by
David Aguadé
1,2,*,
Rafael Poyatos
1,†,
Teresa Rosas
1,† and
Jordi Martínez-Vilalta
1,2,†
1
CREAF, Cerdanyola del Vallès E-08193 (Barcelona), Spain
2
Universitat Autònoma de Barcelona, Cerdanyola del Vallès E-08193(Barcelona), Spain
*
Author to whom correspondence should be addressed.
These authors contributed equally to this work.
Forests 2015, 6(8), 2505-2529; https://doi.org/10.3390/f6082505
Submission received: 12 May 2015 / Revised: 7 July 2015 / Accepted: 13 July 2015 / Published: 27 July 2015
(This article belongs to the Special Issue Responses of Forest Trees to Drought)

Abstract

:
Different functional and structural strategies to cope with water shortage exist both within and across plant communities. The current trend towards increasing drought in many regions could drive some species to their physiological limits of drought tolerance, potentially leading to mortality episodes and vegetation shifts. In this paper, we study the drought responses of Quercus ilex and Pinus sylvestris in a montane Mediterranean forest where the former species is replacing the latter in association with recent episodes of drought-induced mortality. Our aim was to compare the physiological responses to variations in soil water content (SWC) and vapor pressure deficit (VPD) of the two species when living together in a mixed stand or separately in pure stands, where the canopies of both species are completely exposed to high radiation and VPD. P. sylvestris showed typical isohydric behavior, with greater losses of stomatal conductance with declining SWC and greater reductions of stored non-structural carbohydrates during drought, consistent with carbon starvation being an important factor in the mortality of this species. On the other hand, Q. ilex trees showed a more anisohydric behavior, experiencing more negative water potentials and higher levels of xylem embolism under extreme drought, presumably putting them at higher risk of hydraulic failure. In addition, our results show relatively small changes in the physiological responses of Q. ilex in mixed vs. pure stands, suggesting that the current replacement of P. sylvestris by Q. ilex will continue.

1. Introduction

Plants have different functional strategies to cope with drought and seasonal variations in water availability, including physiological (e.g., stomatal control) and structural acclimation (e.g., leaf area loss) [1]. However, ongoing climate change can potentially drive plants to their physiological limits of climate tolerance [2]. The impacts of climate change on vegetation are likely to vary regionally and will result from a combination of stress factors, including elevated temperatures [3], reduction of rainfall [4], and shifts in wildfire regimes [5]. Furthermore, the consequences of these new conditions will be modulated by biotic factors and direct human impacts on forests (e.g., management) [6,7].
Different ways of classifying plant drought responses have been postulated. For instance, plants have been classified as drought-avoiders (i.e., species with deep roots) or drought-tolerant (i.e., species with high xylem embolism resistance) depending on the water potentials they experience [1]. A related classification differentiates between isohydric and anisohydric species depending on their degree of stomatal regulation in response to drought [8,9]. From a hydraulic perspective, the isohydric strategy (which could be related to the aforementioned drought-avoiders) is characterized by an early stomatal closure during drought to limit water losses and prevent a drastic reduction of leaf water potential [10]. These plants have been hypothesized to be prone to suffer carbon starvation during a prolonged drought, since they cannot maintain assimilation and may not be able to meet sustained carbon demands (e.g., respiration) [10]. On the other hand, anisohydric species (related to the aforementioned drought-tolerant species) would show less strict stomatal control and more negative water potential during drought. It has been hypothesized that these plants would be more likely to suffer extensive embolism and, ultimately, hydraulic failure during an intense drought [10].
In many ways, the dichotomy between iso-/anisohydric strategies underlies our current conceptual framework to explain plant responses to extreme drought. However, this dichotomy is controversial. First of all, plants do not necessarily fall into either category, but rather stomatal regulation lies within a spectrum of stomatal sensitivity to water potential [11]. Hence, there is a wide range of stomatal responses to drought and these physiological responses are generally coordinated with the tree’s hydraulic architecture [12]. Furthermore, iso-/anisohydric behavior may vary within species as a function of environmental conditions [13]. In addition, the link between stomatal regulation and leaf water potential is likely to be more complex that previously realized, both because of the need to account for differences in the hydraulic properties of plants (e.g., the vulnerability to xylem embolism) [12] and because of the different mechanisms of stomatal closure across species [14]. A further complication in the study of plant responses to severe drought arises because water stress is triggered by both a reduction in soil moisture and an increase of the evaporative demand (vapor pressure deficit; VPD), and stomata regulation responds to both of them [15]. Despite the important role of the soil compartment in drought-induced decline [16,17], atmospheric dryness is also important in explaining drought-induced mortality processes [18].
Water-limited woodlands frequently host coexisting species with contrasting drought responses [19]. However, extreme and/or chronic drought events outside of the historic range experienced by the local community can affect species differentially, potentially altering competitive relationships and causing vegetation shifts [10,20,21] (however, see Lloret et al. [22]). However, most of our knowledge on species-specific drought-responses and physiological thresholds is based on studies on potted plants or small trees under experimental conditions [23,24], which may not represent the true responses of mature forest trees. On the other hand, drought conditions experienced by a tree within a forest depend on its exposure to the atmosphere, which may change dramatically during a die-off event (i.e., an understory tree may suddenly be exposed to much higher radiation and VPD). In general, species whose leaves are more exposed to the atmosphere would respond differently to VPD than those in the understory, especially under drought conditions [25]. For an understory species to become dominant in the canopy as a result of a drought event, it is required that the formerly dominant species dies off but also that the species initially in the understory is able to cope with new, more exposed, conditions.
Pinus sylvestris L. (Scots pine) and Quercus ilex L. (holm oak) coexist in montane Mediterranean forests, where the latter species frequently grows in the understory of a pine canopy. However, these two species have different geographical distributions and contrasted physiological strategies to cope with drought [26,27]. P. sylvestris is distributed from Siberia to the Mediterranean basin, with the Iberian Peninsula being the southwestern limit of its range. On the contrary, Q. ilex is restricted to the Mediterranean basin. When studied separately, both species are considered relatively isohydric, since they close stomata at moderately high water potentials. This is particularly true for P. sylvestris, which has been shown to reduce stomatal conductance and sap flow, as well as leaf area, dramatically during dry periods [28,29]. Consistent with this behavior, low levels of carbohydrate reserves during drought have been associated with increased mortality risks in this species [30,31], in agreement with the carbon starvation hypothesis [10]. Although Q. ilex tends to operate at lower (more negative) water potentials than P. sylvestris, it appears relatively isohydric compared to many of the species with which it coexists [32,33] and carbohydrate reductions associated with drought-induced mortality have also been documented in this species [34]. P. sylvestris and Q. ilex species coexist in some forests of the northern Iberian Peninsula, where both of them have suffered drought-related die-off episodes in recent years [35,36]. However, where the two species coexist mortality seems to preferentially affect P. sylvestris, which has led to the hypothesis that Q. ilex may end up replacing P. sylvestris as the canopy-dominant species [21,37]. It remains to be established, however, whether Q. ilex individuals that formerly occupied the understory will be able to cope with increased drought conditions as they become more exposed to high radiation and VPD.
In this study, we compare the physiological responses of coexisting P. sylvestris and Q. ilex trees to two major components of drought: vapor pressure deficit (VPD) and soil water content (SWC), both in pure and mixed stands, in an area where P. sylvestris has been affected by drought-induced mortality [28,30,35] and where this species is being replaced by Q. ilex as the canopy-dominant species [37]. An important aspect of this study is that, unlike much previous work comparing conifers with angiosperms, it compares species with the same leaf habit. We hypothesize that 1) P. sylvestris would close stomata at higher (closer to zero) water potentials than Q. ilex and, therefore, it would experience lower losses of xylem hydraulic conductivity and greater reductions of NSC concentrations during drought, and 2) Q. ilex would suffer higher water stress in pure stands than in mixed ones, limiting the capacity of Q. ilex to become the canopy-dominant species in the long term.

2. Materials and Methods

2.1. Study Site

Measurements were conducted at the Poblet Forest Natural Reserve (Prades Mountains, NE Iberian Peninsula). The climate is typically Mediterranean, with a mean annual precipitation of 664 mm (spring and autumn being the rainiest seasons, and with a marked summer dry period), and moderately warm temperatures (11.3 °C on average) [28].
Most of the studied P. sylvestris and Q. ilex ssp. ilex trees are located in the Tillar Valley (41°19′ N, 1°00′ E; 990–1090 m a.s.l.) on NW- or NE-facing hillsides with very shallow and unstable soil due to the high stoniness and steep slopes (35° on average). The soils are mostly Xerochrepts with fractured schist and clay loam texture, although outcrops of granitic sandy soils are also present. The canopy-dominant tree species at this site is P. sylvestris, while the understory is mainly dominated by Q. ilex trees. Phenologically, both species show similar behavior in the Tillar Valley. In P. sylvestris, stem radial growth starts in mid-April and finishes in June (with maximum growth rates throughout May) [38]. Moreover, leaf flushing starts in May and leaf expansion finishes in June in P. sylvestris [38] and in Q. ilex [39]. Q. ilex in the Prades Mountains does not normally present leaf flushing during autumn [39].
The study area has been affected by severe droughts since the 1990s and drought-induced mortality of P. sylvestris has been reported [35,40]. P. sylvestris average standing mortality and crown defoliation in Tillar Valley are currently 12% and 15%, respectively. In some parts of the forest standing mortality is >20% and cumulative mortality is as high as 50% since the year 2000 [41]. In addition, P. sylvestris recruitment is extremely low and, as a result, Q. ilex is replacing P. sylvestris as the canopy-dominant species in many parts of the valley [37].

2.2. Sampling Scheme

Three different stand types were sampled in the Tillar valley: (1) a pure stand where Q. ilex is the canopy dominant species; (2) a mixed stand where both species grow together (P. sylvestris generally dominating the canopy and Q. ilex dominating the undergrowth but also constituting the main canopy where P. sylvestris mortality patches occur), and (3) a pure P. sylvestris stand located at a more elevated and wetter location without any symptoms of drought-induced mortality. All measurements were carried out on mature trees, and all trees of the same species had a similar height and diameter at breast height (DBH) to minimize unwanted variation (Table 1). The Q. ilex pure stand was <50 m from the mixed stand (both at 1015 m a.s.l.) and the P. sylvestris pure stand was ca. 800 m up the valley (1065 m a.s.l.). Soil depth was ~40 cm on average in mixed and pure Q. ilex stands and deeper (~74 cm) in the pure P. sylvestris stand. The main stand characteristics are summarized in Table 1. Seasonal dynamics of predawn (ΨPD) and midday (ΨMD) leaf water potentials, whole-tree leaf-specific hydraulic conductance (KS–L), stomatal conductance (Gs,md), and percentage loss of xylem embolism (PLC) were measured or estimated on trees from all stand types. These measurements, in combination with a continuous monitoring of the main meteorological variables and soil moisture, were carried out from 2010 until 2013 (Figure S1), and included an exceptionally intense drought in 2011 [28]. Volumetric soil water content (SWC) was measured in the upper 30 cm of soil at each stand using several (N = 3–6) frequency domain reflectometers (CS616, Campbell Scientific Inc., Logan, UT, USA; cf. Poyatos et al. [28]). Meteorological variables, including VPD estimates, were measured in the mixed stand (cf. Poyatos et al. [28]) for additional details) and were assumed to be representative of above-canopy atmospheric conditions for all the stands.
Table 1. Main characteristics (mean ± SE) of the three stands studied in the Tillar valley.
VariableQ. ilex PureMixedP. sylvestris Pure
Stand level
Stem density (stems·ha−1)
P. sylvestris65 (66% def.)257 (41% def.)428
Q. ilex52622913285
Other87242326
TOTAL541434121039
DBH (cm)
P. sylvestris23.60 ± 7.6627.70 ± 3.0832.30 ± 1.38
Q. ilex8.76 ± 0.308.40 ± 0.405.89 ± 0.85
Basal area (m2·ha−1)
P. sylvestris3.44 (96% def.)23.79 (52% def.)41.75
Q. ilex40.6324.860.99
Other0.482.91.65
TOTAL44.5551.5544.39
Leaf area index (m2·m−2)
P. sylvestrisnm0.580.91
Q. ilex4.592.69nm
TOTAL4.593.271.02
Measured trees
AL:AS (m2·cm−2)
P. sylvestrisnm0.076 ± 0.0080.067 ± 0.004
Q. ilex0.167 ± 0.0010.139 ± 0.008nm
DBH (cm)
P. sylvestrisnm38.60 ± 1.8139.90 ± 0.89
Q. ilex12.61 ± 1.0316.21 ± 1.58nm
Height (m)
P. sylvestrisnm14.24 ± 0.7818.3 ± 0.62
Q. ilex~5~5nm
DBH, diameter at breast height; AL:AS, leaf-to-sapwood area ratio at the tree level; nm, not measured; def., percentage of defoliated pines of total P. sylvestris stem density and basal area is indicated in brackets.
Non-structural carbohydrates (NSC) measurements on P. sylvestris were conducted in 2012 on trees from the mixed and pure stands at Tillar Valley (cf. below for specific methods).
The dynamics of NSC in Q. ilex trees were studied, also in 2012, in a nearby area (Torners Valley; 41°21′ N, 1°2′ E; 990 m a.s.l.) within less than 3 km of the sampling area at the Tillar valley. Average DBH for these Q. ilex trees was 19.02 ± 1.99 cm. The two valleys sampled in this study have similar substrate and soil characteristics, but they differ in aspect and vegetation cover. The south-facing orientation at Torners is associated with a lower-statured forest dominated by Q. ilex trees, and accompanied by other drought-tolerant species such as Phillyrea latifolia L. and Arbutus unedo L. Q. ilex trees from this valley, like P. sylvestris in Tillar Valley, have also experienced some episodes of drought-induced decline [36]. Although some of the sampled trees are part of a long-term drought simulation study [39], here we only considered trees sampled outside the experimental area or in the control stands.
Only non-defoliated P.sylvestris and Q. ilex trees were chosen for this study. All studied variables and the years of each measurement are summarized in Table 2. The detailed methodologies used to measure each variable are described in Poyatos et al. [28], Rosas et al. [42], and Aguadé et al. [30] and are summarized in the following sections. The trees included in this study partially overlap with those included in the previous references, although we also include unpublished measurements for pure stands of P. sylvestris and for Q. ilex trees in the Tillar Valley.
Table 2. Main variables reported in this study.
SpeciesValleyStand typeΨGsKS–LNSCPLC
Pinus sylvestrisTillarMixed8 [2010–2012] 111 [2010–2013] 18 [2010–2012] 110 [2012] 28 [2010–2012] 4
Quercus ilexTillarMixed5 [2010–2011] 410 [2010–2013] 45 [2010–2011] 4 5 [2010–2011] 4
Pinus sylvestrisTillarPure4 [2010–2011] 410 [2010–2011] 44 [2010–2011] 410 [2012] 24 [2010–2011] 4
Quercus ilexTillarPure4 [2010–2011] 410 [2010–2011] 44 [2010–2011] 4 4 [2010–2011] 4
Quercus ilexTornersPure 19 [2012] 3
Ψ, water potential; Gs,md, stomatal conductance; KS–L, whole-tree leaf-specific conductance; NSC, non-structural carbohydrates; PLC, percentage loss of hydraulic conductivity due to xylem embolism. Number of trees sampled for each variable and years of measurements (in brackets) are provided for each combination of species, valley and stand type. Exponent numbers indicate references where data were gathered from: 1, [28]; 2, [30]; 3, [41]; 4, this study.

2.3. Water Potential Measurements

Predawn (ΨPD, MPa; just before sunrise, 03:00 h–05:00 h, solar time) and midday (ΨMD, MPa; 11:00 h–13:00 h, solar time) leaf water potentials were measured monthly in 12 P. sylvestris and nine Q. ilex trees from Tillar Valley, from June to November in different years (Table 2). On each sampling time, a sun-exposed twig from each tree was excised using a pruning pole and stored immediately inside a plastic bag with a moist paper towel to avoid water loss until measurement time, typically within 2 h of sampling. Leaf water potentials were measured using a pressure chamber (PMS Instruments, Corvallis, OR, USA).
We also calculated the water potential difference (ΔΨ) between predawn and midday measurements in each tree, as an indicator of the driving force for transpiration.

2.4. Sap Flow and Canopy Stomatal Conductance

Continuous measurements (at 15-min intervals) of sap flow density were conducted since the end of April 2010 and throughout the study period (Table 2) on 11 P. sylvestris and 10 Q. ilex trees from the mixed stand and 10 trees of both species from the pure stand (Table 2) in Tillar Valley using constant heat dissipation sensors. The sensors consisted of a pair of stainless steel needles, each of them containing a copper-constantan thermocouple at the middle. These probes were inserted radially at breast height into the xylem after removing the bark, and covered with a reflective material to avoid solar radiation. Two sensors (on the north- and south-facing sides of the trunk) with two cm long needles were placed in each P. sylvestris tree, and only one sensor with one cm long needles (north-facing side) were placed in Q. ilex trees due to their smaller diameters. Since sap flow is not uniform throughout the xylem, sap flow measurements made using single-point sensors installed in the outer sapwood were integrated to the entire xylem depth using measured radial profiles of sap flow. We obtained these radial profiles by measuring the sap flow at six depths in the xylem using the heat field deformation (HFD) method in three P. sylvestris and Q. ilex trees, over at least seven days per tree. This sap flow per unit of sapwood area was also expressed on a leaf area basis after calculation of tree leaf area using site-specific allometries for P. sylvestris [28] and Q. ilex [43] and accounting for seasonal variations of leaf area for each species [28,39]. More information about this experimental design, measurements, and scaling of sap flow to the tree level can be found in Poyatos et al. [28].
Midday canopy stomatal conductance (Gs,md, mm·s−1) was calculated for all trees with sap flow sensors (Table 2), using midday (averaged between 11:00 h. and 14:00 h, thus minimizing capacitance effects) measurements of sap flow per unit leaf area (JL,md, kg·m−2·s−1) and the simplified Penman–Monteith equation for aerodynamically rough canopies:
G s , m d =   γ · λ · J L , md ρ · c P · VPD md
Here γ is the psychrometric constant (kPa K−1), λ is the latent heat of vaporization of water (J·kg−1), ρ is the air density (kg·m−3), cp is the specific heat air at constant pressure (J·kg−1·K−1), and VPDmd is the midday vapor pressure deficit (kPa). Measurements obtained under conditions where VPDmd < 0.1 kPa were filtered out [44].

2.5. Whole-Tree Leaf-Specific Hydraulic Conductance

We also used JL,md and Ψ measurements to calculate whole-tree leaf-specific hydraulic conductance (kS–L, kg·m−2·MPa−1·s−1), assuming that trees had reached equilibrium with the soil during the night, and that ΨPD represents an estimate of soil water potential [45]. The following equation was used:
k S L =   J L , md Ψ PD Ψ md
In our analysis of kS–L responses to SWC and VPD we only considered kS–L values estimated for the spring and summer seasons (drought progression; cf. Figure S1), as autumn values were shown not to recover even after substantial rainfall and despite relatively high SWC [28].

2.6. Percentage Loss of Hydraulic Conductivity

An estimate of the percentage loss of conductivity (PLC) due to xylem embolism was calculated in those P. sylvestris and Q. ilex trees for which leaf water potentials had been measured (Table 2), using the following function [46]:
PLC =   100 1 + exp ( a ( P P 50 ) )
In this equation, PLC is the percentage loss of hydraulic conductivity, P the applied pressure, P50 the pressure causing 50% PLC, and a is related to the slope of the vulnerability curve. P50 and a values were obtained from vulnerability curves established on roots and branches using the dehydration (Q. ilex; [47]) and air-injection methods (P. sylvestris; [30]) for individuals from the same populations studied here. Values of P to estimate PLC were obtained from measured water potentials (ΨMD for branch PLC and ΨPD for root PLC). All sampling methods and vulnerability curve measurements are detailed in Aguadé et al. [30] and Martínez-Vilalta et al. [47]. Since there is controversy regarding the best method for establishing vulnerability curves, particularly for species with long vessels such as Q. ilex, we also estimated PLC using the vulnerability curve coefficients (a and P50) estimated in another study comparing several methods to establish vulnerability curves in Q. ilex [48], which obtained higher embolism resistance than the study cited above [47] that was conducted at our study site.

2.7. Non-Structural Carbohydrates

Twenty non-defoliated P. sylvestris trees (10 from mixed and 10 from pure stands) from the Tillar Valley and 19 Q. ilex trees from the Torners valley (Table 2) were selected for NSC measurements. Q. ilex trees from the mixed stand were not sampled for NSC measurements. In this study we only consider measurements taken before the onset of the summer drought (June) and at the peak of the dry period (August). For P. sylvestris, we sampled leaves, branches, and roots and for Q. ilex we sampled leaves, branches, and lignotuber (Table 1). P. sylvestris roots and Q. ilex lignotuber were considered “belowground organs” in all analyses and stands of NSC data. Field and laboratory methods were identical in all cases; more detailed information of sampling design and NSC analyses can be found in Aguadé et al. [30] and Rosas et al. [42]. Total non-structural carbohydrates (TNSC) were considered as including free sugars (glucose and fructose); sucrose and starch and were analyzed following the procedures described by Hoch et al. [49] with some minor variations [31]. Determination of soluble sugars (glucose, fructose, and sucrose) was carried out by an extraction of 12–14 mg of sample powder with 1.6 ml distilled water; after centrifugation, an aliquot of the extract was used for the determination of soluble sugars by enzymatic conversion of fructose and sucrose into glucose (invertase from Saccharomyces cerevisae Meyen ex E.C. Hansen, Sigma-Aldrich, Madrid, Spain) and glucose hexokinase (GHK assay reagent, I4504 and G3293, Sigma-Aldrich, Madrid, Spain). Another aliquot was incubated with an amyloglucosidase from Aspergillus niger van Tieghem at 50 °C overnight, to break down all NSC (starch included) to glucose and then determined photometrically. Starch was calculated as total NSC minus low-molecular-weight sugars. All NSC values are expressed as percent dry matter.
In order to focus on the summer changes of NSC and starch during drought we only considered the differences of the concentrations between August and June in this study. This difference was calculated in two ways: as the absolute change (ΔNSCAug−Jun and ΔStarchAug−Jun) or as the change relative to the initial (June) concentration (ΔNSCAug−Jun,rel and ΔStarchAug−Jun,rel). These variables are likely to reflect both drought- and phenology-driven changes in NSC, but phenological effects are likely to be minimized because shoot and stem radial growth is already complete by the end of June (see Section 2.1).

2.8. Data Analysis

We used the R Statistical Software version 3.0.2 (R Core Team 2013) for all statistical analyses. We performed linear mixed-effects models to test the differences between species (P. sylvestris and Q. ilex) and stand types (mixed or pure) in physiological response variables (ΨMD, ΨPD, ΔΨ, KS–L, PLC) to either SWC or VPD. For each physiological variable, separate models were fitted for SWC and VPD responses. Tree identity was included in all models as a random factor. PLC was log-transformed to achieve normality prior to all analyses. SWC was also log-transformed in some models (ΨMD, ΨPD and PLC) to better capture the functional relationship with the response variable. VPD was log-transformed in the PLC model for the same reason. To better represent the relationship between ΔΨ and SWC, we used a quadratic function. Linear mixed models were also used to assess differences in summer NSC variation as a function of species, organ (leaves, branches, and belowground) and stand type (as fixed effects). As before, tree identity was included as a random factor. Four models were fitted, one for each NSC-related variable (ΔNSCAug−Jun, ΔStarchAug−Jun, ΔNSCAug−Jun,rel, and ΔStarchAug−Jun,rel).
In all cases, we started by fitting the most complex, biologically plausible model (including all three-order interactions for ΨMD, ΨPD, ΔΨ, KS–L, and PLC models; and species x organ, and organ x stand type in models of NSC-related variables) using the “lme” function. This model was compared with all the simpler, alternative models resulting from different combinations of explanatory variables (multimodel inference) using the “dredge” function (“MuMIn” package). The corrected Akaike information criterion (AICc) was used to select the best fitting model. Models within 2 AICc units of the best fitting model (lowest AICc) were considered equivalent in terms of fit and the simplest one (i.e., that with a lower number of fitted coefficients) was selected. The R2 of the best-fitting model was calculated by using the “r.squaredGLMM” function.
In order to analyze the nonlinear responses of Gs,md to VPD and SWC, we first filtered out the values of Gs,md measured under low radiation (Solar radiation < 200 W·m−2). As the corresponding bivariate relationships still showed a large scatter, indicating situations in which Gs,md was co-limited by VPD and SWC, we used separate quantile regressions (95th percentile) between Gs,md and log-transformed VPD and SWC to characterize the upper boundary of the relationships. Quantile regressions were fitted using the “rq” function (“quantreg” package). Differences across species and stand types were examined by plotting the 95% confidence intervals around the regression lines and comparing 95% confidence intervals of the obtained parameters (Table S1).

3. Results

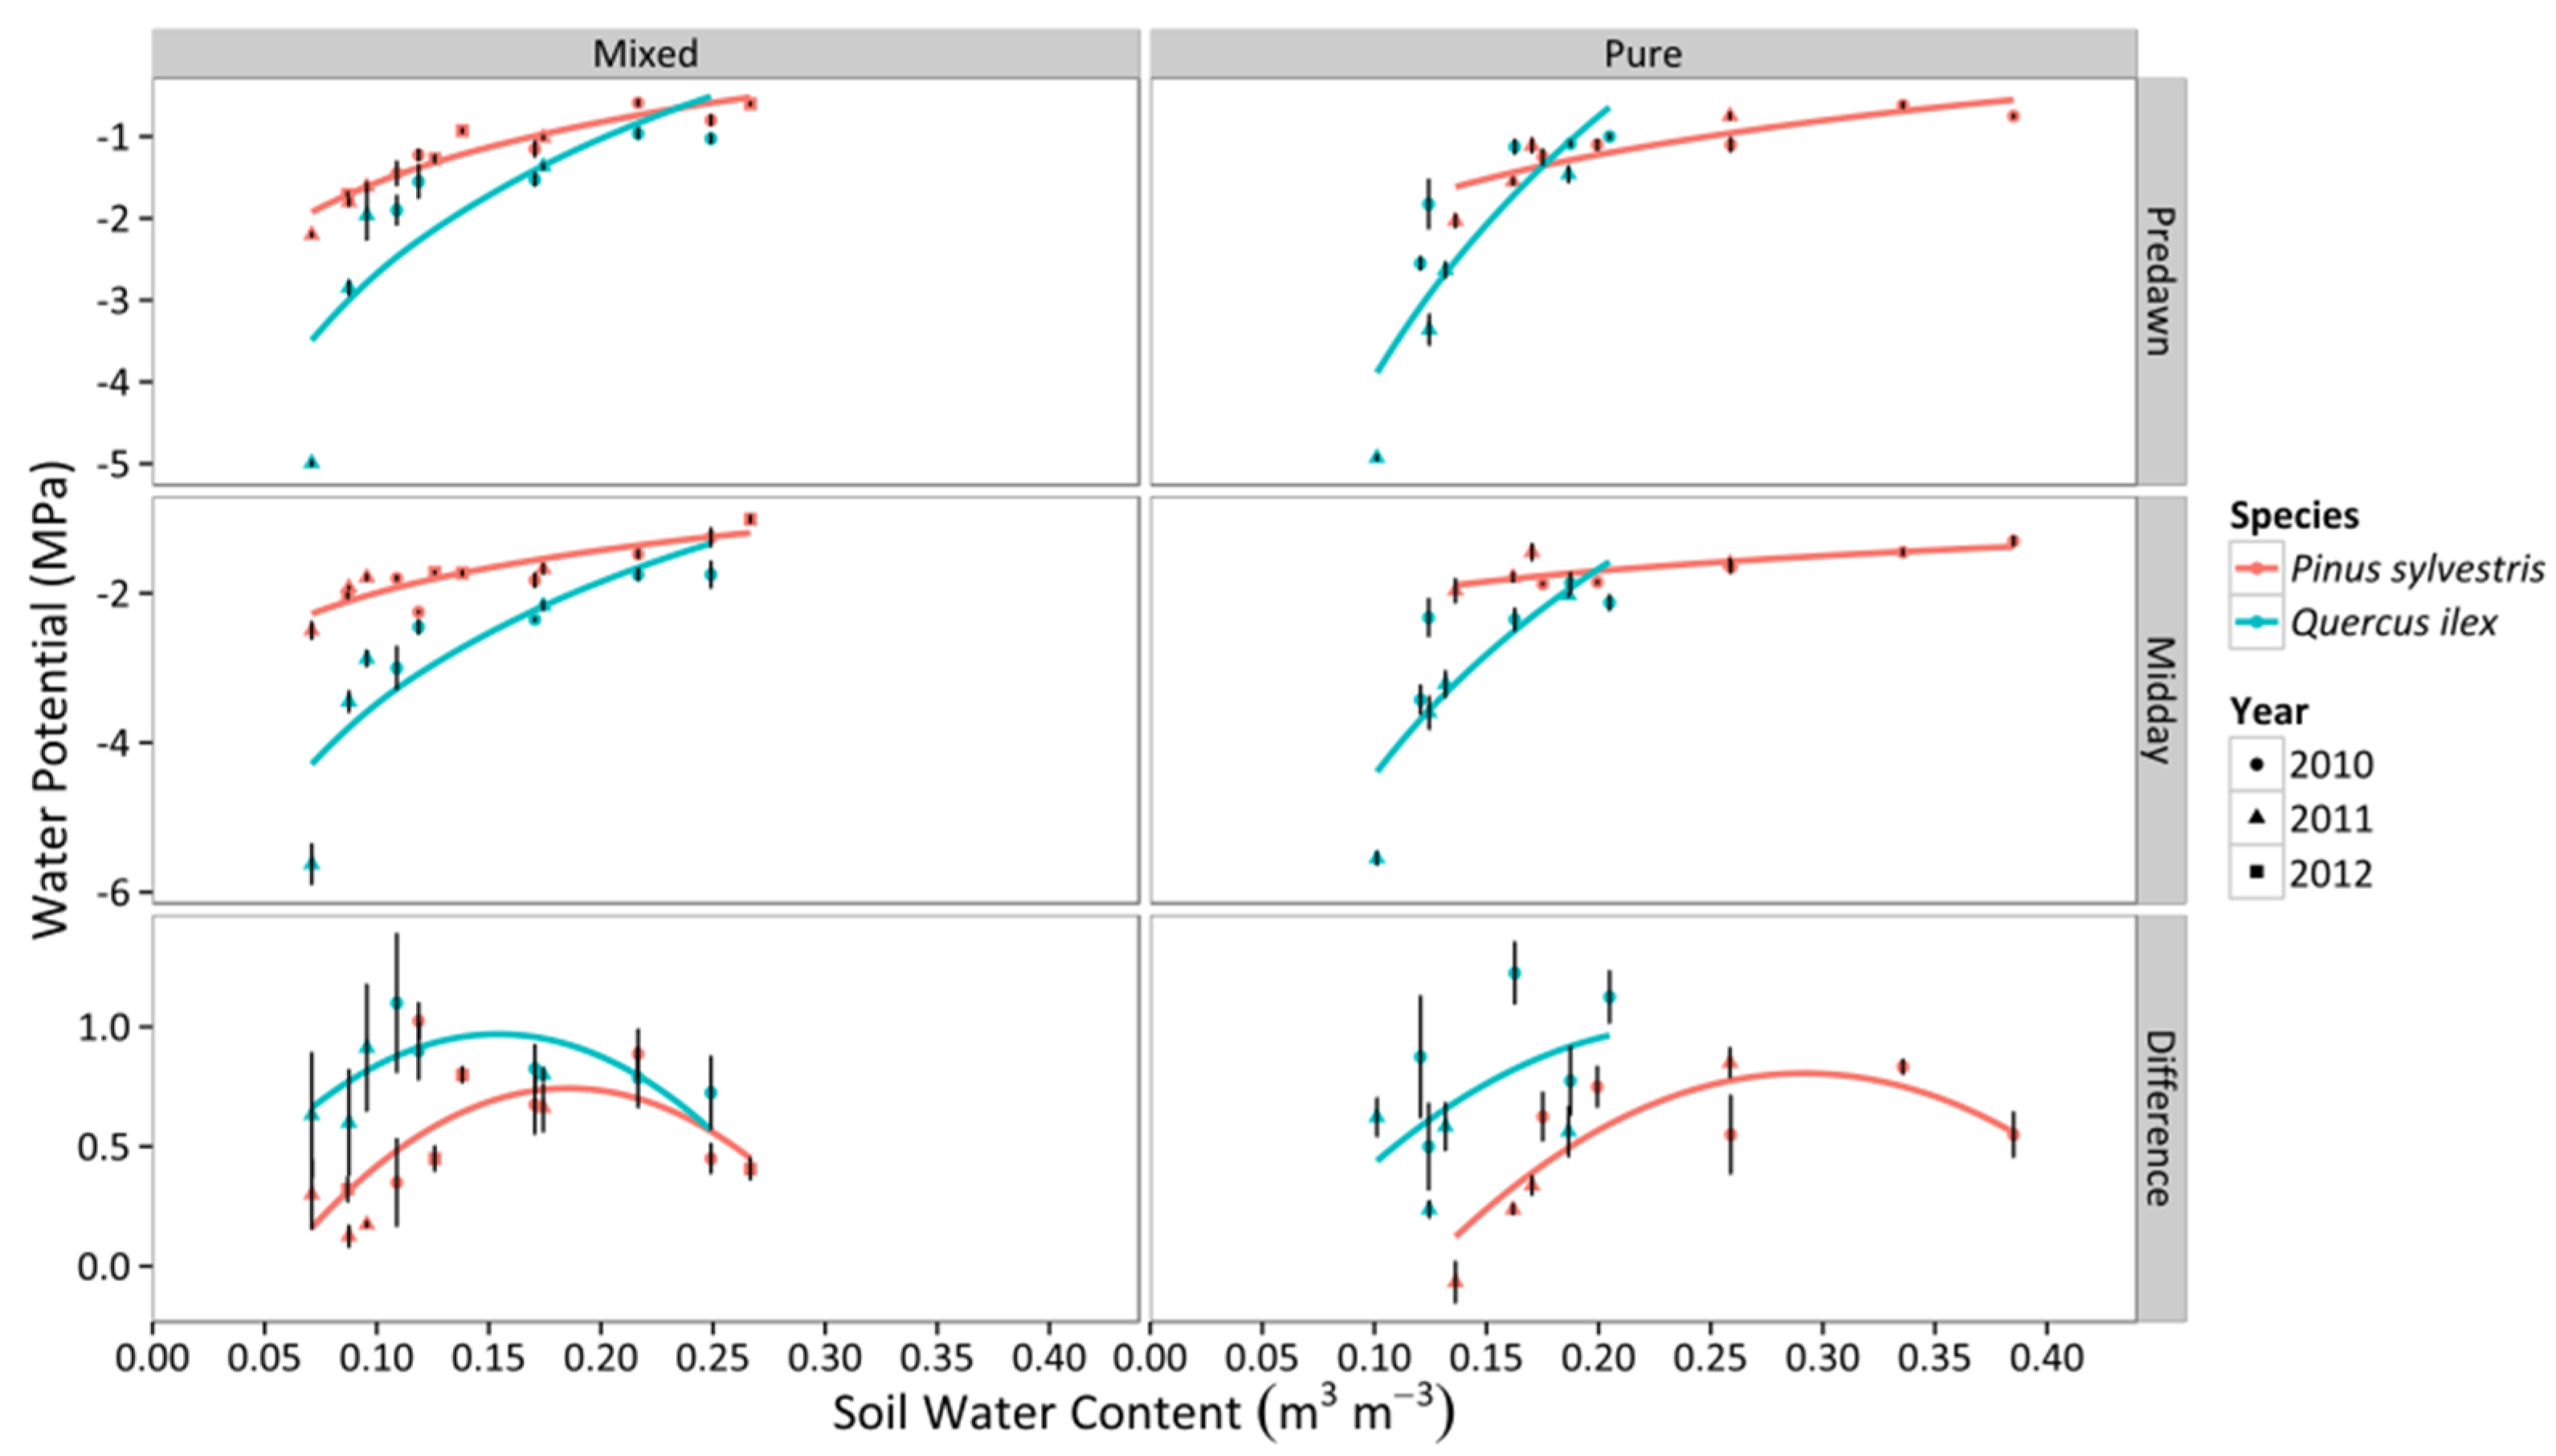
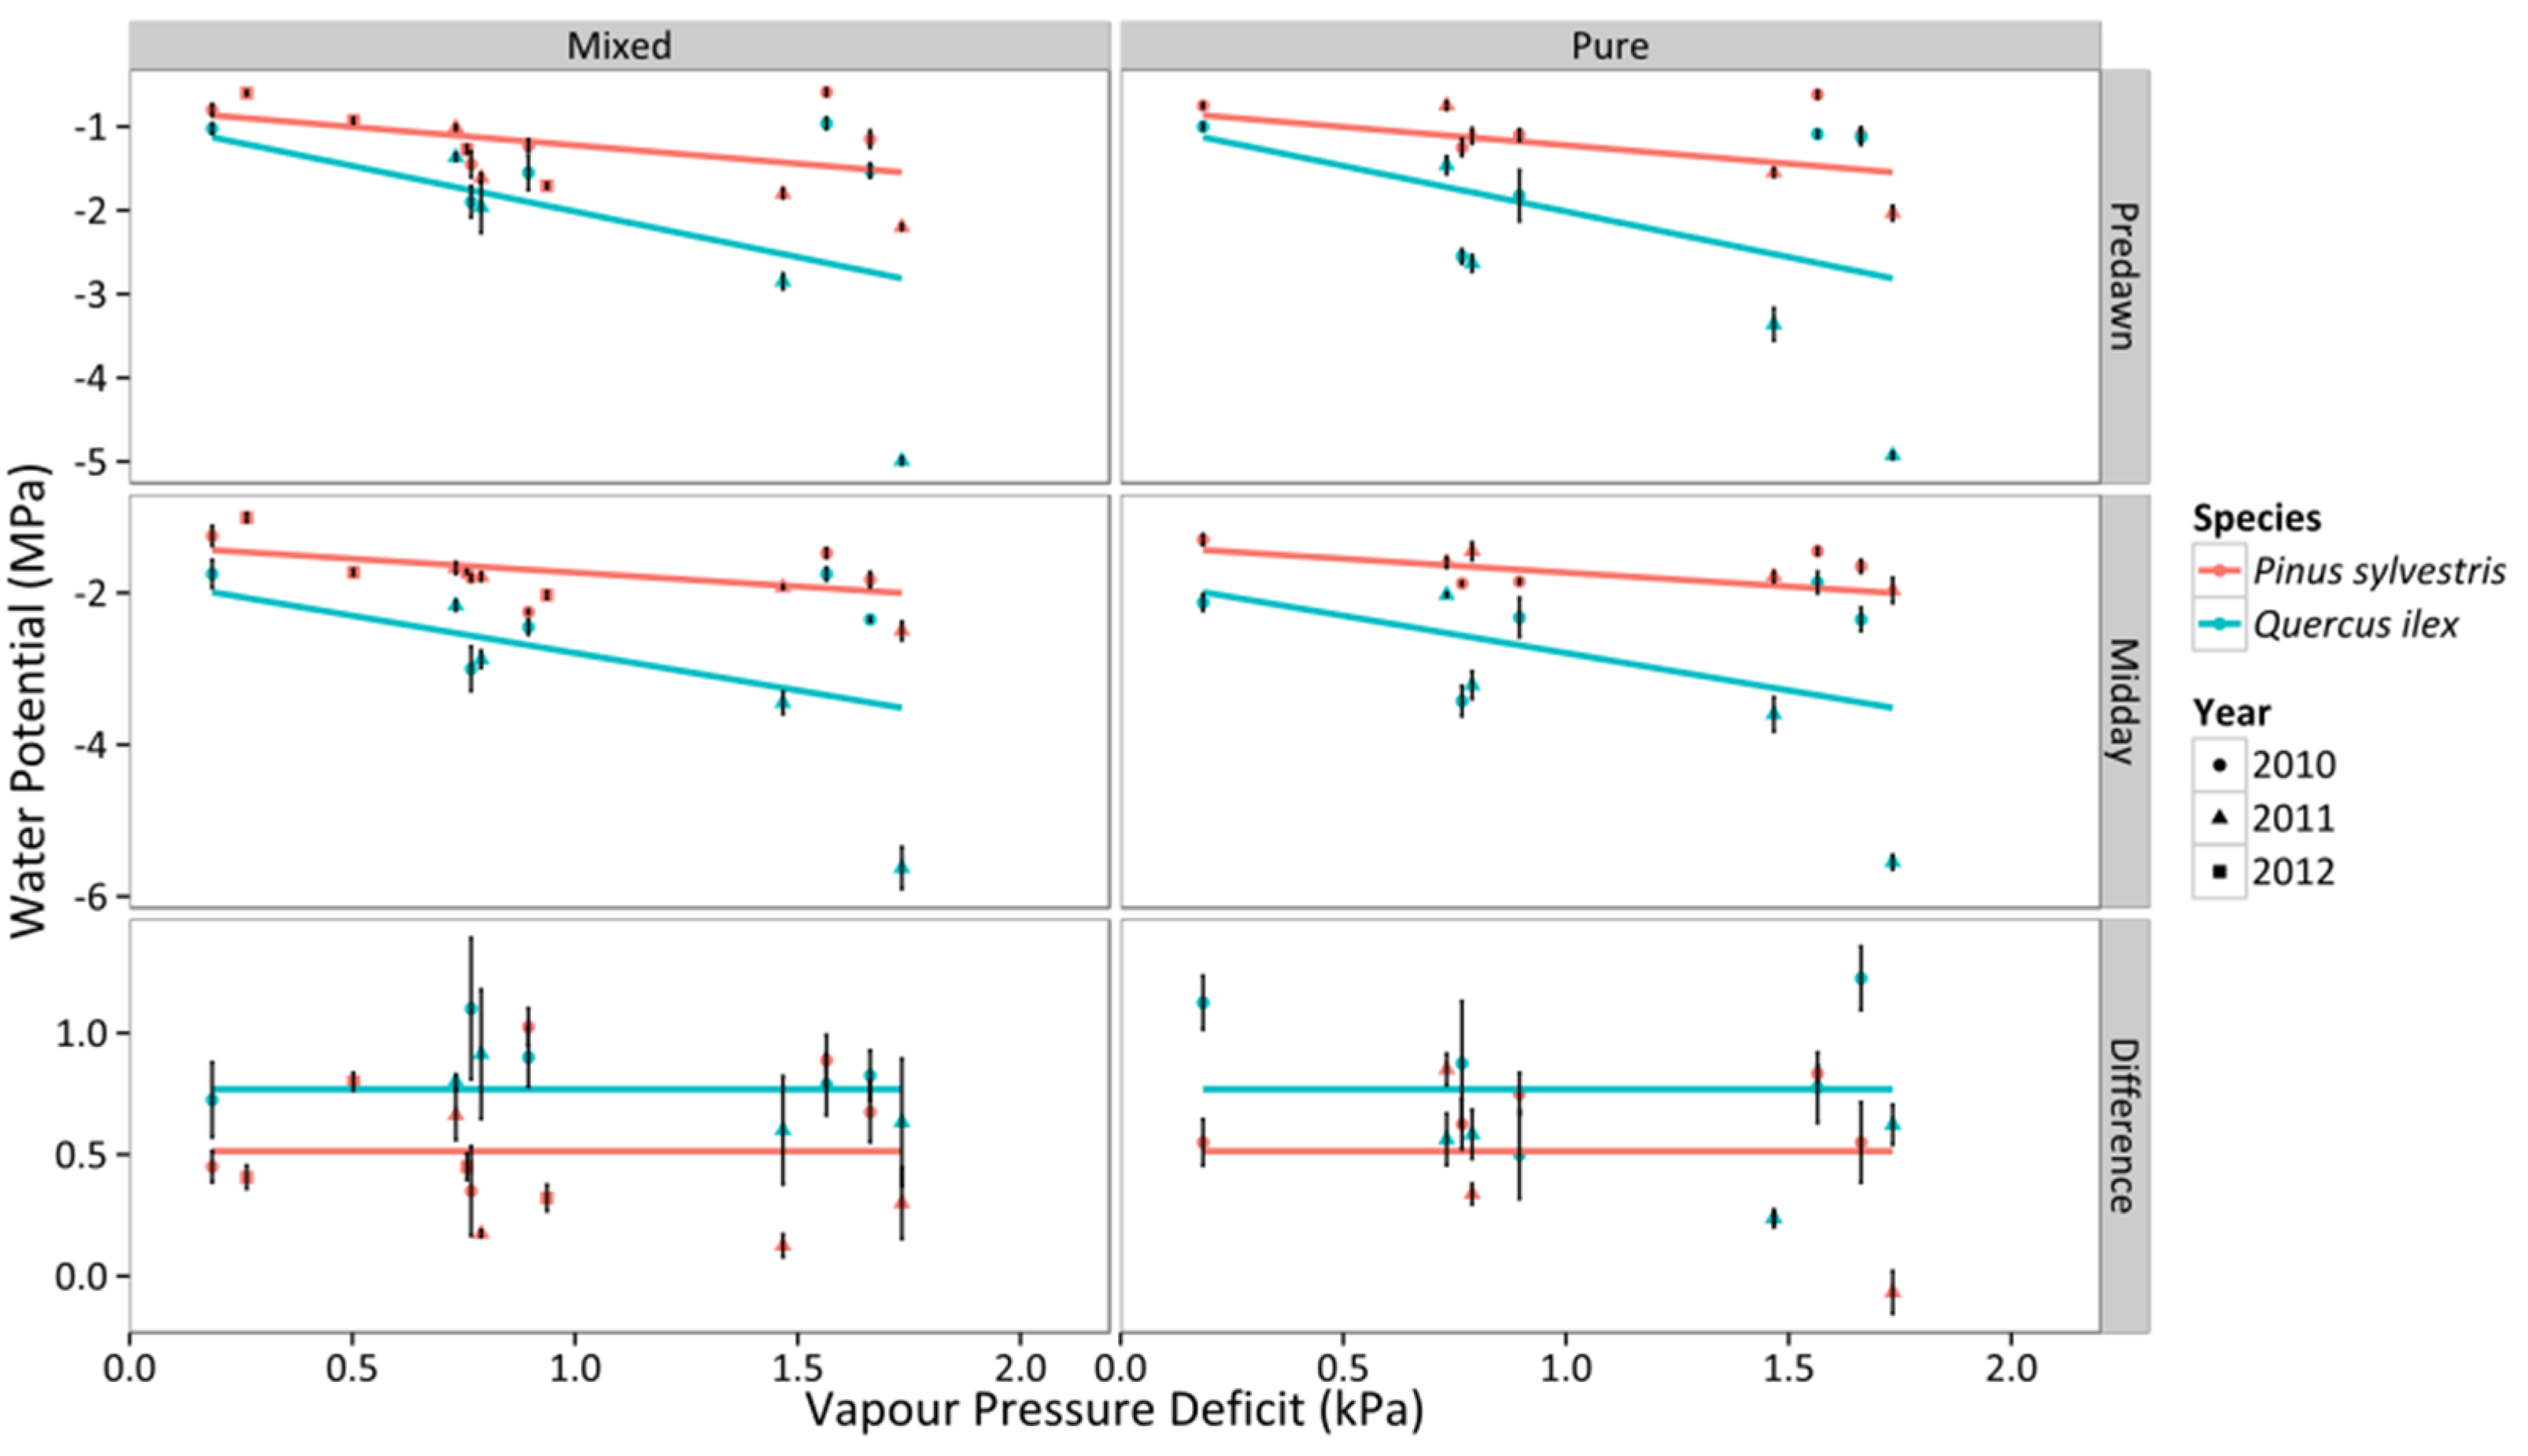
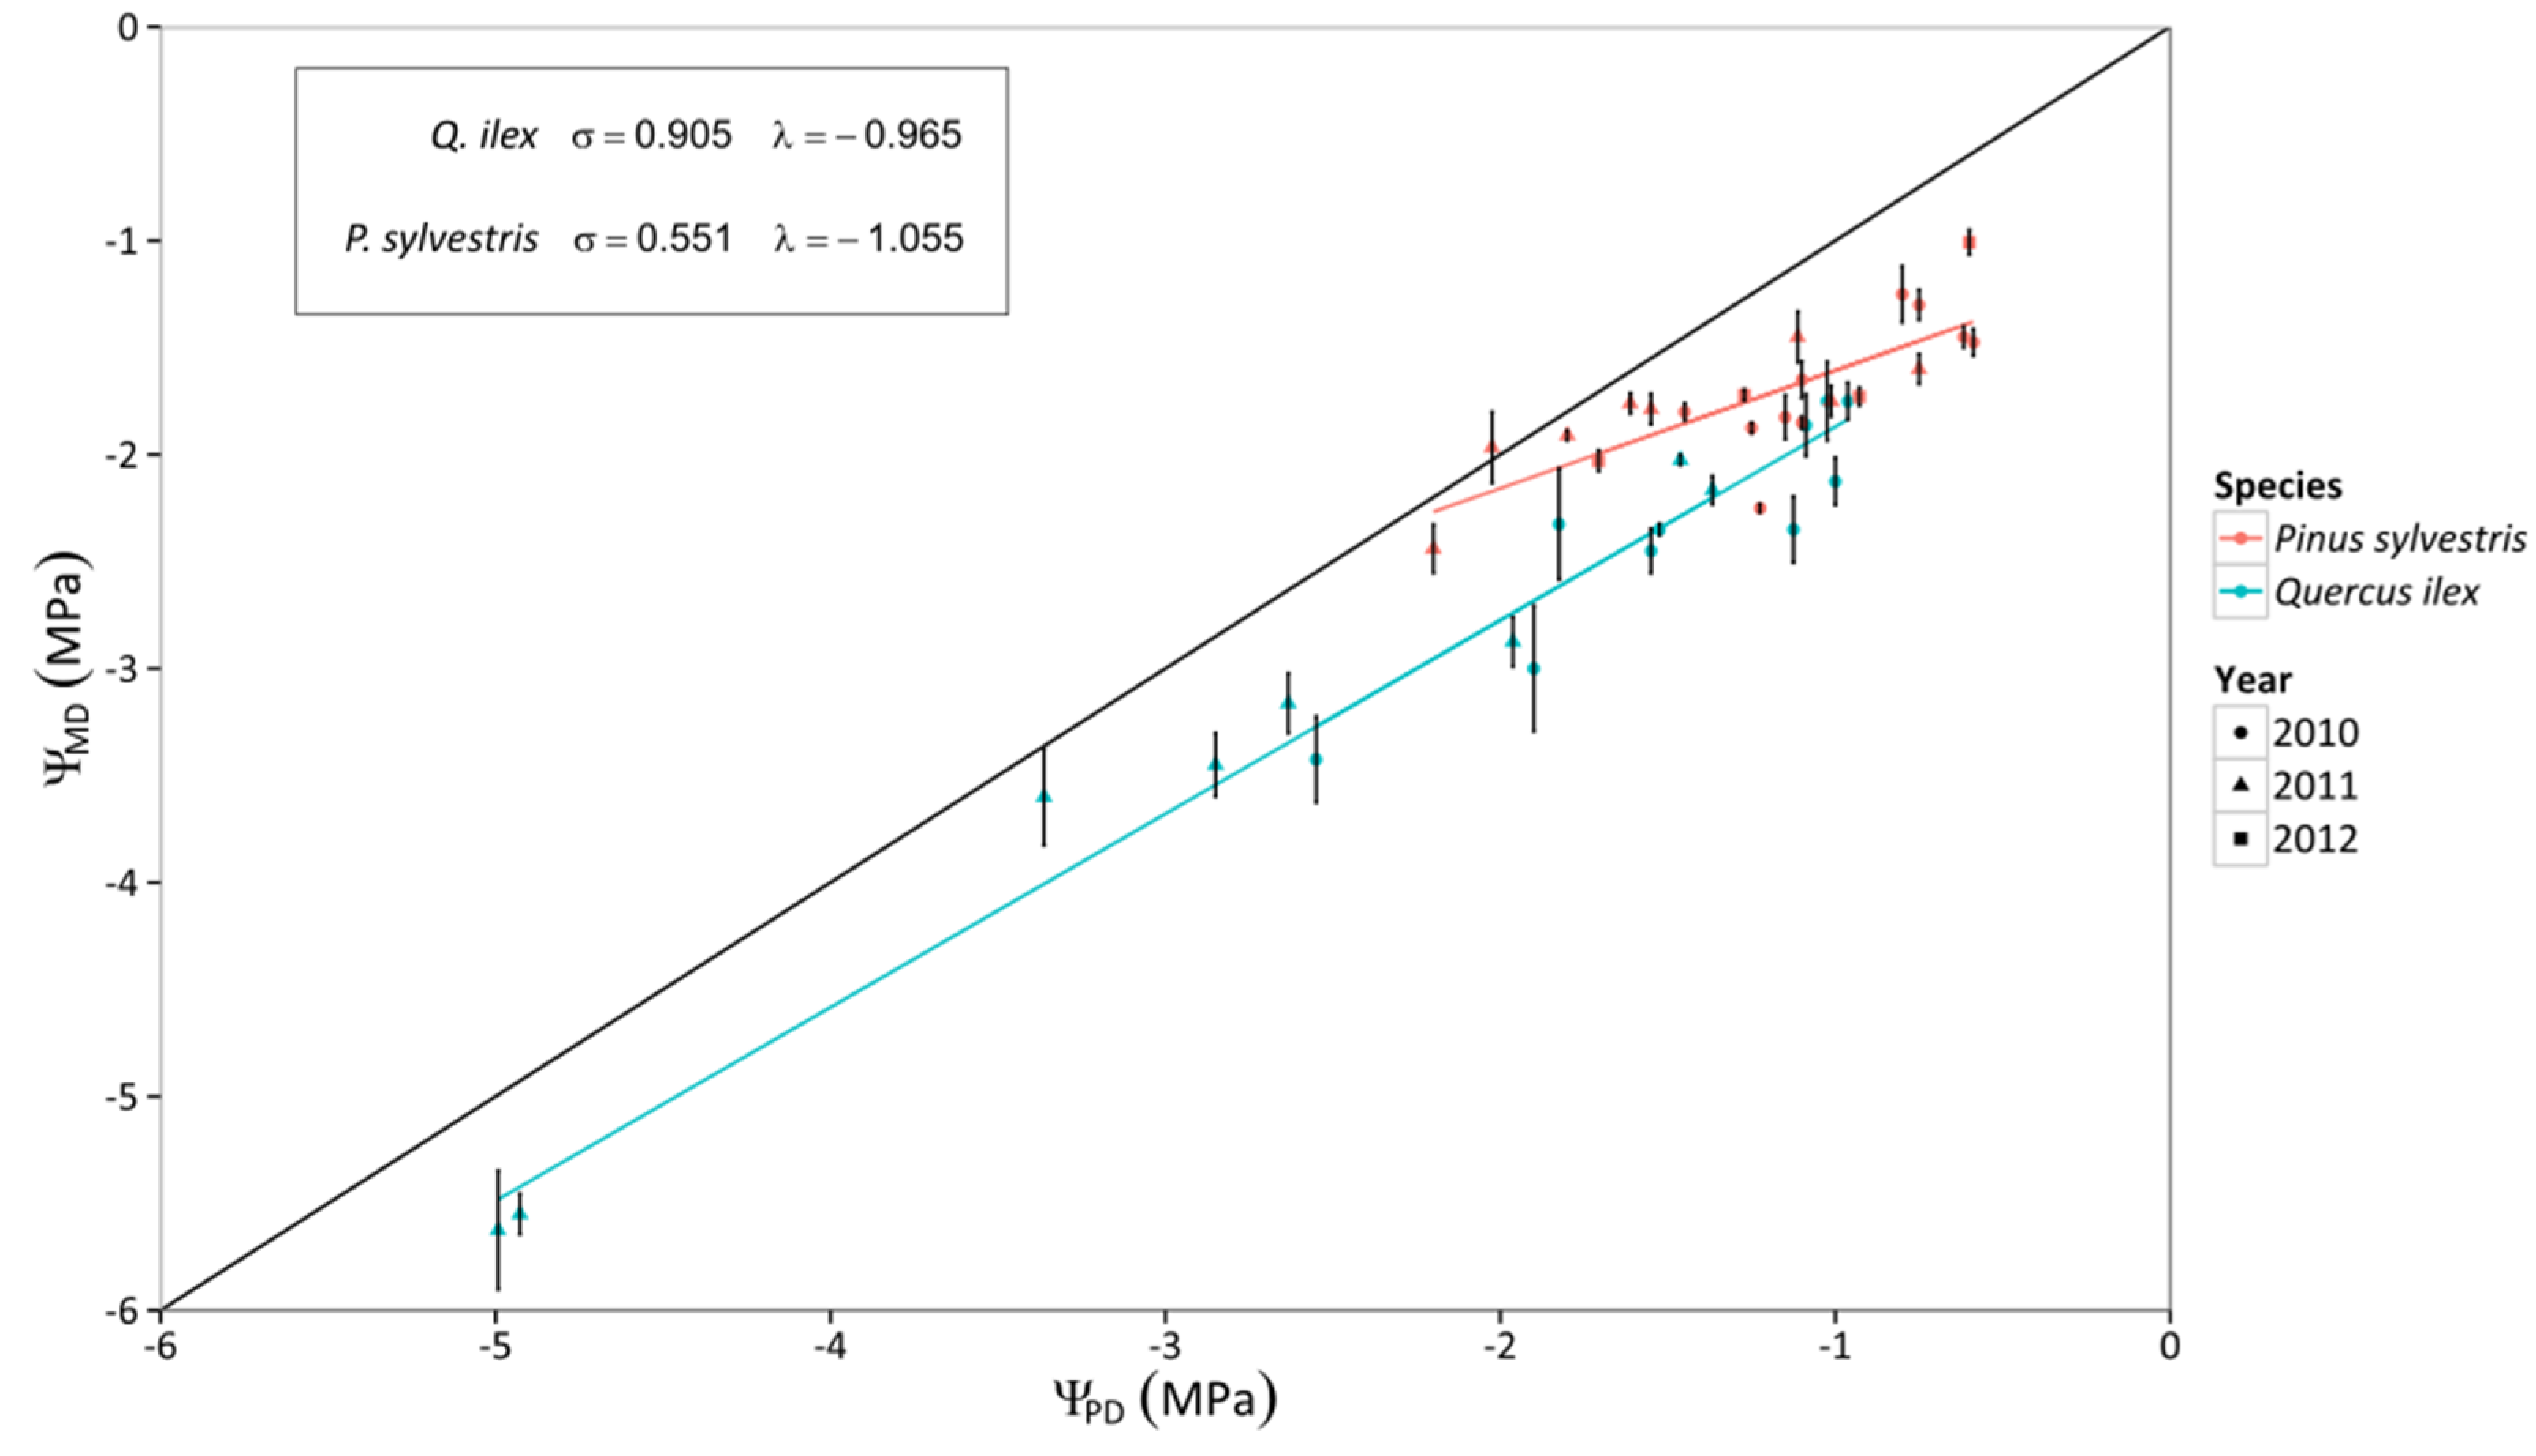
3.1. Leaf Water Potential

The range of SWC differed across stands, with the pure P. sylvestris stand reaching the highest values, and the mixed stand the lowest ones (Figure 1). Both ΨPD and ΨMD reached more negative values with reductions of SWC and with increasing VPD, whereas ΔΨ peaked at intermediate SWC values and was unrelated to VPD (Figure 1 and Figure 2). The response of ΨPD, ΨMD, and ΔΨ to SWC varied between stand types and between species within each stand type (Figure 1, Table S2). Q. ilex trees achieved more negative water potentials and higher ΔΨ during water stress in both stand types, but particularly so in pure stands.
Figure 1. Responses of ΨPD, ΨMD, and ΔΨ to daytime averages of SWC in two different stand types throughout three consecutive years. Average values for P. sylvestris and Q. ilex trees for a given sampling are shown. Error bars indicate ±1 SE. The regressions for the different combinations of species and stand type according to best-fitting models are also depicted (cf. Table S2).
Forests 06 02505 g001
Figure 2. Responses of ΨPD, ΨMD, and ΔΨ to daytime averages of VPD in two different stand types throughout three consecutive years. Average values for P. sylvestris and Q. ilex trees for a given sampling period are shown. Error bars indicate ±1 SE. The regressions for the different combinations of species and stand type according to best-fitting models are also depicted (cf. Table S2).
Forests 06 02505 g002
Regarding the relationship between Ψ and VPD, no statistical difference was found between mixed and pure stands, but there were statistical differences between species (Figure 2, Table S2), with stronger reduction of ΨPD and ΨMD with VPD in Q. ilex. The variation of ΨMD with declining ΨPD confirmed that P. sylvestris trees presented a more isohydric behavior (i.e. shallower slope of the linear relationship between ΨPD and ΨMD) than Q. ilex trees (Figure 3). Interestingly, the slope of the relationship between ΨPD and ΨMD(σ) was very close to 1 in Q. ilex, suggesting an anisohydric behavior.

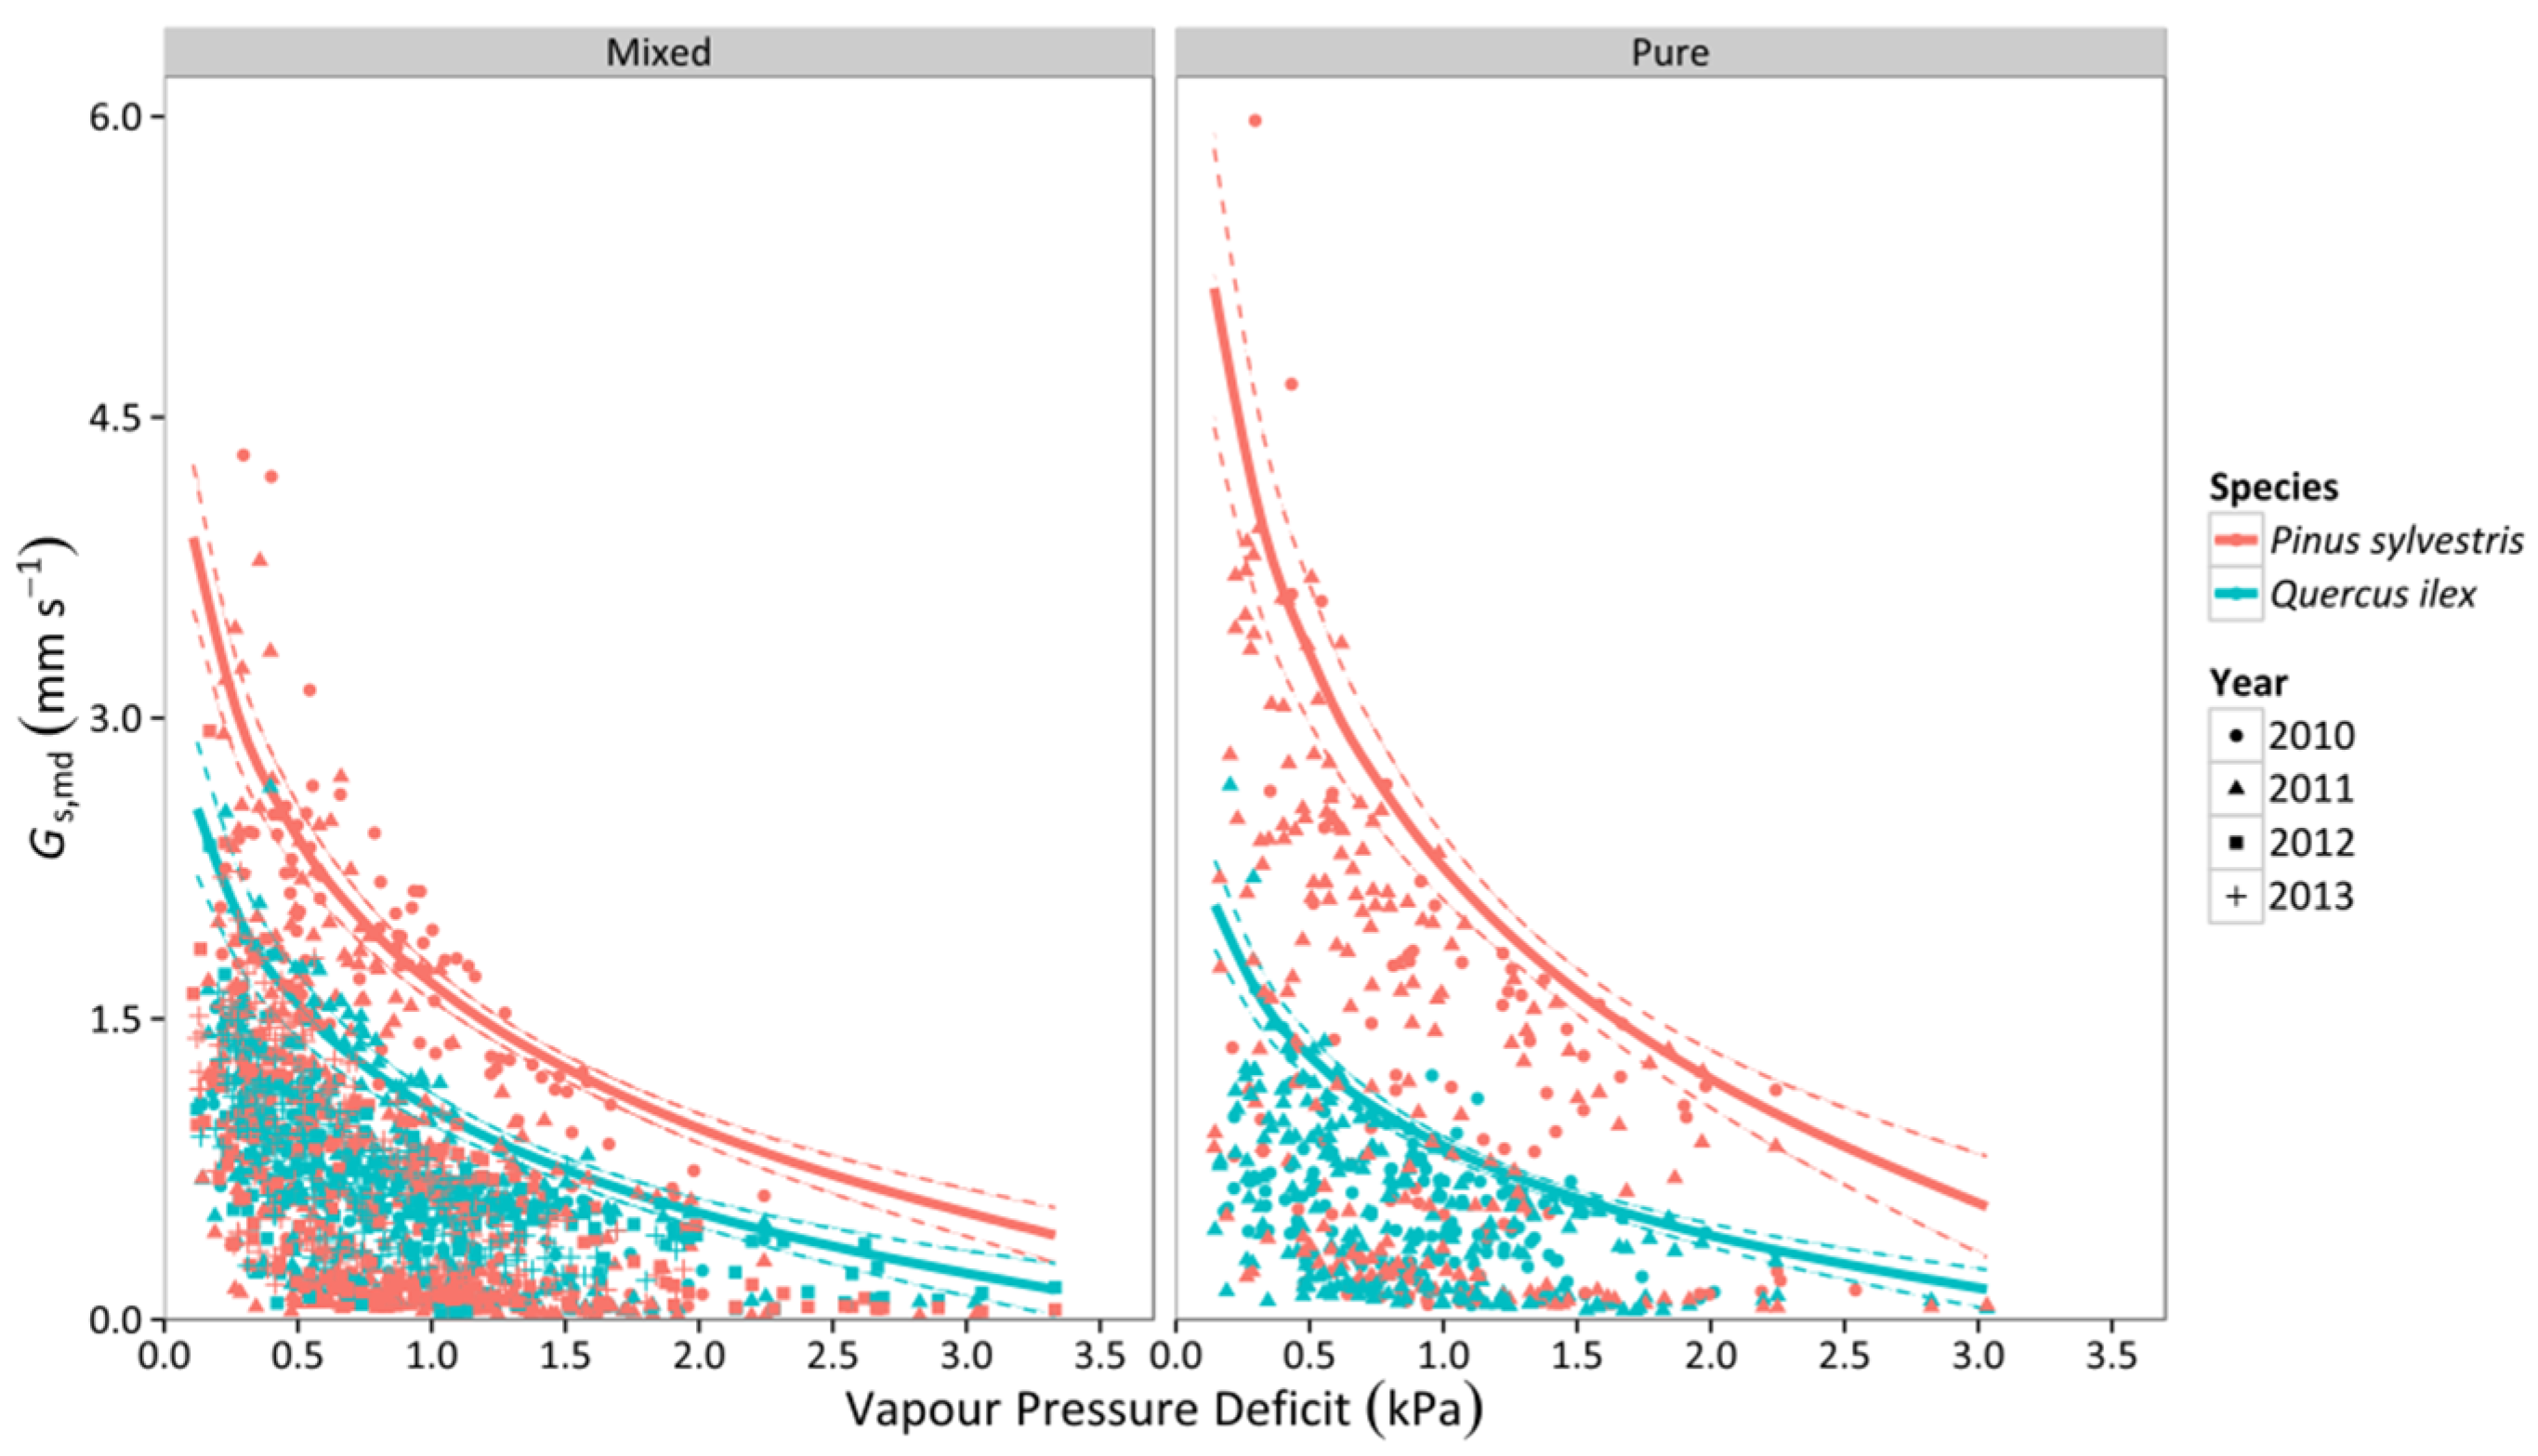
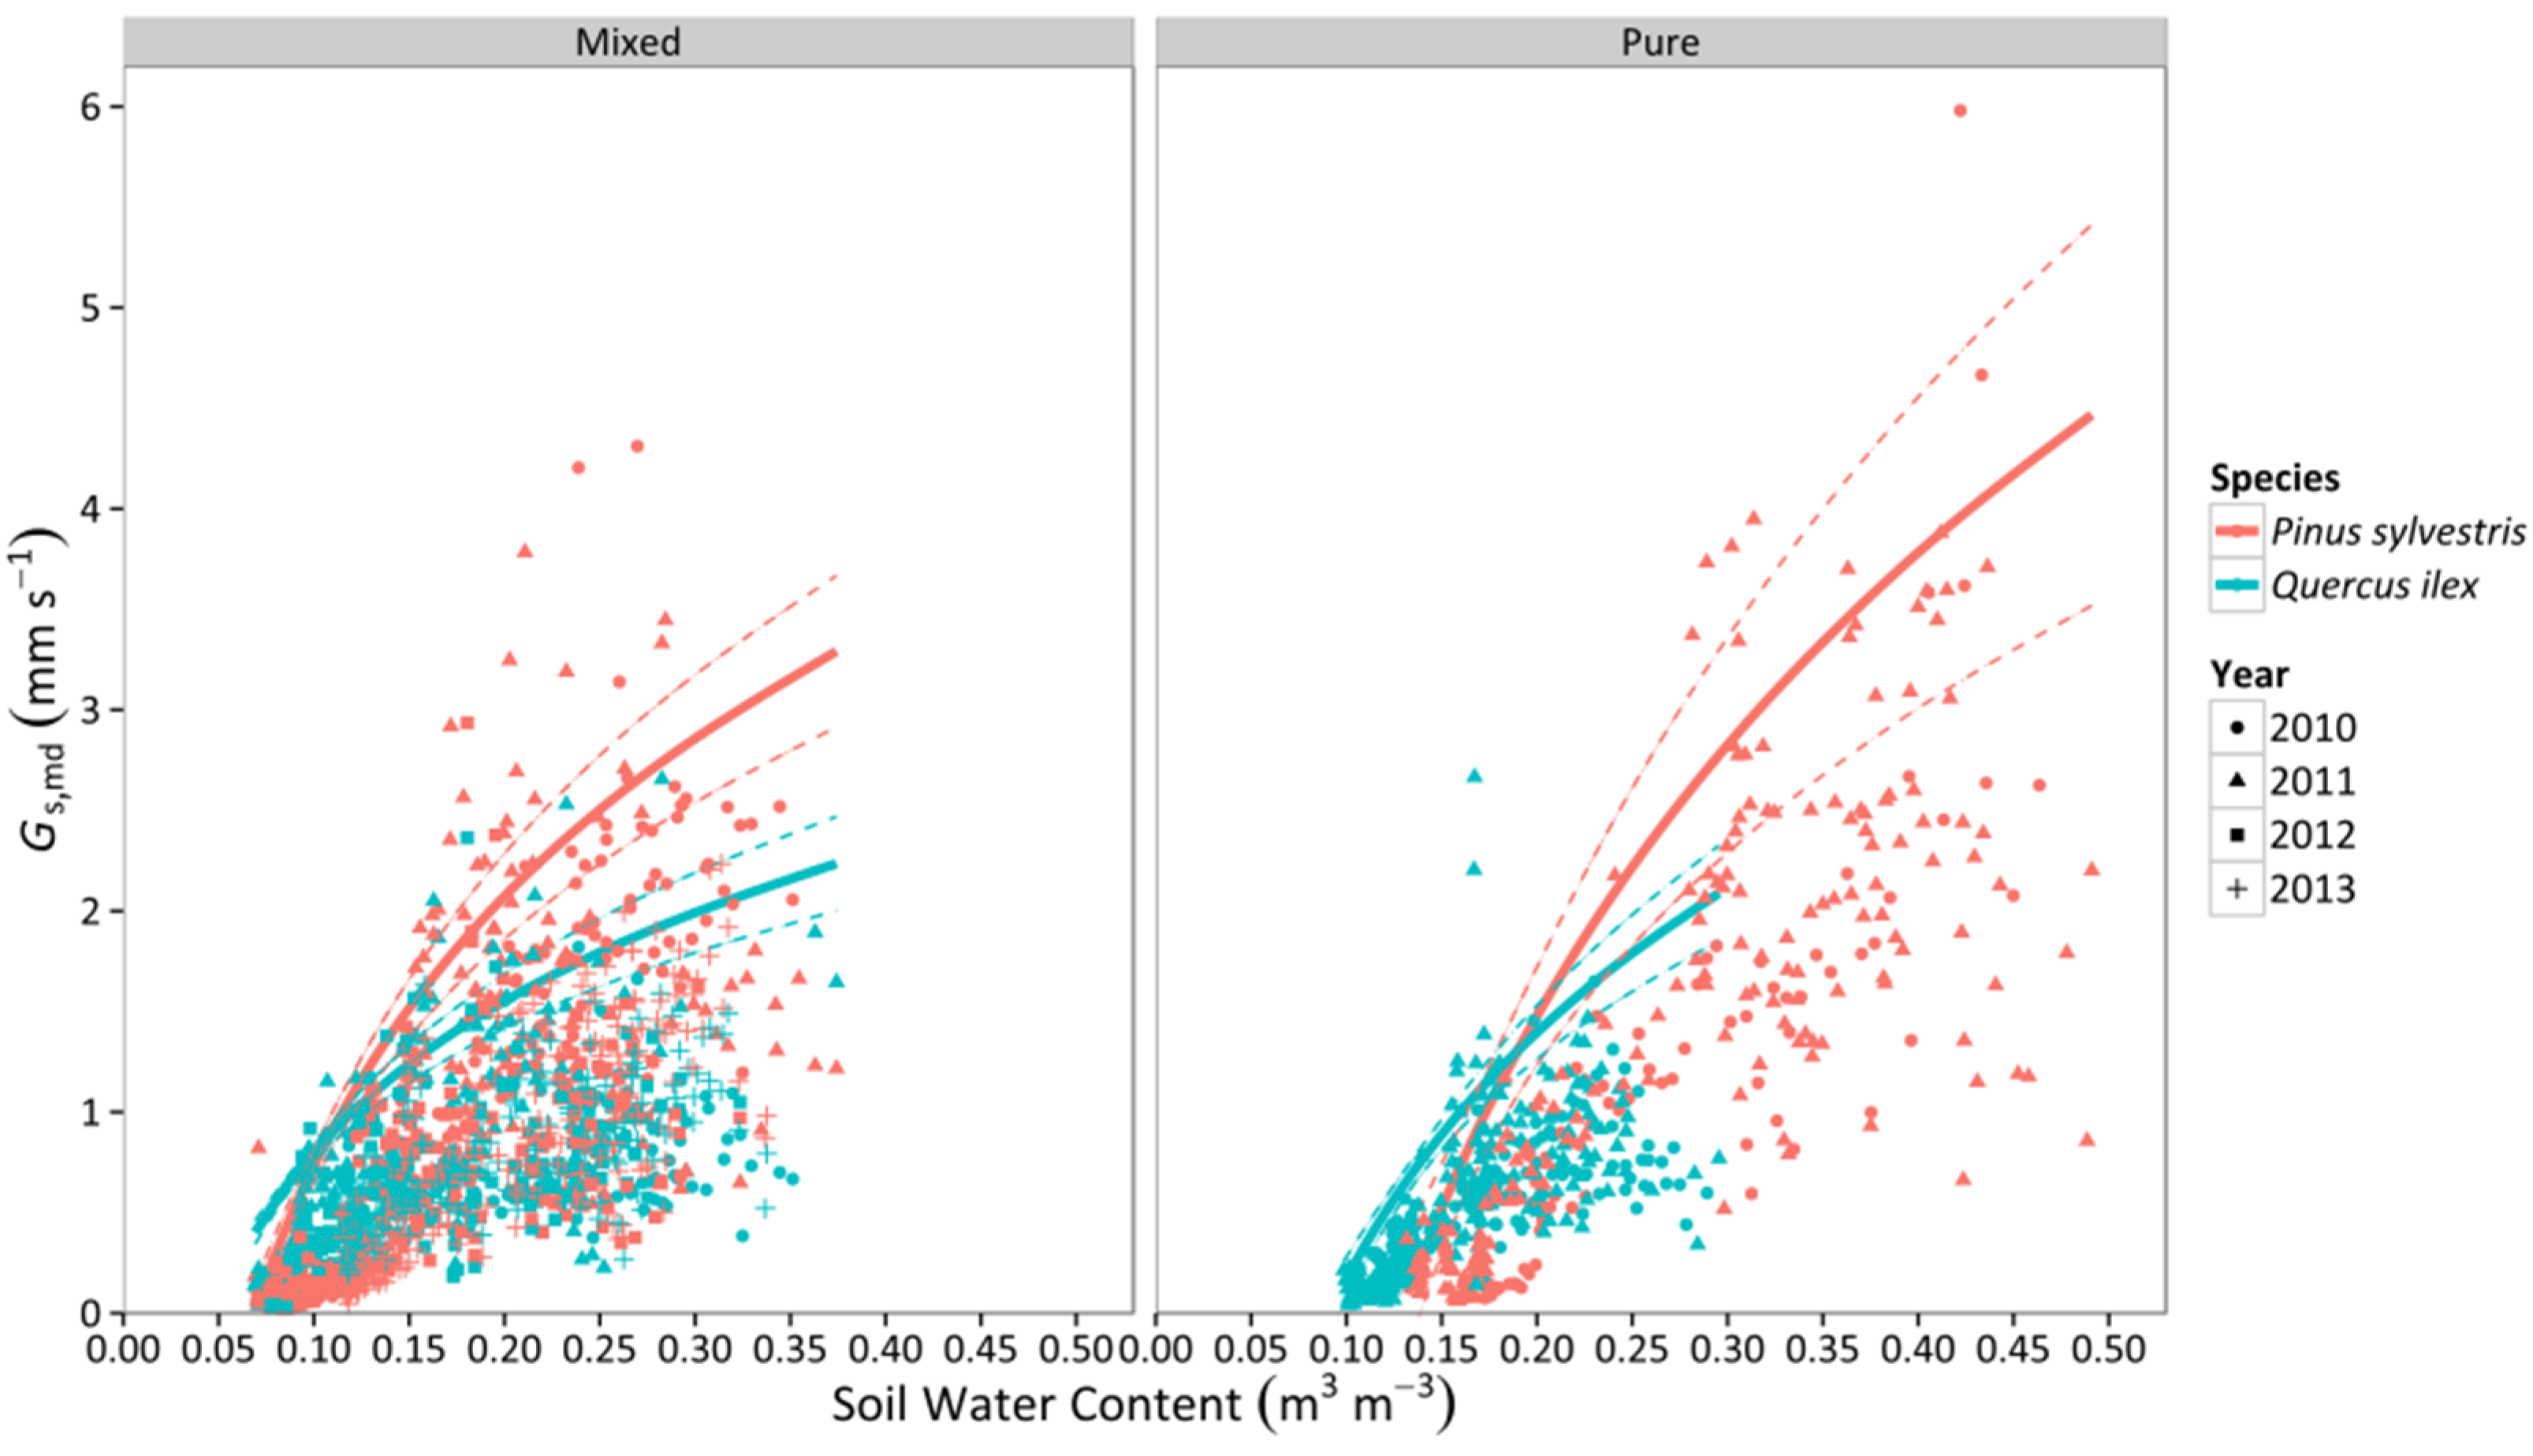
3.2. Canopy Stomatal Conductance

Canopy stomatal conductance (Gs,md) increased with soil moisture in both species and stand types (Figure 4). For lower values of SWC, Q. ilex had higher values of Gs,md than P. sylvestris. However, P. sylvestris experienced a faster increase of Gs,md and achieved more elevated conductances (per unit leaf area) under well-watered conditions (Figure 4), which could be attributed to the lower AL:AS reported in P. sylvestris (Table 1). In addition, the slope of the relationship was steeper in pure than mixed stands for both species (Table S1). Gs,md steeply decreased with increasing VPD in the two species, with P. sylvestris showing higher values overall in both mixed and pure stands (Figure 5). Although the slope of the relationship with VPD was similar between species in the mixed stand, the slope was steeper for P. sylvestris in the pure stand, resulting in significant differences between species in this latter stand type (Figure 5, Table S1).
Figure 3. Relationship between predawn leaf water potential (ΨPD) and midday leaf water potential (ΨMD) throughout three years of measurements for P. sylvestris and Q. ilex trees. Error bars indicate ±1 SE. The 1:1 line is also depicted. Linear regression lines are also depicted for each species. The intercept (λ) and the slope (σ) of the relationship are shown in the insert.
Forests 06 02505 g003
Figure 4. Responses of midday canopy stomatal conductance (Gs,md) to daytime averages of SWC in two different stand types throughout four consecutive years. Average values for P. sylvestris and Q. ilex trees are shown. Standard errors of individual measurements are not displayed to improve clarity. Solid lines represent the quantile regression fit of the 95th percentile and dashed lines are the 95% confidence intervals of the quantile regression.
Forests 06 02505 g004
Figure 5. Responses of midday canopy stomatal conductance (Gs,md) to daytime averages of VPD in two different stand types throughout four consecutive years. Average values for P. sylvestris and Q. ilex trees are shown. Standard errors of individual measurements are not displayed to improve clarity. Solid lines represent the quantile regression fit of the 95th percentile and dashed lines are the 95% confidence intervals of the quantile regression.
Forests 06 02505 g005

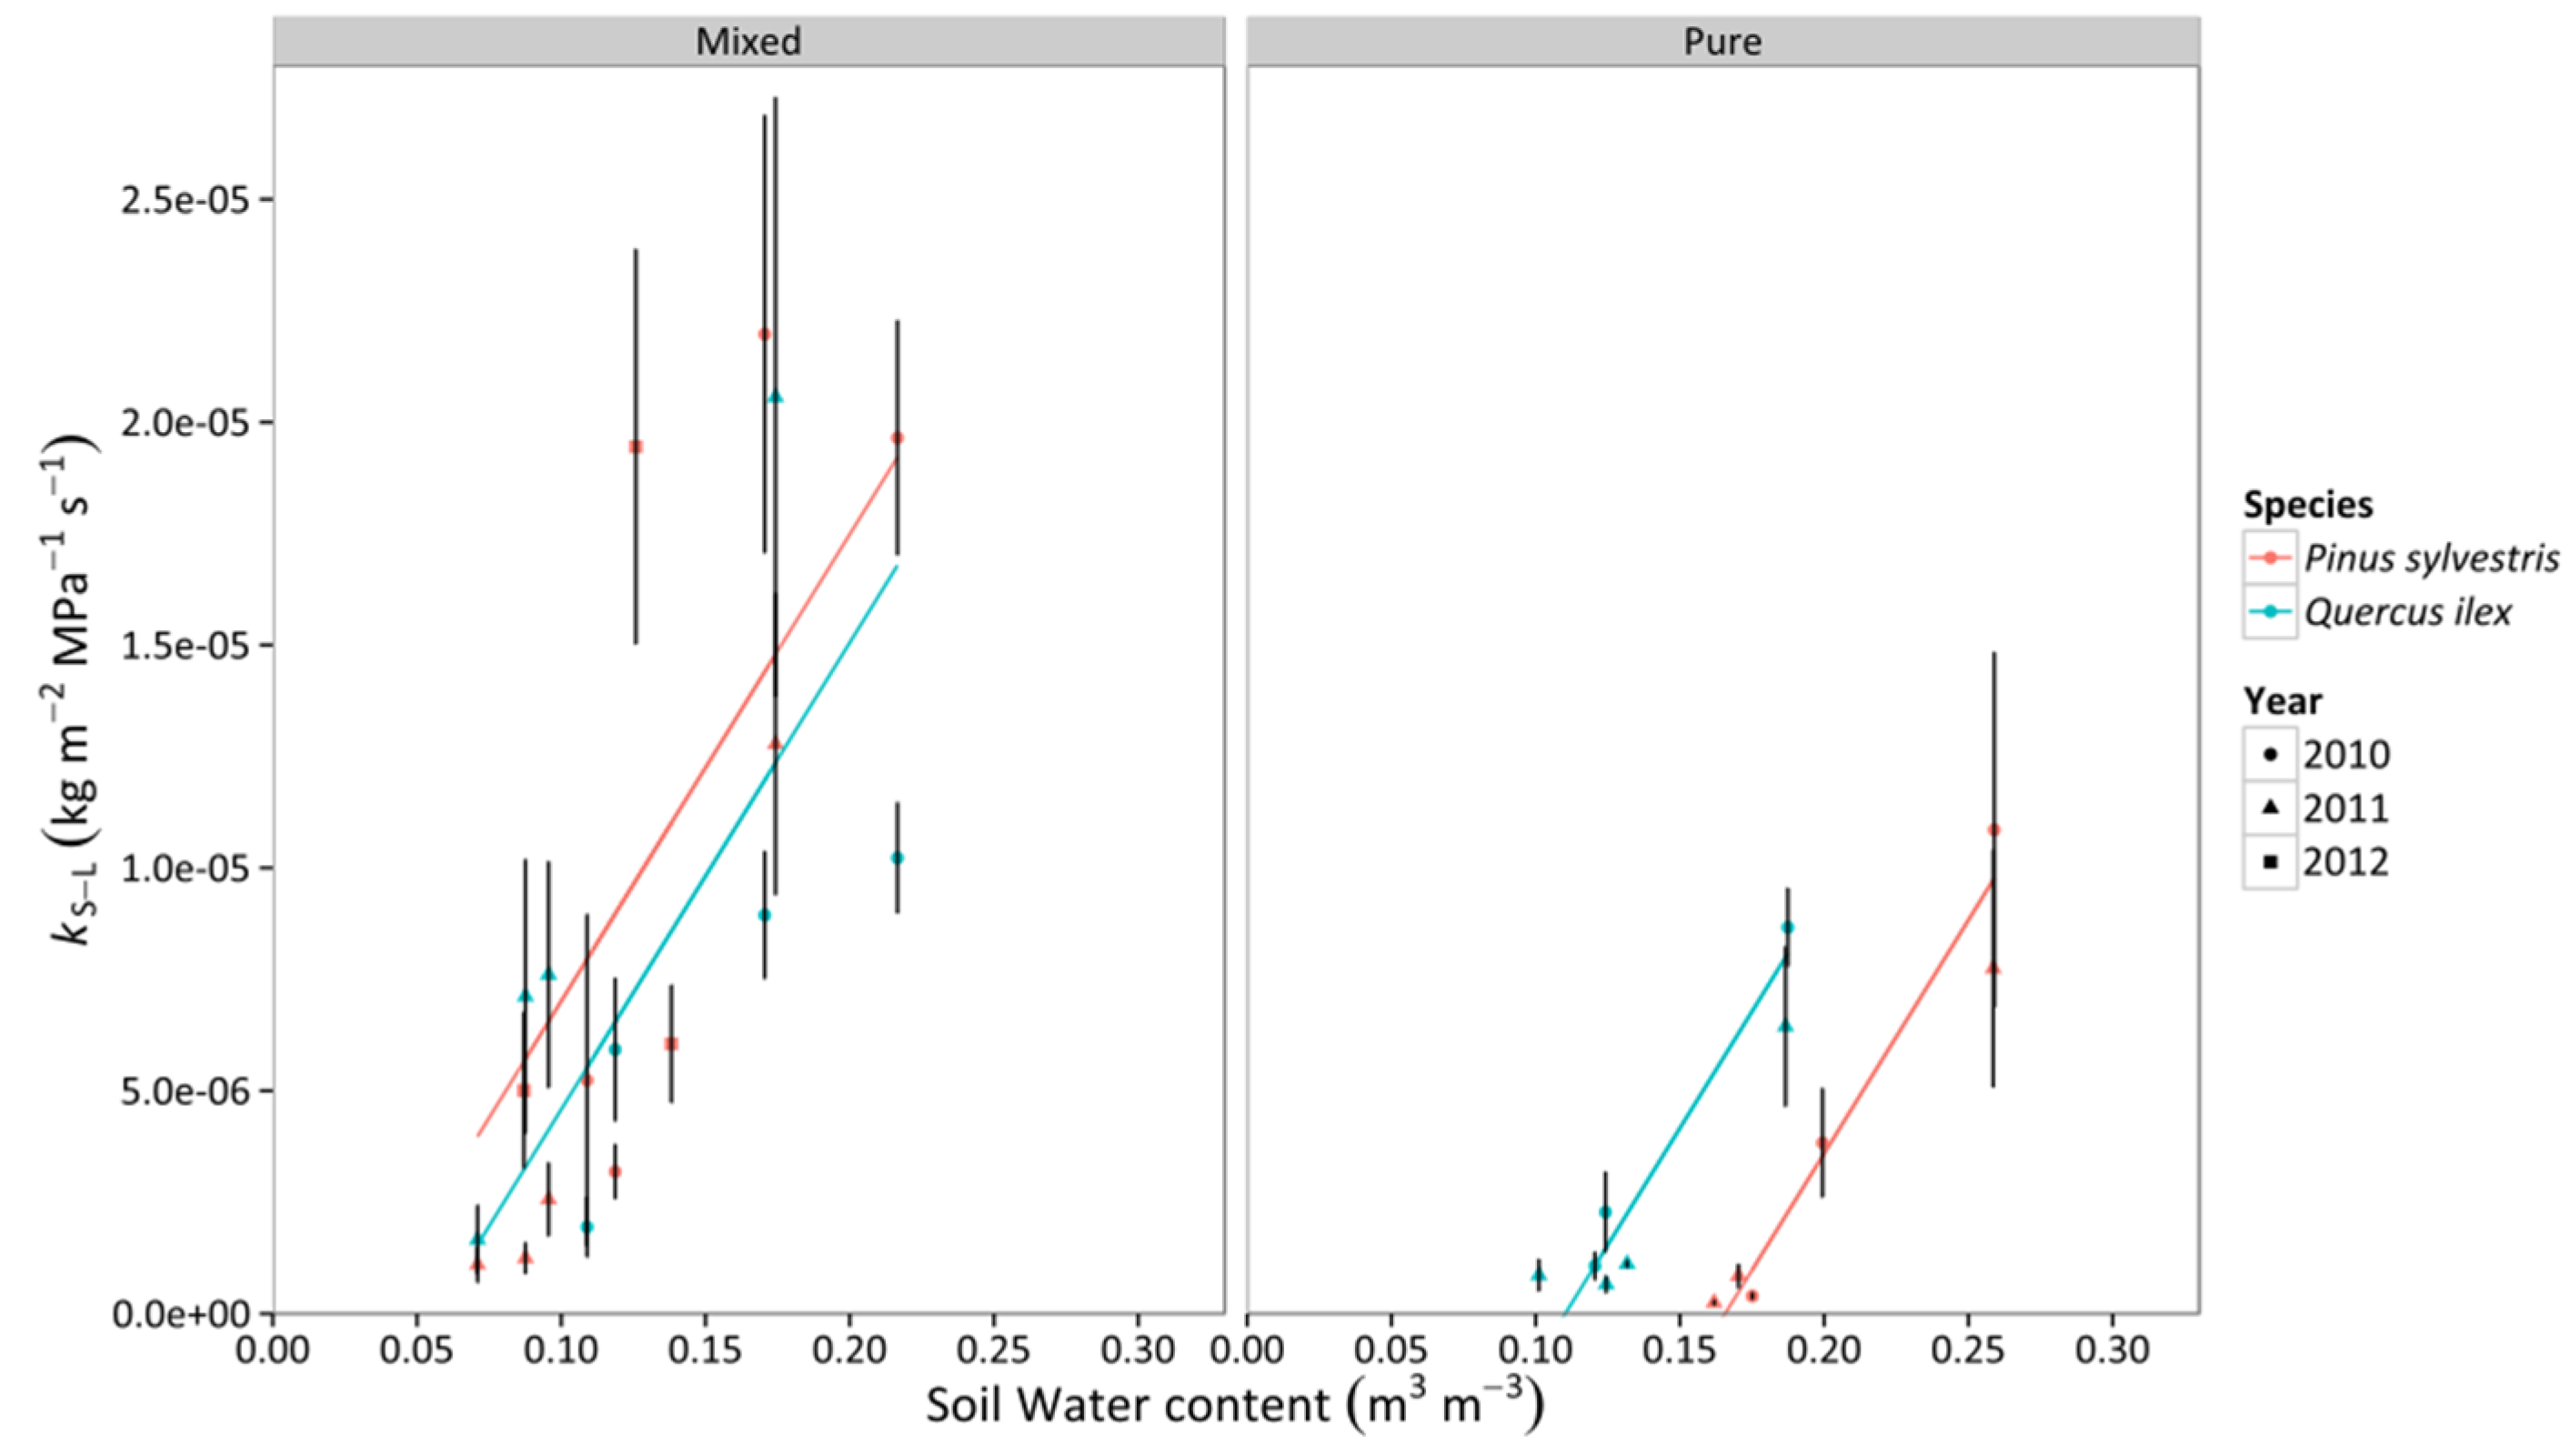
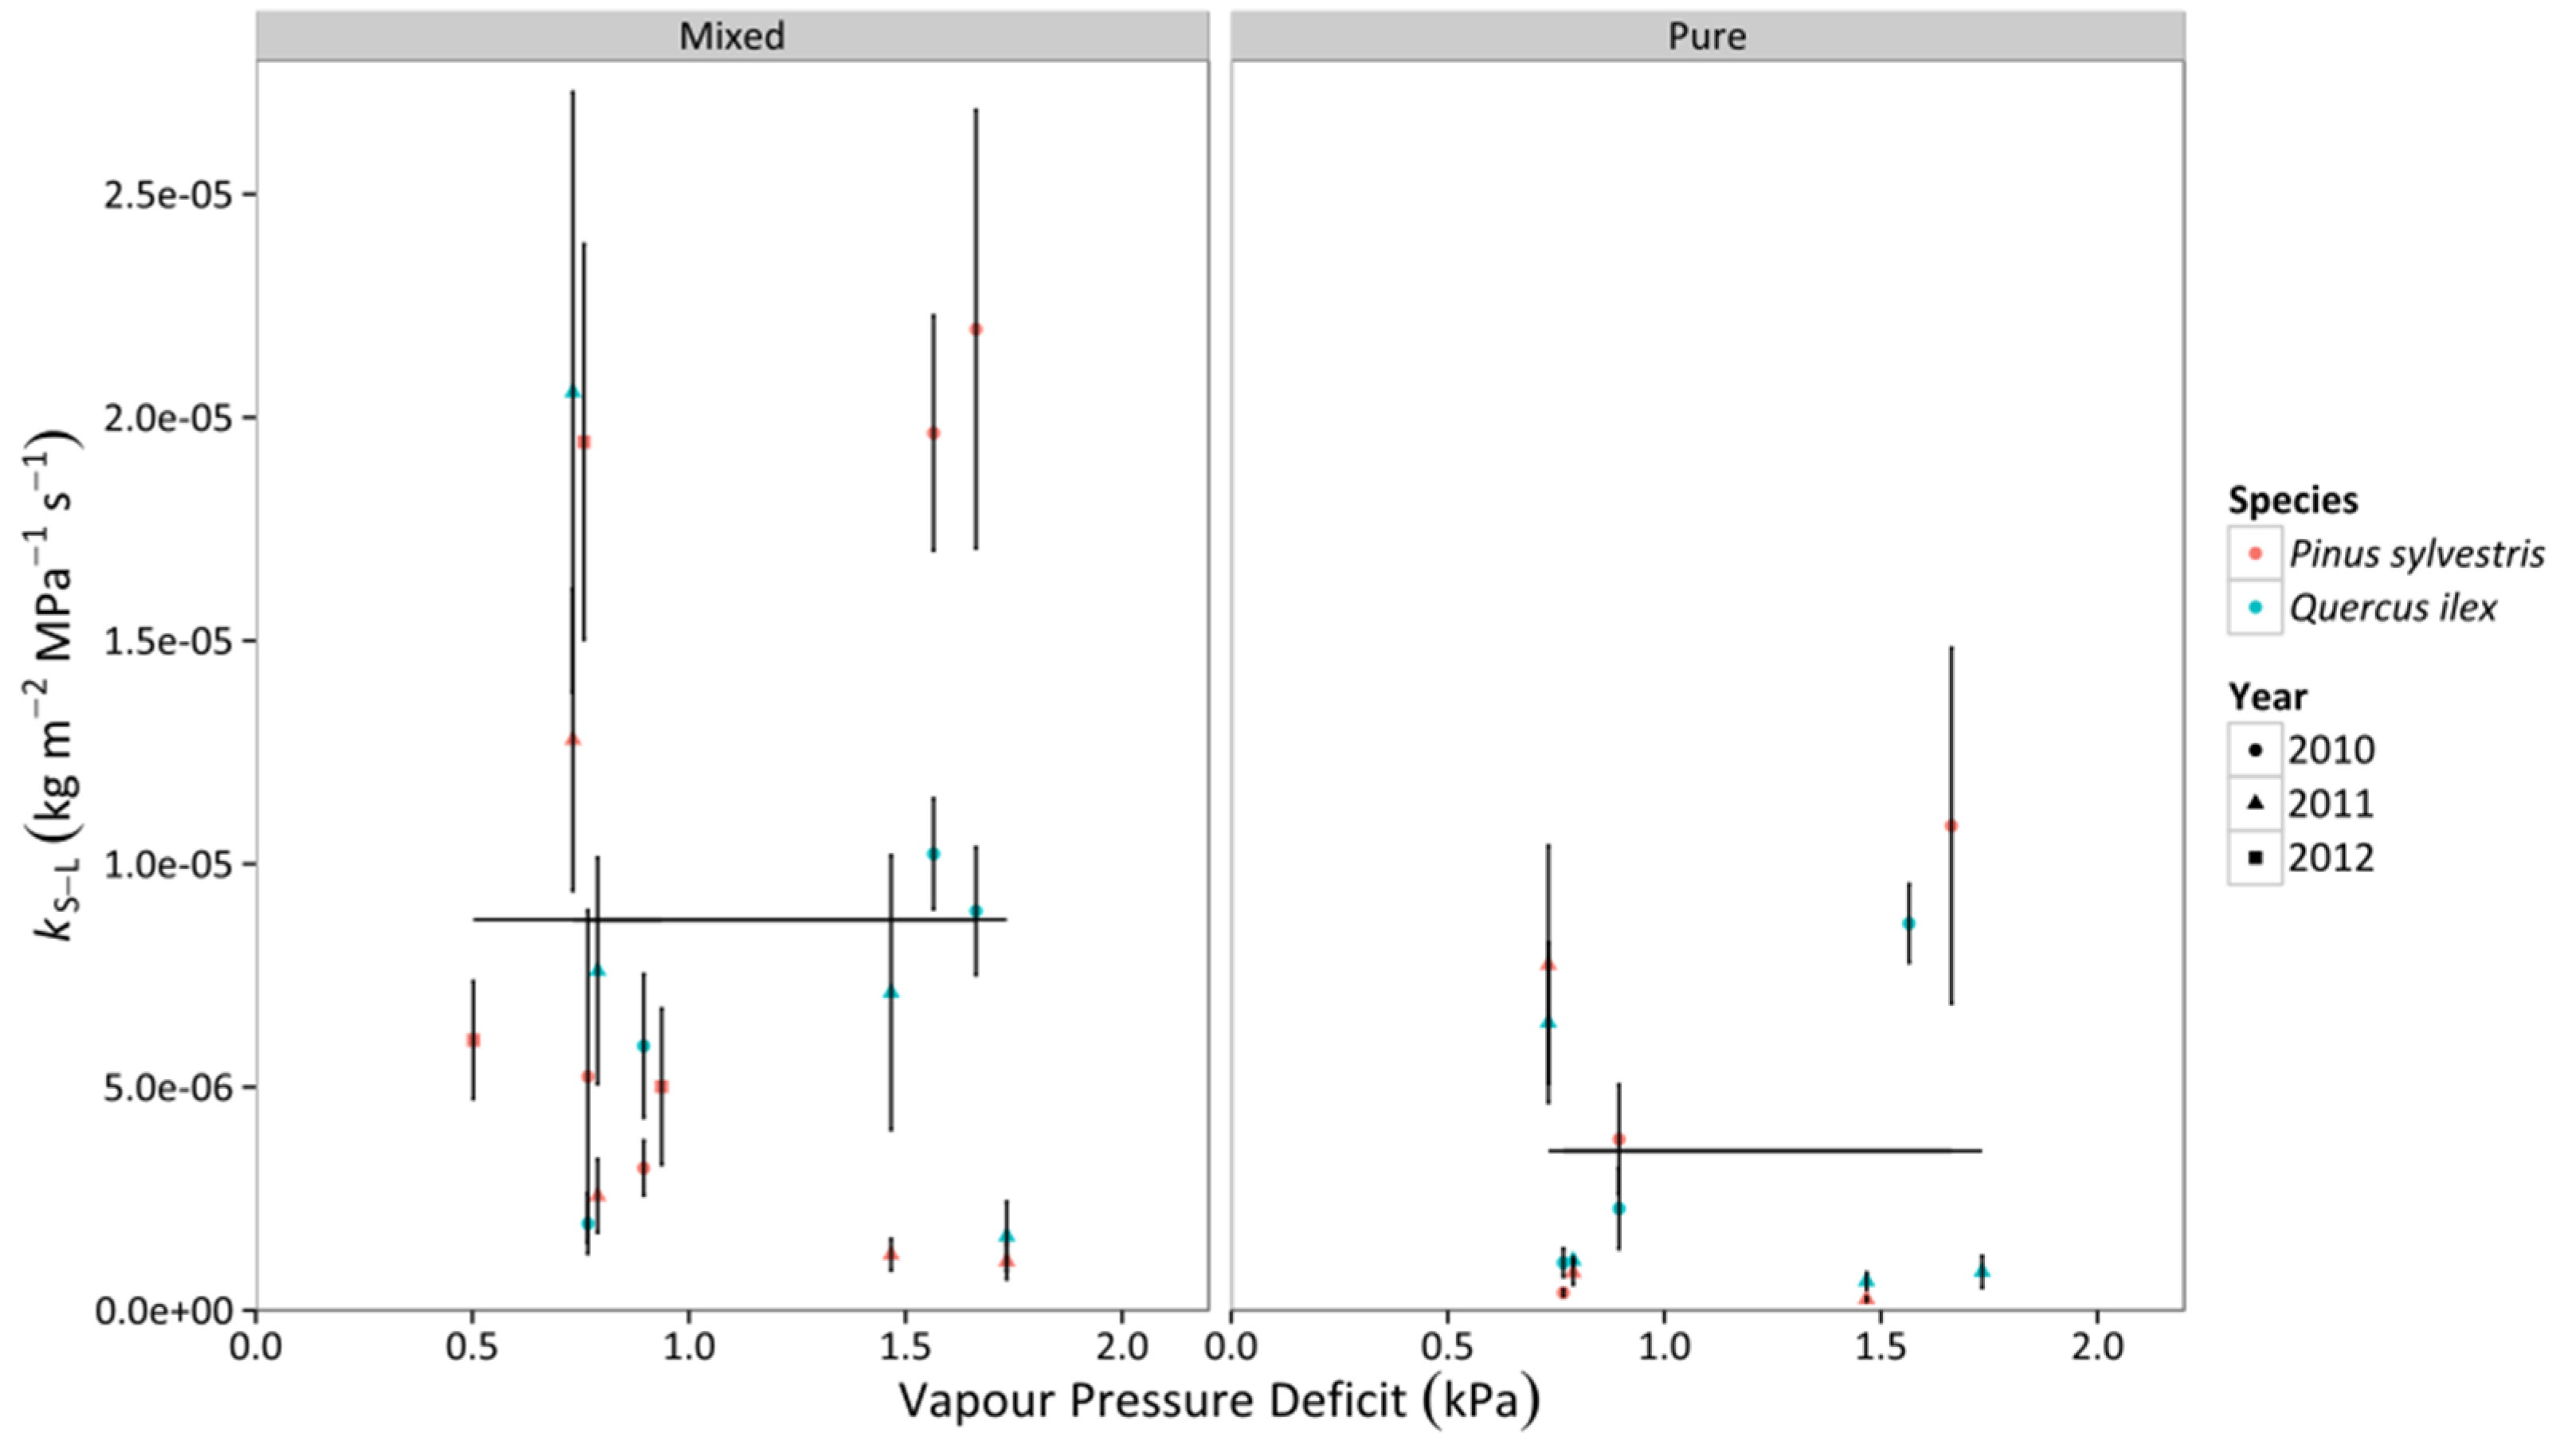
3.3. Whole-Tree Leaf-Specific Conductance

Whole-tree leaf-specific conductance (kS–L) increased linearly with increasing SWC in Q. ilex and P. sylvestris, with a similar slope in both species (Figure 6, Table S3). P. sylvestris tended to have a significantly higher intercept in the mixed stand, whereas the opposite happened in the pure stands, where Q. ilex trees presented higher levels of kS–L than P. sylvestris for a given SWC value (Figure 6, Table S3). We did not find a significant effect of VPD on kS–L. Lower kS–L values in pure compared to mixed stands were detected in both SWC and VPD models (Figure 6 and Figure 7, Table S3).
Figure 6. Responses of whole-tree leaf-specific conductance (kS–L) to daytime averages of SWC in two different stand types throughout three consecutive years. Average values for P. sylvestris and Q. ilex trees are shown. Error bars indicate ±1 SE. The regressions for the different combinations of species and stand type according to best-fitting models are also depicted (cf. Table S3).
Forests 06 02505 g006
Figure 7. Responses of whole-tree leaf-specific conductance (kS–L) to daytime averages of VPD in two different stand types throughout three consecutive years. Average values for P. sylvestris and Q. ilex trees are shown. Error bars indicate ±1 SE. The regressions for the different combinations of species and stand type according to best-fitting models are also depicted (cf. Table S3).
Forests 06 02505 g007

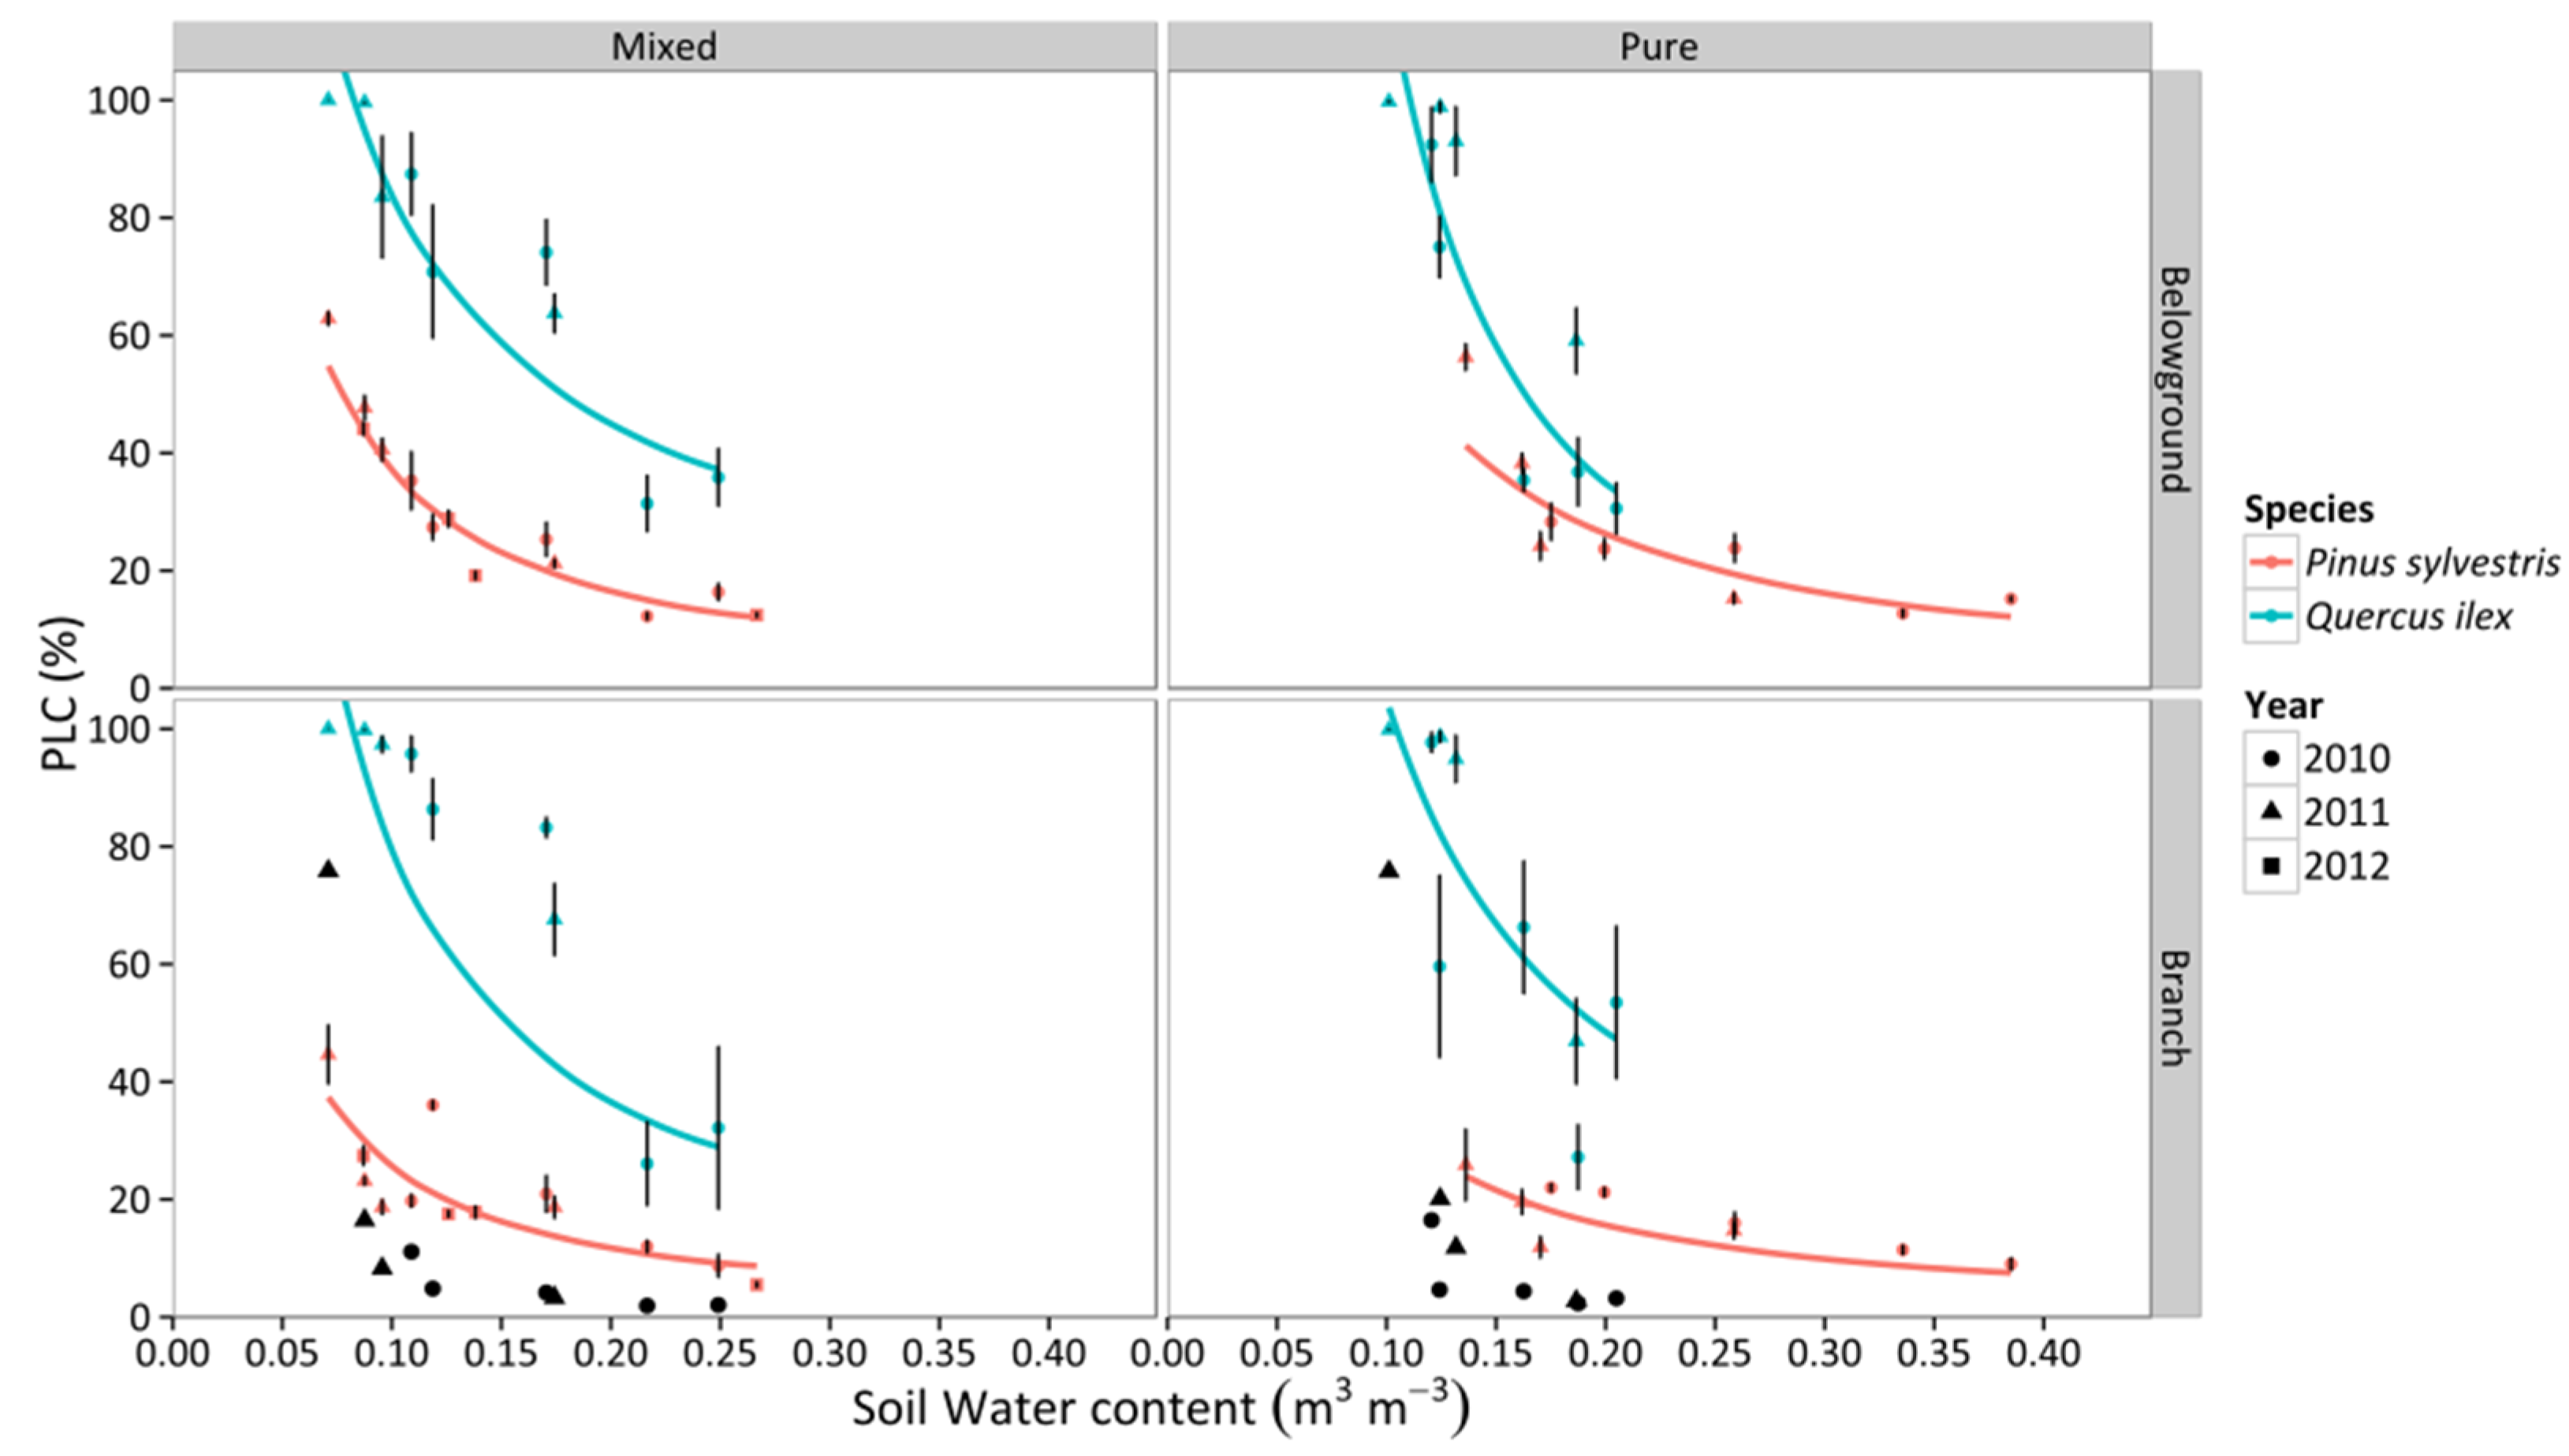
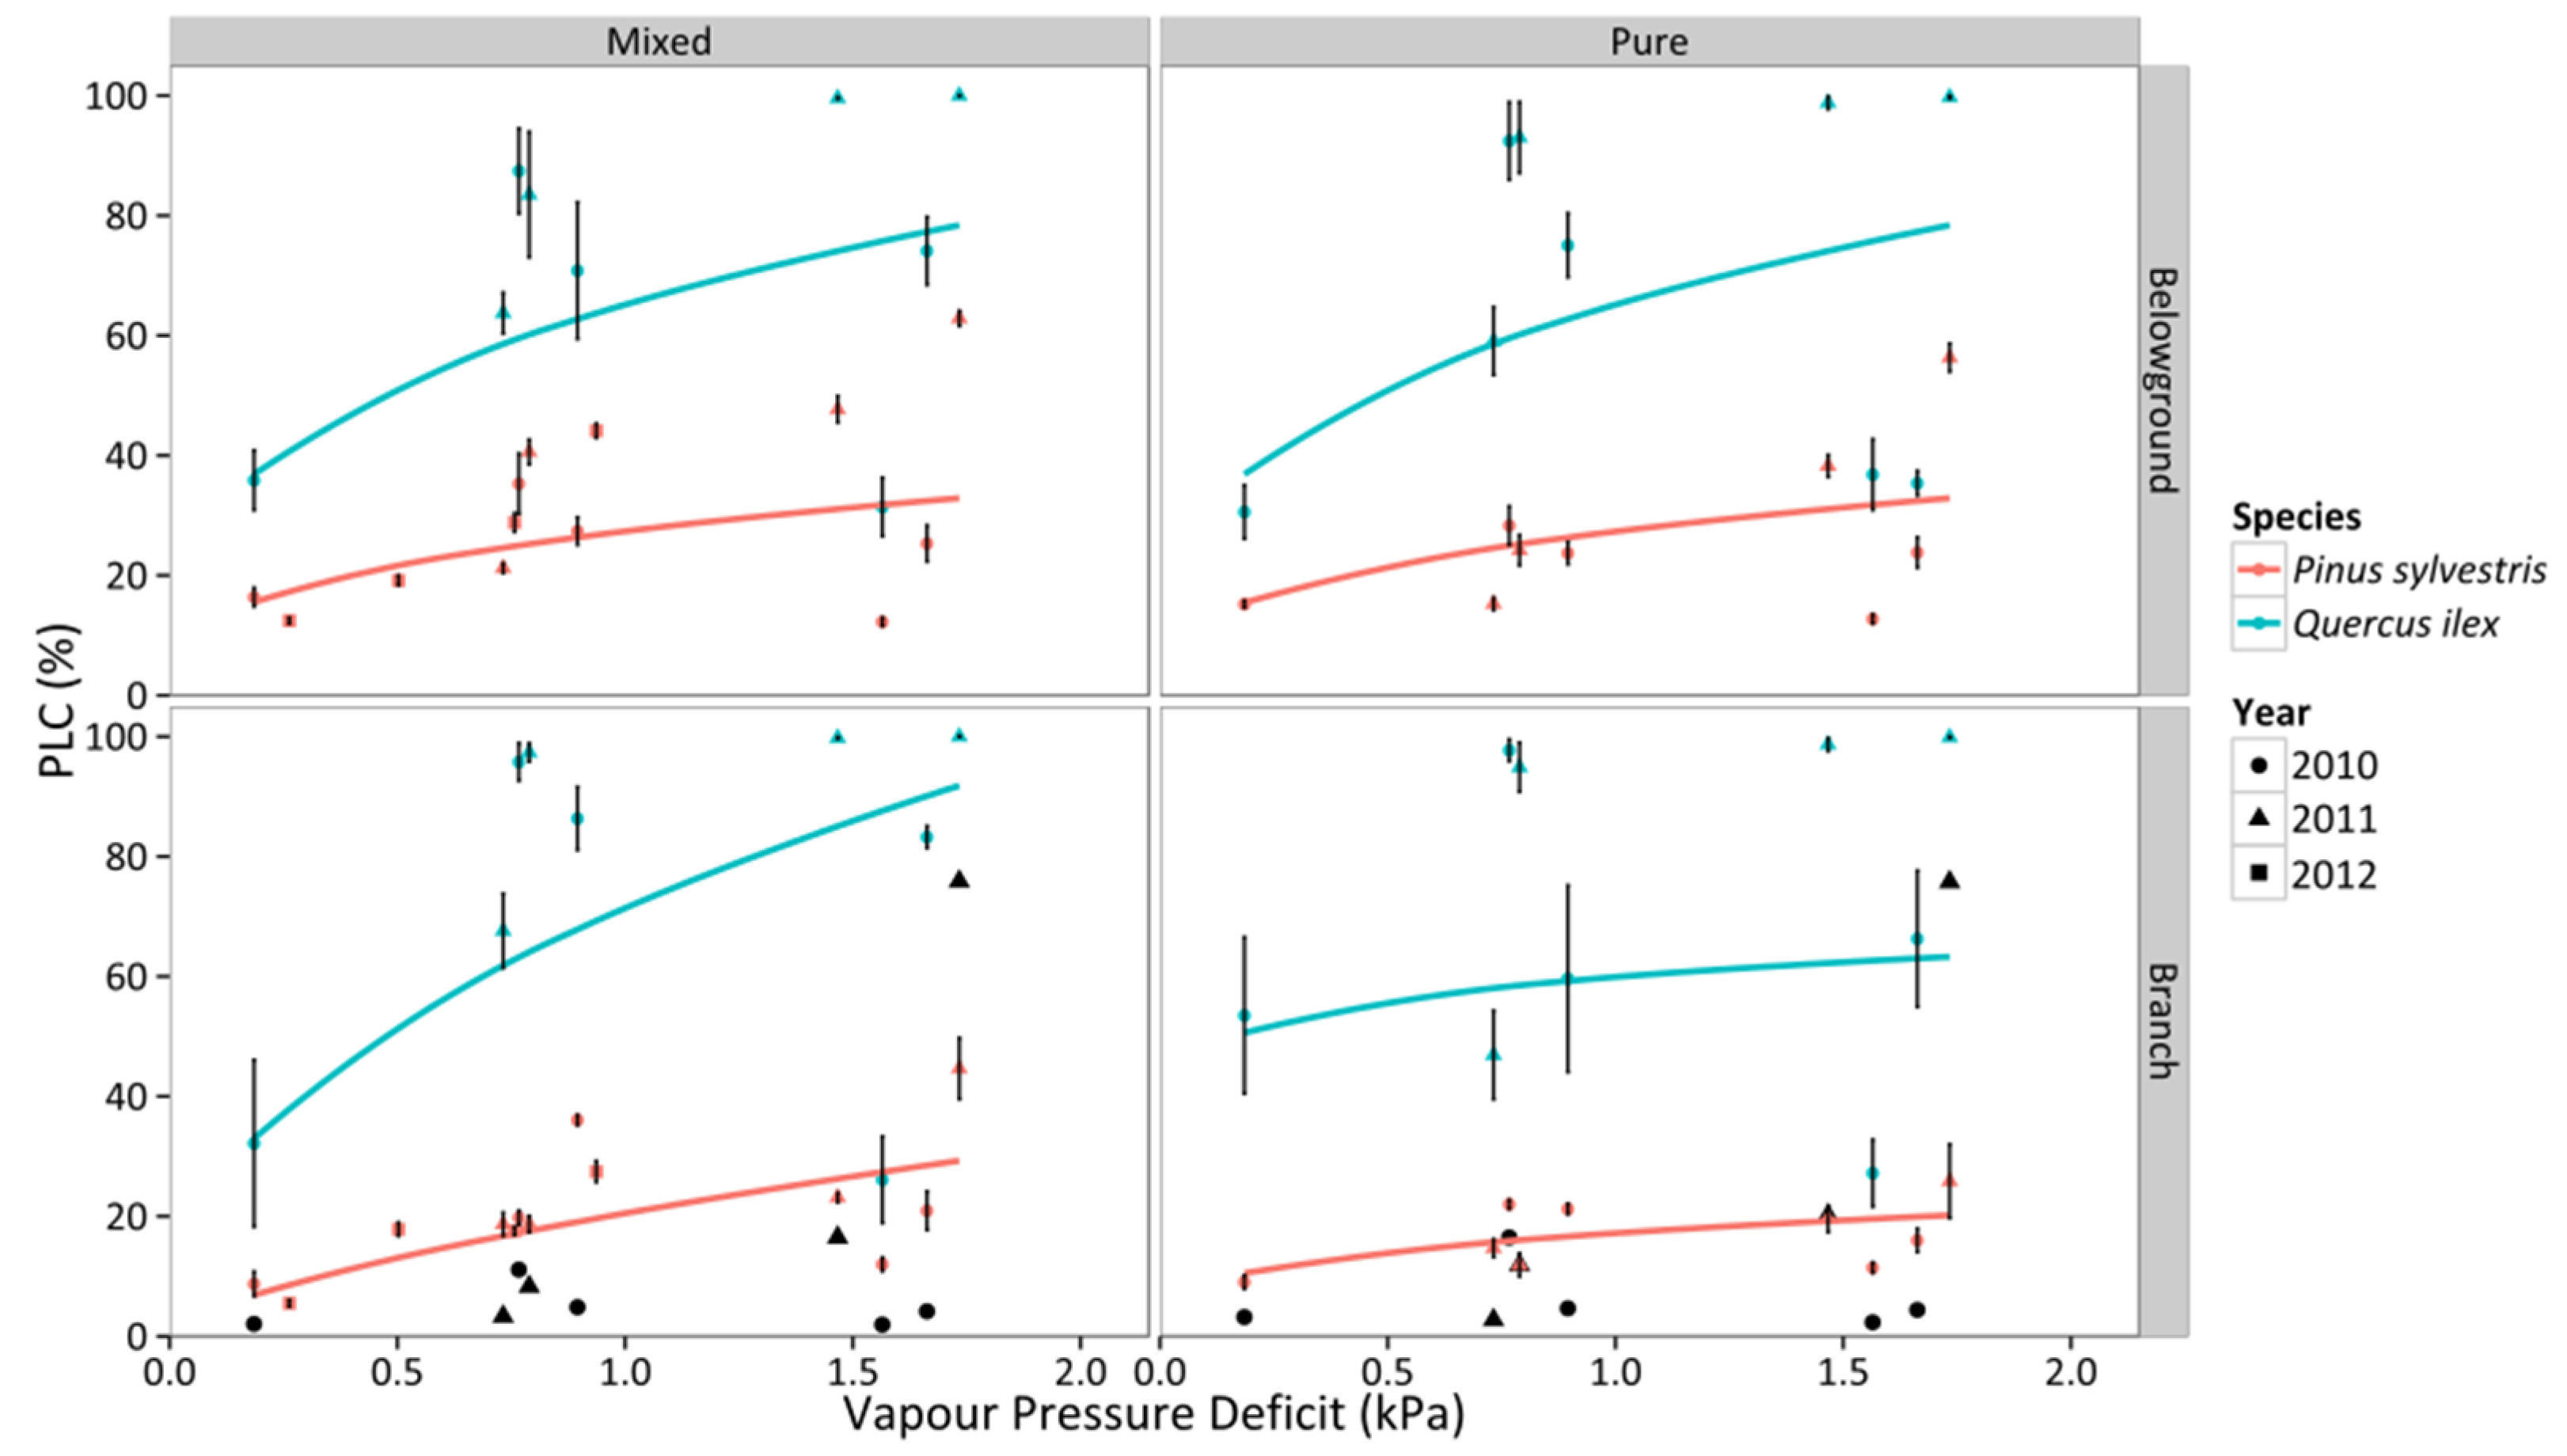
3.4. Percentage Loss of Hydraulic Conductivity

We observed an increase of the percentage loss of conductivity (PLC) with declining SWC in branches and belowground organs for mixed and pure stands of both species (Figure 8). Q. ilex trees presented significantly higher levels of PLC at any given SWC (Figure 8, Table S4), reaching ~100% PLC in both stands at extremely dry conditions. In contrast, PLC in P. sylvestris only reached 50% in branches and 60% in roots in the mixed stand and there were slightly lower PLC values in the pure stand (Figure 8). Q. ilex experienced a faster increase of PLC with declining SWC in all combinations of organ and stand type, except for roots in the mixed stand (Figure 8, Table S4). On the other hand, PLC increased with increasing values of VPD (Figure 9), with significantly higher PLC in Q. ilex trees in all organs and stand types (Figure 9, Table S4). However, we only observed statistically different values between stand types in branches, with lower values and shallower slopes in pure stands (Table S4). Results were qualitatively similar if the vulnerability curves obtained by Martin-StPaul et al. [48] were used to estimate PLC for Q. ilex. However, absolute PLC values were predicted to be much lower than those estimated using the vulnerability curves obtained previously for our study site, except for extremely low SWC and high VPD values (Figure 8 and Figure 9).
Figure 8. Responses of percentage loss of hydraulic conductivity (PLC) to daytime averages of SWC in two different stand types throughout three consecutive years. Average values for P. sylvestris and Q. ilex trees are shown. Error bars indicate ± 1 SE. The regressions for the different combinations of species and stand type according to best-fitting models are also depicted (cf. Table S4). Black symbols represent the PLC values obtained following the vulnerability curves from Martin-StPaul et al. [48] for Q. ilex.
Forests 06 02505 g008
Figure 9. Responses of percentage loss of conductivity (PLC) to daytime averages of VPD in two different stand types throughout three consecutive years. Average values for P. sylvestris and Q. ilex trees are shown. Error bars indicate ±1 SE. The regressions for the different combinations of species and stand type according to best-fitting models are also depicted (cf. Table S4). Black symbols represent the PLC values obtained following the vulnerability curves from Martin-StPaul et al. [48] for Q. ilex.
Forests 06 02505 g009

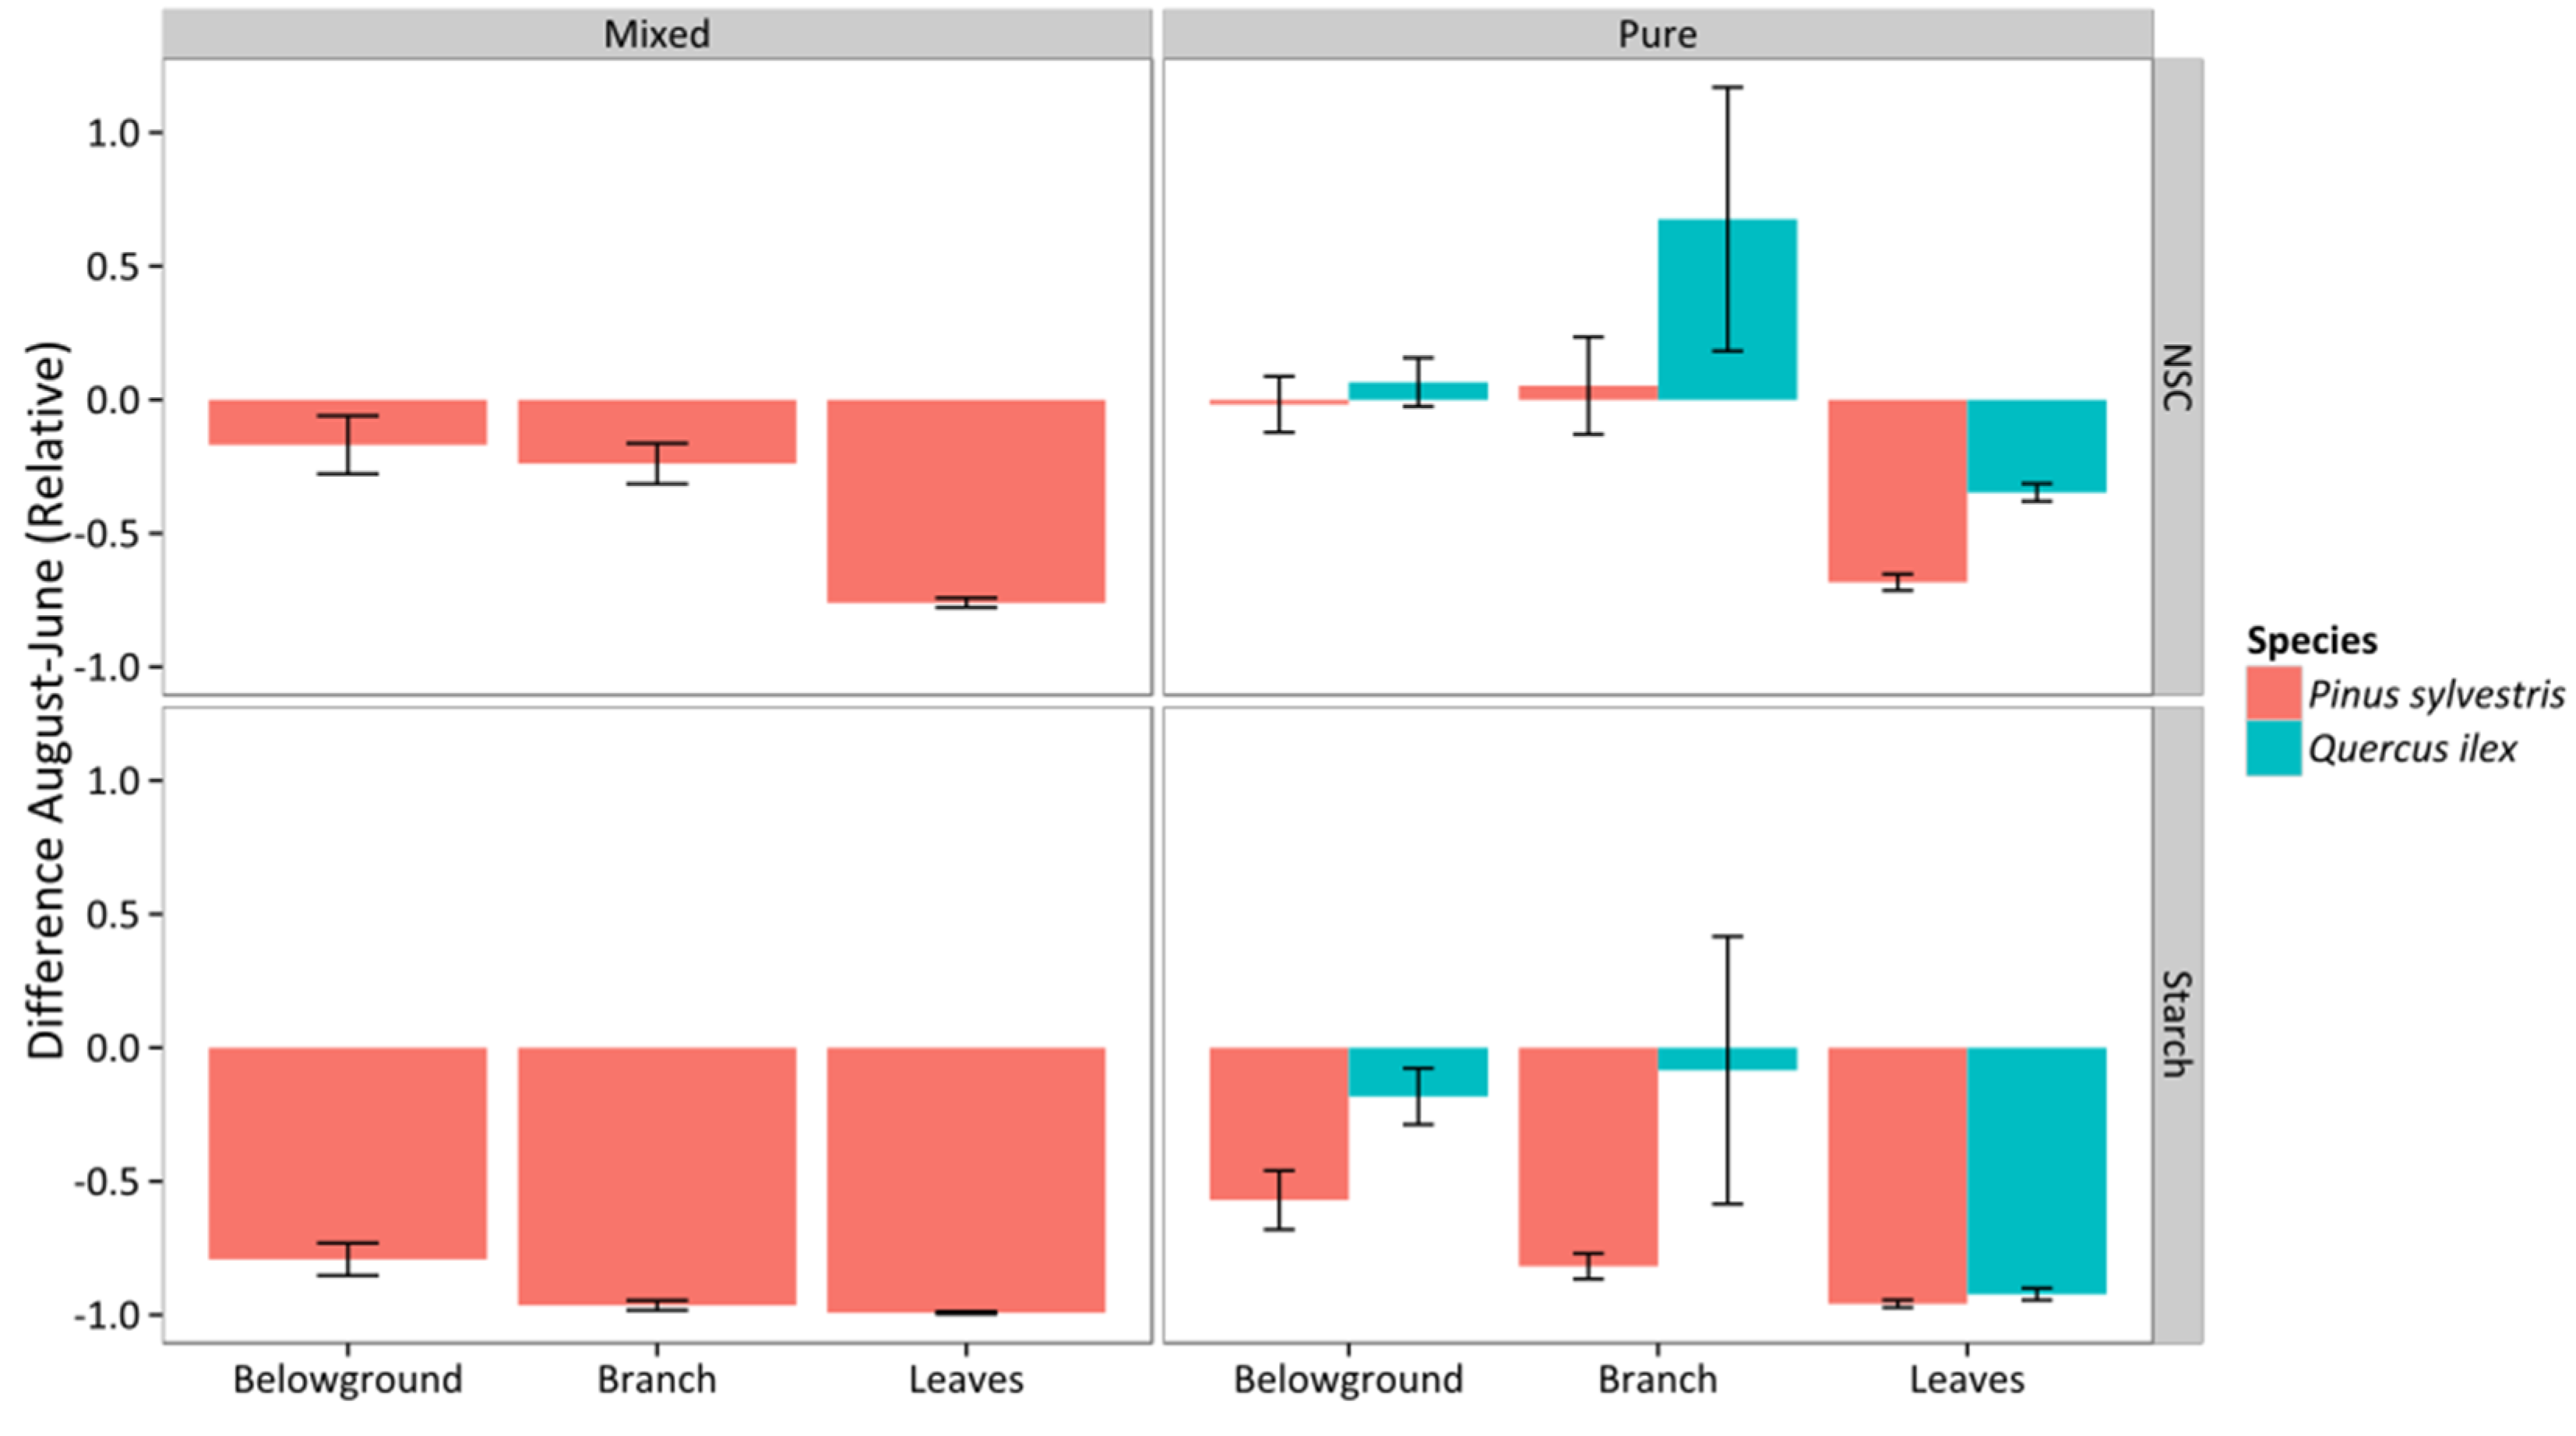
3.5. Non-Structural Carbohydrates and Starch

At the peak of the drought season (August) NSC concentration reached 4.81%, 4.64%, and 1.02% dry matter in P. sylvestris leaves, branches, and roots, respectively, in the pure stand. In the mixed stand these minimum values were 5.21%, 4.52%, and 1.22% dry matter in P. sylvestris leaves, branches, and roots, respectively. Finally, NSC concentrations were 4.36%, 4.25%, and 14.09% in Q. ilex leaves, branches, and lignotuber, respectively, in the pure oak stand (see also Aguadé et al. [30] and Rosas et al. [42].
NSC and starch declined between June and August in most combinations of species, organ, and stand type, as shown by negative ΔNSCAug−Jun,rel and ΔStarchAug−Jun,rel values (Figure 10), except for belowground organs and branches in Q. ilex; albeit these positive ΔNSCAug−Jun,rel corresponded to non-significant increases in the absolute values (Figure S2). Relative NSC and starch reductions (ΔNSCAug−Jun,rel and ΔStarchAug−Jun,rel, respectively) were higher in leaves in both species (Figure 10, Table S5). No differences between stands were detected for P. sylvestris (the only species measured in both stand types) (Figure 10, Table S5). Q. ilex showed a significantly lower relative reduction of NSC and starch across all organs (Figure 10, Table S5). Qualitatively similar results were obtained when absolute rather than relative differences in NSC and starch were analyzed (ΔNSCAug−Jun and ΔStarchAug−Jun, respectively), although in this case the interaction between organ and species was significant and the lower reductions experienced by Q. ilex trees were only significant in some organs (Figure S2, Table S5).
Figure 10. Relative difference between August and June in measured total non-structural carbohydrates (ΔNSCAug−Jun,rel, upper panels) and starch (ΔStarchAug−Jun,rel, bottom panels). Values are given for different organs, stand types (columns), and species. Average values for P. sylvestris and Q. ilex trees are shown. Error bars indicate ±1 SE.
Forests 06 02505 g010

4. Discussion

Overall, our results show that P. sylvestris and Q. ilex have contrasting physiological responses to extreme drought in terms of hydraulics, stomatal regulation, and carbohydrate dynamics. These differences may also be affected by species-specific phenological patterns, but the similar phenology of the two studied species in the study area and the fact that several consecutive summer droughts were monitored, including one of the driest summers on record, makes us confident that the broad differences we observe between species can be safely attributed to drought effects. Our results are generally consistent with carbon starvation and hydraulic failure being the main physiological mechanisms associated with drought-induced mortality in P. sylvestris and Q. ilex, respectively. Furthermore, we report changes in the physiological responses to drought of these two species depending on whether they coexist in the same stand or they grow in pure stands. However, these changes appear to be relatively small and, in the case of Q. ilex, they are unlikely to limit its ability to persist under more exposed conditions and maintain viable populations in the study area unless climatic conditions become substantially drier.

4.1. Contrasting Hydraulic Strategies in P. sylvestris and Q. ilex

P. sylvestris and Q. ilex displayed very different ranges of Ψ, with Q. ilex reaching more negative values (Figure 1). Minimum values of Ψ were representative of extreme drought conditions for both species. For example, ΨMD for P. sylvestris (~−2.5 MPa) were in the lowest end of ΨMD reported across Europe [50] and ΨPD values were lower than those observed in other drought-exposed populations [51]. Likewise, Q. ilex reached values of ΨPD and ΨMD (~−5MPa and ~−6 MPa, respectively) that are among the most negative ones ever recorded for this species [33,52].
Both ΨPD and ΨMD were better correlated with SWC than with VPD in both species, showing that SWC measured in the upper 30 cm of soil was tightly associated to the whole-tree water status. This is consistent with other studies in pines that have shown that (1) a strong relationship between transpiration and soil moisture is also found at a depth of 0–25 cm [53] and (2) even if water can be extracted from deep layers, the topsoil layers, where most roots are located, have a larger influence on the rate of water uptake [54]. Compared to P. sylvestris, Q. ilex showed lower ΨPD and a steeper decline of this variable with decreasing SWC. If we assume that ΨPD is in equilibrium with SWC around roots [45], these results would suggest that P. sylvestris roots have access to wetter soil pockets. This result contradicts the evidence showing that Q. ilex trees tend to be particularly deep rooted and reach deeper (and presumably wetter) soil layers than pines [55]; and authors’ personal observations in the study area], as also shown in other pine-oak ecosystems, where higher ΨPD values were found for oak trees compared to co-occurring pines [56]. Hence, we may question whether ΨPD is truly in equilibrium with soil water potential in our system, since we would expect the lowest ΨPD measurements in the relatively shallow rooted P. sylvestris trees. One possible reason for this disequilibrium could be nocturnal sap flow [57], which has been demonstrated in Q. ilex trees in our study site [32]. However, P. sylvestris at our site also show some nocturnal sap flow during nights with high VPD [38], making it an unlikely explanation for the differential ΨPD patterns across species. Alternatively, hydraulic isolation from the surrounding soil has been hypothesized to explain relatively high (close to zero) water potentials in pines under extreme drought [58]. Other processes not studied here, such as hydraulic redistribution [59], could also contribute to explain the observed discrepancy between ΨPD values and rooting depth across species. Clearly, these mechanisms merit further investigation, as they are critical to understanding the drought responses of coexisting species.
P. sylvestris showed a more isohydric behavior than Q. ilex trees. If we interpret the relationship between ΨPD and ΨMD (Figure 3) following the theoretical framework recently presented by Martínez-Vilalta et al. [12], Q. ilex would be classified as strictly anisohydric and P. sylvestris as partially isohydric. Indeed, when SWC diminished and VPD increased during drought, Gs,md was more strongly reduced in P. sylvestris than in Q. ilex trees (Figure 4). As a result, and also considering that vulnerability to embolism was similar across species, P. sylvestris generally kept belowground and branch PLC below 50%, whereas Q. ilex trees presented much higher embolism levels in both branch and belowground organs under conditions of low SWC and high VPD (Figure 8 and Figure 9). Our PLC values were estimated from xylem vulnerability curves obtained using appropriate methods for each species—air injection for P. sylvestris and bench dehydration for Q. ilex [48,60]. However, none of these methods is free of potential artifacts [61], and estimated branch P50 values for Q. ilex in the study site (−2 MPa; [47]) are low compared to the range of values reported in other studies (between −3.8 and −6.6 MPa; [27,48,62,63]). If we use the vulnerability curves recently reported for a climatically similar Q. ilex population (−4.70 MPa; [48]) to estimate branch PLC, Q. ilex would keep PLC below ~20% except for the drought period in 2011, when PLC reached ~80% (Figure 8). This would imply that under normal summer drought conditions, branch PLC would be similar or lower in Q. ilex compared to P. sylvestris (Figure 8) and the comparatively higher risk of hydraulic failure in Q. ilex would be only apparent under extreme drought.
Interestingly, both P. sylvestris and Q. ilex trees exhibited similar rates of decline in kS–L under drought conditions, despite having different stomatal responses and different responses of xylem PLC to SWC. Whole-tree leaf-specific conductance linearly decreased with declining SWC for both species (Figure 6), and showed no relationship with VPD (Figure 7). At the lowest SWC measured in the mixed stand (ca. 0.07 m3·m−3), Q. ilex showed close to 100% xylem PLC (in both roots and branches) and a similar ca. 90% reduction in kS–L compared to its maximum value. In contrast, at similarly low SWC values, co-occurring P. sylvestris showed a 30%–40% xylem PLC but a 75% reduction in kS–L. These discrepancies between organ-specific xylem PLC and losses at the whole-tree level (kS–L) with SWC in P. sylvestris could be explained by a higher contribution of needle PLC, as needles have been shown to be more vulnerable than stems or roots in measurements taken on this species in the same study area [64]. The anisohydric behavior of Q. ilex observed here is at odds with the general view considering this species as isohydric [27], even in studies conducted in a nearby valley in the same study area [33,47]. Importantly, the iso-/anisohydric dichotomy does not account for differences in vulnerability to xylem embolism [12], nor for leaf traits involved in turgor regulation [65]. Given the current methodological controversy on the measurement of vulnerability to xylem embolism (e.g., [48,61]) we cannot be sure that the extremely high PLC values estimated here are real. However, several notes are in order: (i) extremely high (~80%) PLC is also predicted by more conservative vulnerability estimates under extreme drought (Figure 8 and Figure 9); (ii) extremely high PLC in the xylem is consistent with measured seasonal reductions in kS–L (Figure 6); (iii) the relationship between ΨPD and ΨMD for this species (Figure 3) suggests a similar sensitivity of stomata and plant hydraulic conductance to declining water potential (cf. [12]); and (iv) the water potentials measured here are much lower than those known to induce stomatal closure [66] and even leaf turgor loss in this species [63].

4.2. Implications for the Mechanisms of Drought-Induced Mortality in the Two Study Species

Our results are broadly consistent with the hydraulic framework proposed by McDowell et al. [10] and with recent experimental work by Pangle et al. [67]. The more isohydric behavior in P. sylvestris, in terms of maintaining relatively high water potentials, was associated with greater reductions of stomatal conductance as soil water availability declined (Figure 4), and is consistent with a greater relative reduction in NSC during drought, compared to Q. ilex (Figure 10) and with the low absolute levels of NSC concentration at the peak of summer drought (August). Similar NSC dynamics in responses to drought were found in a study comparing a conifer and a broadleaved species [68]. NSC reserves are known to become even more depleted in P. sylvestris affected by crown defoliation following chronic drought stress and they have been directly associated with drought-induced decline and mortality in the study population [30]. In comparison, its more anisohydric strategy likely allows Q. ilex to maintain higher assimilation rates under drought and minimize NSC reductions (see also Rosas et al. [42]), but puts this species under higher risk of hydraulic failure [33]. In fact, PLC values of ~80% reached by Q. ilex were close to the PLC value reported to cause irreversible damage in angiosperms [69]. It is important to note here that NSC (including starch) concentrations in Q. ilex were measured in a drier area than the rest of the measurements reported in this study (see Methods) and, thus, summer NSC reductions may be overestimated in this species, providing further support to our interpretation. Finally, though we did not find a drastic depletion of NSC reserves in our Q. ilex population (Figure 10), severe drought episodes have also been associated with depleted NSC reserves in other Q. ilex populations [34], highlighting the fact that different physiological mechanisms of drought-induced mortality may occur even within species.
Our study included an extraordinarily long drought period in 2011 [28]. This drought event did not have immediate effects on landscape-scale mortality in P. sylvestris (at least no higher than an average summer drought) and, although Q. ilex trees in our main study sites were not visibly affected, a Q. ilex die-off event was observed in the drier, south-facing slopes of the Torners and Tillar valleys [36,70]. This pattern and the extremely high PLC values reported in the branches and roots of this species during this extreme drought are consistent with the reduction of the relative use of groundwater by Q. ilex trees in the same study area in summer 2011 [70].

4.3. Comparison of Mixed vs. Pure Stands and Implications for Vegetation Dynamics under Climate Change

Our study allows for the comparison of physiological drought responses in two species involved in an ongoing drought-induced vegetation shift, including both mixed stands where the species coexist and pure stands where either species dominates the canopy. Species-specific values of Ψ were affected by the SWC range in each stand, but also by stand type effects. The stomatal response of Q. ilex to SWC and VPD across stand types appeared to be less plastic than that of P. sylvestris. We also found differences in the species-specific relationships between PLC and drought drivers, especially SWC, between stand types (Figure 7 and Figure 8), but these differences did not translate into varying rates of decline in kS–L with SWC in either species. However, the stand type effect on the intercepts caused, in pure stands, Q. ilex to show higher kS–L values at a given SWC compared to P. sylvestris, whereas the opposite occurred in mixed stands. As a result, the SWC value at which kS–L reached a value of ~0 was lower in Q. ilex compared to P. sylvestris in pure stands, but the opposite appeared to be true in mixed stands (Figure 6). The higher PLC in Q. ilex mixed stand could explain the smaller kS–L for the same values of SWC of Q. ilex compared to P. sylvestris. Moreover, this threshold SWC tended to be lower in mixed compared to pure stands. However, Q. ilex trees showed similar water potentials and Gs,md in mixed and pure stands. Altogether, these results suggest that Q. ilex in the study area (Tillar valley) is able to cope with current levels of summer drought even in pure stands where its canopy is totally exposed to solar radiation and high VPD values.
The previous results suggest that the ongoing replacement of P. sylvestris by Q. ilex trees in the study area [37] will likely continue. It seems clear that Q. ilex can maintain a pure canopy under current climate conditions. However, the die-off observed for this species growing under somewhat drier conditions (south-facing slopes of the same Tillar or the nearby Torners valleys [36,70]) also shows that if conditions become substantially drier, as predicted under climate change [71], other species may end up dominating the forest [72]. Importantly, similar processes to those described here seem to be operating in other areas along the dry distribution limit of P. sylvestris [21,73]. In determining what will be the consequences of these vegetation changes for the whole ecosystem (e.g., catchment level), carbon and water flux emerge as important research questions. Our results suggest that substantial differences in seasonal water fluxes are to be expected, as the more anisohydric Q. ilex maintains relatively high transpiration rates for longer during seasonal drought. However, more research is needed to scale these results to yearly water and carbon fluxes under current and future climate conditions.

Supplementary Files

Supplementary File 1

Acknowledgments

This work was funded by competitive grants CSD2008-0004, CGL2010-16373, and CGL2013-46808-R from the Spanish Ministry of Economy and Competitiveness, and an FPU doctoral fellowship through the Spanish Ministry of Education, Culture and Sport awarded to David Aguadé (AP2010-4573). The authors would like to thank Lucía Galiano for assistance in field sampling and carbohydrates analysis. We also thank all the staff from the Poblet Forest Natural Reserve for allowing us to carry out this research in these forests.

Author Contributions

David Aguadé, Rafael Poyatos, Teresa Rosas, and Jordi Martínez-Vilalta conceived and designed the experiments. David Aguadé, Rafael Poyatos and Jordi Martínez-Vilalta performed the sap flow and water potential measurements. David Aguadé and Teresa Rosas performed the NSC samplings and analysis. David Aguadé, Rafael Poyatos and Jordi Martínez-Vilalta performed the data analysis. David Aguadé, Rafael Poyatos, and Jordi Martínez-Vilalta wrote the paper.

Conflicts of Interest

The authors declare no conflict of interest.

References

  1. Chaves, M.M.; Pereira, J.S.; Maroco, J.; Rodrigues, M.L.; Ricardo, C.P.P.; Osório, M.L.; Carvalho, I.; Faria, T.; Pinheiro, C. How plants cope with water stress in the field? Photosynthesis and growth. Ann. Bot. 2002, 89, 907–916. [Google Scholar] [CrossRef] [PubMed]
  2. Allen, C.D.; Macalady, A.K.; Chenchouni, H.; Bachelet, D.; McDowell, N.; Vennetier, M.; Kitzberger, T.; Rigling, A.; Breshears, D.D.; Hogg, E.H. A global overview of drought and heat-induced tree mortality reveals emerging climate change risks for forests. For. Ecol. Manag. 2010, 259, 660–684. [Google Scholar] [CrossRef]
  3. Williams, A.P.; Allen, C.D.; Macalady, A.K.; Griffin, D.; Woodhouse, C.A.; Meko, D.M.; Swetnam, T.W.; Rauscher, S.A.; Seager, R.; Grissino-Mayer, H.D. Temperature as a potent driver of regional forest drought stress and tree mortality. Nat. Clim. Chang. 2012, 3, 292–297. [Google Scholar] [CrossRef]
  4. Dore, M.H.I. Climate change and changes in global precipitation patterns: What do we know? Environ. Int. 2005, 31, 1167–1181. [Google Scholar] [CrossRef] [PubMed]
  5. Grulke, N.E.; Minnich, R.A.; Paine, T.D.; Seybold, S.J.; Chavez, D.J.; Fenn, M.E.; Riggan, P.J.; Dunn, A. Air pollution increases forest susceptibility to wildfires: A case study in the San Bernardino Mountains in southern California. In Wildland Fires and Air Pollution; Bytnerowicz, A., Arbaugh, M.J., Riebau, A.R., Andersen, C., Eds.; Elsevier Publishers: The Hague, The Netherlands, 2008; Volume 8, pp. 365–403. [Google Scholar]
  6. Linares, J.C.; Camarero, J.J.; Carreira, J.A. Interacting effects of climate and forest-cover changes on mortality and growth of the southernmost European fir forests. Glob. Ecol. Biogeogr. 2009, 18, 485–497. [Google Scholar] [CrossRef]
  7. Jian, Z.; Shongming, H.; Fangliang, H. Half-century evidence from western Canada shows forest dynamics are primarly driven by competition followed by climate. Proc. Natl. Acad. Sci. 2015, 12, 4009–4014. [Google Scholar]
  8. Jones, H.G. Stomatal control of photosynthesis and transpiration. J. Exp. Bot. 1998, 49, 387–398. [Google Scholar] [CrossRef]
  9. Tardieu, F.; Simonneau, T. Variability among species of stomatal control under fluctuating soil water status and evaporative demand: Modelling isohydric and anisohydric behaviours. J. Exp. Bot. 1998, 49, 419–432. [Google Scholar] [CrossRef]
  10. McDowell, N.; Pockman, W.T.; Allen, C.D.; Breshears, D.D.; Cobb, N.; Kolb, T.; Plaut, J.; Sperry, J.; West, A.; Williams, D.G.; Yepez, E.A. Mechanisms of plant survival and mortality during drought: Why do some plants survive while others succumb to drought? New Phytol. 2008, 178, 719–739. [Google Scholar] [CrossRef] [PubMed]
  11. Klein, T. The variability of stomatal sensitivity to leaf water potential across tree species indicates a continuum between isohydric and anisohydric behaviours. Funct. Ecol. 2014, 28, 1313–1320. [Google Scholar] [CrossRef]
  12. Martínez-Vilalta, J.; Poyatos, R.; Aguadé, D.; Retana, J.; Mencuccini, M. A new look at water transport regulation in plants. New Phytol. 2014, 204, 105–115. [Google Scholar] [CrossRef] [PubMed]
  13. Domec, J.-C.; Johnson, D.M. Does homeostasis or disturbance of homeostasis in minimum leaf water potential explain the isohydric versus anisohydric behavior of Vitis vinifera L. Cultivars? Tree Physiol. 2012, 32, 245–248. [Google Scholar] [CrossRef] [PubMed]
  14. Brodribb, T.J.; McAdam, S.A.M.; Jordan, G.J.; Martins, S.C.V. Conifer species adapt to low-rainfall climates by following one of two divergent pathways. Proc. Natl. Acad. Sci. 2014, 111, 14489–14493. [Google Scholar] [CrossRef] [PubMed]
  15. Gollan, T.; Turner, N.C.; Schulze, E.D. The responses of stomata and leaf gas exchange to vapour pressure deficits and soil water content. Oecologia 1985, 65, 356–362. [Google Scholar] [CrossRef]
  16. Hartmann, H.; Ziegler, W.; Kolle, O.; Trumbore, S. Thirst beats hunger-declining hydration during drought prevents carbon starvation in Norway spruce saplings. New Phytol. 2013, 200, 340–349. [Google Scholar] [CrossRef] [PubMed]
  17. Bréda, N.; Cochard, H.; Dreyer, E.; Granier, A. Water transfer in a mature oak stand (Quercus petraea): Seasonal evolution and effects of a severe drought. Can. J. For. Res. 1993, 23, 1136–1143. [Google Scholar] [CrossRef]
  18. Eamus, D.; Boulain, N.; Cleverly, J.; Breshears, D.D. Global change-type drought-induced tree mortality: Vapor pressure deficit is more important than temperature per se in causing decline in tree health. Ecol. Evol. 2013, 3, 2711–2729. [Google Scholar] [CrossRef] [PubMed]
  19. Quero, J.L.; Sterck, F.J.; Martínez-Vilalta, J.; Villar, R. Water-use strategies of six co-existing Mediterranean woody species during a summer drought. Oecologia 2011, 166, 45–57. [Google Scholar] [CrossRef] [PubMed]
  20. Allen, C.D.; Breshears, D.D. Drought-induced shift of a forest-woodland ecotone: Rapid landscape response to climate variation. Proc. Natl. Acad. Sci. 1998, 95, 14839–14842. [Google Scholar] [CrossRef] [PubMed]
  21. Galiano, L.; Martínez-Vilalta, J.; Lloret, F. Drought-induced multifactor decline of Scots pine in the Pyrenees and potential vegetation change by the expansion of co-occurring Oak species. Ecosystems 2010, 13, 978–991. [Google Scholar] [CrossRef]
  22. Lloret, F.; Escudero, A.; Iriondo, J.M.; Martínez-Vilalta, J.; Valladares, F. Extreme climatic events and vegetation: The role of stabilizing processes. Glob. Chang. Biol 2012, 18, 797–805. [Google Scholar] [CrossRef]
  23. Filella, I.; Llusià, J.; Piñol, J.; Peñuelas, J. Leaf gas exchange and fluorescence of Phillyrea latifolia, Pistacia lentiscus and Quercus ilex saplings in severe drought and high temperature conditions. Environ. Exp. Bot. 1998, 39, 213–220. [Google Scholar] [CrossRef]
  24. Anderegg, W.R.L.; Berry, J.A.; Smith, D.D.; Sperry, J.S.; Anderegg, L.D.L.; Field, C.B. The roles of hydraulic and carbon stress in a widespread climate-induced forest die-off. Proc. Natl. Acad. Sci. 2012, 109, 233–237. [Google Scholar] [CrossRef] [PubMed]
  25. Holmgren, M.; Gómez-Aparicio, L.; Quero, J.L.; Valladares, F. Non-linear effects of drought under shade: Reconciling physiological and ecological models in plant communities. Oecologia 2012, 169, 293–305. [Google Scholar] [CrossRef] [PubMed] [Green Version]
  26. Poyatos, R.; Martínez-Vilalta, J.; Čermák, J.; Ceulemans, R.; Granier, A.; Irvine, J.; Köstner, B.; Lagergren, F.; Meiresonne, L.; Nadezhdina, N.; Zimmermann, R.; Llorens, P.; Mencuccini, M. Plasticity in hydraulic architecture of Scots pine across Eurasia. Oecologia 2007, 153, 245–259. [Google Scholar] [CrossRef] [PubMed]
  27. Martin-StPaul, N.K.; Limousin, J.-M.; Vogt-Schilb, H.; Rodríguez-Calcerrada, J.; Rambal, S.; Longepierre, D.; Misson, L. The temporal response to drought in a Mediterranean evergreen tree: Comparing a regional precipitation gradient and a throughfall exclusion experiment. Glob. Chang. Biol. 2013, 19, 2413–2426. [Google Scholar] [CrossRef] [PubMed]
  28. Poyatos, R.; Aguadé, D.; Galiano, L.; Mencuccini, M.; Martínez-Vilalta, J. Drought-induced defoliation and long periods of near-zero gas exchange play a key role in accentuating metabolic decline of Scots pine. New Phytol. 2013, 200, 388–401. [Google Scholar] [CrossRef] [PubMed]
  29. Irvine, J.; Perks, M.P.; Magnani, F.; Grace, J. The response of Pinus sylvestris to drought: Stomatal control of transpiration and hydraulic conductance. Tree Physiol. 1998, 18, 393–402. [Google Scholar] [CrossRef] [PubMed]
  30. Aguadé, D.; Poyatos, R.; Gómez, M.; Oliva, J.; Martínez-Vilalta, J. The role of defoliation and root rot pathogen infection in driving the mode of drought-related physiological decline in Scots pine (Pinus sylvestris L.). Tree Physiol. 2015. [Google Scholar] [CrossRef] [PubMed]
  31. Galiano, L.; Martínez-Vilalta, J.; Lloret, F. Carbon reserves and canopy defoliation determine the recovery of Scots pine 4 yr after a drought episode. New Phytol. 2011, 190, 750–759. [Google Scholar] [CrossRef] [PubMed]
  32. Barbeta, A.; Ogaya, R.; Peñuelas, J. Comparative study of diurnal and nocturnal sap flow of Quercus ilex and Phillyrea latifolia in a Mediterranean Holm oak forest in Prades (Catalonia, NE Spain). Trees-Struct. Funct. 2012, 26, 1651–1659. [Google Scholar] [CrossRef]
  33. Martínez-Vilalta, J.; Mangirón, M.; Ogaya, R.; Sauret, M.; Serrano, L.; Peñuelas, J.; Piñol, J. Sap flow of three co-occurring Mediterranean woody species under varying atmospheric and soil water conditions. Tree Physiol. 2003, 23, 747–758. [Google Scholar] [CrossRef] [PubMed]
  34. Galiano, L.; Martínez-Vilalta, J.; Sabaté, S.; Lloret, F. Determinants of drought effects on crown condition and their relationship with depletion of carbon reserves in a Mediterranean holm oak forest. Tree Physiol. 2012, 32, 478–489. [Google Scholar] [CrossRef] [PubMed]
  35. Martínez-Vilalta, J.; Piñol, J. Drought-induced mortality and hydraulic architecture in pine populations of the NE Iberian Peninsula. For. Ecol. Manag. 2002, 161, 247–256. [Google Scholar] [CrossRef]
  36. Ogaya, R.; Barbeta, A.; Başnou, C.; Peñuelas, J. Satellite data as indicators of tree biomass growth and forest dieback in a Mediterranean Holm oak forest. Ann. For. Sci. 2015, 72, 135–144. [Google Scholar] [CrossRef]
  37. Vilà-Cabrera, A.; Martínez-Vilalta, J.; Galiano, L.; Retana, J. Patterns of forest decline and regeneration across Scots pine populations. Ecosystems 2013, 16, 323–335. [Google Scholar] [CrossRef]
  38. Poyatos, R. CREAF, Cerdanyola del Vallès, Spain. Unpublished work. 2015. [Google Scholar]
  39. Ogaya, R.; Peñuelas, J. Phenological patterns of Quercus ilex, Phillyrea latifolia, and Arbutus unedo growing under a field experimental drought. Ecoscience 2004, 11, 263–270. [Google Scholar]
  40. Hereş, A.M.; Martínez-Vilalta, J.; López, B.C. Growth patterns in relation to drought-induced mortality at two Scots pine (Pinus sylvestris L.) sites in NE Iberian peninsula. Trees-Struct. Func. 2012, 26, 621–630. [Google Scholar] [CrossRef]
  41. Martínez-Vilalta, J. Universitat Autònoma de Barcelona. Personal communication, 2014. [Google Scholar]
  42. Rosas, T.; Galiano, L.; Ogaya, R.; Peñuelas, J.; Martínez-Vilalta, J. Dynamics of non-structural carbohydrates in three Mediterranean woody species following long-term experimental drought. Front. Plant Sci. 2013, 4, 400. [Google Scholar] [CrossRef] [PubMed]
  43. Ogaya Inurrigarra, R. Plant Ecophysiological Responses to a Field Experimental Drought in the Prades Holm Oak Forest; Universitat Autònoma de Barcelona: Cerdanyola del Vallès, Spain, 2003. [Google Scholar]
  44. Phillips, N.; Oren, R. A comparison of daily representations of canopy conductance based on two conditional time-averaging methods and the dependence of daily conductance on environmental factors. Ann. For. Sci. 1998, 55, 217–235. [Google Scholar] [CrossRef]
  45. Irvine, J.; Law, B.E.; Kurpius, M.R.; Anthoni, P.M.; Moore, D.; Schwarz, P.A. Age-related changes in ecosystem structure and function and effects on water and carbon exchange in Ponderosa pine. Tree Physiol. 2004, 24, 753–763. [Google Scholar] [CrossRef] [PubMed]
  46. Pammenter, N.W.; van Der Willigen, C. A mathematical and statistical analysis of the curves illustrating vulnerability of xylem to cavitation. Tree Physiol. 1998, 18, 589–593. [Google Scholar] [CrossRef] [PubMed]
  47. Martínez-Vilalta, J.; Prat, E.; Oliveras, I.; Piñol, J. Xylem hydraulic properties of roots and stems of nine woody species from a Holm oak forest in NE Spain. Oecologia 2002, 133, 19–29. [Google Scholar] [CrossRef] [PubMed]
  48. Martin-StPaul, N.K.; Longepierre, D.; Huc, R.; Delzon, S.; Burlett, R.; Joffre, R.; Rambal, S.; Cochard, H. How reliable are methods to assess xylem vulnerability to cavitation? The issue of ‘open vessel’ artifact in oaks. Tree Physiol. 2014, 34, 894–905. [Google Scholar] [CrossRef] [PubMed]
  49. Hoch, G.; Popp, M.; Körner, C. Altitudinal increase of mobile carbon pools in Pinus cembra suggests sink limitation of growth at the Swiss treeline. Oikos 2002, 98, 361–374. [Google Scholar] [CrossRef]
  50. Martínez-Vilalta, J.; Cochard, H.; Mencuccini, M.; Sterck, F.; Herrero, A.; Korhonen, J.F.J.; Llorens, P.; Nikinmaa, E.; Nolè, A.; Poyatos, R.; Ripullone, F.; Sass-Klaassen, U.; Zweifel, R. Hydraulic adjustment of Scots pine across Europe. New Phytol. 2009, 184, 353–364. [Google Scholar] [CrossRef] [PubMed]
  51. Zweifel, R.; Steppe, K.; Sterck, F.J. Stomatal regulation by microclimate and tree water relations: Interpreting ecophysiological field data with a hydraulic plant model. J. Exp. Bot. 2007, 58, 2113–2131. [Google Scholar] [CrossRef] [PubMed]
  52. Baquedano, F.J.; Castillo, F.J. Drought tolerance in the Mediterranean species Quercus coccifera, Quercus ilex, Pinus halepensis, and Juniperus phoenicea. Photosynthetica 2007, 45, 229–238. [Google Scholar] [CrossRef]
  53. Duursma, R.A.; Kolari, P.; Peramaki, M.; Nikinmaa, E.; Hari, P.; Delzon, S.; Loustau, D.; Ilvesniemi, H.; Pumpanen, J.; Makela, A. Predicting the decline in daily maximum transpiration rate of two pine stands during drought based on constant minimum leaf water potential and plant hydraulic conductance. Tree Physiol. 2008, 28, 265. [Google Scholar] [CrossRef] [PubMed]
  54. Warren, J.M.; Meinzer, F.C.; Brooks, J.R.; Domec, J.C. Vertical stratification of soil water storage and release dynamics in pacific northwest coniferous forests. Agric. For. Meteorol. 2005, 130, 39–58. [Google Scholar] [CrossRef]
  55. Canadell, J.; Jackson, R.B.; Ehleringer, J.B.; Mooney, H.A.; Sala, O.E.; Schulze, E.D. Maximum rooting depth of vegetation types at the global scale. Oecologia 1996, 108, 583–595. [Google Scholar] [CrossRef]
  56. Kolb, T.E.; Stone, J.E. Differences in leaf gas exchange and water relations among species and tree sizes in an Arizona pine-oak forest. Tree Physiol. 2000, 20, 1–12. [Google Scholar] [CrossRef] [PubMed]
  57. Donovan, L.A.; Richards, J.H.; Linton, M.J. Magnitude and mechanisms of disequilibrium between predawn plant and soil water potentials. Ecology 2003, 84, 463–470. [Google Scholar] [CrossRef]
  58. Plaut, J.A.; Yepez, E.A.; Hill, J.; Pangle, R.; Sperry, J.S.; Pockman, W.T.; McDowell, N.G. Hydraulic limits preceding mortality in a piñon-juniper woodland under experimental drought. Plant, Cell & Environ. 2012, 35, 1601–1617. [Google Scholar]
  59. Nardini, A.; Gullo, M.A.L.; Trifilò, P.; Salleo, S. The challenge of the Mediterranean climate to plant hydraulics: Responses and adaptations. Environ. Exp. Bot. 2014, 103, 68–79. [Google Scholar] [CrossRef]
  60. Cochard, H.; Badel, E.; Herbette, S.; Delzon, S.; Choat, B.; Jansen, S. Methods for measuring plant vulnerability to cavitation: A critical review. J. Exp. Bot. 2013. [Google Scholar] [CrossRef] [PubMed]
  61. Torres-Ruiz, J.M.; Cochard, H.; Mayr, S.; Beikircher, B.; Diaz-Espejo, A.; Rodriguez-Dominguez, C.M.; Badel, E.; Fernández, J.E. Vulnerability to cavitation in Olea europaea current-year shoots: Further evidence of an open-vessel artifact associated with centrifuge and air-injection techniques. Physiol. Plant. 2014, 152, 465–474. [Google Scholar] [CrossRef] [PubMed]
  62. Urli, M.; Lamy, J.-B.; Sin, F.; Burlett, R.; Delzon, S.; Porté, A.J. The high vulnerability of Quercus robur to drought at its southern margin paves the way for Quercus ilex. Plant Ecol. 2015, 216, 177–187. [Google Scholar] [CrossRef]
  63. Peguero-Pina, J.J.; Sancho-Knapik, D.; Barrón, E.; Camarero, J.J.; Vilagrosa, A.; Gil-Pelegrín, E. Morphological and physiological divergences within Quercus ilex support the existence of different ecotypes depending on climatic dryness. Ann. Bot. 2014, 114, 301–313. [Google Scholar] [CrossRef] [PubMed]
  64. Salmon, Y.; Torres-Ruiz, J.M.; Poyatos, R.; Martínez-Vilalta, J.; Meir, P.; Cochard, H.; Mencuccini, M. Balancing the risks of hydraulic failure and carbon starvation: A twig scale analysis in declining scots pine. Plant, Cell & Environ. 2015. [Google Scholar] [CrossRef]
  65. Meinzer, F.C.; Woodruff, D.R.; Marias, D.E.; McCulloh, K.A.; Sevanto, S. Dynamics of leaf water relations components in co-occurring iso- and anisohydric conifer species. Plant, Cell & Environ. 2014, 37, 2577–2586. [Google Scholar]
  66. Limousin, J.M.; Rambal, S.; Ourcival, J.M.; Rocheteau, A.; Joffre, R.; Rodriguez Cortina, R. Long term transpiration change with rainfall decline in a Mediterranean Quercus ilex forest. Glob. Chang. Biol. 2009, 15, 2163–2175. [Google Scholar] [CrossRef]
  67. Pangle, R.E.; Limousin, J.-M.; Plaut, J.A.; Yepez, E.A.; Hudson, P.J.; Boutz, A.L.; Gehres, N.; Pockman, W.T.; McDowell, N.G. Prolonged experimental drought reduces plant hydraulic conductance and transpiration and increases mortality in a piñon-juniper woodland. Ecol. Evol. 2015, 5, 1618–1638. [Google Scholar] [CrossRef] [PubMed]
  68. Mitchell, P.J.; O’Grady, A.P.; Tissue, D.T.; White, D.A.; Ottenschlaeger, M.L.; Pinkard, E.A. Drought response strategies define the relative contributions of hydraulic dysfunction and carbohydrate depletion during tree mortality. New Phytol. 2013, 197, 862–872. [Google Scholar] [CrossRef] [PubMed]
  69. Urli, M.; Porté, A.J.; Cochard, H.; Guengant, Y.; Burlett, R.; Delzon, S. Xylem embolism threshold for catastrophic hydraulic failure in angiosperm trees. Tree Physiol. 2013, 33, 672–683. [Google Scholar] [CrossRef] [PubMed]
  70. Barbeta, A.; Mejía-Chang, M.; Ogaya, R.; Voltas, J.; Dawson, T.E.; Peñuelas, J. The combined effects of a long-term experimental drought and an extreme drought on the use of plant-water sources in a Mediterranean forest. Glob. Chang. Biolo. 2014, 21, 1213–1225. [Google Scholar] [CrossRef] [PubMed]
  71. IPCC. Climate Change 2014: Synthesis Report. Contribution of Working Groups I, II and III to Fifth Assessment Report of the Intergovernmental Panel on Climate Change; IPCC: Geneva, Switzerland, 2014; p. 151. [Google Scholar]
  72. Ogaya, R.; Peñuelas, J. Tree growth, mortality, and above-ground biomass accumulation in a Holm oak forest under a five-year experimental field drought. Plant Ecol. 2007, 189, 291–299. [Google Scholar] [CrossRef]
  73. Rigling, A.; Bigler, C.; Eilmann, B.; Feldmeyer-Christe, E.; Gimmi, U.; Ginzler, C.; Graf, U.; Mayer, P.; Vacchiano, G.; Weber, P. Driving factors of a vegetation shift from scots pine to pubescent oak in dry alpine forests. Glob. Chang. Biol. 2013, 19, 229–240. [Google Scholar] [CrossRef] [PubMed]

