
Drivers of CO2 Emission Rates from Dead Wood Logs of 13 Tree Species in the Initial Decomposition Phase


Abstract
:
1. Introduction
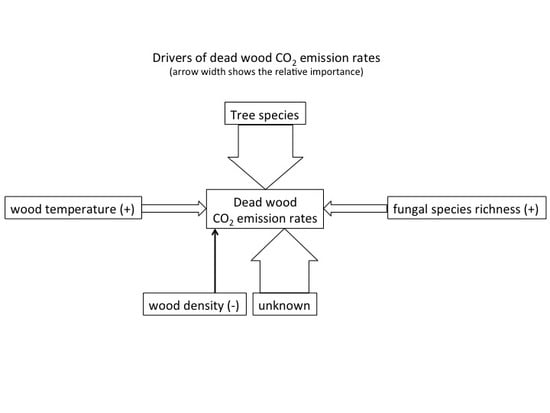
- That the variation in CO2 emission rates is predominantly explained by tree species identity and fungal species richness.
- That increasing fungal species richness accelerates decomposition.
- That the efficiency of fungal decomposers will depend on the presence of some key species.
- That differences in CO2 emission rates within dead wood tree species are influenced by environmental conditions in dead wood (e.g., temperature, water content) affecting the microbial activity.
2. Methods
2.1. Study Area

| Exploratory | Schorfheide-Chorin (S-C) | Hainich-Dün (H-D) | Swabian Alb (ALB) |
|---|---|---|---|
| Location | NE Germany | Central Germany | SW Germany |
| Geology | Young glacial landscape | Calcareous bedrock with loess layer | Calcareous bedrock with karst phenomena |
| Dominant soil type | Cambisol | Luvisol, Stagnosol | Cambisol, Leptosol |
| Altitude a.s.l. | 3–140 m | 285–550 m | 460–860 m |
| Mean annual temperature | 8–8.5 °C | 6.5–8 °C | 6–7 °C |
| Mean annual precipitation | 500–600 mm | 500–800 mm | 700–1000 mm |
| Dominant tree species | Fagus sylvatica Pinus sylvestris | Fagus sylvatica Picea abies | Fagus sylvatica Picea abies |
2.2. BELongDead Experiment
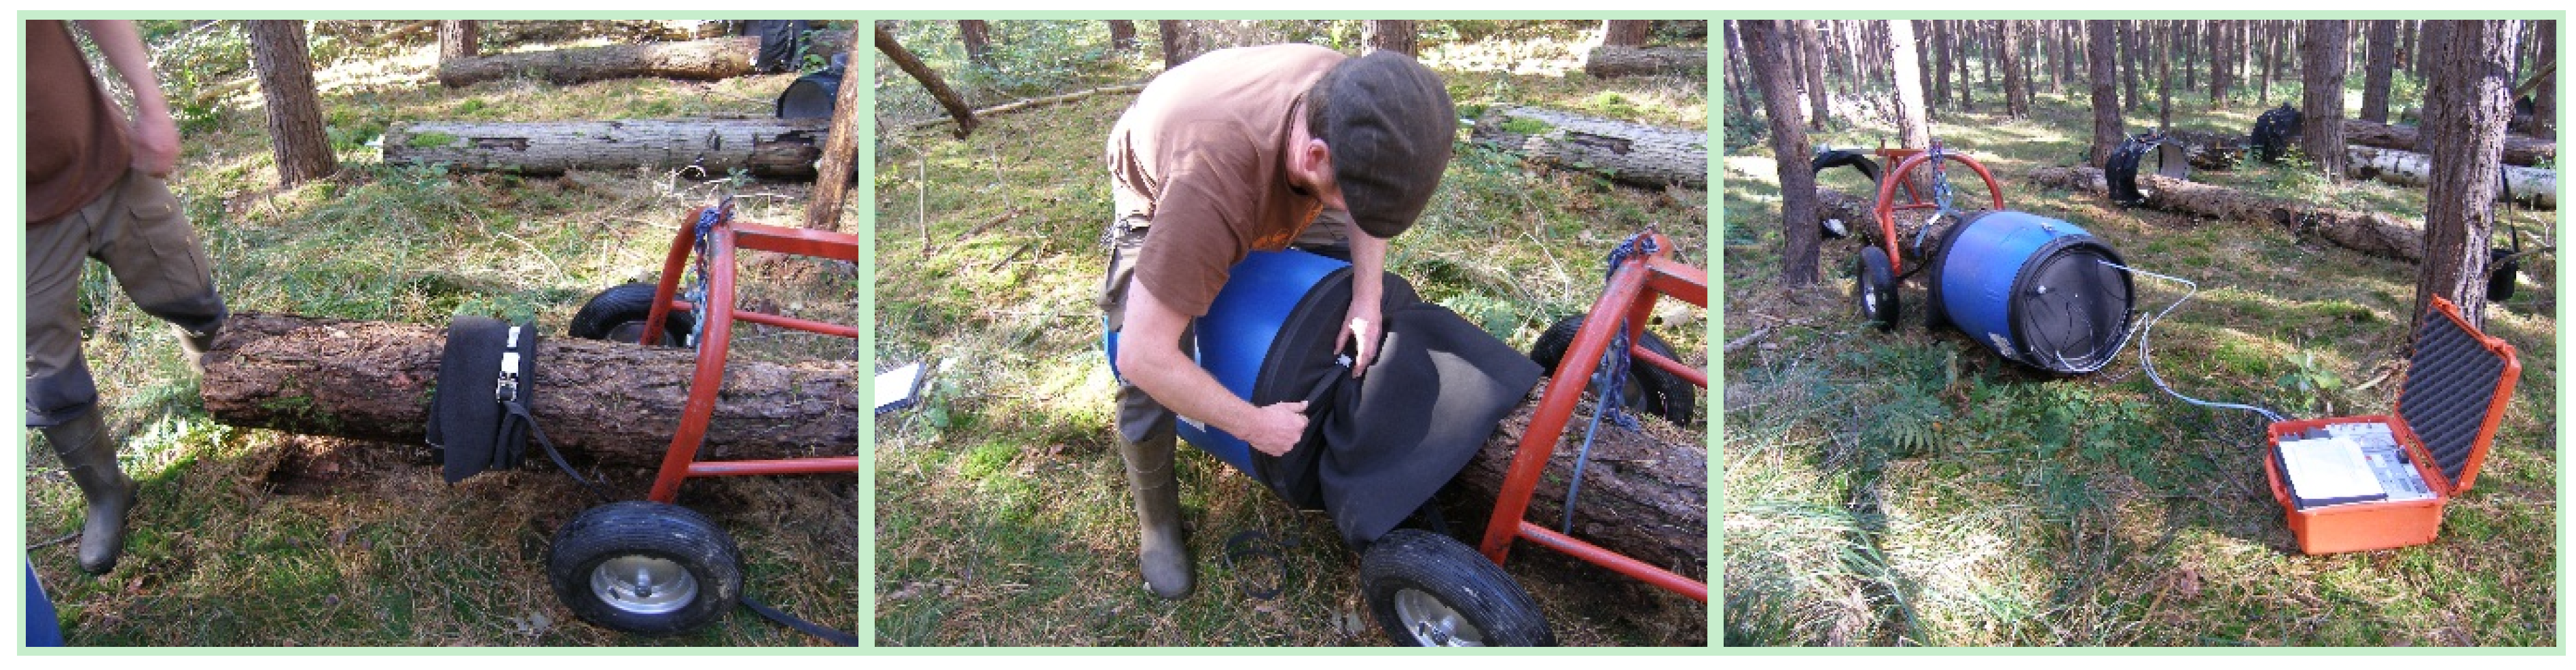
2.3. Measurement of CO2 Emission Rates
2.4. Wood Properties
2.5. Fungal Inventory
2.6. Statistical Analysis
3. Results
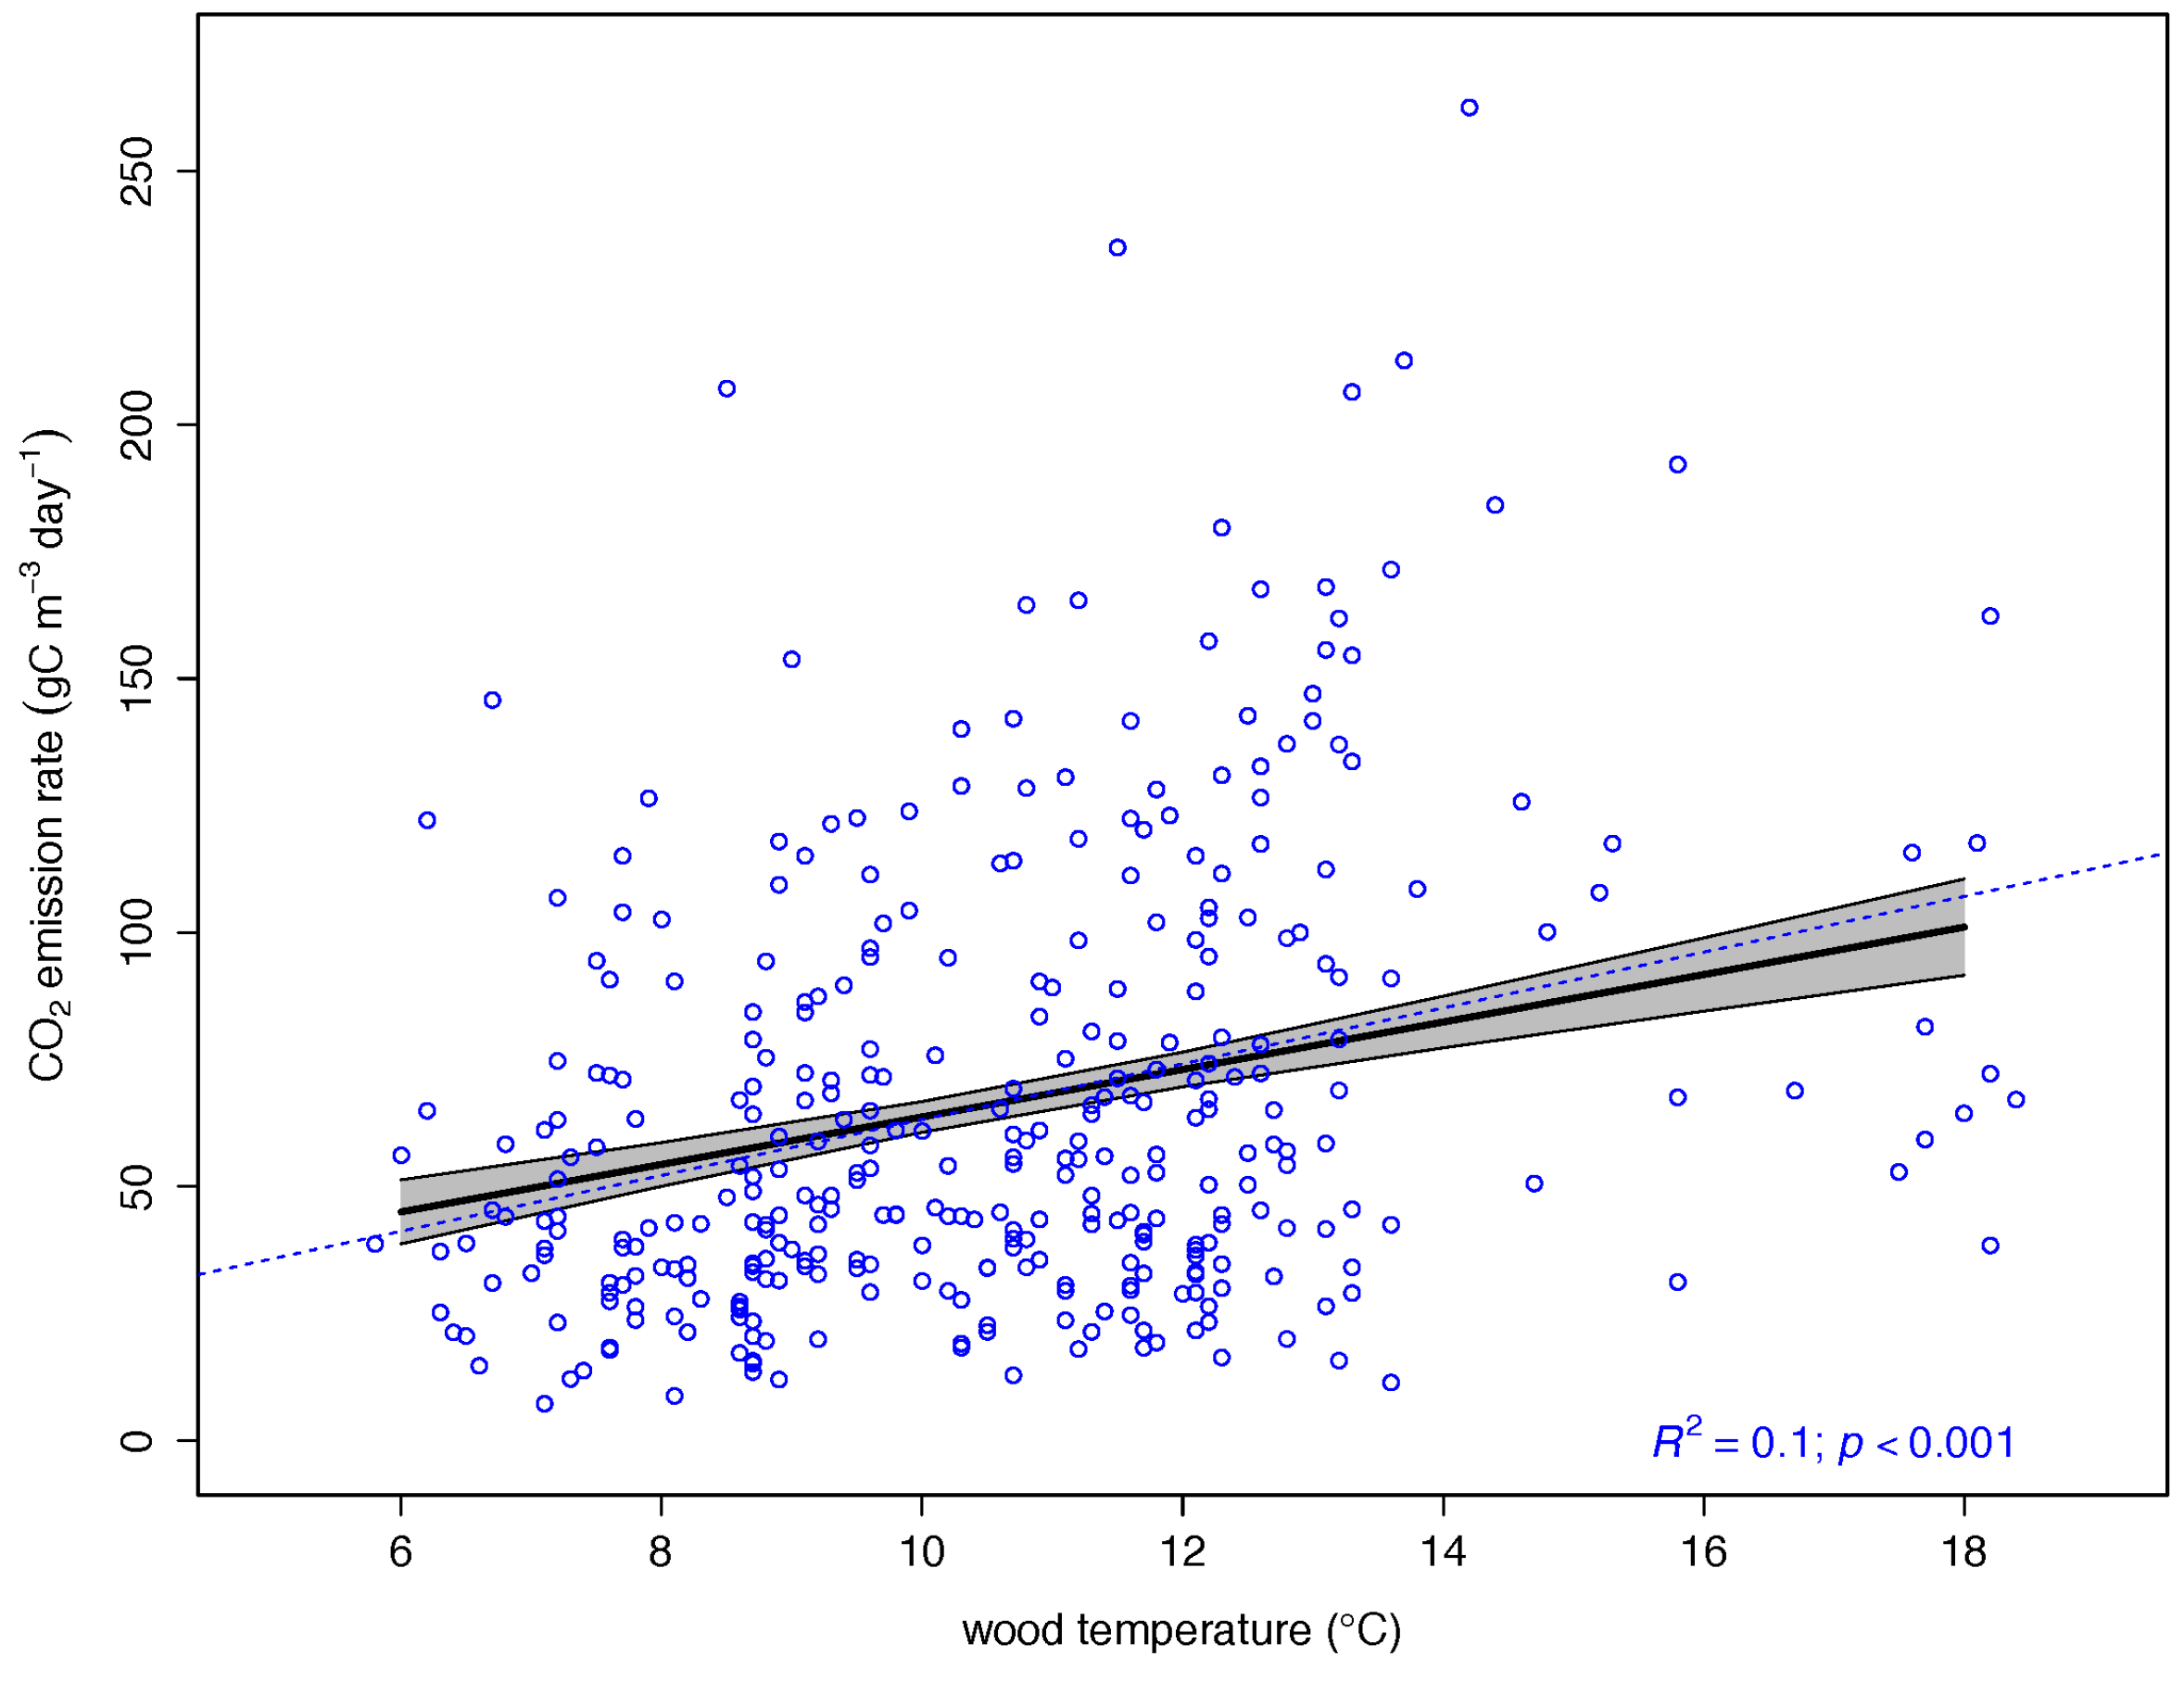
3.1. Drivers of CO2 Emission Rates
| Variable | Estimate | Standardized Coefficient | Std. Error | t value | P (1) |
|---|---|---|---|---|---|
| Acer (Intercept) | 2.8888 | 0.0000 | 0.2908 | 9.933 | 0.0000 *** |
| Betula | 0.4857 | 0.2048 | 0.1122 | 4.328 | 0.0000 *** |
| Carpinus | 0.7314 | 0.3084 | 0.1186 | 6.168 | 0.0000 *** |
| Fagus | 0.5555 | 0.2342 | 0.1143 | 4.858 | 0.0000 *** |
| Fraxinus | 0.1306 | 0.0542 | 0.1160 | 1.126 | 0.2611 |
| Larix | −0.6026 | −0.2459 | 0.1129 | −5.338 | 0.0000 *** |
| Picea | −0.1923 | −0.0798 | 0.1215 | −1.583 | 0.1144 |
| Pinus | −0.7312 | −0.3034 | 0.1145 | −6.386 | 0.0000 *** |
| Populus | −0.2200 | −0.0898 | 0.1175 | −1.872 | 0.0621 |
| Prunus | 0.3303 | 0.1116 | 0.1256 | 2.629 | 0.0090 ** |
| Pseudotsuga | −0.6641 | −0.2800 | 0.1102 | −6.025 | 0.0000 *** |
| Quercus | −0.2623 | −0.1106 | 0.1099 | −2.387 | 0.0175 * |
| Tilia | 0.1195 | 0.0496 | 0.1154 | 1.035 | 0.3012 |
| Log (wood temperature) | 0.7575 | 0.2684 | 0.0941 | 8.049 | 0.0000 *** |
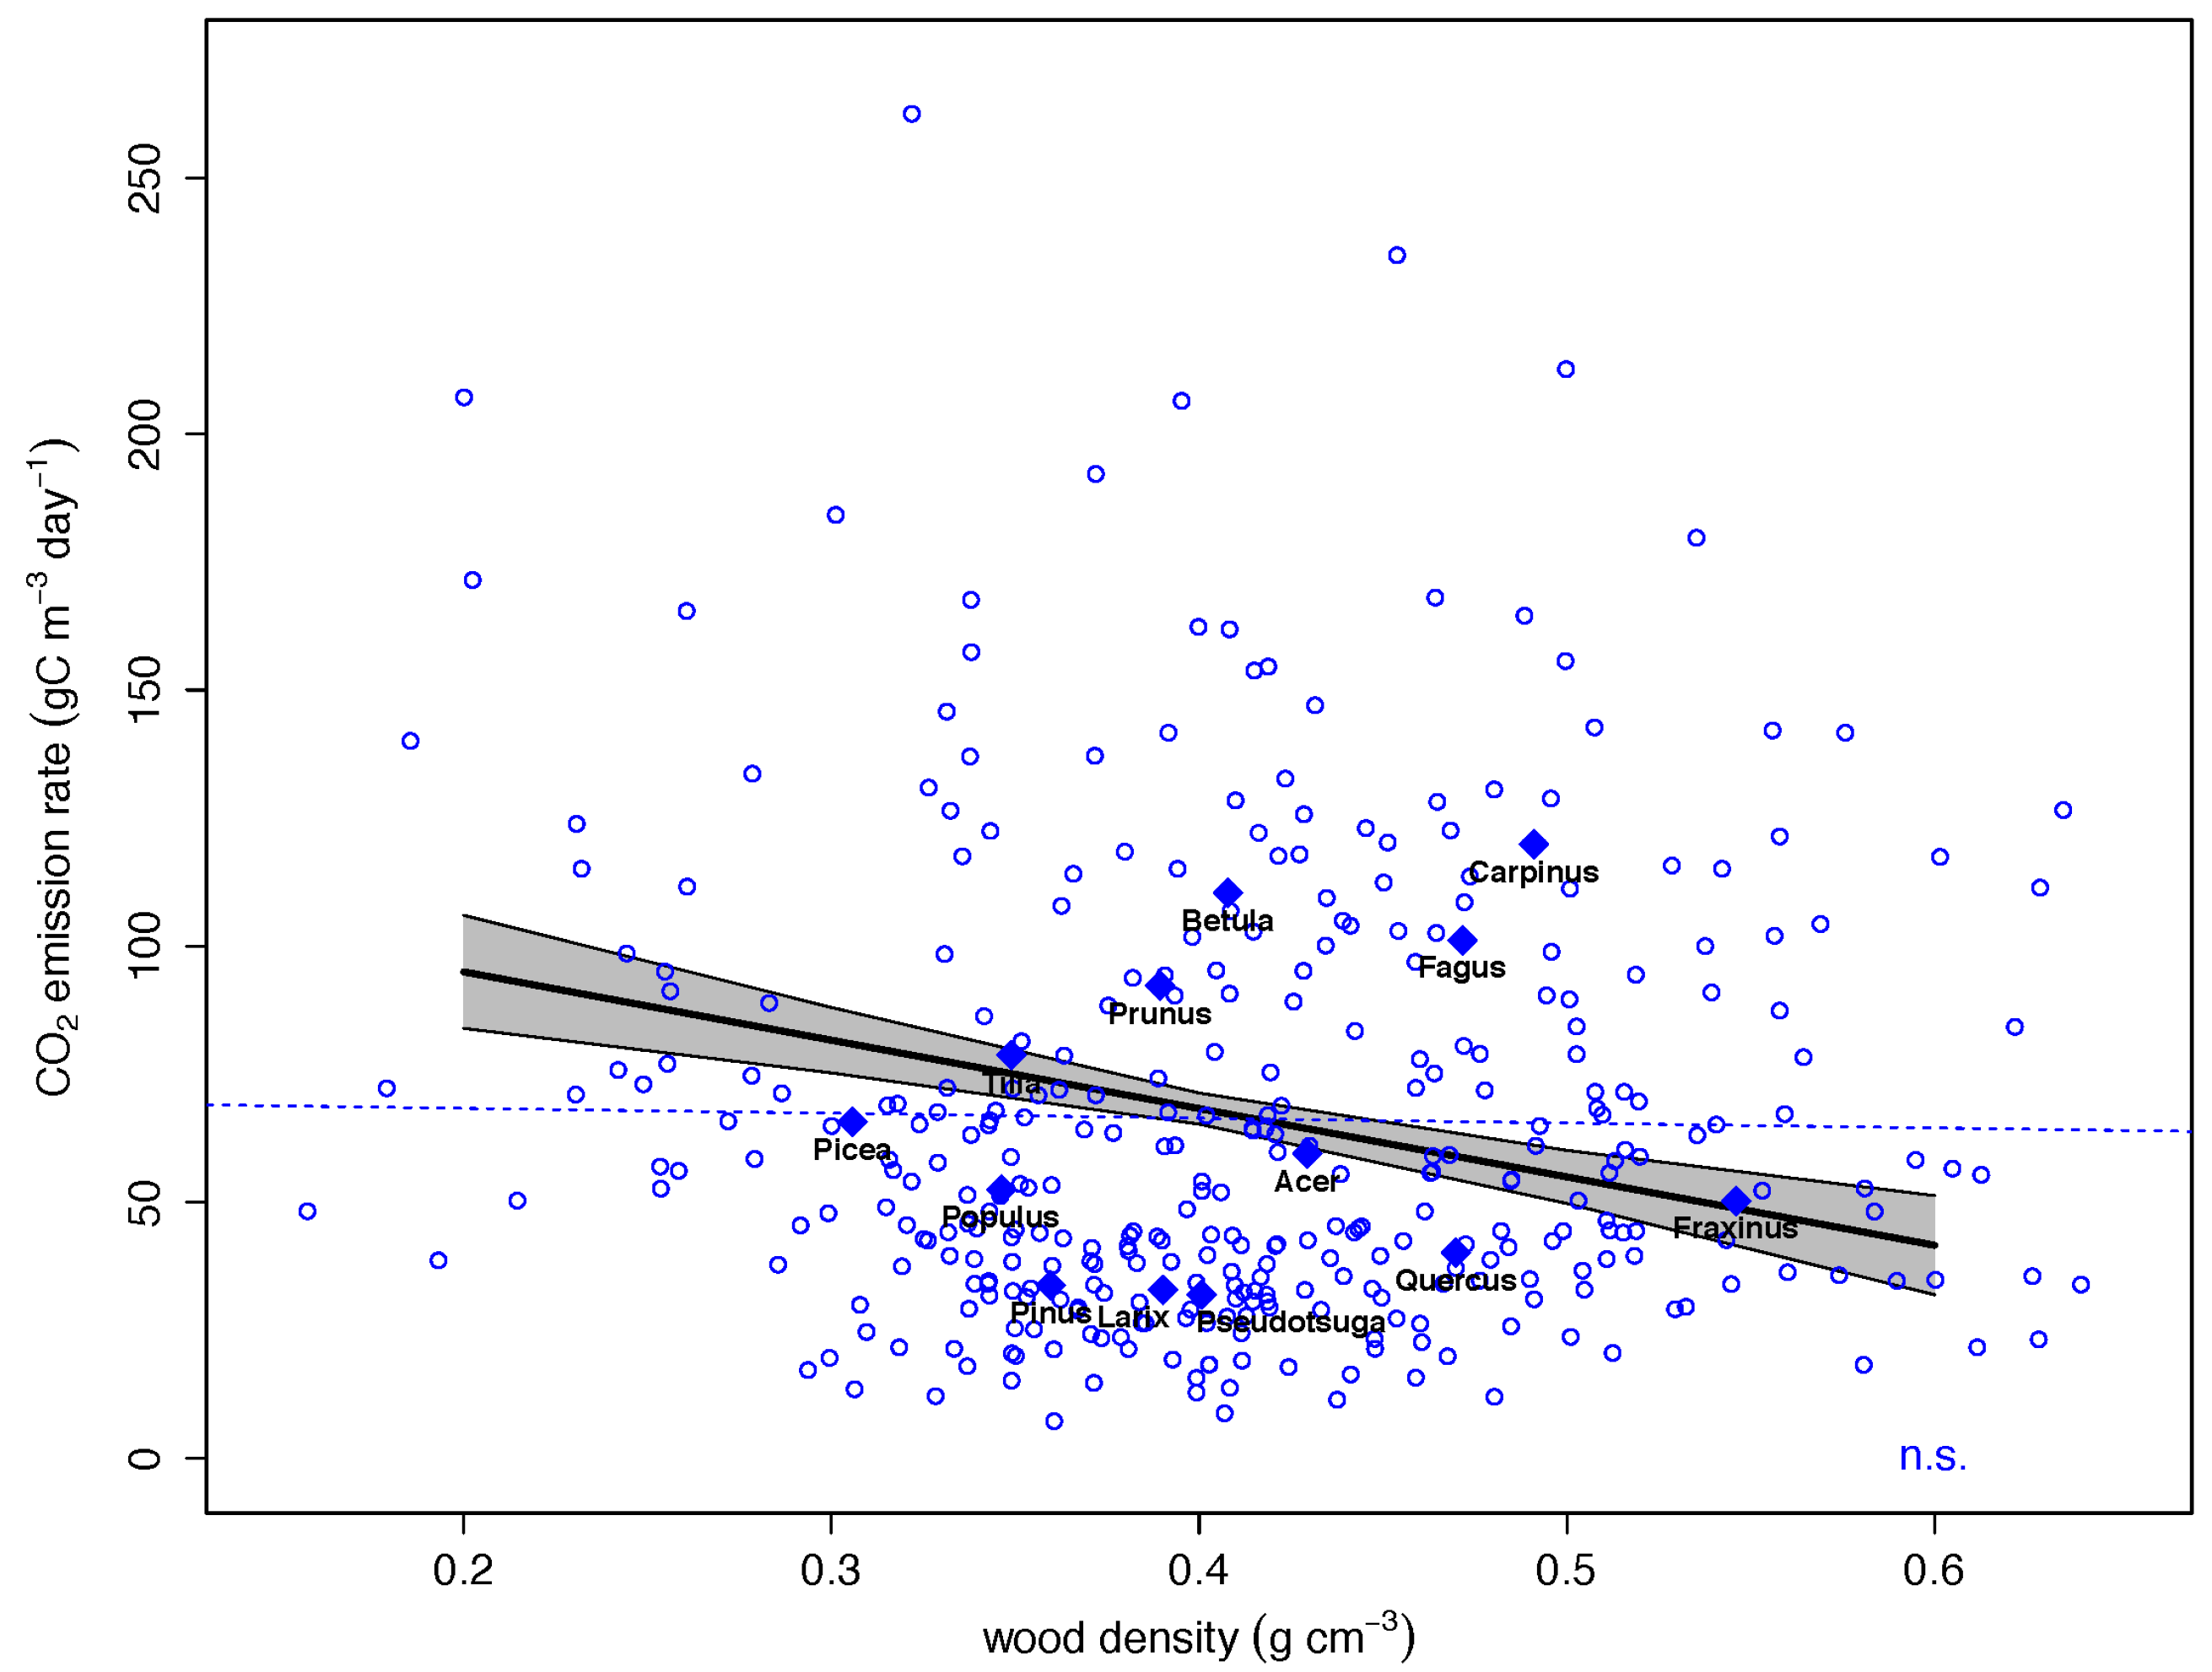
| Wood density | −1.8525 | −0.2559 | 0.3602 | −5.144 | 0.0000 *** |
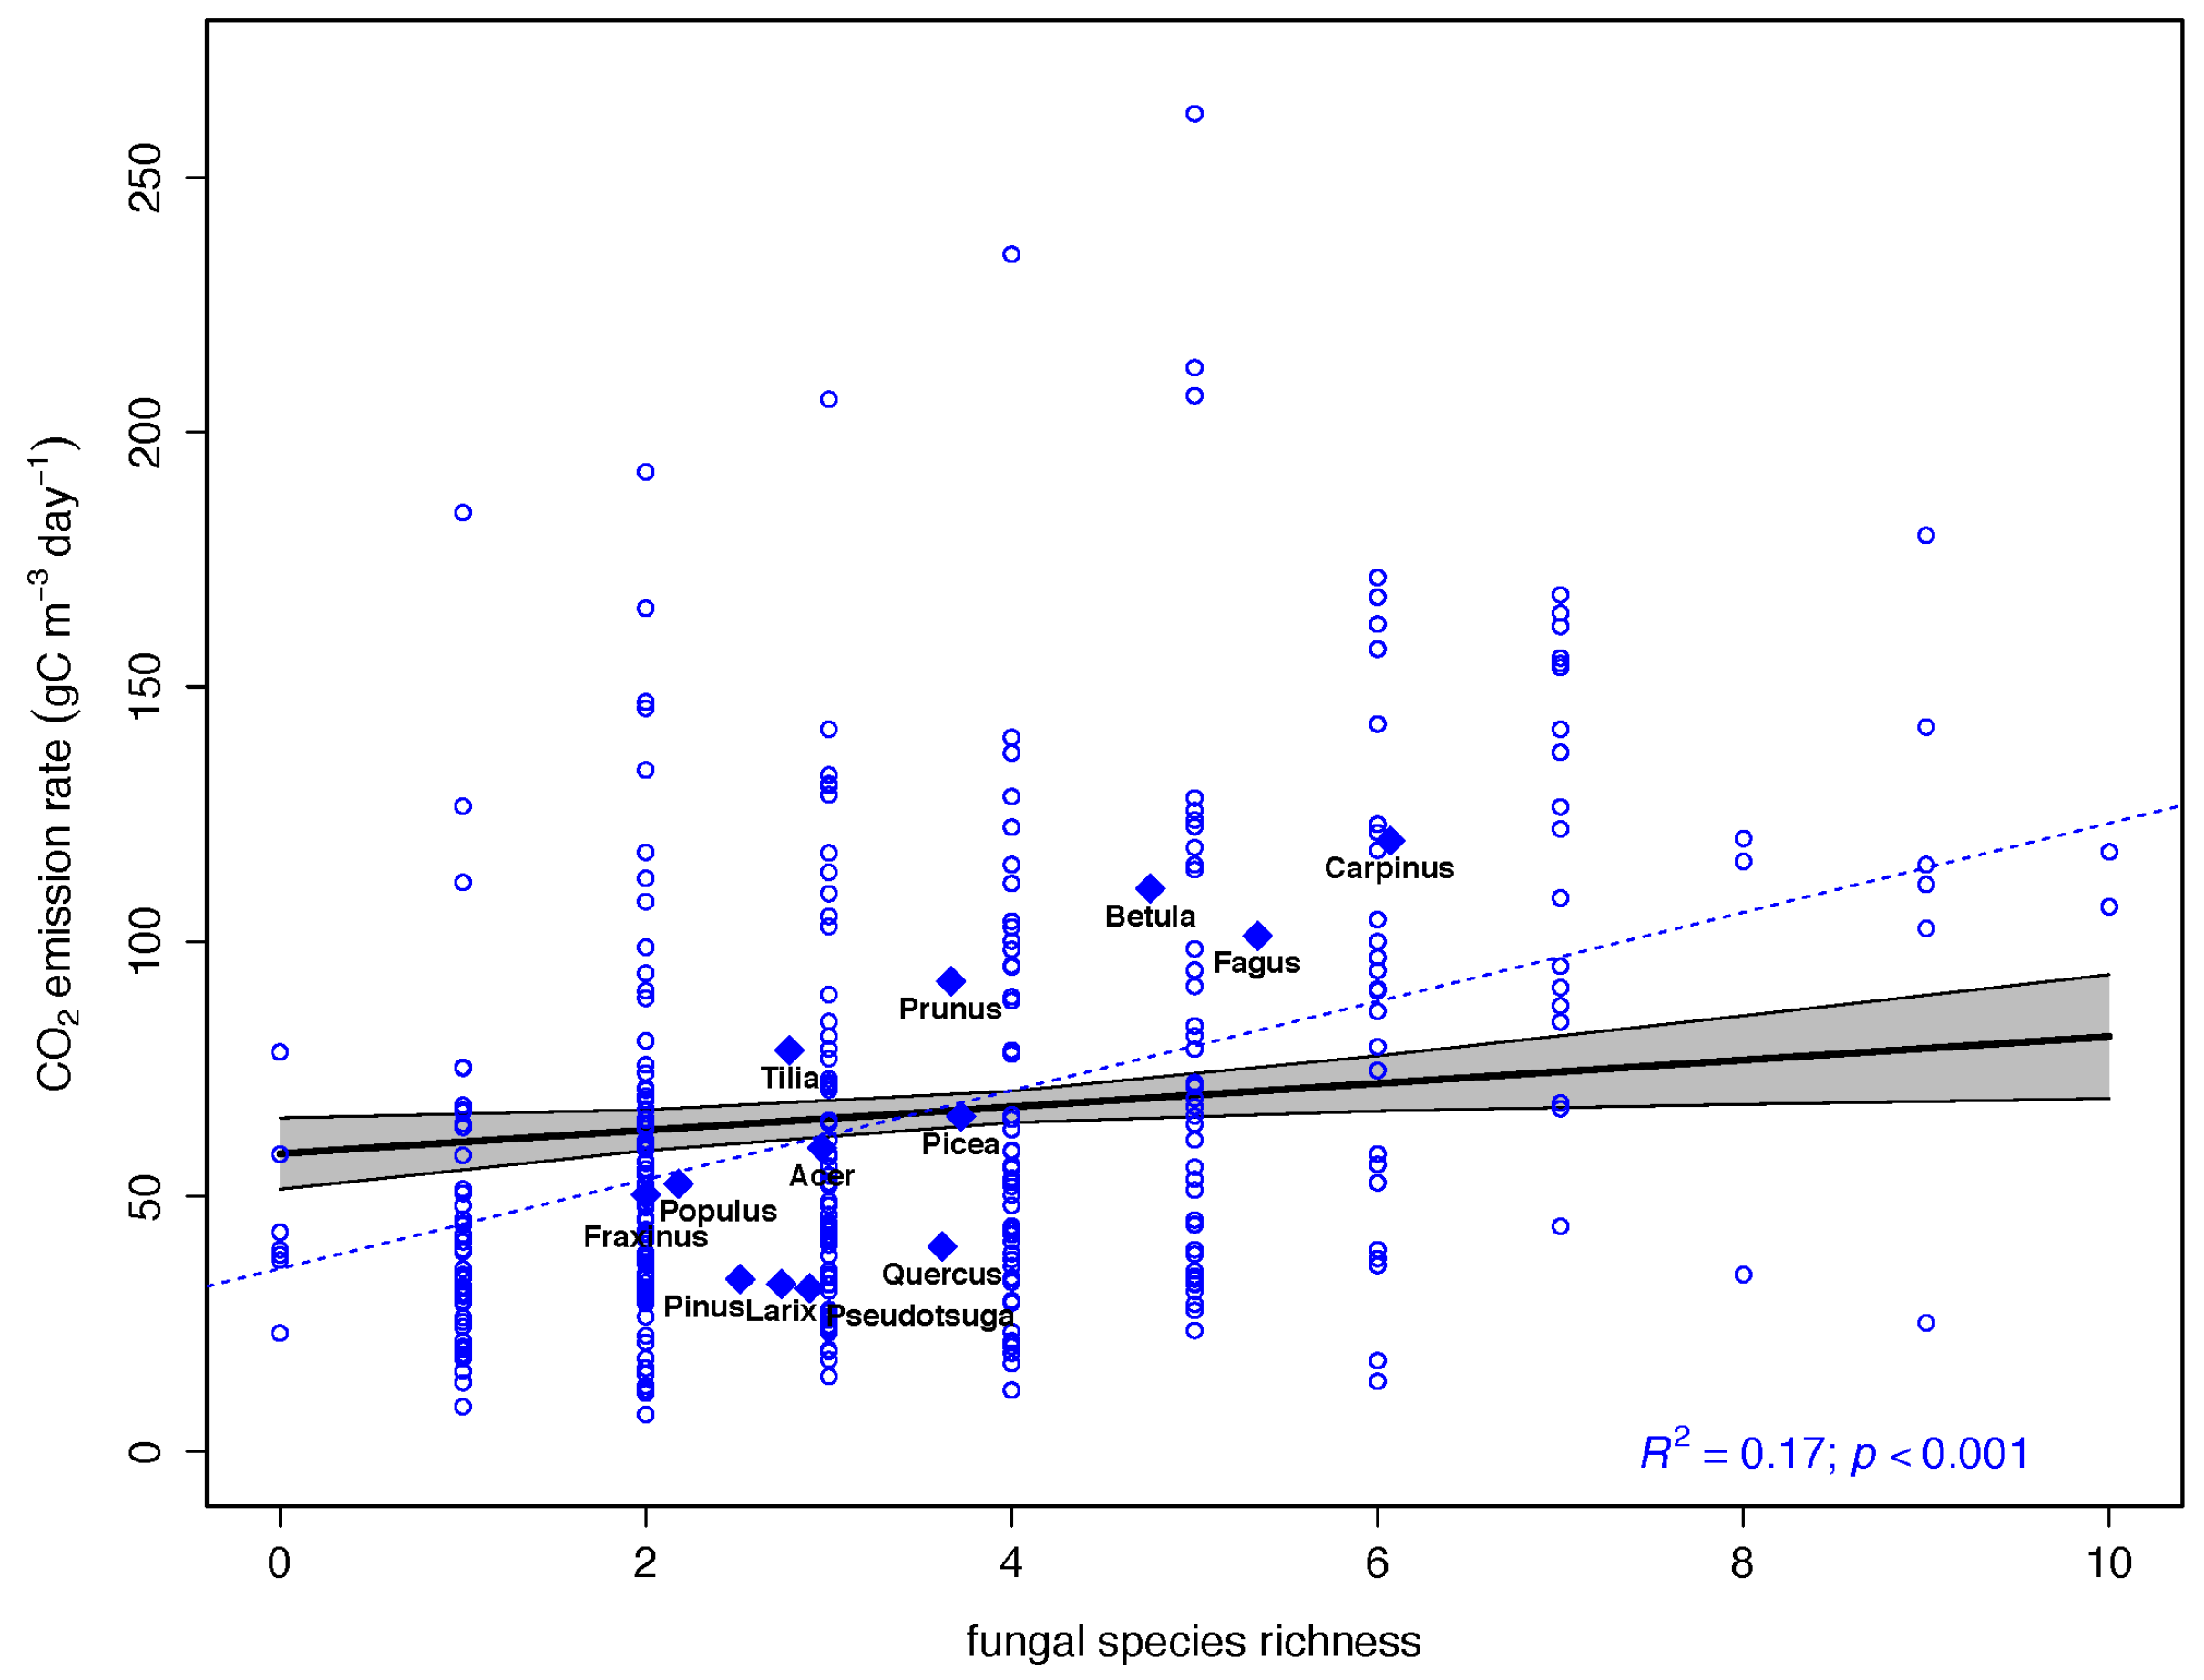
| Fungal species richness | 0.0385 | 0.1214 | 0.0132 | 2.926 | 0.0037 ** |
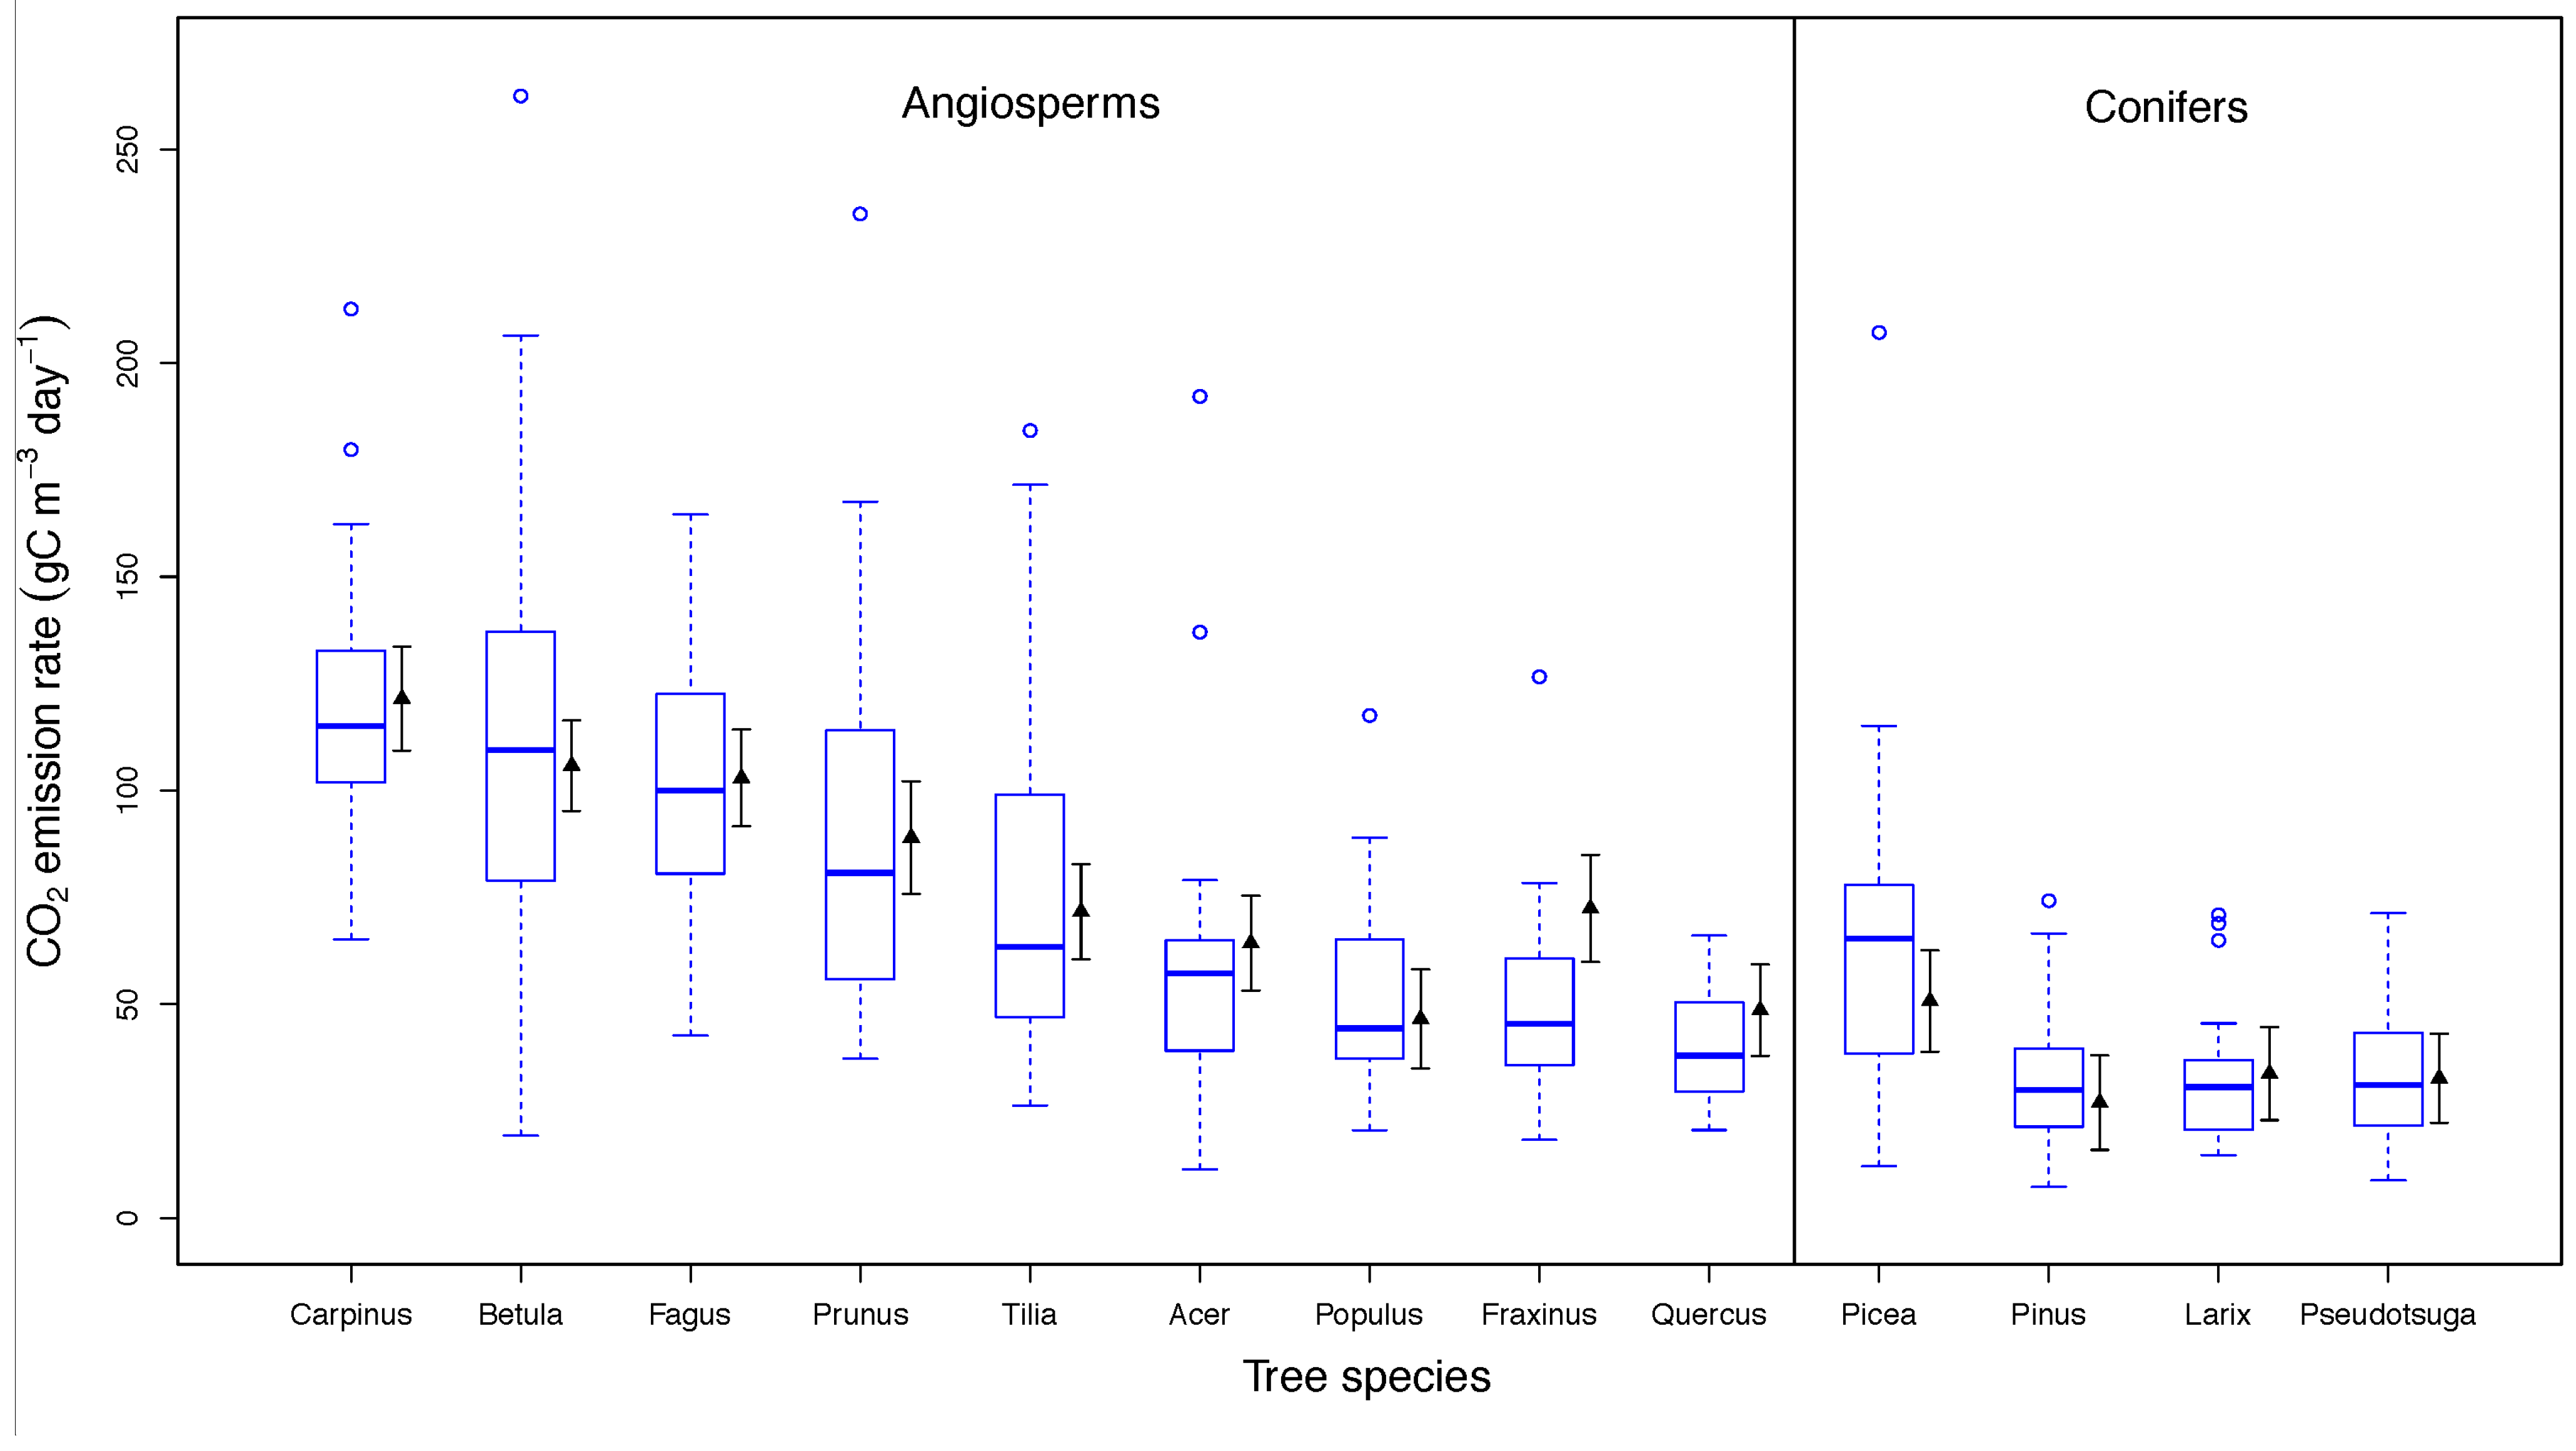
3.2. Drivers of CO2 Emission Rates in Dead Wood Tree Species
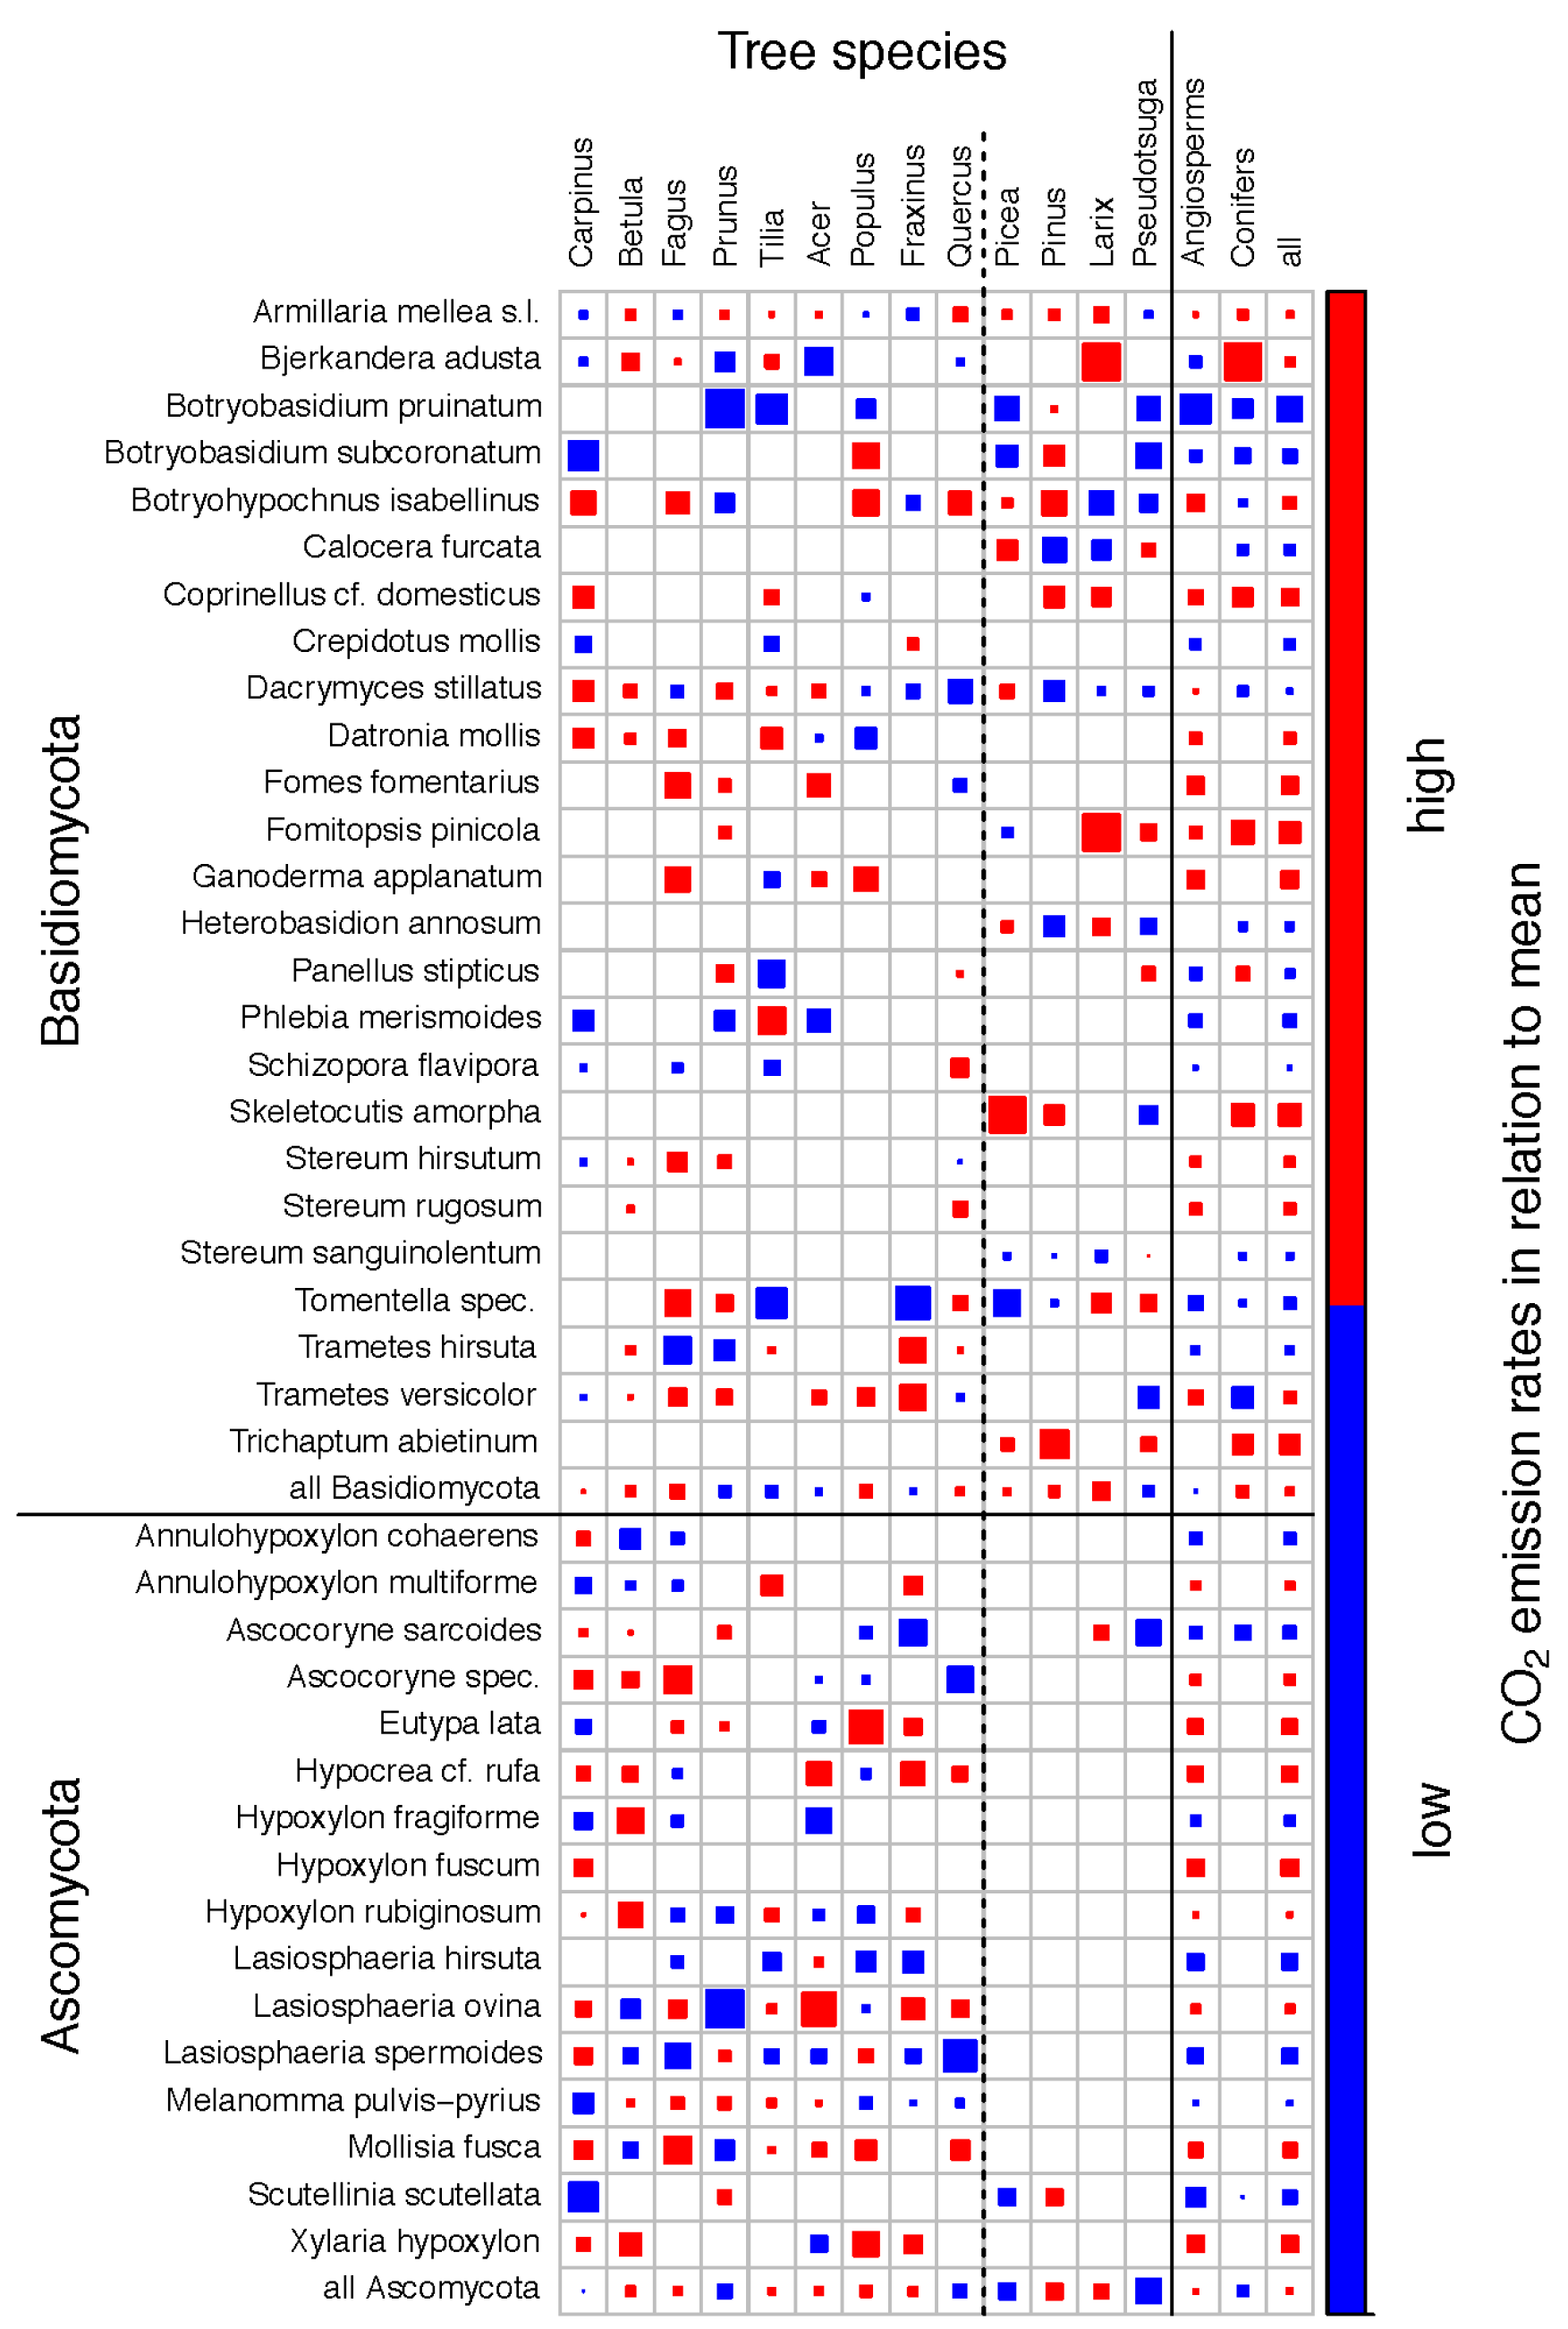
3.3. Fungal Species Identity and CO2 Emission Rates
4. Discussion
4.1. Main Drivers of CO2 Emission Rates
4.2. Drivers of CO2 Emission Rates in Dead Wood Tree Species
4.3. Fungal Identity and CO2 Emission Rates
5. Conclusions
Supplementary Files
Supplementary File 1Acknowledgments
Author Contributions
Conflicts of Interest
References
- Bauhus, J.; Puettmann, K.; Messier, C. Silviculture for old-growth attributes. For. Ecol. Manag. 2009, 258, 525–537. [Google Scholar] [CrossRef] [Green Version]
- Cornwell, W.K.; Cornelissen, J.H.C.; Allison, S.D.; Bauhus, J.; Eggleton, P.; Preston, C.M.; Scarff, F.; Weedon, J.T.; Wirth, C.; Zanne, A.E. Plant traits and wood fates across the globe: Rotted, burned, or consumed? Glob. Chang. Biol. 2009, 15, 2431–2449. [Google Scholar] [CrossRef]
- Harmon, M.E.; Franklin, J.F.; Swanson, F.J.; Sollins, P.; Gregory, S.V.; Lattin, J.D.; Anderson, N.H.; Cline, S.P.; Aumen, N.G.; Sedell, J.R.; et al. Ecology of coarse woody debris in temperate ecosystems. Ad Ecol. Res 1986, 15, 133–302. [Google Scholar]
- Laurance, W.F.; Fearnside, P.M.; Laurance, S.G.; Delamonica, P.; Lovejoy, T.E.; Rankin-de Merona, J.M.; Chambers, J.Q.; Gascon, C. Relationship between soils and Amazon forest biomass: A landscape-scale study. For. Ecol. Manag. 1999, 118, 127–138. [Google Scholar] [CrossRef]
- Litton, C.M.; Raich, J.W.; Ryan, M.G. Carbon allocation in forest ecosystems. Glob. Chang. Biol. 2007, 13, 2089–2109. [Google Scholar] [CrossRef]
- Brunner, A.; Kimmins, J.P. Nitrogen fixation in coarse woody debris of Thuja plicata and Tsuga heterophylla forests on northern Vancouver Island. Can. J. For. Res. 2003, 33, 1670–1682. [Google Scholar] [CrossRef]
- Lonsdale, D.; Pautasso, M.; Holdenrieder, O. Wood-decaying fungi in the forest: Conservation needs and management options. Eur. J. For. Res. 2008, 127, 1–22. [Google Scholar] [CrossRef]
- Paillet, Y.; Bergès, L.; HjÄltén, J.; Ódor, P.; Avon, C.; Bernhardt-Römermann, M.; Bijlsma, R.J.; de Bruyn, L.; Fuhr, M.; Grandin, U.; et al. Biodiversity differences between managed and unmanaged forests: Meta-analysis of species richness in Europe. Conserv. Biol. 2010, 24, 101–112. [Google Scholar] [CrossRef] [PubMed]
- Müller, J.; Bütler, R. A review of habitat thresholds for dead wood: A baseline for management recommendations in European forests. Eur. J. For. Res. 2010, 129, 981–992. [Google Scholar] [CrossRef]
- Harmon, M.E. Woody detritus mass and its contribution to carbon dynamics of old-growth forests: The temporal context. In Old-Growth Forests: Function, Fate and Value; Wirth, C., Gleixner, G., Heimann, M., Eds.; Springer: Berlin, Germany, 2009; pp. 159–190. [Google Scholar]
- Pietsch, K.A.; Ogle, K.; Cornelissen, J.H.C.; Cornwell, W.K.; Bönisch, G.; Craine, J.M.; Jackson, B.G.; Kattge, J.; Peltzer, D.A.; Penuelas, J.; et al. Global relationship of wood and leaf litter decomposability: The role of functional traits within and across plant organs. Glob. Ecol. Biogeogr. 2014, 23, 1046–1057. [Google Scholar] [CrossRef]
- Pan, Y.; Birdsey, R.A.; Fang, J.; Houghton, R.; Kauppi, P.E.; Kurz, W.A.; Phillips, O.L.; Shvidenko, A.; Lewis, S.L.; Canadell, J.G.; et al. A large and persistent carbon sink in the world’s forests. Science 2011, 333, 988–993. [Google Scholar] [CrossRef] [PubMed]
- Kahl, T.; Mund, M.; Bauhus, J.; Schulze, E.-D. Dissolved organic carbon from European beech logs: Patterns of input to and retention by surface soil. Ecoscience 2012, 19, 1–10. [Google Scholar] [CrossRef]
- Lindahl, B.; Boberg, J. Distribution and function of litter basidiomycetes in coniferous forests. In Ecology of Saprotrophic Basidiomycetes; Boddy, L., Frankland, J., van West, P., Eds.; Elsevier Ltd.: London, UK, 2007; pp. 183–196. [Google Scholar]
- Moore, J.C.; Berlow, E.L.; Coleman, D.C.; Ruiter, P.C.; Dong, Q.; Hastings, A.; Johnson, N.C.; McCann, K.S.; Melville, K.; Morin, P.J.; et al. Detritus, trophic dynamics and biodiversity. Ecol. Lett. 2004, 7, 584–600. [Google Scholar] [CrossRef]
- Stenlid, J.; Penttilä, R.; Dahlberg, A. Wood-decay basidiomycetes in boreal forests: Distribution and community development. In Ecology of Saprotrophic Basidiomycetes; Boddy, L., Frankland, J., van West, P., Eds.; Elsevier Ltd.: London, UK, 2007; pp. 239–262. [Google Scholar]
- Heilmann-Clausen, J.; Boddy, L. Distribution patterns of wood-decay basidiomycetes at the landscape to global scale. Br. Mycol. Soc. Symp. Ser. 2008, 28, 263–275. [Google Scholar]
- Ten Have, R.; Teunissen, P.J.M. Oxidative mechanisms involved in lignin degradation by white-rot fungi. Chem. Rev. 2001, 101, 3397–3413. [Google Scholar] [CrossRef] [PubMed]
- Herrmann, S.; Bauhus, J. Effects of moisture, temperature and decomposition stage on respirational carbon loss from coarse woody debris (CWD) of important European tree species. Scand. J. For. Res. 2012, 28, 346–357. [Google Scholar] [CrossRef]
- Fahey, T.J.; Siccama, T.G.; Driscoll, C.T.; Likens, G.E.; Campbell, J.; Johnson, C.E.; Battles, J.J.; Aber, J.D.; Cole, J.J.; Fisk, M.C.; et al. The Biogeochemistry of Carbon at Hubbard Brook. Biogeochemistry 2005, 75, 109–176. [Google Scholar] [CrossRef]
- Kebli, H.; Drouin, P.; Brais, S.; Kernaghan, G. Species composition of saproxylic fungal communities on decaying logs in the boreal forest. Microb. Ecol. 2011, 61, 898–910. [Google Scholar] [CrossRef] [PubMed]
- Kebli, H.; Kernaghan, G.; Drouin, P.; Brais, S. Development and activity of early saproxylic fungal communities in harvested and unmanaged boreal mixedwood stands. Eur. J. For. Res. 2014, 133, 905–918. [Google Scholar] [CrossRef]
- Zhou, L.; Dai, L.; Gu, H.; Zhong, L. Review on the decomposition and influence factors of coarse woody debris in forest ecosystem. J. For. Res. 2007, 18, 48–54. [Google Scholar] [CrossRef]
- Mueller, G.M.; Bills, G.F.; Foster, M.S. Biodiversity of Fungi. Inventory and Monitoring Methods; Mueller, G.M., Bills, G.F., Foster, M.S., Eds.; Elsevier: Amsterdam, The Netherland, 2004. [Google Scholar]
- Deacon, J.W. Fungal Biology, 4th ed.; Blackwell Publishing Ltd.: Malden, MA, USA, 2005. [Google Scholar]
- Yamashita, S.; Hattori, T.; Abe, H. Host preference and species richness of wood-inhabiting aphyllophoraceous fungi in a cool temperate area of Japan. Mycologia 2009, 102, 11–19. [Google Scholar] [CrossRef]
- Setälä, H.; McLean, M.A. Decomposition rate of organic substrates in relation to the species diversity of soil saprophytic fungi. Oecologia 2004, 139, 98–107. [Google Scholar] [CrossRef] [PubMed]
- Valentín, L.; Rajala, T.; Peltoniemi, M.; Heinonsalo, J.; Pennanen, T.; Mäkipää, R. Loss of diversity in wood-inhabiting fungal communities affects decomposition activity in Norway spruce wood. Front. Microbiol. 2014, 5, 1–11. [Google Scholar] [CrossRef] [PubMed] [Green Version]
- Blaser, S.; Prati, D.; Senn-Irlet, B.; Fischer, M. Effects of forest management on the diversity of deadwood-inhabiting fungi in Central European forests. For. Ecol. Manag. 2013, 304, 42–48. [Google Scholar] [CrossRef]
- Purahong, W.; Hoppe, B.; Kahl, T.; Schloter, M.; Schulze, E.D.; Bauhus, J.; Buscot, F.; Krüger, D. Changes within a single land-use category alter microbial diversity and community structure: Molecular evidence from wood-inhabiting fungi in forest ecosystems. J. Environ. Manag. 2014, 139, 109–119. [Google Scholar] [CrossRef] [PubMed]
- Bässler, C.; Müller, J.; Dziock, F.; Brandl, R. Effects of resource availability and climate on the diversity of wood-decaying fungi. J. Ecol. 2010, 98, 822–832. [Google Scholar] [CrossRef]
- Harmon, M.E.; Whigham, D.F.; Sexton, J.; Olmsted, I. Decomposition and mass of woody detritus in the dry tropical forests of the northeastern Yucatan Peninsula, Mexico. Biotropica 1995, 27, 305–316. [Google Scholar] [CrossRef]
- Bradford, M.A.; Warren, R.J.; Baldrian, P.; Crowther, T.W.; Maynard, D.S.; Oldfield, E.E.; Wieder, W.R.; Wood, S.A.; King, J.R. Climate fails to predict wood decomposition at regional scales. Nat. Clim. Chang. 2014, 4, 625–630. [Google Scholar] [CrossRef]
- Mackensen, J.; Bauhus, J. Density loss and respiration rates in coarse woody debris of Pinus radiata, Eucalyptus regnans and Eucalyptus maculata. Soil Biol. Biochem. 2003, 35, 177–186. [Google Scholar] [CrossRef]
- Weedon, J.T.; Cornwell, W.K.; Cornelissen, J.H.C.; Zanne, A.E.; Wirth, C.; Coomes, D.A. Global meta-analysis of wood decomposition rates: A role for trait variation among tree species? Ecol. Lett. 2009, 12, 45–56. [Google Scholar] [CrossRef] [PubMed]
- Freschet, G.T.; Weedon, J.T.; Aerts, R.; van Hal, J.R.; Cornelissen, J.H.C. Interspecific differences in wood decay rates: Insights from a new short-term method to study long-term wood decomposition. J. Ecol. 2012, 100, 161–170. [Google Scholar] [CrossRef]
- Renninger, H.J.; Carlo, N.; Clark, K.L.; Schäfer, K.V.R. Modeling respiration from snags and coarse woody debris before and after an invasive gypsy moth disturbance. J. Geophys. Res. Biogeosci. 2014, 119, 630–644. [Google Scholar] [CrossRef]
- Cornelissen, J.H.C.; Sass-Klaassen, U.; Poorter, L.; van Geffen, K.; van Logtestijn, R.S.P.; van Hal, J.; Goudzwaard, L.; Sterck, F.J.; Klaassen, R.K.W.M.; Freschet, G.T.; et al. Controls on coarse wood decay in temperate tree species: Birth of the LOGLIFE experiment. Ambio 2012, 41, 231–245. [Google Scholar] [CrossRef] [PubMed]
- Lindner, D.L.; Vasaitis, R.; Kubartová, A.; Allmér, J.; Johannesson, H.; Banik, M.T.; Stenlid, J. Initial fungal colonizer affects mass loss and fungal community development in Picea abies logs 6 yr after inoculation. Fungal Ecol. 2011, 4, 449–460. [Google Scholar] [CrossRef]
- Fischer, M.; Bossdorf, O.; Gockel, S.; Hänsel, F.; Hemp, A.; Hessenmöller, D.; Korte, G.; Nieschulze, J.; Pfeiffer, S.; Prati, D.; et al. Implementing large-scale and long-term functional biodiversity research: The Biodiversity Exploratories. Basic Appl. Ecol. 2010, 11, 473–485. [Google Scholar] [CrossRef]
- Kahl, T.; Bauhus, J. An index of forest management intensity based on assessment of harvested tree volume, tree species composition and dead wood origin. Nat. Conserv. 2014, 7, 15–27. [Google Scholar] [CrossRef]
- Müller, J.; Wende, B.; Strobl, C.; Eugster, M.; Gallenberger, I.; Steffan-dewenter, I.; Linsenmair, K.E.; Weisser, W.W.; Gossner, M.M. Forest management and regional tree composition drive the host preference of saproxylic beetle communities. J. Appl. Ecol. 2015, 52, 753–762. [Google Scholar] [CrossRef]
- Jonsell, M.; Nordlander, G. Insects in polypore fungi as indicator species: A comparison between forest sites differing in amounts and continuity of dead wood. For. Ecol. Manag. 2002, 157, 101–118. [Google Scholar] [CrossRef]
- Kulhánková, A.; Béguiristain, T.; Moukoumi, J.; Berthelin, J.; Ranger, J. Spatial and temporal diversity of wood decomposer communities in different forest stands, determined by ITS rDNA targeted TGGE. Ann. For. Sci. 2006, 63, 547–556. [Google Scholar] [CrossRef]
- Halme, P.; Kotiaho, J.S. The importance of timing and number of surveys in fungal biodiversity research. Biodivers. Conserv. 2012, 21, 205–219. [Google Scholar] [CrossRef]
- R Core Team. R: A Language and Environment for Statistical Computing; R Foundation for Statistical Computing: Vienna, Austria, 2013. [Google Scholar]
- Calcagno, V. Glmulti: Model Selection and Multimodel Inference Made Easy. R package version 1.0.7. Available online: http://CRAN.R-project.org/package=glmulti (accessed on 9 March 2015).
- Walsh, C.; Mac Nally, R. hier.part: Hierarchical Partitioning. R Package Version 1.0–4. Available online: http://CRAN.R-project.org/package=hier.part (accessed on 9 March 2015).
- Fox, J. Effect Displays in R for Generalised Linear Models. J. Stat. Softw. 2003, 8, 1–27. [Google Scholar]
- Van Geffen, K.G.; Poorter, L.; Sass-Klaassen, U.; van Logtestijn, R.S.P.; Cornelissen, J.H.C. The trait contribution to wood decomposition rates of 15 Neotropical tree species. Ecology 2010, 91, 3686–3697. [Google Scholar] [CrossRef] [PubMed]
- Rock, J.; Badeck, F.W.; Harmon, M.E. Estimating decomposition rate constants for European tree species from literature sources. Eur. J. For. Res. 2008, 127, 301–313. [Google Scholar] [CrossRef]
- Chen, H.; Harmon, M.E.; Griffiths, R.P.; Hicks, W. Effects of temperature and moisture on carbon respired from decomposing woody roots. For. Ecol. Manag. 2000, 138, 51–64. [Google Scholar] [CrossRef]
- Küffer, N.; Senn-Irlet, B. Diversity and ecology of wood-inhabiting aphyllophoroid basidiomycetes on fallen woody debris in various forest types in Switzerland. Mycol. Prog. 2005, 4, 77–86. [Google Scholar] [CrossRef]
- Küffer, N.; Gillet, F.; Senn-Irlet, B.; Aragno, M.; Job, D. Ecological determinants of fungal diversity on dead wood in European forests. Fungal Divers. 2008, 30, 83–95. [Google Scholar]
- Jönsson, M.T.; Edman, M.; Jonsson, B.G. Colonization and extinction patterns of wood-decaying fungi in a boreal old-growth Picea abies forest. J. Ecol. 2008, 96, 1065–1075. [Google Scholar] [CrossRef]
- Crockatt, M.E.; Bebber, D.P. Edge effects on moisture reduce wood decomposition rate in a temperate forest. Glob. Chang. Biol. 2014, 21, 698–707. [Google Scholar] [CrossRef] [PubMed]
- Worrall, J.J.; Anagnost, S.E.; Zabel, R.A. Comparison of wood decay among diverse lignicolous fungi. Mycologia 1997, 89, 199–219. [Google Scholar] [CrossRef]
- Schubert, M.; Fink, S.; Schwarze, F.W.M.R. Field experiments to evaluate the application of Trichoderma strain (T-15603.1) for biological control of wood decay fungi in trees. Arboric. J. 2008, 31, 249–268. [Google Scholar] [CrossRef]
- Dickie, I.A.; Fukami, T.; Wilkie, J.P.; Allen, R.B.; Buchanan, P.K. Do assembly history effects attenuate from species to ecosystem properties? A field test with wood-inhabiting fungi. Ecol. Lett. 2012, 15, 133–141. [Google Scholar] [CrossRef] [PubMed]
- Boddy, L.; Heilmann-Clausen, J. Basidiomycete community development in temperate angiosperm wood. In Ecology of Saprotrophic Basidiomycetes; Boddy, L., Frankland, J., van West, P., Eds.; Elsevier Ltd.: London, UK, 2007; Volume 28, pp. 211–237. [Google Scholar]
© 2015 by the authors; licensee MDPI, Basel, Switzerland. This article is an open access article distributed under the terms and conditions of the Creative Commons Attribution license (http://creativecommons.org/licenses/by/4.0/).
Share and Cite
Kahl, T.; Baber, K.; Otto, P.; Wirth, C.; Bauhus, J. Drivers of CO2 Emission Rates from Dead Wood Logs of 13 Tree Species in the Initial Decomposition Phase. Forests 2015, 6, 2484-2504. https://doi.org/10.3390/f6072484
Kahl T, Baber K, Otto P, Wirth C, Bauhus J. Drivers of CO2 Emission Rates from Dead Wood Logs of 13 Tree Species in the Initial Decomposition Phase. Forests. 2015; 6(7):2484-2504. https://doi.org/10.3390/f6072484
Chicago/Turabian StyleKahl, Tiemo, Kristin Baber, Peter Otto, Christian Wirth, and Jürgen Bauhus. 2015. "Drivers of CO2 Emission Rates from Dead Wood Logs of 13 Tree Species in the Initial Decomposition Phase" Forests 6, no. 7: 2484-2504. https://doi.org/10.3390/f6072484
APA StyleKahl, T., Baber, K., Otto, P., Wirth, C., & Bauhus, J. (2015). Drivers of CO2 Emission Rates from Dead Wood Logs of 13 Tree Species in the Initial Decomposition Phase. Forests, 6(7), 2484-2504. https://doi.org/10.3390/f6072484