Article

Variation of Oriental Oak (Quercus variabilis) Leaf δ13C across Temperate and Subtropical China: Spatial Patterns and Sensitivity to Precipitation

1
School of Agriculture and Biology and Research Centre for Low-Carbon Agriculture, Shanghai Jiao Tong University, Shanghai 200240, China
2
Key Laboratory of Urban Agriculture (South), Ministry of Agriculture, People's Republic of China, Shanghai 200240, China
3
Shanghai Urban Forest Research Station, State Forestry Bureau, Shanghai 200000, China
4
School of Energy, Environment and Agrifood, Cranfield University, Cranfield MK43 0AL, UK
*
Author to whom correspondence should be addressed.
Forests 2015, 6(7), 2296-2306; https://doi.org/10.3390/f6072296
Submission received: 24 March 2015 / Revised: 23 June 2015 / Accepted: 25 June 2015 / Published: 30 June 2015
(This article belongs to the Special Issue Responses of Forest Trees to Drought)

Abstract

:
The concentration of the carbon-13 isotope (leaf δ13C) in leaves is negatively correlated with the mean annual precipitation (MAP) atlarge geographical scales. In this paper, we explain the spatial pattern of leaf δ13C variation for deciduous oriental oak (Quercus variabilis Bl.) across temperate and subtropical biomes and its sensitivity to climate factors such as MAP. There was a 6‰ variation in the leaf δ13C values of oak with a significant positive correlation with latitude and negative correlations with the mean annual temperature (MAT) and MAP. There was no correlation between leaf δ13C and altitude or longitude. Stepwise multiple regression analyses showed that leaf δ13C decreased 0.3‰ per 100 mm increase in MAP. MAP alone could account for 68% of the observed variation in leaf δ13C. These results can be used to improve predictions for plant responses to climate change and particularly lower rainfall.

1. Introduction

Natural abundance of the carbon-13 isotope (13C) can be affected by environmental factors such as the partial pressure of CO2 and O2 [1], the irradiance level [2,3,4] and air temperature [5]. However, water availability is a predominant determinant of changes in carbon-13 isotope at regional and global scales [1,6,7,8]. This is due to the fact that water supply affects the stomatal conductance and photosynthesis of plants, which changes 13C/12C ratios in the synthesized carbohydrates. Leaf δ13C has also been correlated with leaf specific area and nitrogen concentration [9,10], water deficit [11] and water use efficiency (WUE) [12,13,14]. Hence the spatial pattern of leaf δ13C, arising from changes in water availability, is of physiological and ecological interest particularly in the context of climate change.
At large geographical scales, precipitation has often been used as a surrogate of the effect of water availability on leaf δ13C. A significant negative correlation is found between leaf δ13C and mean annual precipitation (MAP) at a global scale [1,6]. The same relationship has also been found at regional scales in different climatic conditions, for instance, in northern temperate Australia [15], both C3 and C4 vegetation in Southern Africa [16], Quercus suber in Mediterranean Portugal [17] and Metrosideros polymorpha in tropical Hawaii [10]. In China, there have been studies on a range of terrestrial plants in rainforests [18], in arid north and northeast China areas [19,20] and on high mountains [21,22]. However these studies do not focus on the driving forces or the effects on leaf δ13C variation at a specieslevel acrossbiomes. Changes in leaf δ13Care well correlated with spatial environmental variables, such as latitude (LAT), longitude (LON) and altitude (ALT), due to their co-variation with precipitation [1,23,24,25,26,27]. Shestakova et al., (2014) investigated the spatial pattern of carbon isotope discrimination for three deciduous oaks and one evergreen oak along an aridity gradient, showing that evergreen oak was primarily related to temperature, whilst the spatial pattern for deciduous oaks was primarily dependent on precipitation [28]. The total range of δ13C values was 4.4‰ and 3.1‰ for Quercus pubescens and Quercus ilex, respectively, in Southern France with different levels of water availability [29]. Klein et al., also report that stomatal conductance and water use affect plant δ13C for Quercus calliprinos in Israel [30]. By contrast, Donovan et al., found no significant differences in δ13C among three Quercus species in the Southeastern USA [31]. Hence different Quercus species show a variety of δ13C responses at a region scale; understanding the reasons for these variations could help determine how different species will respond to climate change and in particular increased drought conditions. An improved understanding of variations in δ13C for selected species can also be used to build isoscapes [32] and spatial models of precipitation [33].
Oriental oak (Quercus variabilis Bl.) is a deciduous broadleaf tree that is relatively abundant across temperate and subtropical areas in East Asia (24° N to 42° N; 96° E to 140° E), including the eastern part of Mainland China, Taiwan and Zhoushan islands, as well as Korea and Japan [34]. Q. variabilis is found at altitudes ranging from sea-level to 2000 m above sea level (a.s.l.) in subtropical China. The associated forests are important for timber and cork production and ecosystem services, such as carbon sequestration, and water and soil conservation. Within the distribution area in Mainland China, mean annual temperature (MAT) and MAP range from 7.2 to 23.6 °C and 410 to 2000 mm, respectively [34]. This provides an ideal situation for studying spatial patterns of leaf δ13C variation within a single widespread species. The present study aims (1) to show the spatial pattern of variation in leaf δ13C of Q. variabilis within its distribution range across temperate-subtropical biomes and (2) to assess the correlation relationships between leaf δ13C and climate variables.

2. Materials and Methods

2.1. Study Areas and Sample Stands
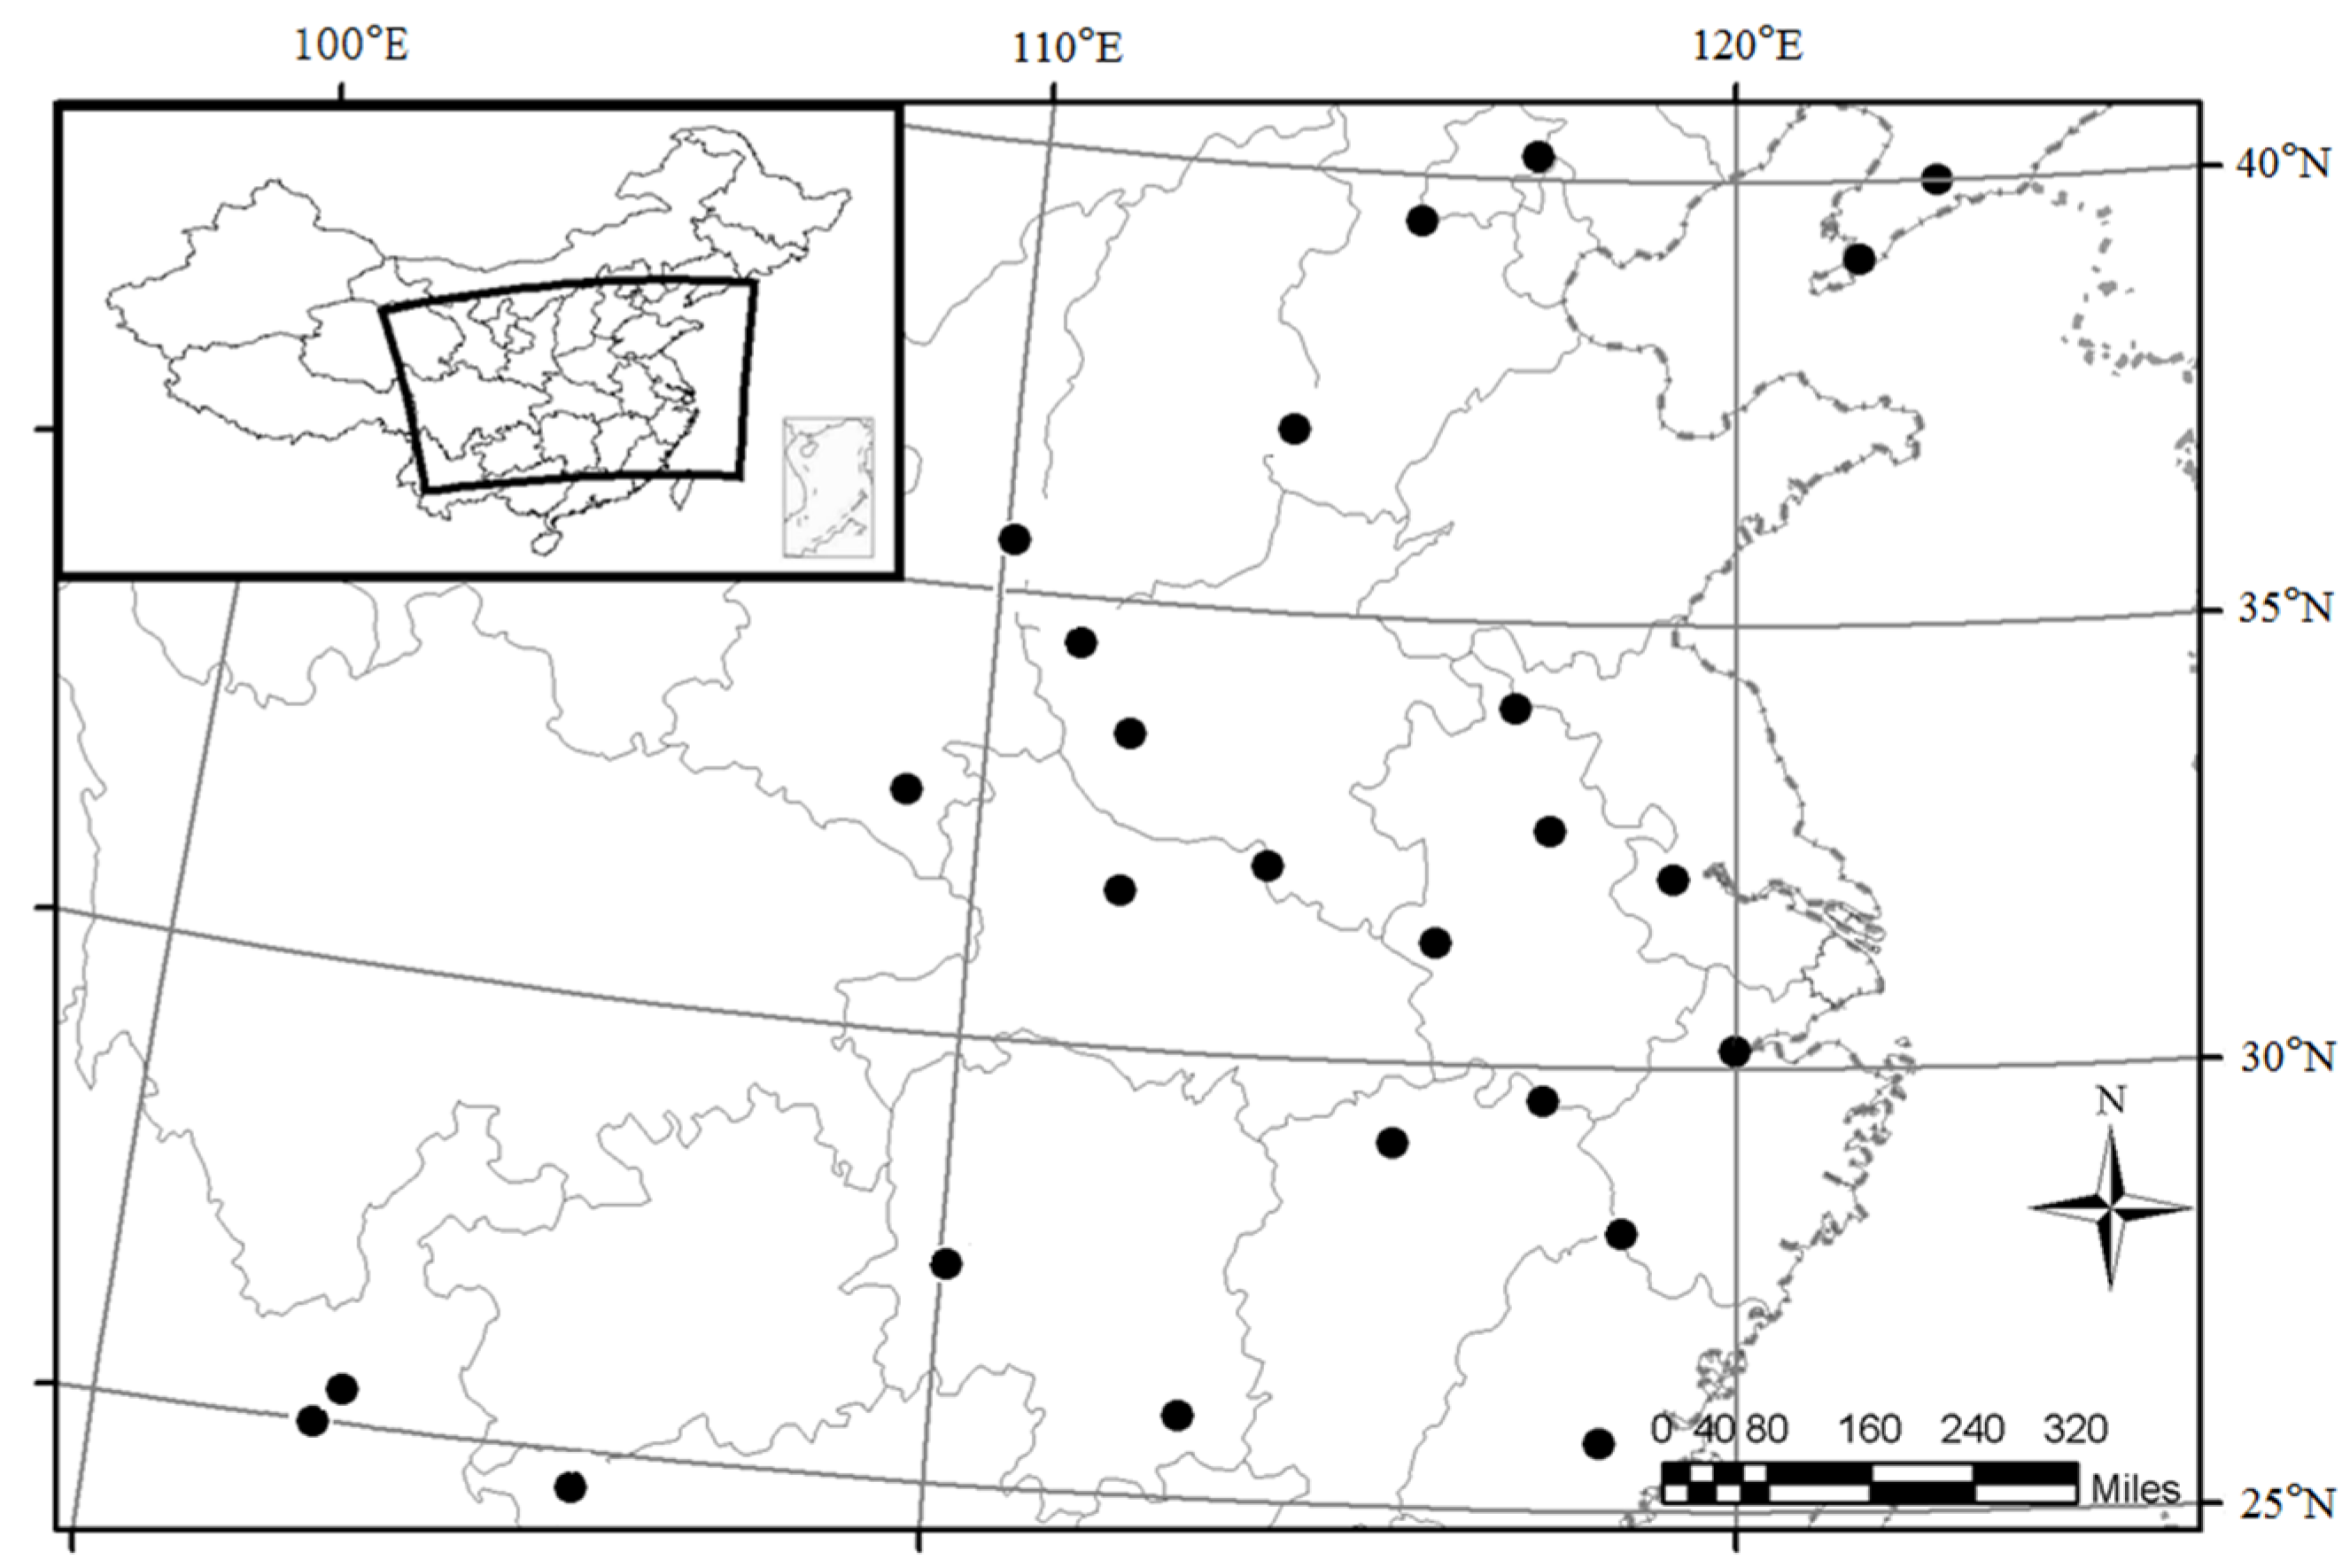
According to the previous information of spatial distribution of Q. variabilis from the Chinese Virtual Herbarium [34,35], 25 sample stands were identified in Mainland China with a range of the longitude from 102° E to 123° E and latitude ranging from subtropical areas 24° N to temperate areas 41° N (Figure 1). For each site, temperature and precipitation data over a period of 30 years were collected from the Chinese meteorological data sharing service system, the Chinese Natural Resources Database and local weather stations. MAT and MAP ranged from 8.8 °C to 20 °C and 495 to 1850 mm, respectively (Supplementary Table S1).
Figure 1. Distribution map of sample Quercus variabilis stands sampled across eastern China in 2008.
Forests 06 02296 g001
Each sample stand comprised of natural secondary forests judged to have been unaffected by fire, tree cutting, fertilization, litter collection, or grazing during the last two decades. In the temperate areas, such as the Liaoning, Beijing and Hebei provinces, Q. variabilis is typically the dominant tree species within a temperate deciduous broadleaf forest located in entisol soils. In the central areas, such as the Henan, Hubei and Jiangsu provinces, the climate varies from warm temperate to subtropical, and the climax vegetation is mixed deciduous and evergreen broadleaf forest in ceptisol soils. In southern areas, such as the Jiangxi, Guangxi and Fujian provinces, Q. variabilis forms a co-dominant tree species within subtropical evergreen broadleaf forests in acidic, aluminum-rich, ultisol soils.

2.2. Sampling

Leaf samples were collected between late July and early September in 2008. At each site, a sampling plot (20 m × 20 m) was delimited in the middle position of a south-facing slope, where a global positioning system (Thales Navigation, Santa Barbara, CA, USA) was used to determine LAT, LON and ALT. Five dominant trees in each sample plot were measured in terms of height and diameter at breast height (Supplementary Table S1). From a sample tree, approximately 250 g of fresh leaves were picked from three to four small branches at the central south-facing part of crown. Leaf samples were dried at 60 °C for 72 h. The sample leaves were ground and sieved through a 60 mesh sieve (0.25 mm diameter) for chemical analysis.

2.3. Chemical Analyses

The δ13C and C content of leaf samples were determined using a Finnigan MAT Delta V advantage mass spectrometer (Thermo Fisher Scientific, Waltham, MA, USA) at the Center for Isotope Analysis, Chinese Academy of Forestry, Beijing, China. The carbon stable isotopic composition was expressed asδ13C (‰) = ((Rsample/Rstandard) – 1)× 1000, where δ13C is the isotope ratio in parts per million (‰), Rsample/Rstandard are the 13C/12C molar abundance ratios of leaf material and the PDB (Pee Dee Belemnite) standard, respectively [36].

2.4. Statistical Analyses

Simple linear regression was used to describe the patterns of association between leaf δ13C and climate variables. To assess the influence of climatic factors on leaf δ13C, we performed a stepwise multiple regression analysis. Pearson correlation coefficients were calculated to explore relationships among climate variables. Stepwise multiple regression analysis was performed in SPSS 16.0 (IBM, Chicago, IL, USA); all other tests were carried out by SigmaPlot10.0 software (Systat Software, Inc., Richmod, CA, USA).

3. Results

MAP of the sampled Q. variabilis populations ranged from 495 mm to 1850 mm; the MATranged from 8.8 °C to 20.0 °C. The mean value for leaf δ13C of the 25 Q. variabilis populations across eastern China was −27.4‰ ± 0.33‰, with the coefficient of variation of 5.73% (Table 1). The lowest value of −30‰ was found at Dehua (DH), Fujian, where MAP was 1850 mm. The highest value of −24‰ was found at Anming (AN) and Kunming (KM), Yunnan, where MAP was approximately1000mm. Similar leaf δ13C values were found in Sanmenxia (SM), Henan (MAP = 495 mm) and Pinggu (PG), Beijing (MAP = 542 mm) (Supplementary Table S1).
Table 1. Statistics of mean annual precipitation (MAP), mean annual temperature (MAT), the carbon content and the relative concentration of carbon 13 in the leaves δ13C of 25 Quercus variabilis across eastern China.
MeanStandard ErrorMaximumMinimumCoefficient of Variation(%)
MAP (mm)106575185049538
MAT (°C)14.70.5208.820
C (mg g−1)493.13.4519.1462.53.4
δ13C (‰)−27.40.3−24.3−30.45.7
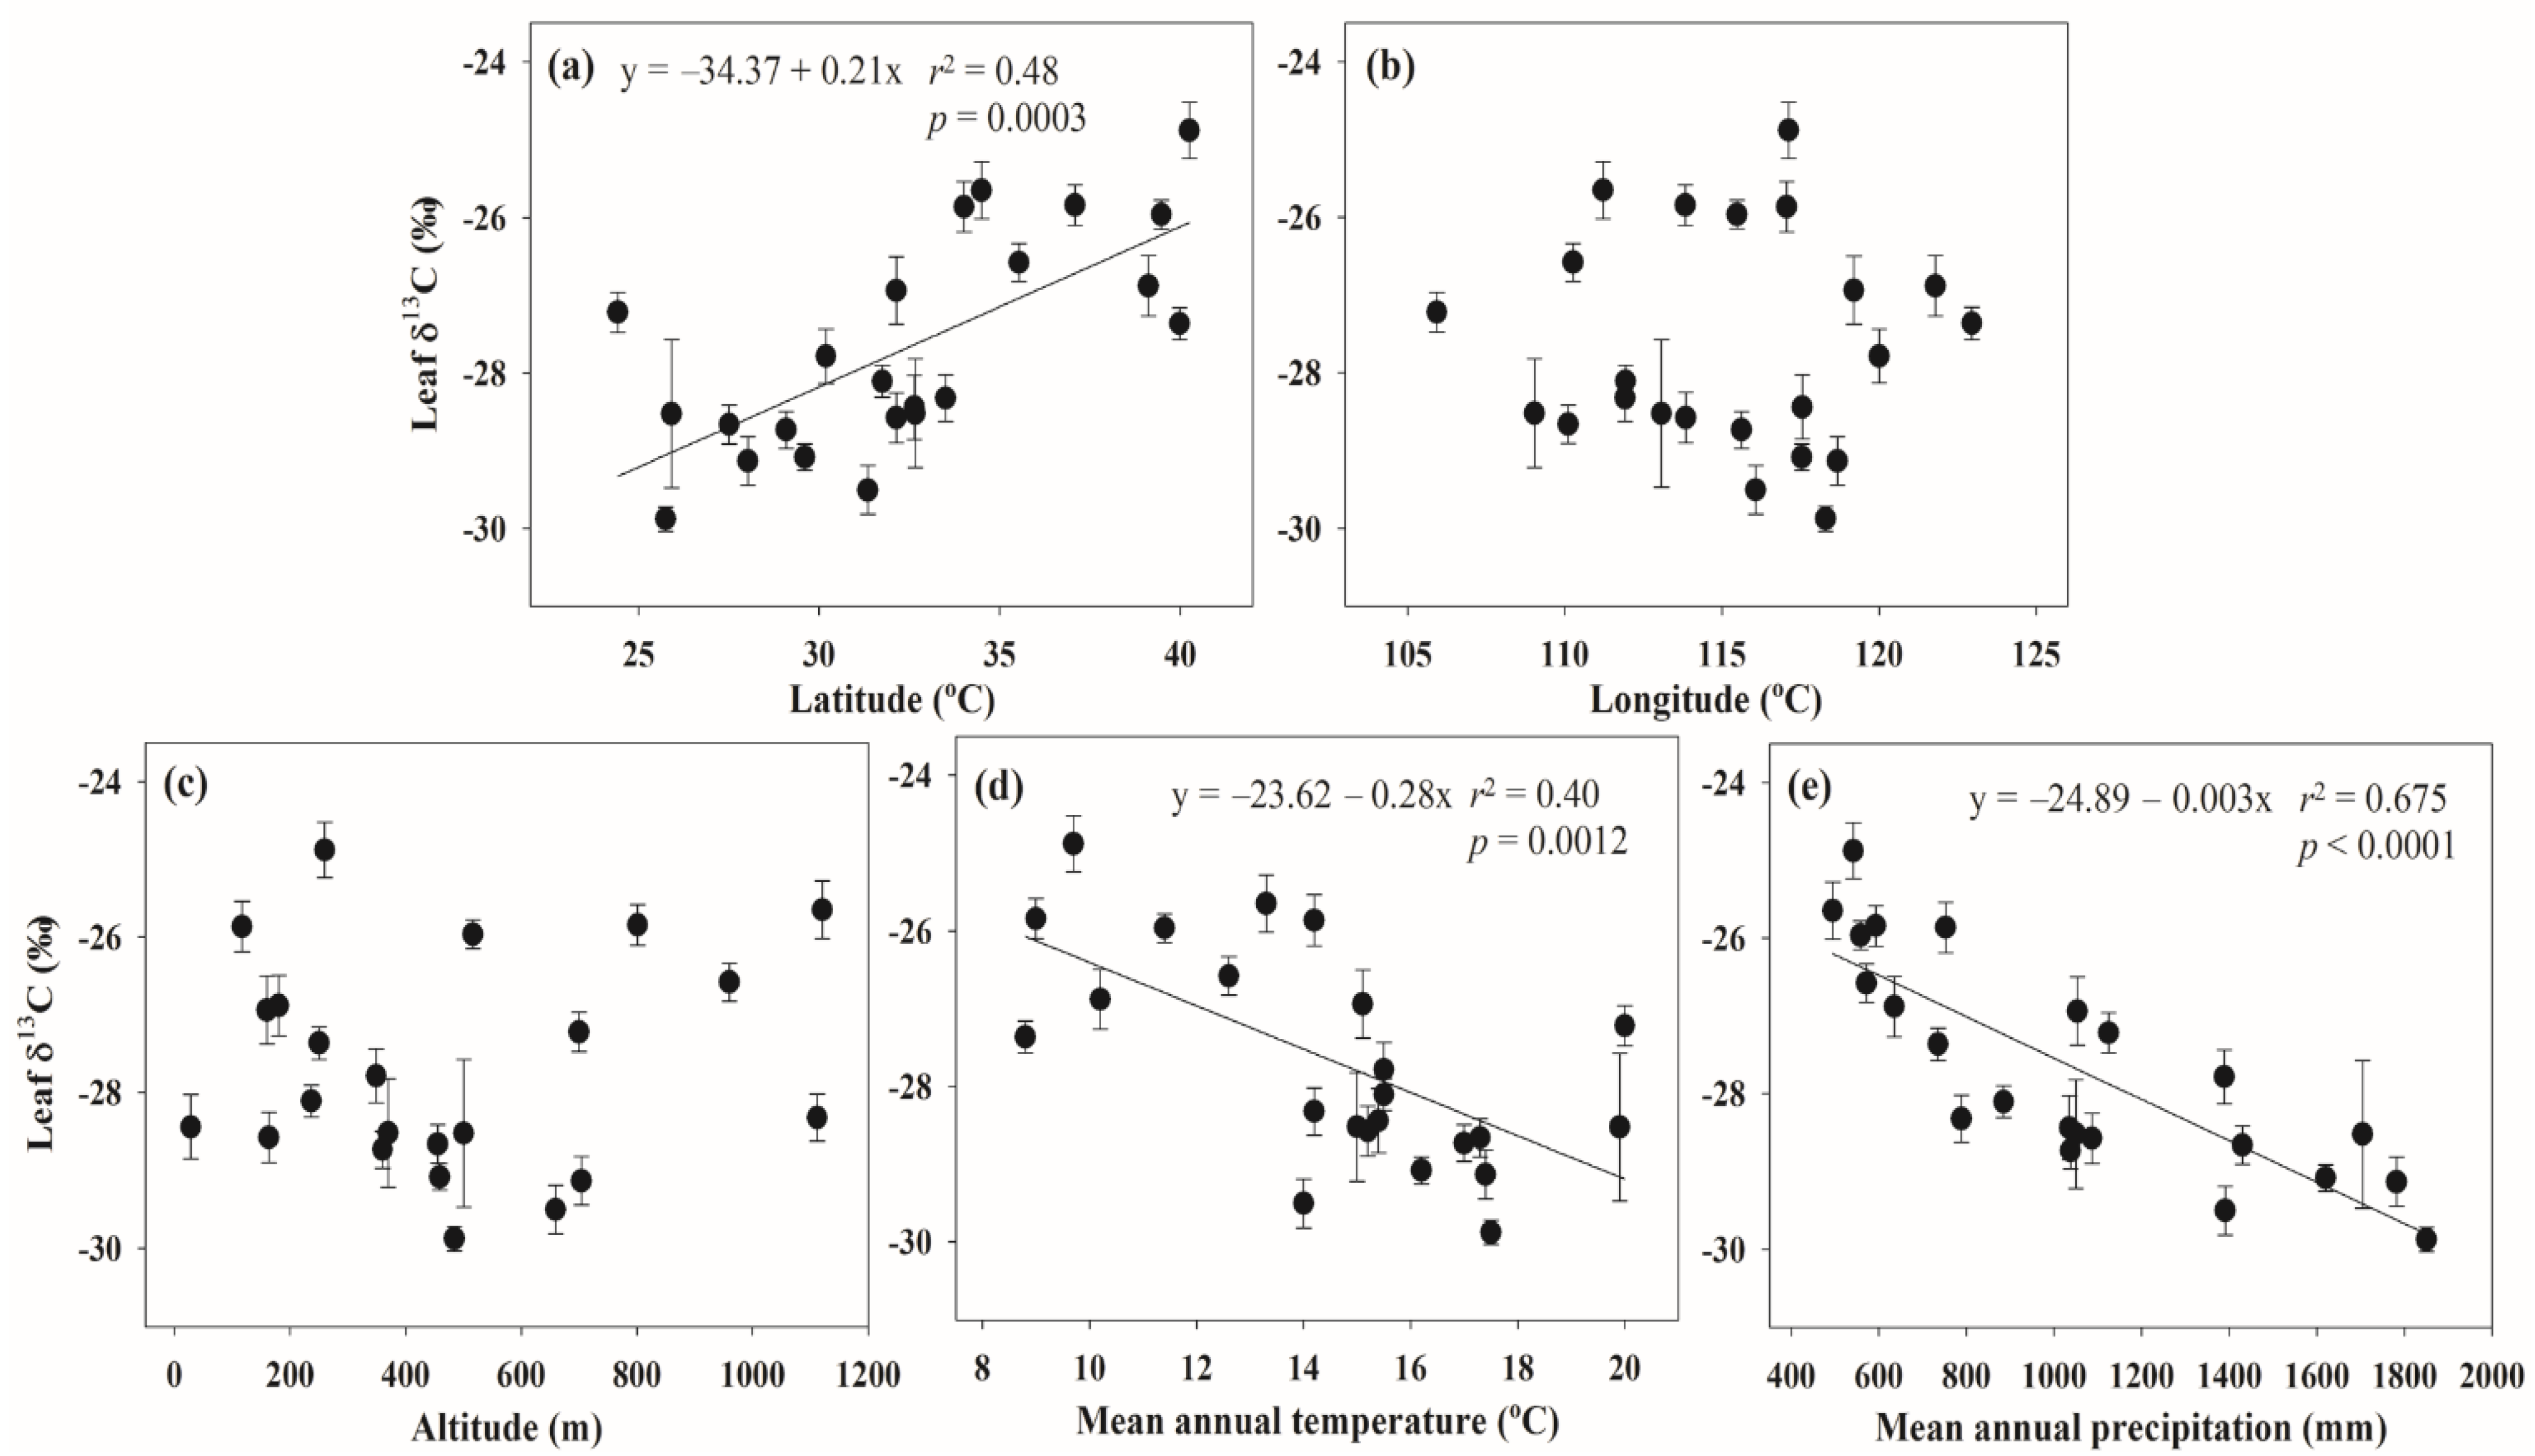
Leaf δ13C was significantly and positively correlated with latitude (r2 = 0.48, p = 0.0003), and significantly and negatively with MAT (r2 = 0.40, p = 0.0012) and MAP (r2 = 0.675, p < 0.0001) (Figure 2). There was no significant trend with altitude and longitude. By stepwise multiple regression analyses, MAP alone could account for 67.5 of the variation in leaf δ13C (Table 2).
Figure 2. Linear regressions of the relationship between leaf δ13C and five environmental variables: (a) latitude; (b) longitude; (c) altitude; (d) mean annual temperature; and (e) mean annual precipitation(n = 23, except for the sites at Anning and Kunming).
Forests 06 02296 g002
Table 2. A simple stepwise multiple regression of leaf δ13C (‰) against mean annual precipitation, and a full model describing leaf δ13C (‰) in terms of latitude (LAT), longitude (LON), altitude (ALT), mean annual temperature (MAT), mean annual precipitation (MAP) (n = 23, excluding the populations at Anningand Kunming).
MethodsEquationR2p
Full modelLeaf δ13C = −29.475 − 0.005 × LAT + 0.038 × LON + 0.000 × ALT + 0.032 × MAT − 0.003 × MAP0.680< 0.0001
StepwiseLeaf δ13C= −24.889 − 0.003 × MAP0.675< 0.0001

4. Discussion

Large variations of leaf δ13C have been observed for many species across their distribution range, showing plant adaptations to environmental change. In this study, the range of Q. variabilis leaf δ13C changed from −30‰ to −24‰, which is greater than within-country variations reported for other oak species. For example, evergreen oak species, Q. suber leaf δ13C varied from −28.58‰ to −24.58‰ in Mediterranean Portugal [17], and the range of Q. ilex δ13C values was 3.1‰ for Q. ilexin southern France[29]. For deciduous oak species, ranges for leaf δ13C of 1.9‰, 1.5‰, 0.7‰, and 4.4‰ have been reported for Q. faginea, Q. humilis, Q. petraea [28] and Q. pubescens [29], respectively. Plant carbon isotope discrimination is an ecophysiological property that can reflect the capacity of a species to cope with climatic stressors and, ultimately, define the range of their distribution. Therefore, the large range in the δ13C values for Q. variabilis population in this study demonstrates strong plasticity in response to the environment [37]. According to Castillo et al., spatial differences in carbon isotope levels at a regional scale can be used to model an area of similar precipitation [33]. This study, which focuses on an individual species at a large regional scale, demonstrates how carbon isotope can be used to develop isoscape models and therebyrefine our understanding of biogeochemical cycles [32].
Previous work has demonstrated that leaf δ13C can be related to spatial variables, such as latitude, altitude, MAT and MAP [1,3,6,24,26]. This paper shows that leaf δ13C of a selected species has a significant positive correlation with latitude and a negative correlation with MAT and MAP, with no significant correlation with altitude and longitude (Figure 2). Based on a Pearson correlation analysis, latitude is negatively correlated with MAT (R = −0.86, p < 0.0001) and MAP (R = −0.73, p < 0.0001) (Supplementary Table S2). Although longitude was also negatively correlated with altitude, there was no correlation of altitude with MAT and MAP (R = −0.74, p < 0.0001) (Supplementary Table S2). This suggests that the spatial variation of leaf δ13C is primary caused by differences in MAT and MAP, which vary with latitude.
Although both MAT and MAP show significant influence on leaf δ13C, MAP alone accounted for 67.5% of the variation in leaf δ13C (Table 2). Ferrio et al., in a study of Q. ilex in Spain, also showed that 59% of the variation in leaf δ13C could be explained by changes in precipitation [38]. Although this study focused on the response to mean annual precipitation, there is an argument that, for deciduous trees, a stronger relationship may be obtained from the mean precipitation in the growing season than over a calendar year.
In this paper, we used stepwise multiple regression analyses to minimize the problems with collinearity, for example MAT is positively correlated with MAP (r = 0.76, p < 0.0001). Our results suggest that MAP is the strongest predictor for leaf δ13C, in line with other observations [6,9]. The soil water content determines the leaf stomatal conductance and photosynthesis, and thereby the water use efficiency (WUE) of plants [39,40,41]. Environmentally induced increases in WUE, such as under drought, are expected to be accompanied by decreases in carbon isotope discrimination, because under drought, changes in pi/pa (ratio of intercellular to atmospheric partial pressures of CO2) and WUE will be largely due to stomatal closure [42].
The values of leaf δ13C for the population at the Anning and Kunming sites in theYunnan province were −24.8 ‰ and −24.4‰, respectively. This is higher than in other sites. The two sites were excluded for the regression analyses because we assumed that those high values were not caused by climate factors. Yunnan province has some of the highest soil phosphorus concentrations in China [43]. For example the soil P concentration at Anning and Kunming were 1.7 g kg−1, and 1.2 g kg−1, respectively, compared to 0.16–0.47 g kg−1 at the other sites [44]. P-rich soils, in addition to being high in phosphorus, contain relatively high levels of phosphate-associated elements such as Ca, Mg, Fe and Al, which can cause high concentrations N, P, Ca, Fe and Zn in the leaf. The concentrations of these elements in the Yunnan province were higher than those at P-deficient sites (p < 0.05) [44]. Organisms need to maintain the balance of internal element concentrations with respect to the environment (i.e., homeostasis) [45]. Zhou et al., also reported that element ratios were more stable than individual element concentrations regardless of P-rich and P-deficient sites [44]. Hence plants grown in the P-rich soil can fix more CO2 through photosynthesis to improve the carbon content of plant bodies in order to maintain homeostatic regulation. The process can result in decreased fractionation and high leaf δ13C. An alternative explanation is that the two sites are located in the high altitude mountains of a subtropical area, characterized by lower temperatures and precipitation levels than other sites at a subtropical latitude (Supplementary Table S1). Low temperature and precipitation can decrease photosynthesis, transpiration and leaf conductance, resulting in a high value for leaf δ13C [36].

5. Conclusions

Deciduous Q. variabilis, distributed across temperate-subtropical biomes, is one of the most extensive tree species in eastern Asia. The range of the values of leaf δ13C for Q. variabilis across 25 populations was as great as 6‰ (from −30.4‰ to −24.4‰). At a large regional scale, leaf δ13C is positively correlated with latitude and negatively correlated with MAT and MAP; there is no correlation between leaf δ13C and either altitude or longitude. MAP, which is partly determined by changes in latitude, could explain 68% of the regional variation in leaf δ13 at a large regional scale. The leaf δ13C decreased by 0.3‰ per 100 mm increase in MAP. These results can be used to model spatial precipitation and improve our understanding of the potential for plant adaptation to climate change and dry conditions.

Supplementary Files

Supplementary File 1

Acknowledgments

This work was financially supported by the National Natural Science Foundation of China (NSFC, 31270640, 31070532, 30800138, and 30671674). We would like to thank Xiao Sun, Pisheng Zhou, Zhicheng Liu, Lili Wu, Dongmei Chen, Jing Wang, ZaijunXin, Zhe Wang, Yongfu Li and Xinghu He for their assistance in the field work and laboratory analyses. We gratefully acknowledge the anonymous reviewers for their valuable suggestions for improving the manuscript.

Author Contribution

Chunjiang Liu, Paul J. Burgess and Hongzhang Kang designed the experiments and analysis; Yanhua Zhu, Xuan Zhou and Baoming Du performed the experiments; Shan Yin analyzed the data; Baoming Du wrote the paper together with Chunjiang Liu.

Conflicts of Interest

The authors declare no conflict of interest.

References

  1. Körner, C.; Farquhar, G.D.; Wong, S.C. Carbon isotope discrimination by plants follows latitudinal and altitudinal trends. Oecologia 1991, 88, 30–40. [Google Scholar] [CrossRef]
  2. Mulkey, S.S. Photosynthetic acclimation and water-use efficiency of three species of understory herbaceous bamboo (Gramineae) in Panama. Oecologia 1986, 70, 514–519. [Google Scholar] [CrossRef]
  3. Ehleringer, J.; Field, C.; Lin, Z.; Kuo, C. Leaf carbon isotope and mineral composition in subtropical plants along an irradiance cline. Oecologia 1986, 70, 520–526. [Google Scholar] [CrossRef]
  4. Zimmerman, J.K.; Ehleringer, J.R. Carbon isotope ratios are correlated with irradiance levels in the Panamanian orchid Catasetum viridiflavum. Oecologia 1990, 83, 247–249. [Google Scholar] [CrossRef] [PubMed]
  5. Kelly, C.K.; Woodward, F.I. Ecological Correlates of Carbon Isotope Composition of Leaves: A Comparative Analysis Testing for the Effects of Temperature, CO2 and O2 Partial Pressures and Taxonomic Relatedness on δ13C. J. Ecol. 1995, 257, 509–515. [Google Scholar] [CrossRef]
  6. Diefendorf, A.F.; Mueller, K.E.; Wing, S.L.; Koch, P.L.; Freeman, K.H. Global patterns in leaf 13C discrimination and implications for studies of past and future climate. Proc. Natl. Acad. Sci. USA 2010, 107, 5738–5743. [Google Scholar] [CrossRef] [PubMed]
  7. Hartman, G.; Danin, A. Isotopic values of plants in relation to water availability in the Eastern Mediterranean region. Oecologia 2010, 162, 837–852. [Google Scholar] [CrossRef] [PubMed]
  8. Peri, P.L.; Ladd, B.; Pepper, D.A.; Bonser, S.P.; Laffan, S.W.; Amelung, W. Carbon (δ13C)and nitrogen (δ15N) stable isotope composition in plant and soil in Southern Patagonia’s native forests. Glob. Chang. Biol. 2012, 18, 311–321. [Google Scholar] [CrossRef]
  9. Ramírez-Valiente, J.A.; Valladares, F.; Sánchez-Gómez, D.; Delgado, A.; Aranda, I. Population variation and natural selection on leaf traits in cork oak throughout its distribution range. Acta Oecol. 2014, 58, 49–56. [Google Scholar] [CrossRef]
  10. Vitousek, P.M.; Field, C.B.; Matson, P.A. Variation in foliar δ13C in Hawaiian Metrosideros polymorpha: A case of internal resistance? Oecologia 1990, 84, 362–370. [Google Scholar] [CrossRef]
  11. Koch, G.W.; Sillett, S.C.; Jennings, G.M.; Davis, S.D. The limits to tree height. Nature 2004, 428, 851–854. [Google Scholar] [CrossRef] [PubMed]
  12. Keenan, T.F.; Hollinger, D.Y.; Bohrer, G.; Dragoni, D.; Munger, J.W.; Schmid, H.P.; Richardson, A.D. Increase in forest water-use efficiency as atmospheric carbon dioxide concentrations rise. Nature 2013, 499, 324–327. [Google Scholar] [CrossRef] [PubMed]
  13. Korol, R.; Kirschbaum, M.; Farquhar, G.; Jeffreys, M. Effects of water status and soil fertility on the C-isotope signature in Pinus radiata. Tree Physiol. 1999, 19, 551–562. [Google Scholar] [CrossRef] [PubMed]
  14. Lauteri, M.; Pliura, A.; Monteverdi, M.C.; Brugnoli, E.; Villani, F.; Eriksson, G. Genetic variation in carbon isotope discrimination in six European populations of Castanea sativa Mill. originating from contrasting localities. J. Evol. Biol. 2004, 17, 1286–1296. [Google Scholar] [CrossRef] [PubMed]
  15. Schulze, E.D.; Williams, R.; Farquhar, G.; Schulze, W.; Langridge, J.; Miller, J.M.; Walker, B.H. Carbon and nitrogen isotope discrimination and nitrogen nutrition of trees along a rainfall gradient in northern Australia. Funct. Plant Biol. 1998, 25, 413–425. [Google Scholar] [CrossRef]
  16. Swap, R.; Aranibar, J.; Dowty, P.; Gilhooly, W.; Macko, S.A. Natural abundance of 13C and 15N in C3 and C4 vegetation of Southern Africa: Patterns and implications. Glob. Chang. Biol. 2004, 10, 350–358. [Google Scholar] [CrossRef]
  17. Gouveia, A.C.; Freitas, H. Modulation of leaf attributes and water use efficiency in Quercus suber along a rainfall gradient. Trees 2009, 23, 267–275. [Google Scholar] [CrossRef]
  18. Qu, C.M.; Han, X.G.; Su, B.; Huang, J.H.; Jiang, G.M. The characteristicsof foliar δ13C values of plants and plant water use efficiencyindicated by δ13C values in two fragmented rainforestsin Xishuangbanna, Yunnan. Acta Bot. Sin. 2001, 43, 186–192. [Google Scholar]
  19. Su, B.; Han, X.G.; Li, L.H.; Huang, J.H.; Bai, Y.F.; Qu, C.M. Responses of δ13C value and water use efficiency of plantspecies to environmental gradients along the grasslandzone of Northeast China Transect. Acta Phytoecol. Sin. 2000, 24, 648–655. [Google Scholar]
  20. Li, M.; Zhu, J. Variation of δ13C of wood and foliage with canopy height differs between evergreen and deciduous species in a temperate forest. Plant Ecol. 2011, 212, 543–551. [Google Scholar] [CrossRef]
  21. Chen, T.; Yang, M.X.; Feng, H.Y.; Xu, S.J.; Qiang, W.Y.; He, Y.Q.; An, L.Z. Spatial distribution of stable carbon isotopecompositions of plant leaves in the north of the Tibetan Plateau. J. Glaciol. Geocryol. 2003, 25, 83–87. [Google Scholar]
  22. Li, M.C.; Luo, T.X.; Kong, G.; Qian, G.J. Characteristics of stable carbon isotope composition of different life form speciesgrowing at the timbenine in Sergyemla Mountain. Acta Ecol. Sin. 2008, 28, 3160–3167. [Google Scholar]
  23. Givnish, T.J.; Wong, S.C.; Stuart-Williams, H.; Holloway-Phillips, M.; Farquhar, G.D. Determinants of maximum tree height in Eucalyptus species along a rainfall gradient in Victoria, Australia. Ecology 2014, 95, 2991–3007. [Google Scholar] [CrossRef]
  24. Körner, C.; Farquhar, G.D.; Roksandic, Z. A global survey of carbon isotope discrimination in plants from high altitude. Oecologia 1988, 74, 623–632. [Google Scholar] [CrossRef]
  25. Hultine, K.; Marshall, J. Altitude trends in conifer leaf morphology and stable carbon isotope composition. Oecologia 2000, 123, 32–40. [Google Scholar] [CrossRef]
  26. Van de Water, P.K.; Leavitt, S.W.; Betancourt, J.L. Leaf δ13C variability with elevation, slope aspect, and precipitation in the southwest United States. Oecologia 2002, 132, 332–343. [Google Scholar] [CrossRef]
  27. Du, B.; Liu, C.; Kang, H.; Zhu, P.; Yin, S.; Shen, G.; Hou, J.; Ilvesniemi, H. Climatic control on plant and soil δ13C along an altitudinal transect of Lushan Mountain in Subtropical China: Characteristics and interpretation of soil carbon dynamics. PLoS ONE 2014, 9, e86440. [Google Scholar] [CrossRef] [PubMed] [Green Version]
  28. Shestakova, T.A.; Aguilera, M.; Ferrio, J.P.; Gutiérrez, E.; Voltas, J. Unravelling spatiotemporal tree-ring signals in Mediterranean oaks: A variance-covariance modelling approach of carbon and oxygen isotope ratios. Tree Physiol. 2014, 34, 819–838. [Google Scholar] [CrossRef] [PubMed]
  29. Damesin, C.; Rambal, S.; Joffre, R. Between-tree variations in leaf δ13C of Quercus pubescens and Quercus ilex among Mediterranean habitats with different water availability. Oecologia 1997, 111, 26–35. [Google Scholar] [CrossRef]
  30. Klein, T.; Shpringer, I.; Fikler, B.; Elbaz, G.; Cohen, S.; Yakir, D. Relationships between stomatal regulation, water-use, and water-use efficiency of two coexisting key Mediterranean tree species. For. Ecol. Manag. 2013, 302, 34–42. [Google Scholar] [CrossRef]
  31. Donovan, L.A.; West, J.B.; McLeod, K.W. Quercus species differ in water and nutrient characteristics in a resource-limited fall-line sandhill habitat. Tree Physiol. 2000, 20, 929–936. [Google Scholar] [CrossRef] [PubMed]
  32. Bowen, G.J. Isoscapes: Spatial pattern in isotopic biogeochemistry. Ann. Rev. Earth Planet. Sci. 2010, 38, 161–187. [Google Scholar] [CrossRef]
  33. Castillo, J.; Aguilera, M.; Voltas, J.; Ferrio, J.P. Isoscapes of tree-ring carbon-13 perform like meteorological networks in predicting regional precipitation patterns. J. Geophys. Res. Biogeosciences 2013, 118, 352–360. [Google Scholar] [CrossRef]
  34. Wang, J.; Wang, S.; Kang, H.; Xin, Z.; Qian, Z.; Liu, C. Distribution pattern of oriental oak (Quercus variabilis Blume) and the characteristics of climate of distribution area in eastern Asia. J. Shanghai Jiaotong Univ. Agric. Sci. 2009, 27, 235–241. [Google Scholar]
  35. Wang, L.; Ren, X.; Liu, Y. Geographical distribution of deciduous oaks in China. J. Beijing For. Univ. 1985, 3, 57–69. [Google Scholar]
  36. Farquhar, G.D.; Ehleringer, J.R.; Hubick, K.T. Carbon isotope discrimination and photosynthesis. Annu. Rev. Plant Biol. 1989, 40, 503–537. [Google Scholar] [CrossRef]
  37. Ramírez-Valiente, J.A.; Sánchez-Gómez, D.; Aranda, I.; Valladares, F. Phenotypic plasticity and local adaptation in leaf ecophysiological traits of 13 contrasting cork oak populations under different water availabilities. Tree Physiol. 2010, 30, 618–627. [Google Scholar] [CrossRef] [PubMed]
  38. Ferrio, J.P.; Florit, A.; Vega, A.; Serrano, L.; Voltas, J. Δ13C and tree-ring width reflect different drought responses in Quercus ilex and Pinus halepensis. Oecologia 2003, 137, 512–518. [Google Scholar] [CrossRef] [PubMed]
  39. Di Matteo, G.; Perini, L.; Atzori, P.; de Angelis, P.; Mei, T.; Bertini, G.; Mugnozza, G.S.; Fabbio, G. Changes in foliar carbon isotope composition and seasonal stomatal conductance reveal adaptive traits in Mediterranean coppices affected by drought. J. For. Res. 2014, 25, 839–845. [Google Scholar] [CrossRef]
  40. Payne, W.; Sattelmacher, B. Effects of phosphorus and water supply on yield, transpirational water-use efficiency, and carbon isotope discrimination of pearl millet. Crop Sci. 2000, 40, 120–125. [Google Scholar]
  41. Turner, N.C.; Schulze, E.D.; Nicolle, D.; Schumacher, J.; Kuhlmann, I. Annual rainfall does not directly determine the carbon isotope ratio of leaves of Eucalyptus species. Physiol. Plant 2008, 132, 440–445. [Google Scholar] [CrossRef] [PubMed]
  42. Brugnoli, E.; Farquhar, G.D. Photosynthetic fractionation of carbon isotopes. In Photosynthesis: physiology and metabolism; Advances in Photosynthesis; Leegood, R.C., Sharkey, T.D., et al., Eds.; Kluwer Academic Publishers: Dordrecht, Holland, 2000; Volume 9, pp. 399–434. [Google Scholar]
  43. Xue, B. Status and developing potentiality of the phosphorite resource around Dianchi lake of Kunming. Geol. Chem. Miner. 2008, 30, 149–154. [Google Scholar]
  44. Zhou, X.; Sun, X.; Du, B.; Yin, S.; Liu, C. Multielement stoichiometry in Quercus variabilis under natural phosphorus variation in subtropical China. Sci. Rep. 2015, 5, 7839. [Google Scholar] [CrossRef] [PubMed]
  45. Karimi, R.; Folt, C.L. Beyond macronutrients: Element variability and multielement stoichiometry in freshwater invertebrates. Ecol. Lett. 2006, 9, 1273–1283. [Google Scholar] [CrossRef] [PubMed]