Article

Fabrication of Cell-Loaded Two-Phase 3D Constructs for Tissue Engineering

Institute of Biomaterials, Department of Materials Science and Engineering, University of Erlangen-Nuremberg, Cauerstraße 6, Erlangen 91058, Germany
*
Author to whom correspondence should be addressed.
Materials 2016, 9(11), 887; https://doi.org/10.3390/ma9110887
Submission received: 22 August 2016 / Revised: 14 October 2016 / Accepted: 17 October 2016 / Published: 1 November 2016
(This article belongs to the Special Issue Smart Hydrogels for (Bio)printing Applications)

Abstract

:
Hydrogel optimisation for biofabrication considering shape stability/mechanical properties and cell response is challenging. One approach to tackle this issue is to combine different additive manufacturing techniques, e.g., hot-melt extruded thermoplastics together with bioplotted cell loaded hydrogels in a sequential plotting process. This method enables the fabrication of 3D constructs mechanically supported by the thermoplastic structure and biologically functionalised by the hydrogel phase. In this study, polycaprolactone (PCL) and polyethylene glycol (PEG) blend (PCL-PEG) together with alginate dialdehyde gelatine hydrogel (ADA-GEL) loaded with stromal cell line (ST2) were investigated. PCL-PEG blends were evaluated concerning plotting properties to fabricate 3D scaffolds, namely miscibility, wetting behaviour and in terms of cell response. Scaffolds were characterised considering pore size, porosity, strut width, degradation behaviour and mechanical stability. Blends showed improved hydrophilicity and cell response with PEG blending increasing the degradation and decreasing the mechanical properties of the scaffolds. Hybrid constructs with PCL-PEG blend and ADA-GEL were fabricated. Cell viability, distribution, morphology and interaction of cells with the support structure were analysed. Increased degradation of the thermoplastic support structure and proliferation of the cells not only in the hydrogel, but also on the thermoplastic phase, indicates the potential of this novel material combination for biofabricating 3D tissue engineering scaffolds.

Graphical Abstract

1. Introduction

Considering the growing need for donor organs, biofabrication is a novel approach which can accelerate the success of tissue engineering strategies to tackle the problem of shortage of organ donors [1,2]. The use of additive manufacturing techniques to fabricate complex tissue equivalents which combine living cells, extracellular matrix materials, growth factors and also structural elements is receiving increasing research interest [3,4]. Hydrogels are the material class of choice for cell immobilisation [5]. Thus, hydrogels are also chosen for the one-step additive manufacturing of 3D constructs containing homogenously distributed cells, which mimic the complex structure of tissues [6,7]. Hydrogels, however, lack mechanical integrity for use in bone or cartilage tissue engineering [8,9]. Hence, different approaches are being put forward to overcome this drawback which should also take into account the viability of the immobilised cells. One possibility is changing the hydrogels properties by addition of inorganic fillers [10]. Hydrogels with immobilised cells can be also infiltrated in pre-fabricated 3D-structures, for example nanofibers fabricated by electrospinning have been infiltrated [11]. Visser et al. used melt electrospinning writing to fabricate highly porous 3D polycaprolactone (PCL) microfiber scaffolds, which were infiltrated in a second step with gelatine methacrylamide loaded with human chondrocytes [9]. The dispense plotting of PCL was established by Hutmacher et al. [12]. Several approaches have been put forward for coating plotted PCL scaffolds to improve the cell response [13,14]. Instead of only changing the surface properties of PCL, modifications to the bulk material have also been carried out, for example using PCL-PEG copolymers [15,16] and PCL/PLA blends [17]. The use of sequential bioplotting technique for the creation of mechanically enhanced 3D structures consisting of a thermoplastic hard phase (PCL) and a hydrogel (mostly alginate, but also a mixture of gelatine, hyaluronic acid, fibrinogen and glycerol) with immobilised cells has been also reported [18,19,20,21]. One advantage of this method is that the layer by layer approach enables the freedom for designing constructs with different materials and cell types in pre-defined positions, which are then fabricated in a one-step process [19]. Shim et al. adapted their process to fabricate osteochondral constructs by using osteoblasts and chondrocytes in different areas of the scaffold [22]. The sequential bioplotting technique is superior to the cell-seeding method of PCL scaffolds concerning seeding efficiency and cell distribution [20]. Grigore et al. showed in a comparative study that a system of alginate dialdehyde crosslinked with gelatine (ADA-GEL) has favourable properties considering the response of immobilised human osteoblast-like MG-63 cells compared to pure alginate [23]. The covalent crosslinking mechanism of alginate dialdehyde (ADA) and gelatine (GEL) happens over Schiff’s base formation between the free amino groups of GEL and the available aldehyde groups of ADA [24,25]. As like alginate, partially oxidized alginate (=ADA) can be ionically gelled using divalent cations like Ca2+ [26].
In this study, a sequential bioplotting approach using a novel material combination of PCL-PEG blend material and ADA-GEL was evaluated to fabricate advanced 3D cell containing constructs. In a first step the material and plotting process parameters of different PCL-PEG blends in comparison to pure PCL were evaluated as well as the degradation behaviour, mechanical performance and cell attachment. In a second step, the pre-evaluated PCL-PEG blend was used for the sequential bioplotting with ADA-GEL containing stromal cells (ST2 cells). In vitro characterisation of the fabricated constructs was done considering cell viability, cell distribution and cell interaction with the PCL-PEG blend by migration from the hydrogel phase.

2. Materials and Methods

2.1. Materials and Synthesis

PCL (Mn = 40,000 to 50,000) and PEG (Mn = 7000 to 9000) were purchased from Sigma Aldrich, St. Louis, MO, USA. Granules of PCL and PEG were mixed in appropriate ratios in the cartridge of the plotter system (Section 2.3) and heated up to 110 °C and mixed with a spatula to get PCL-PEG blends.
Sodium alginate (alginic acid sodium salt from marine brown algae, suitable for immobilization of microorganisms, Sigma-Aldrich) with a molecular weight of 100,000 to 200,000 g/mol and a guluronic acid content of 65%–70% and gelatine (Sigma-Aldrich, St. Louis, MO, USA) Type A, Bloom 300, derived from porcine skin, were used. Calcium chloride di-hydrate and sodium metaperiodate were obtained from VWR international, Radnor, PA, USA.
Covalently crosslinked alginate-gelatine (ADA-GEL) hydrogel was synthesized similar to the description of Sarker et al. [24]. Shortly, ADA was prepared by oxidation of alginate using sodium metaperiodate as an oxidising agent in ethanol-water mixture (1:1), for which 10 g of alginate dispersed in 50 mL of ethanol was mixed with 2.674 g sodium metaperiodate dissolved in 50 mL deionised water. This suspension was kept in the dark and stirred at room temperature for 6 h. The oxidation reaction was stopped by adding ethylene glycol (equivalent to alginate) (VWR International, Radnor, PA, USA) and stirring was continued for 30 min. Then the resultant suspension was filled into a semipermeable membrane (MWCO: 6000–8000 Da, Spectrum Lab, Irving, TX, USA), which was dialyzed against ultrapure water (Direct-Q®, Merck Millipore, Darmstadt, Germany). For ensuring the purification of the solution the water was changed several times during the 5 days of dialysis. In a next step, the suspension was lyophilised for 4 days.
For the preparation of the ADA-GEL hydrogel, 7.5% (w/v) aqueous solution of gelatine was dropped slowly into an ADA solution (7.5% (w/v)), in phosphate buffered saline (PBS, Life Technologies, Frankfurt, Germany) with a pH of 7.3 under stirring. For cell culture experiments the ADA as well as the gelatine solution were sterilized by filtration (0.45 µm and 0.22 µm pore size; Carl Roth, Karlsruhe, Germany).

2.2. Cell Culture and Cell Immobilisation

For cell culture studies bone marrow derived stromal cell line ST2 (German Collection of Microorganisms and Cell Culture, Braunschweig, Germany) was used. Culture medium MEM alpha (Life Technologies) supplemented with 10% (v/v) foetal bovine serum (FBS, Sigma-Aldrich) and 1% (v/v) penicillin/streptomycin (PS, Sigma-Aldrich) was chosen. The culture flasks (Greiner-BioOne, Frickenhausen, Germany) were placed in an incubator at 37 °C in a humidified atmosphere of 95% air and 5% CO2 with the cells growing for 48 h. For the biofabrication experiments the cells were washed with PBS and detached from the flasks surface using Trypsin/EDTA (Sigma-Aldrich). For adjusting the cell concentration they were counted with a hemocytometer (Carl Roth) and diluted with culture medium. The cell concentration was set to 2 million cells per mL ADA-GEL.

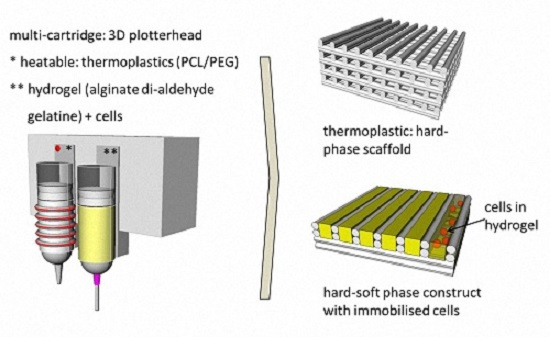
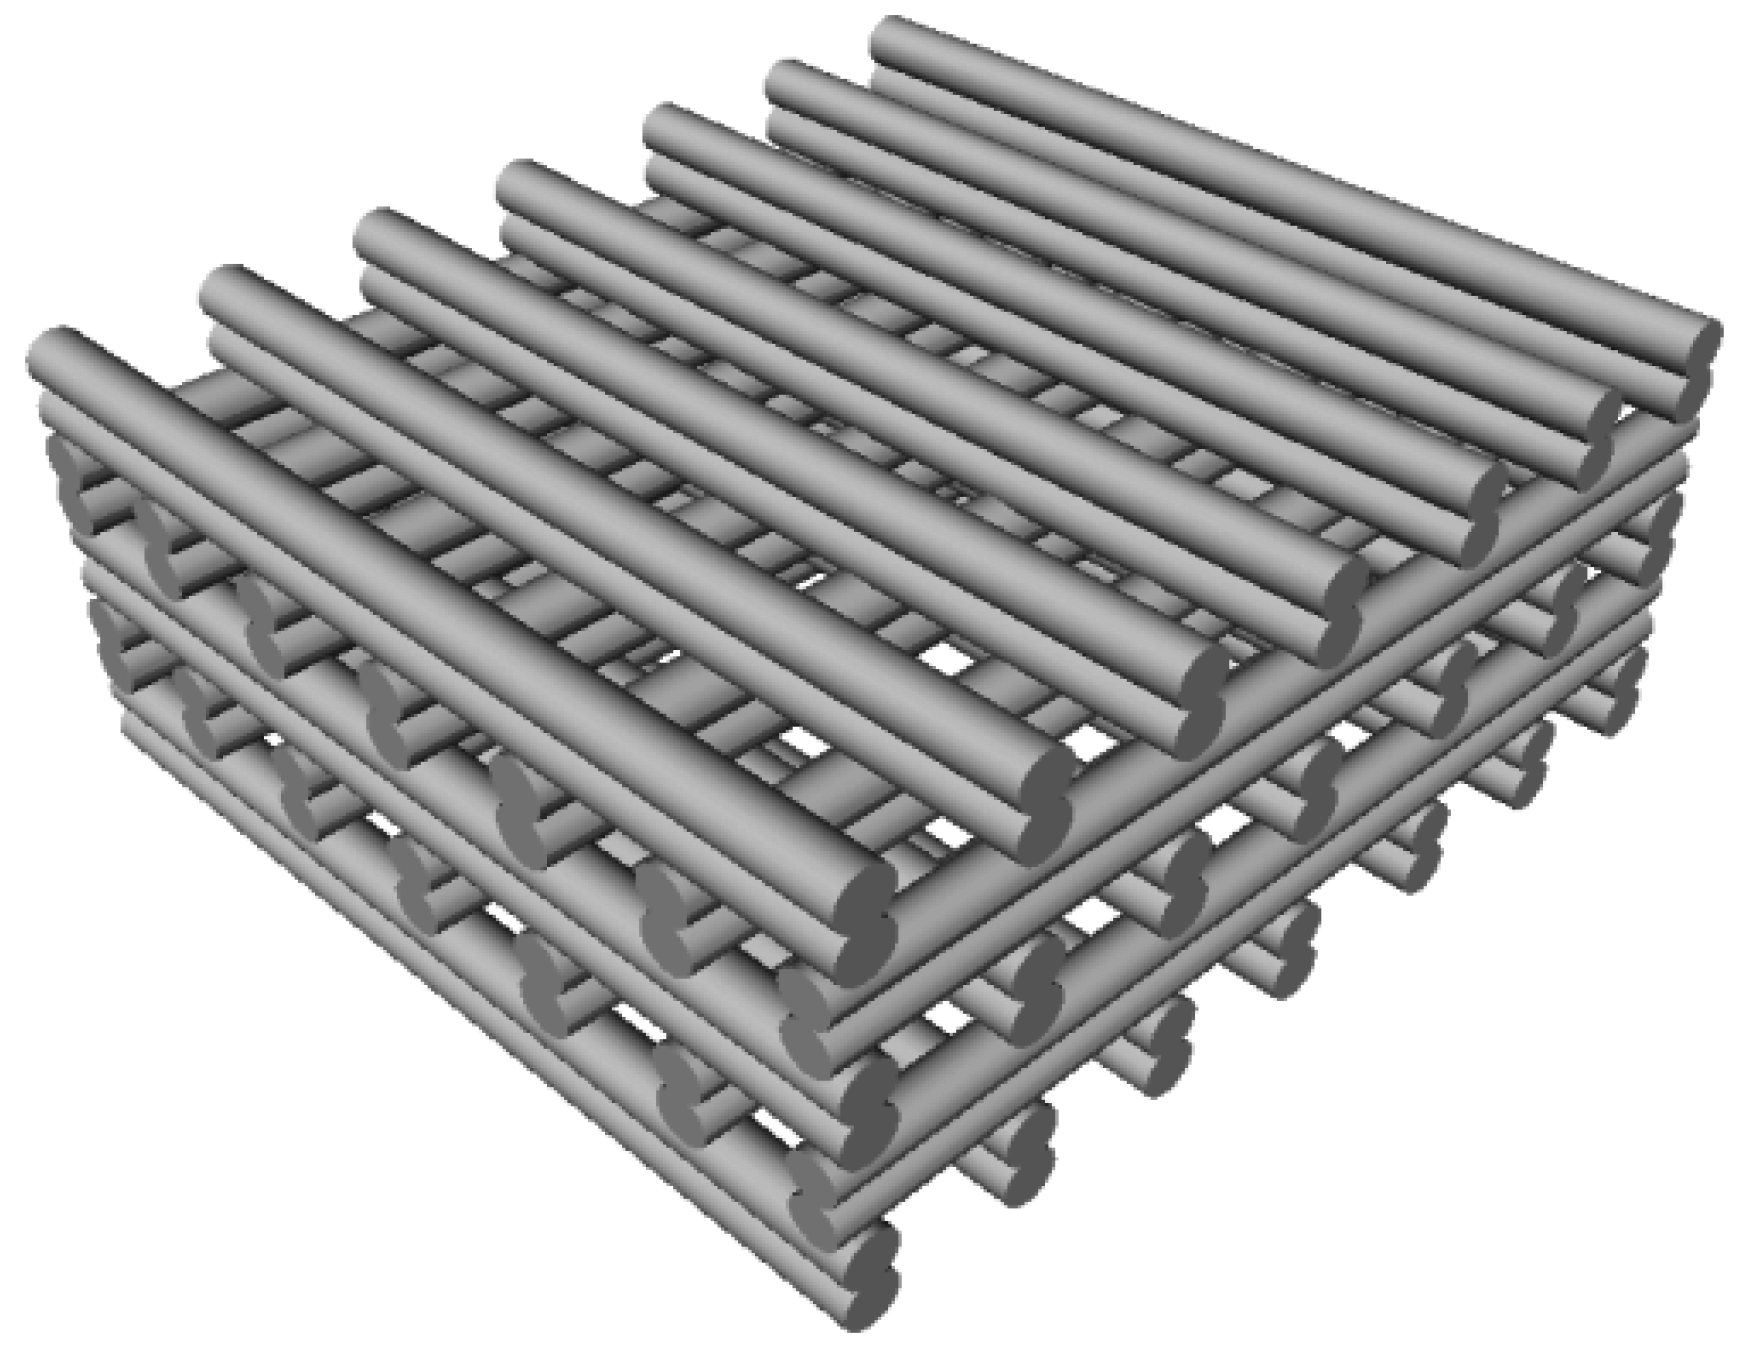
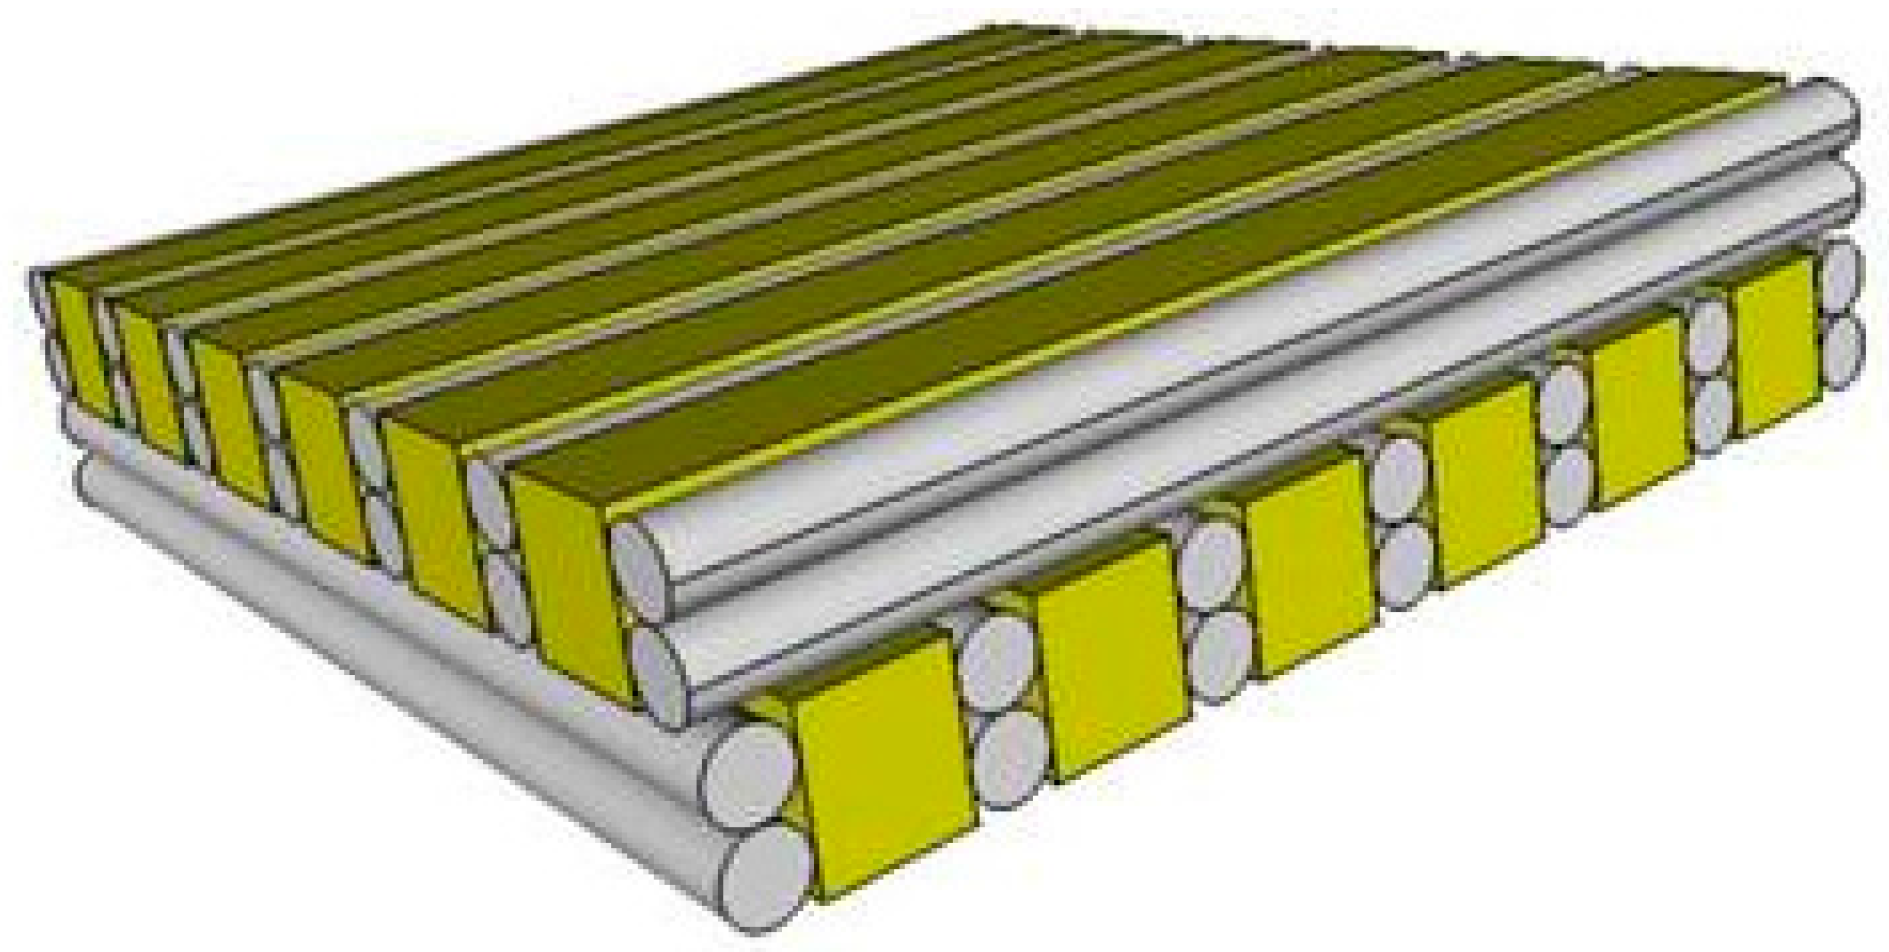
2.3. Scaffold Fabrication

For scaffold fabrication a bioplotting system (type Bioscaffolder 2.1, GeSiM mbH, Großerkmannsdorf, Germany) was used. The scaffold design was generated with the “ScaffoldGenerator software” (GeSiM mbH). The scaffold geometry was set to 10 mm × 10 mm × 4.5 mm. Scaffolds were built of 18 double layers, means each layer consists of two struts plotted in reverse directions (as schematically shown in Figure 1). Subsequent layers were positioned in a 90° pattern with either 10 or 14 parallel lines with equal interspace. A conic aluminium nozzle (Vieweg GmbH, Kranzberg, Germany) with a diameter of 250 µm was used. The plotting speed was set to 4 mm/s and pressure to 410 kPa for all PCL or PCL-PEG compositions. The processing temperature was set at 120 °C for PCL, 110 °C to 100 °C for PCL-PEG 80-20 and 90 °C to 80 °C for PCL-PEG 70-30. Further increase of PEG content resulted in scaffolds of inferior quality.
The scaffolds of the sequential bioplotting process had two double layers in z-direction and the 10 line design was used to guarantee a high volume share of ADA-GEL with immobilised ST2 cells, which was plotted in the interspace (as schematically shown in Figure 2). The ADA-GEL was plotted with 10 mm/s, 170 kPa and 200 µm needle (Nordson EFD, Oberhaching, Germany). Considering the improved cell response, according to the results of cell viability in Figure 1 using a PCL-PEG 7030 blend, the hard-soft scaffolds were fabricated with this material composition. The plotting process of the ADA-GEL hydrogel was evaluated and described in more detail earlier [27].

2.4. Hard-Phase Evaluation
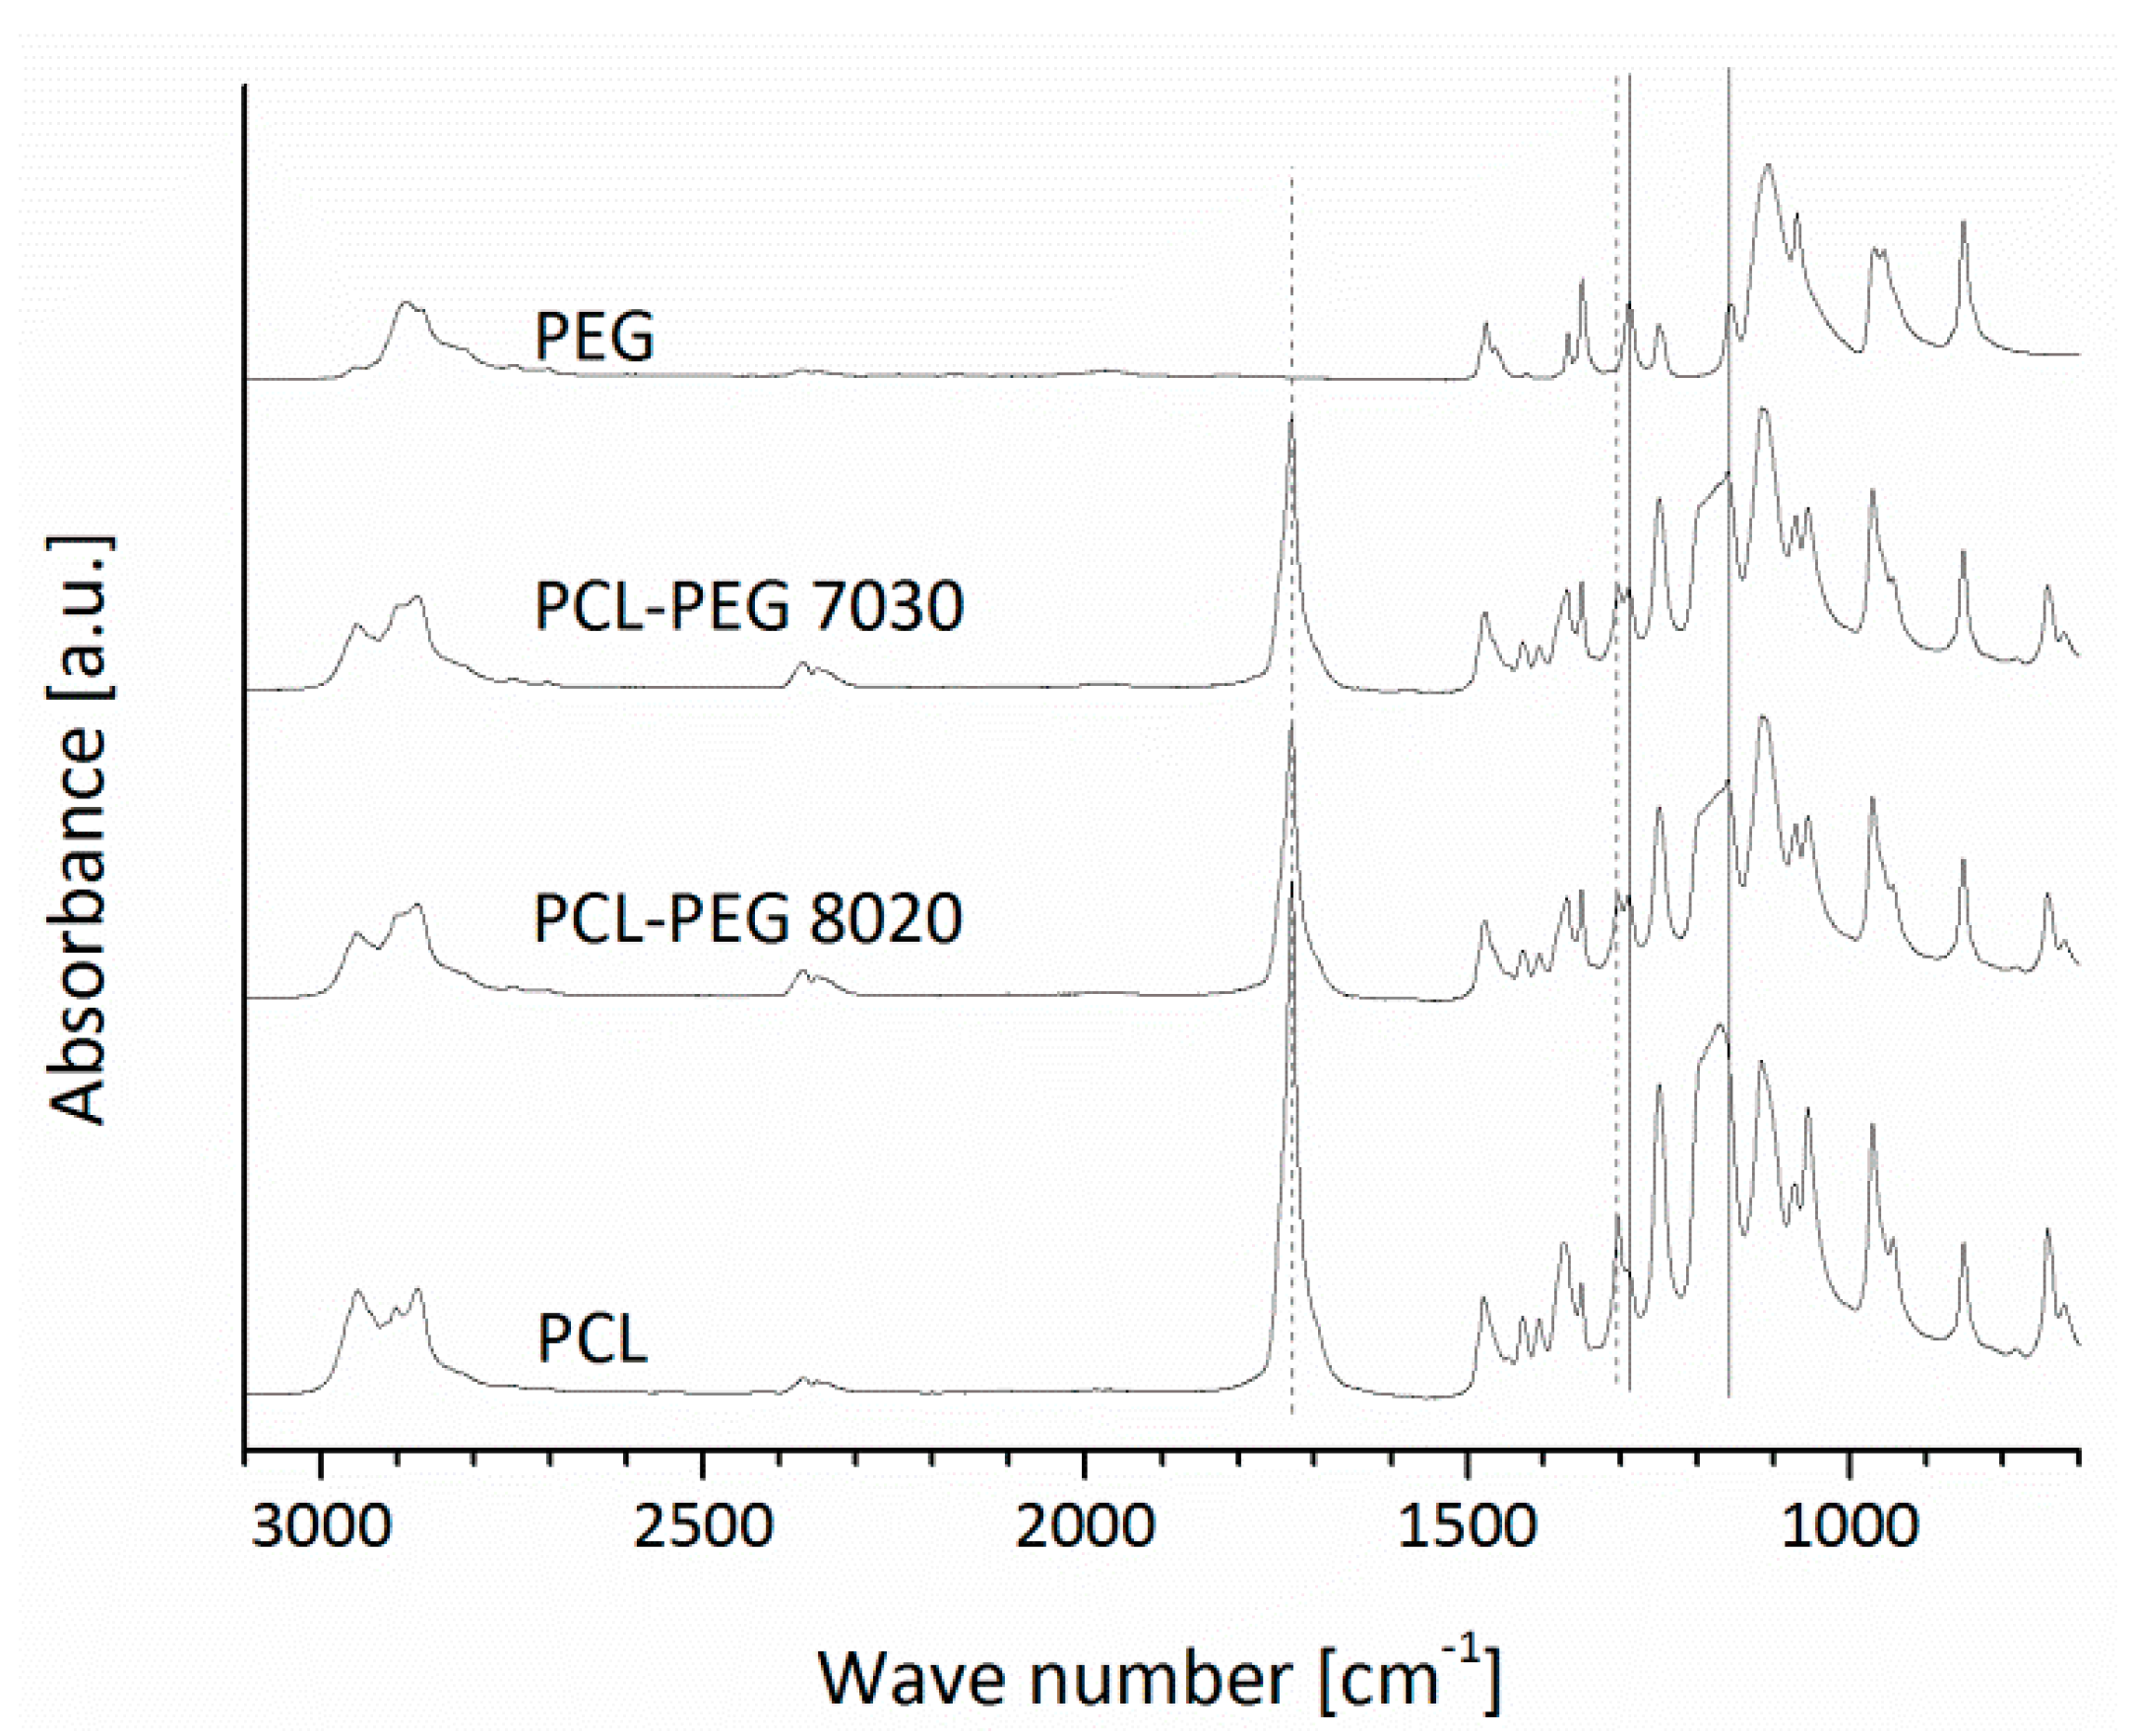
2.4.1. FTIR

A Fourier transform infrared (FTIR) spectrometer (Nicolet 6700, Thermo Scientific, Dreieich, Germany) was used to evaluate the material composition of plotted planar structures (10 mm × 10 mm) with different material compositions. A wave number range from 650 cm−1 up to 4000 cm−1 was used.

2.4.2. Contact Angle Measurement

Contact angle measurements were done by the sessile drop method using ultrapure water. The resulting contact angle was determined by a drop shape analyser (DSA30 Kruess GmbH, Hamburg, Germany). Planar structures were plotted with the different material compositions.

2.4.3. Cell Behaviour on Different PCL-PEG Blends

Planar structures of PCL, PCL-PEG 8020 and PCL-PEG 7030 were plotted and seeded with ST2 cells in a concentration of 100,000 cells/mL alpha-MEM cell culture medium and incubated for a period of 21 days.
For investigating cell morphology and distribution, cells were labelled with Vybrant (DiI) (Life Technologies) by adding 5 µL to 1 mL cell culture media and incubating for 30 min at 37 °C. Afterwards samples were washed three times with PBS. Fluorescence fixing solution was added for 15 min. For staining the cell nucleus DAPI was used with a concentration of 1 µL per mL cell culture medium. Fluorescence microscope (FM, Scope.A1, Carl Zeiss, Oberkochen, Germany) was used for imaging.
Cell viability was determined using WST-8 assay kit (Sigma-Aldrich). WST-8 assay solution and cell culture medium were mixed in a ratio of 1:100 and 1 mL was added to each sample. After 2 h of incubation at 37 °C, the absorbance at 450 nm was analysed using spectrophotometer (PHOmo, Anthos Mikrosysteme GmbH, Krefeld, Germany). The measurements were repeated after 2 days, 7 days, 14 days and 21 days of incubation.

2.5. Hard-Phase Scaffold Characterisation

2.5.1. Strut Size and Pore Size

Images were obtained using bright field microscopy (BF, Scope.A1, Carl Zeiss). The width of the struts from the top scaffold-layer in z-direction was measured using ImageJ (open source Java image processing program) software. In the same manner, the pore size was also obtained.

2.5.2. Porosity

Porosity was determined by measuring the density of the samples using density kit of analytical balance (Kern, Germany). The weight of the samples was measured in air and in 99.8% ethanol, with ethanol density set to 0.800 g/cm3. Based on the results, the volumetric mass density was calculated. The exterior dimensions of the samples were measured using a calliper (accuracy of 50 μm). Using this data, the total porosity was calculated.

2.5.3. Mechanical Testing

Mechanical properties of the samples were investigated using a compression testing machine (Zwick Z050, Zwick Roell GmbH, Ulm, Germany). The upper force limit was set to 1 kN, the compression rate to 1 mm/min and the maximum deformation to 3 mm. The compressive stiffness of the scaffolds was determined from the initial linear region of the stress–strain curve.

2.5.4. Degradation Study

Samples with 14-line-design of each composition were incubated in Hank’s balanced salt solution (HBSS) (Sigma-Aldrich) for three days at 37 °C. After drying the samples for 24 h, the weight was measured to examine the mass loss.

2.5.5. Scanning Electron Microscopy (SEM)

For characterisation of the morphology of PCL and PCL-PEG scaffolds SEM (Auriga CrossBeam, Carl Zeiss Microscopy GmbH, Oberkochen, Germany) was used.

2.6. Hard-Soft Phase Scaffolds: In-Vitro Characterisation

2.6.1. Optical Microscopy

Over the whole incubation period, cell development in the hydrogels was observed by light microscopy (Primo Vert, Carl Zeiss, Oberkochen, Germany).

2.6.2. Cell Viability

Cell viability was investigated with WST-8 assay kit as described in the previous section. Incubation period was set to 4 h.

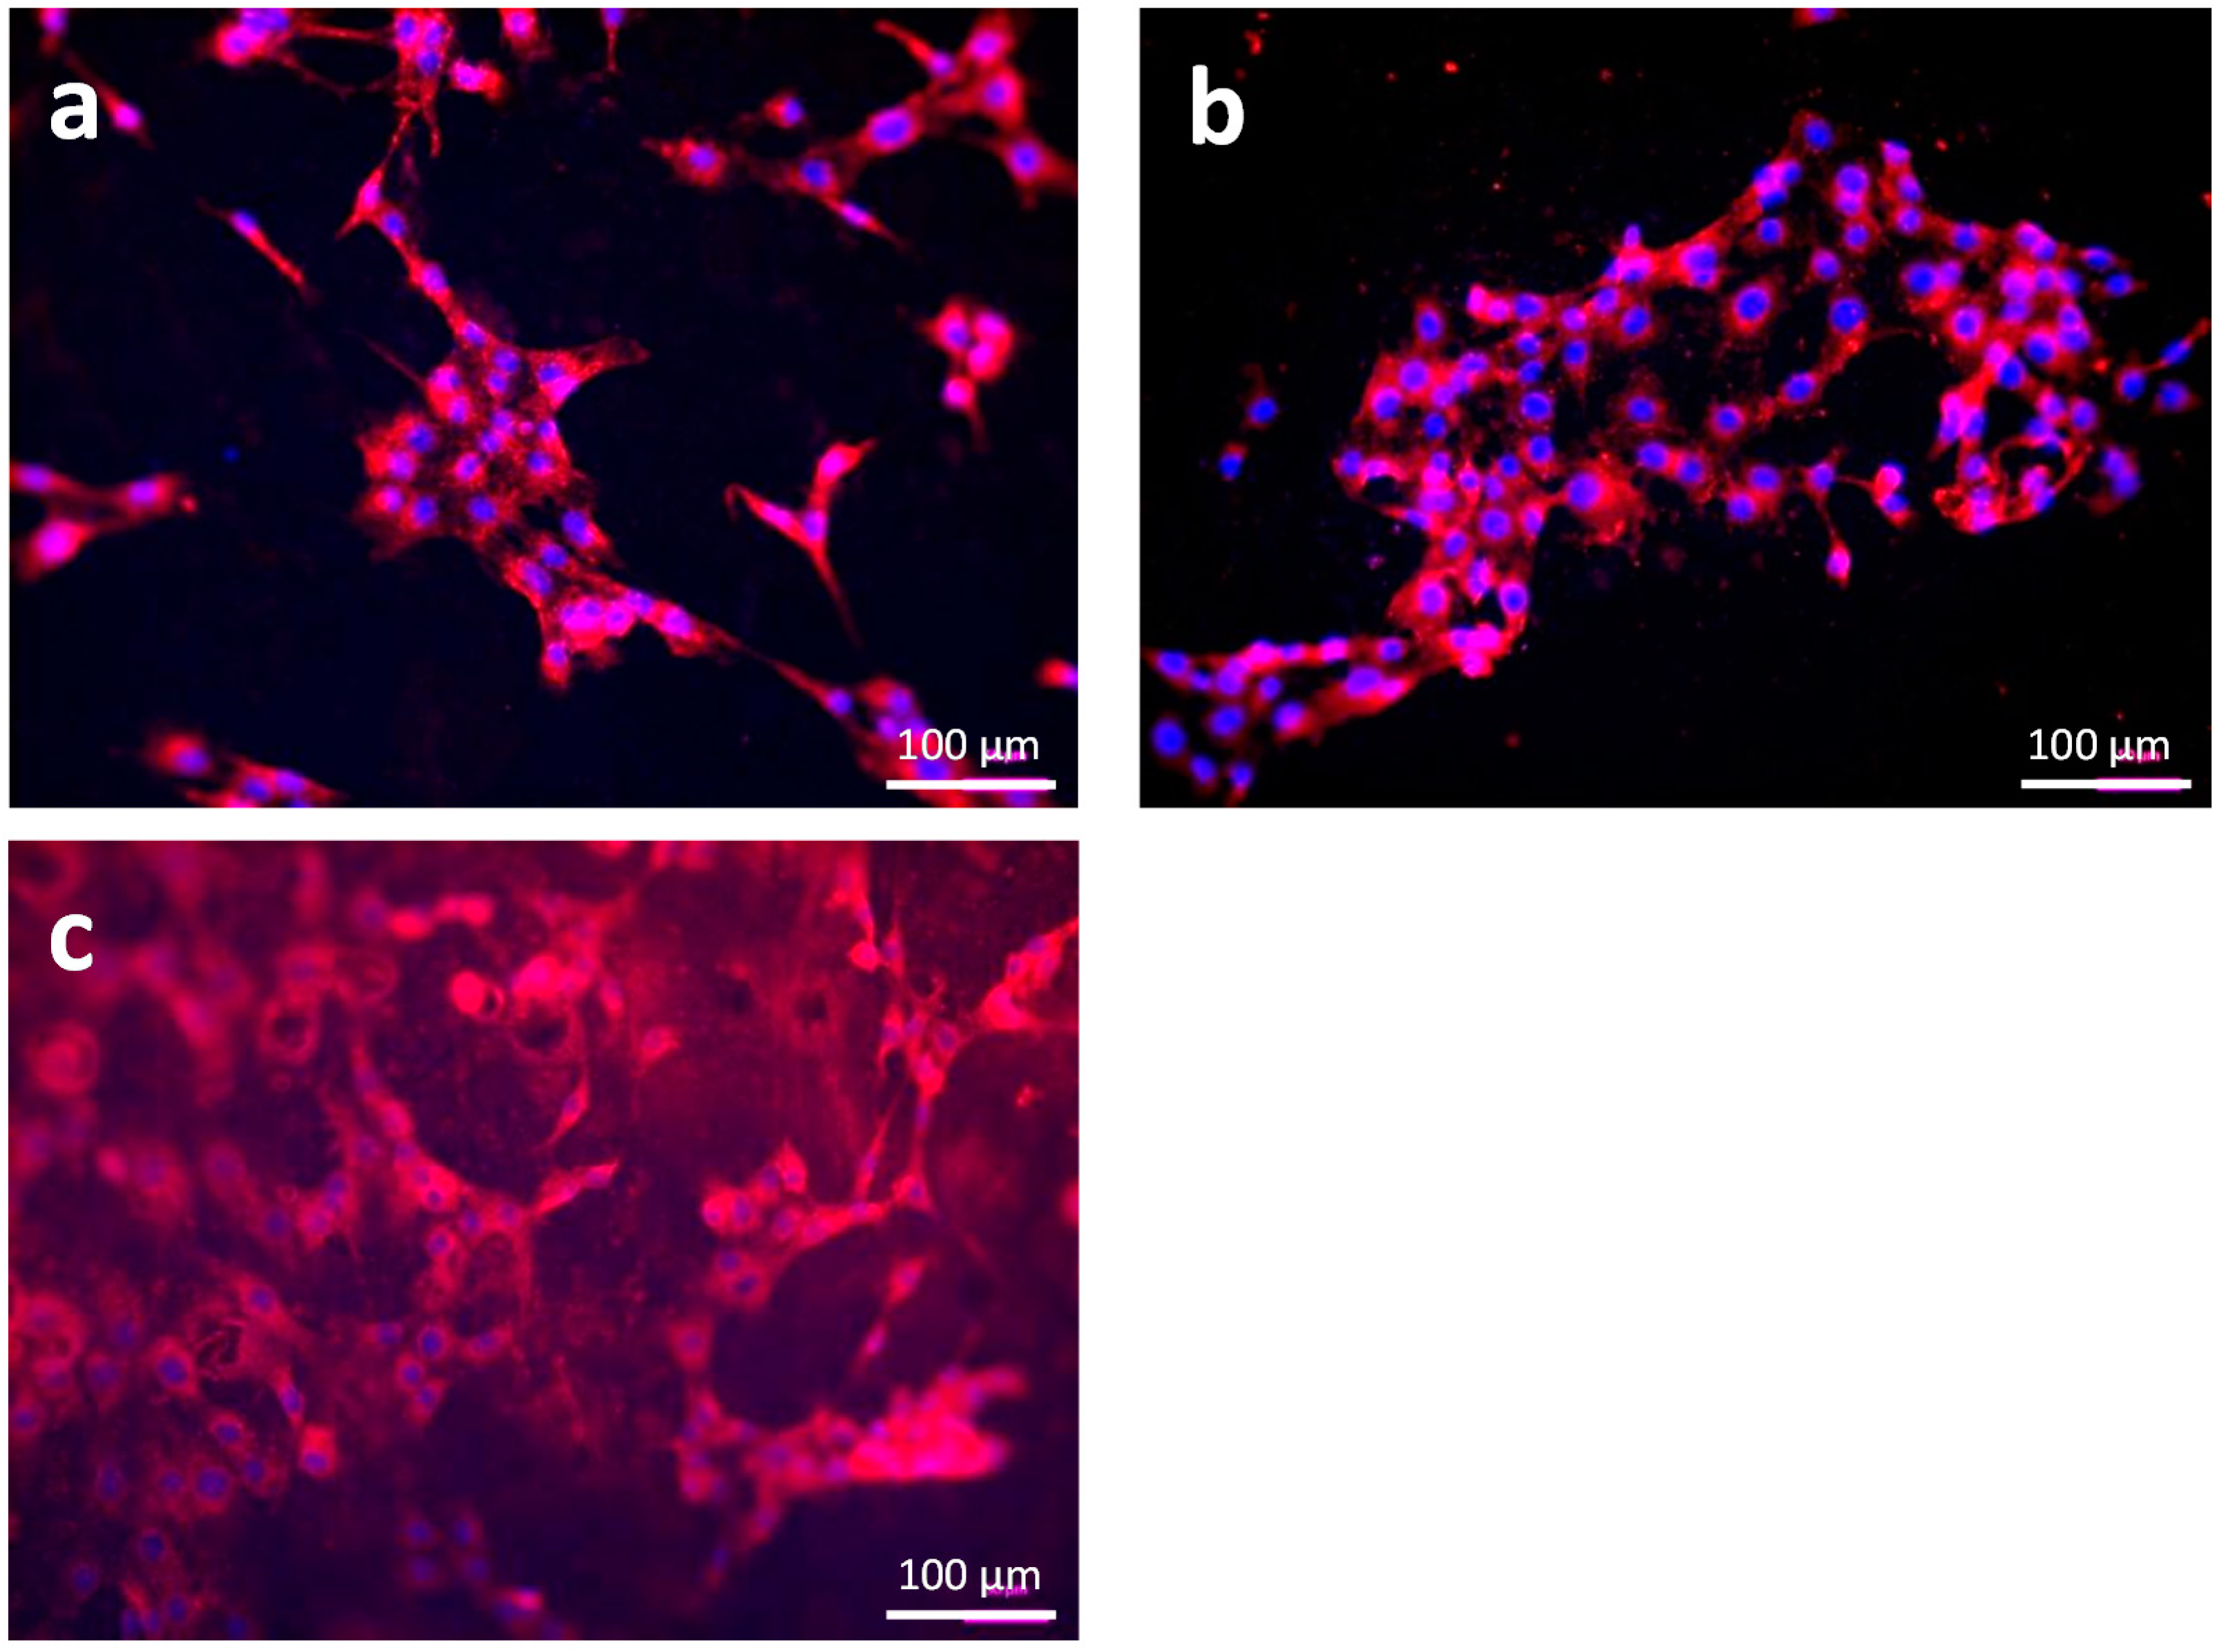
2.6.3. Cell Adhesion

For staining the actin filaments of cells and the cell nuclei, phalloidin (red) (Life Technologies) and sytox (green) (Life Technologies) were used, respectively, as described earlier [27].

2.7. Statistical Analysis

For statistical analysis of the differences the one-way analysis of variances and Tukey post-hoc comparison was used, which is implemented in Origin 9.0G (OriginLab Corporation, Northampton, MA, USA) software. The significance level was set as p < 0.05 = *, p < 0.01 = ** and p < 0.001 = ***. The number of samples for the cell viability studies was N = 4 with cells on PCL and PCL-PEG plates and N = 8 in hard-soft constructs. For the mechanical analysis, 6 samples per group, except for the PCL-PEG 8020 group with 10 strut design with 7 samples, were used.

3. Results and Discussion

3.1. Hard-Phase Evaluation

3.1.1. FTIR

In Figure 3, the FTIR spectra of PCL, PCL-PEG blends and PEG plotted plates are presented.
It is shown that typical PCL absorption bands attributed to the C-O and C-C stretching in the crystalline phase (at ~1295 cm−1) [28], the C=O carbonyl stretching (at ~1730 cm−1) [28,29] are visible for pure PCL and the PCL-PEG blends, but not for pure PEG. The peak at around 1287 cm−1 is sharper for pure PEG and PCL-PEG blends [30]. The peak at around 1158 cm−1 attributed to ether groups [31] is sharp for the pure PEG and it is also present in the spectra of PCL-PEG blends. For pure PCL, there is a slightly shifted peak at 1171 cm−1, which could be ascribed to the C-O and C-C stretching in the amorphous phase [28]. Peaks of both pure materials were found in the blend compositions, but there are no shifts or new peaks visible indicating possible intermolecular interactions [29,32].

3.1.2. Contact Angle Measurements

The contact angle of the PCL-PEG blends (ratio 8020 = 58° ± 3°, ratio 7030 = 65° ± 1°) was reduced compared to pure PCL (78°), which is comparable for values reported by Won et al. [14] (80°). This could be explained by the hydrophilic properties of PEG [33] compared to the hydrophobic PCL [34]. The increase of contact angle for blends 8020 to 7030 is possibly caused by not completely homogenous mixing. Hoque et al. [15] reported that a PCL-PEG copolymer had a contact angle of around 40° in comparison to 90° for pure PCL. The decrease in the contact angle has a very positive effect on the wettability of the samples, as also shown in Figure S1.

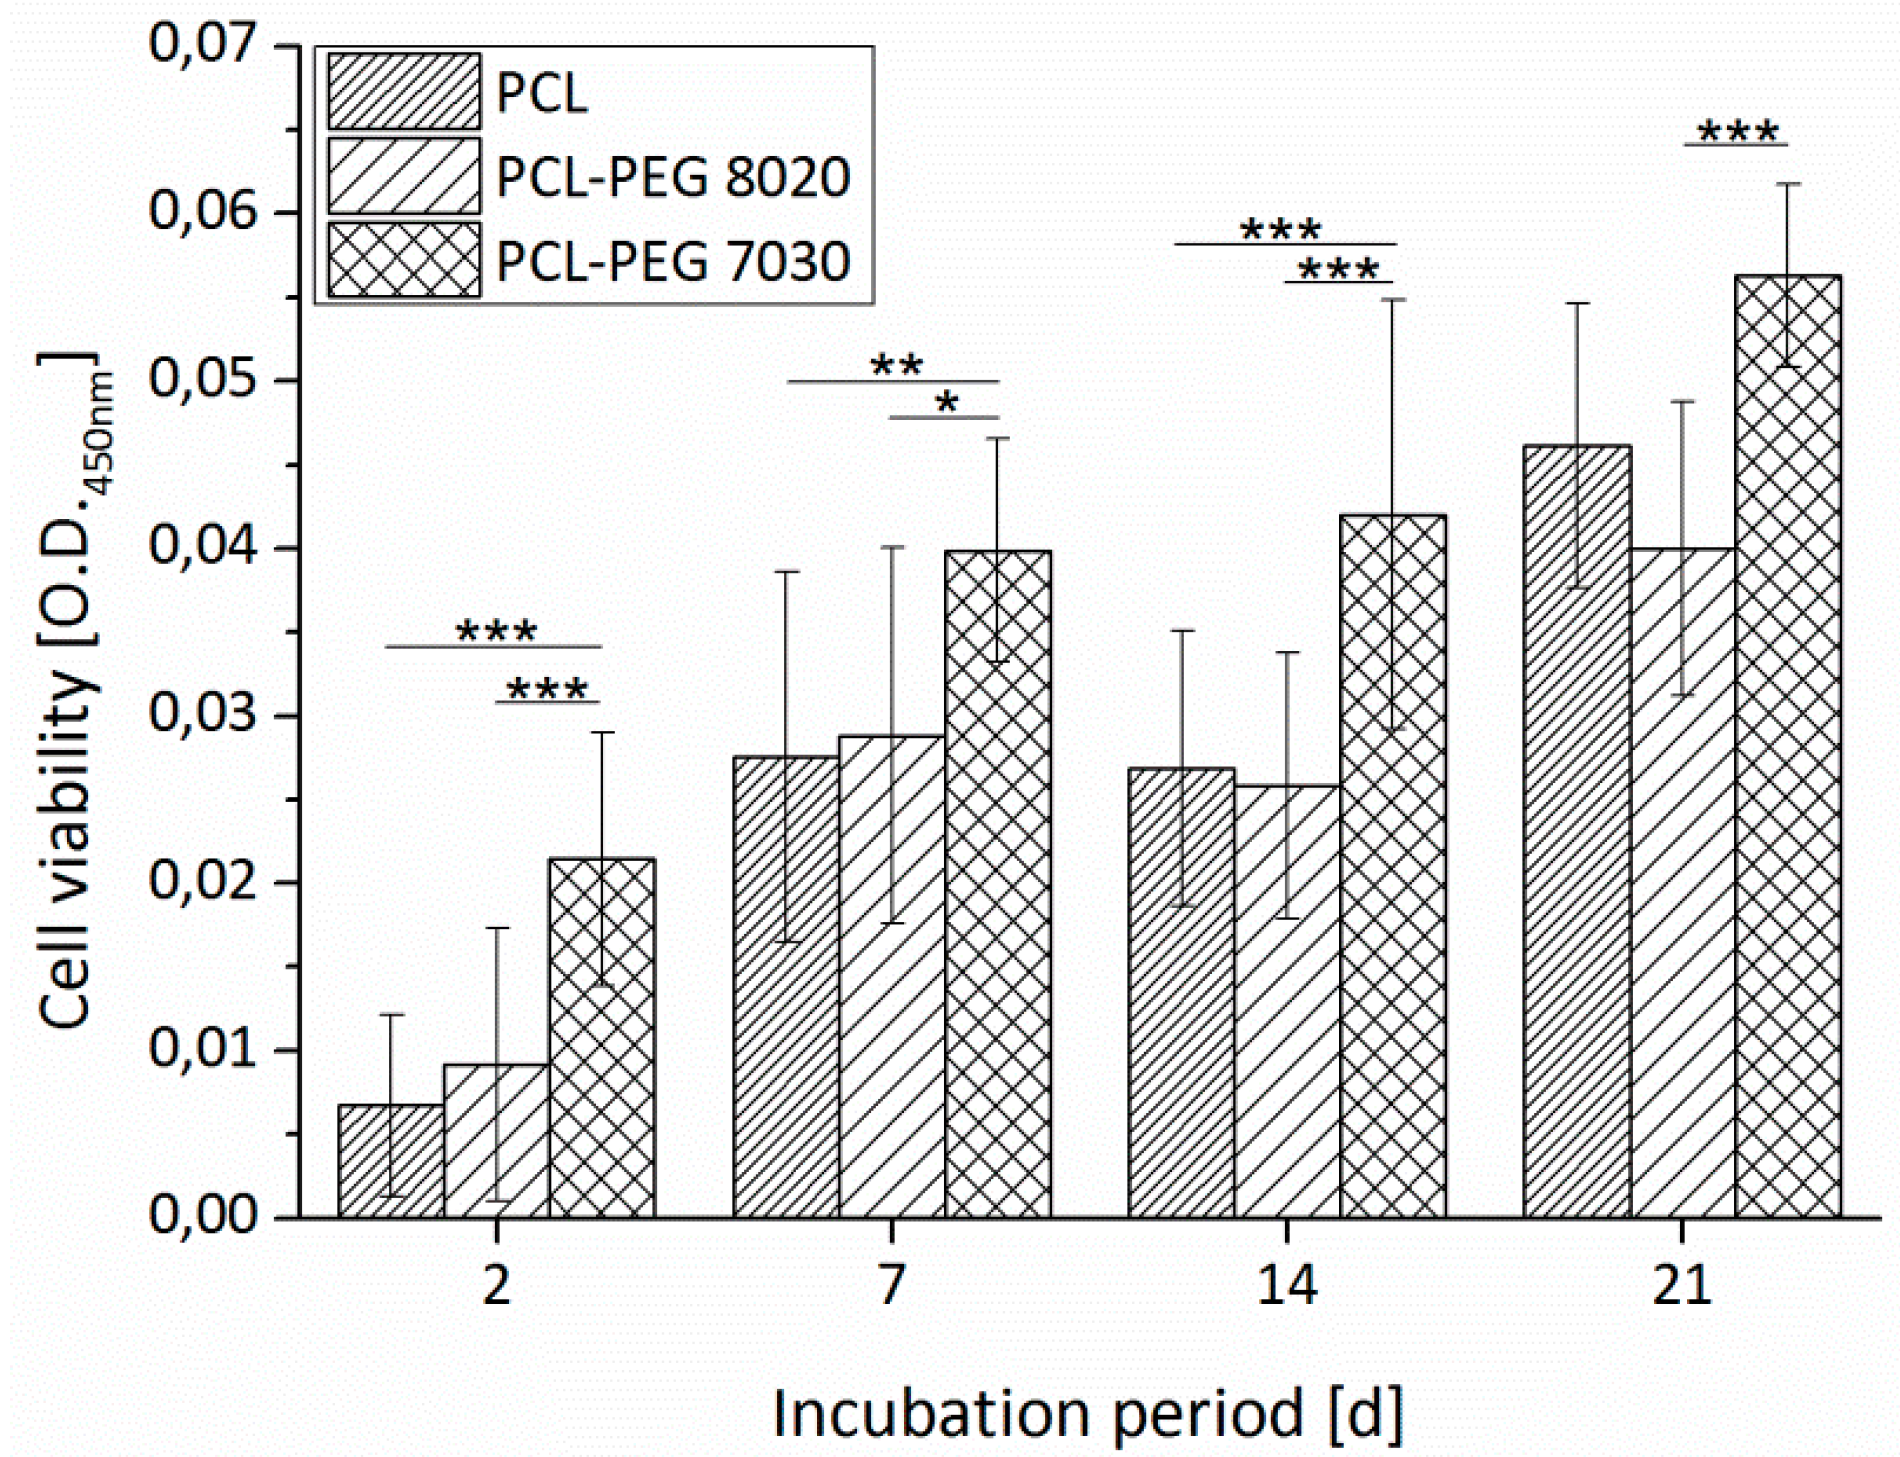
3.1.3. Cell Adhesion and Cell Viability

PCL has been modified in form of PCL-PEG diblock and triblock [15] copolymers and by using blends of PCL/PLA [17] and PCL/PLGA [19] to successfully improve the cell response by overcoming the hydrophobic properties of PCL. In Figure 4, fluorescence microscopy images of ST2 cells on PCL and PCL-PEG blends with different composition are shown after two days of incubation. The cells are attached on all three materials. On pure PCL (Figure 4a), a higher number of single cells is visible in comparison to the blends, whereas on the 7030 (Figure 4c) composition the cells show a more dense and more homogenous distribution than on the 8020 (Figure 4b) composition. This result indicates that cell adhesion is possible on all compositions and is consistent with previous results for PCL-PEG copolymers [15].
In Figure 5, the viability of ST2 stroma cells seeded on PCL and PCL-PEG plotted plates is presented. The results of cell viability kinetic at several time points during the 21 days of incubation indicate that the PCL-PEG blend of 7030 composition is superior to pure PCL and PCL-PEG 8020 blend. One possible explanation, regarding the contact angle measurements, is the improved wetting behaviour comparing pure PCL. Nevertheless, the similar contact angle of the two blend materials does not explain the cell viability of the 8020 composition in comparison to pure PCL. Thus, additionally topographic structure changes in the surface could explain the improved behaviour of the 7030 composition considering the degradation behaviour of the materials (data shown later in this article). Patrício et al. [35] showed that the blending method of PCL/PLA had influence on the surface roughness of plotted scaffolds and so possibly on the cell performance.

3.2. Hard-Phase Scaffold Characterisation

3.2.1. Scaffold Design Data

Scaffolds consisting of pure PCL and PCL-PEG blends with a composition of 8020 as well as 7030 and with two different design approaches by varying the number of struts per layer were plotted. The process parameters were adjusted to achieve scaffolds within a comparable range considering strut width, pore size and porosity. Therefore, the processing temperature was adjusted, whereas plotting speed and pressure as two further defining processing parameters, which influence the size dimensions of a plotted strut, were kept constant [15,16,21]. The temperature was constantly decreased from 120 °C for pure PCL, 110 °C to 100 °C for PCL-PEG 8020 and 90 °C to 80 °C for PCL-PEG 7030. The temperatures for the PCL-PEG blend are in the range of the PCL-PEG copolymer processing done by Hoque et al. [15]. The temperature was decreased instead of increasing the speed or decreasing the pressure for adjusting the strut width. This was because for the later approach of sequential processing together with the hydrogel/cell solution, a low temperature is beneficial to ensure cell viability [36]. Images of a fabricated scaffold with a 14 lines per layer design are shown in Figure 6a,b.
In Table 1, scaffold geometry data for the different scaffolds produced are listed.
With the chosen processing parameters, scaffolds of all material compositions had an average strut width (nozzle diameter 250 µm) in the range of 307 µm–425 µm. The pore size depending on the strut width was between 318 µm and 434 µm for the 14 struts per layer design. The porosity of these scaffolds is between 33% and 52%. In addition, the 10 struts per layer design was evaluated to increase the porosity and so the volume, which can be filled with the cell/hydrogel solution for the later sequential bioplotting process. For this design the pore size increased for all material compositions, which is consistent with the constant strut width. Pore sizes were between 712 µm and 801 µm. The porosity increased from 41% to 64% for pure PCL, from 33% to 46% for PCL-PEG 8020 and from 52% to 65% for PCL-PEG 7030. The strut width, pore sizes and porosity are in typical range for PCL and modified PCL scaffolds fabricated by bioplotting reported in literature [15,17].

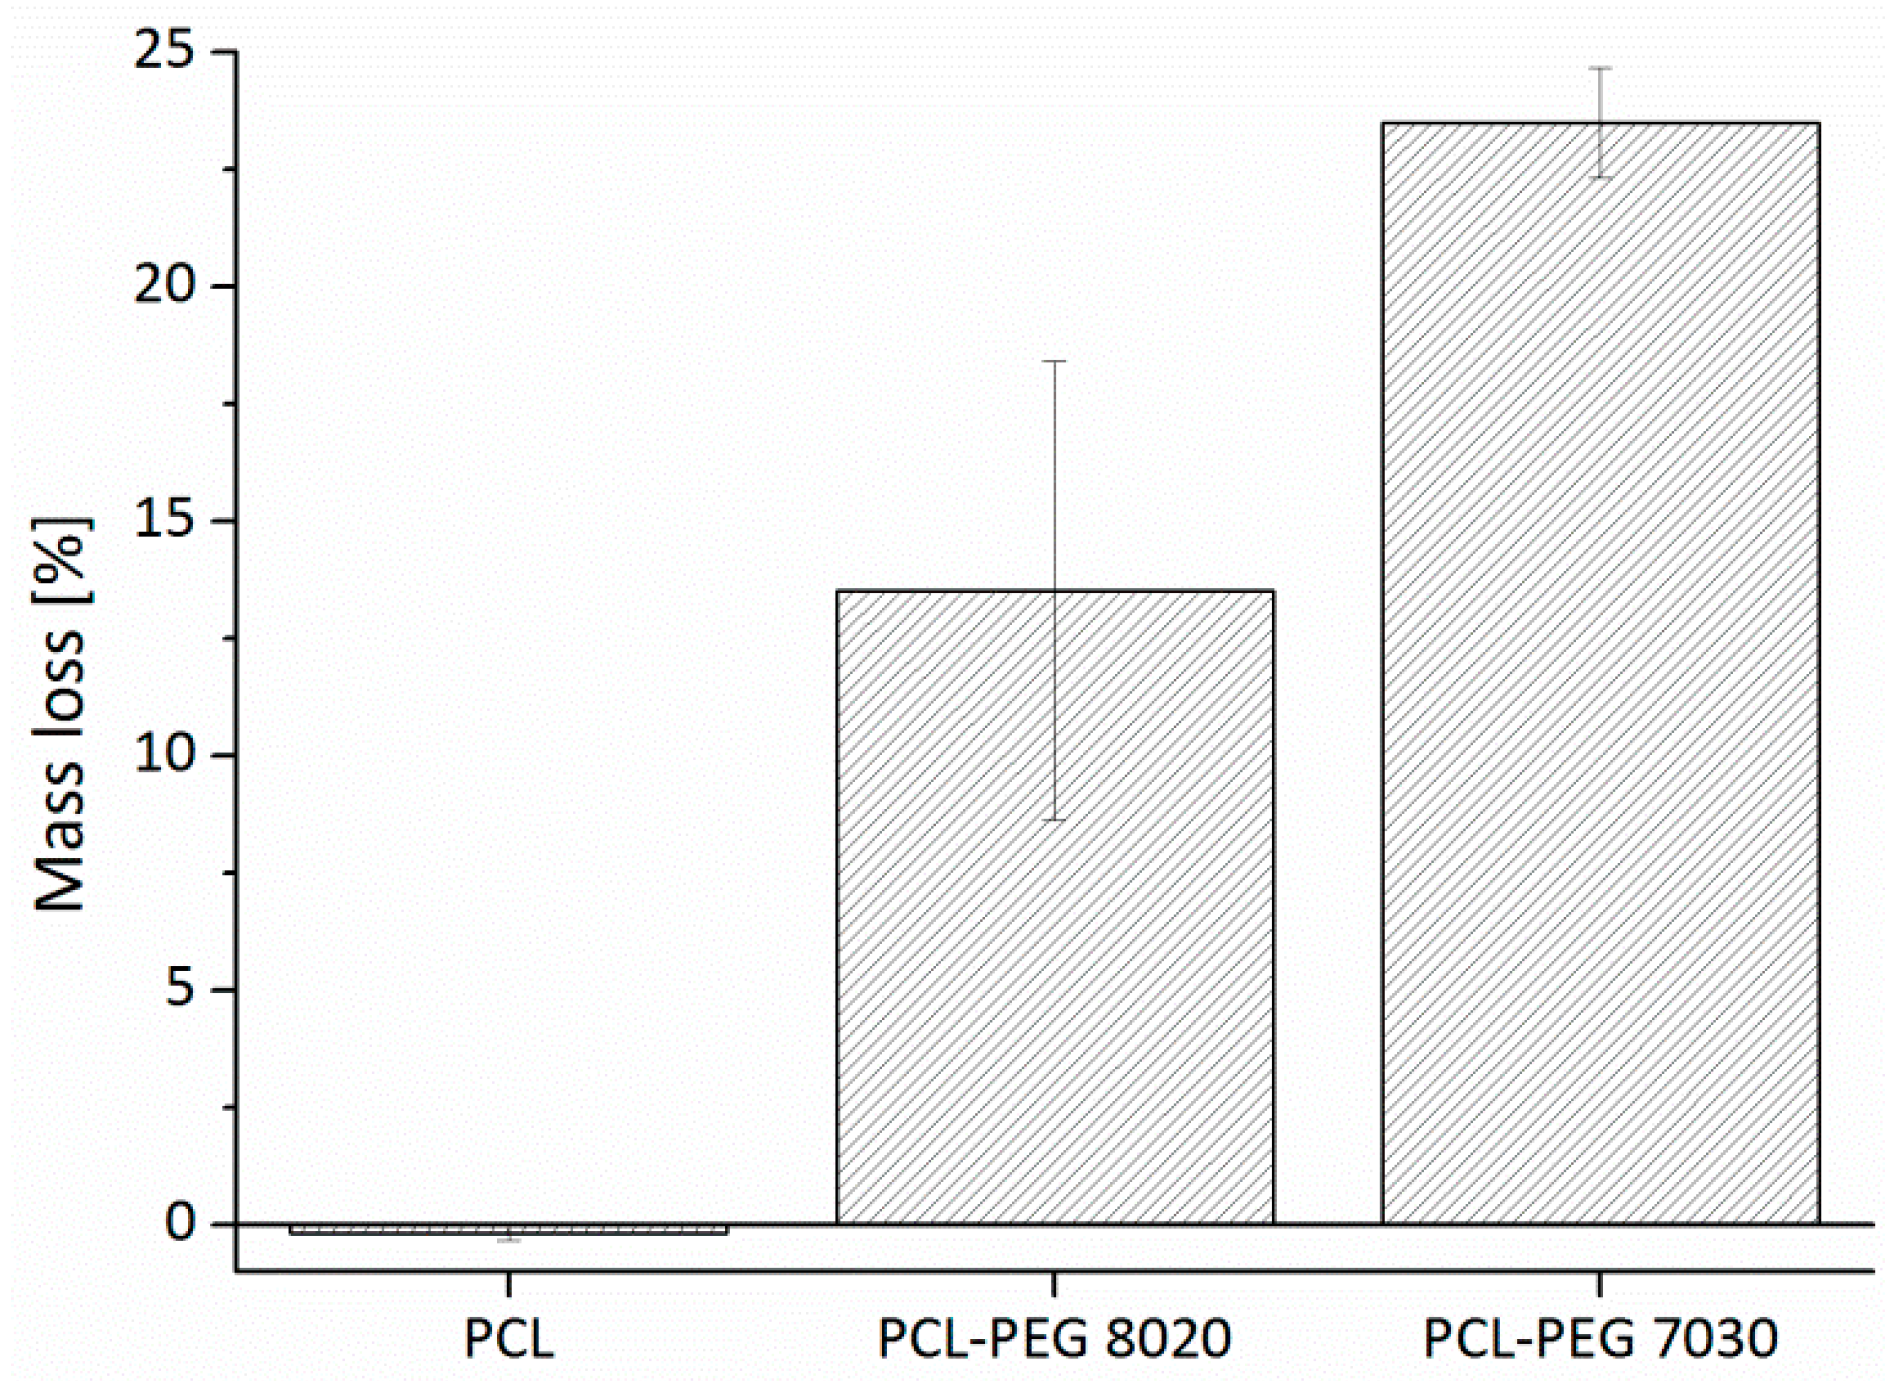
3.2.2. Degradation Study: Mass Loss

The degradation of the scaffolds was investigated by measuring the mass loss during three days of incubation at 37 °C in a physiological buffer solution. Previous experiments have shown that the mass loss remains constant after an initial drop. The results of the mass loss study are shown in Figure 7.
The pure PCL, as expected, showed no mass loss during three days of incubation as PCL is known to have a total degradation time up to two years depending on its initial molecular weight [34]. The PCL-PEG blends showed a fast degradation and a mass loss tending to be almost equal with the corresponding content of PEG being ~14% for the PCL-PEG 8020 and ~23% for the PCL-PEG 7030 compositions.
Thus, it is obvious that most of the hydrophilic PEG is released within the first three days causing the rapid mass loss. The results are consistent with a study of Cheng et al. [33] using PCL-PEG blends to establish a drug delivery system. Degradation studies on PCL-PEG and PCL-PEG-PCL copolymers showed first mass loss after nine weeks and up to 3.3% and 7.5% weight loss at Week 60, whereas pure PCL showed no weight loss at all [37]. The blending enables a fast early degradation. Lam et al. [38] showed that a PCL blending with TCP increases the degradation of the composite. TCP particles act as “defects” in the polymer matrix causing enhanced water absorption and so increasing the surface area of the degradation attack. The increased surface area by the PEG release could possibly have the same effect and increase the long-term degradation of PCL. The accelerated degradation of the PCL-PEG support structure will reduce the volume occupied by it in early stages and so it will give space for tissue formation [9].

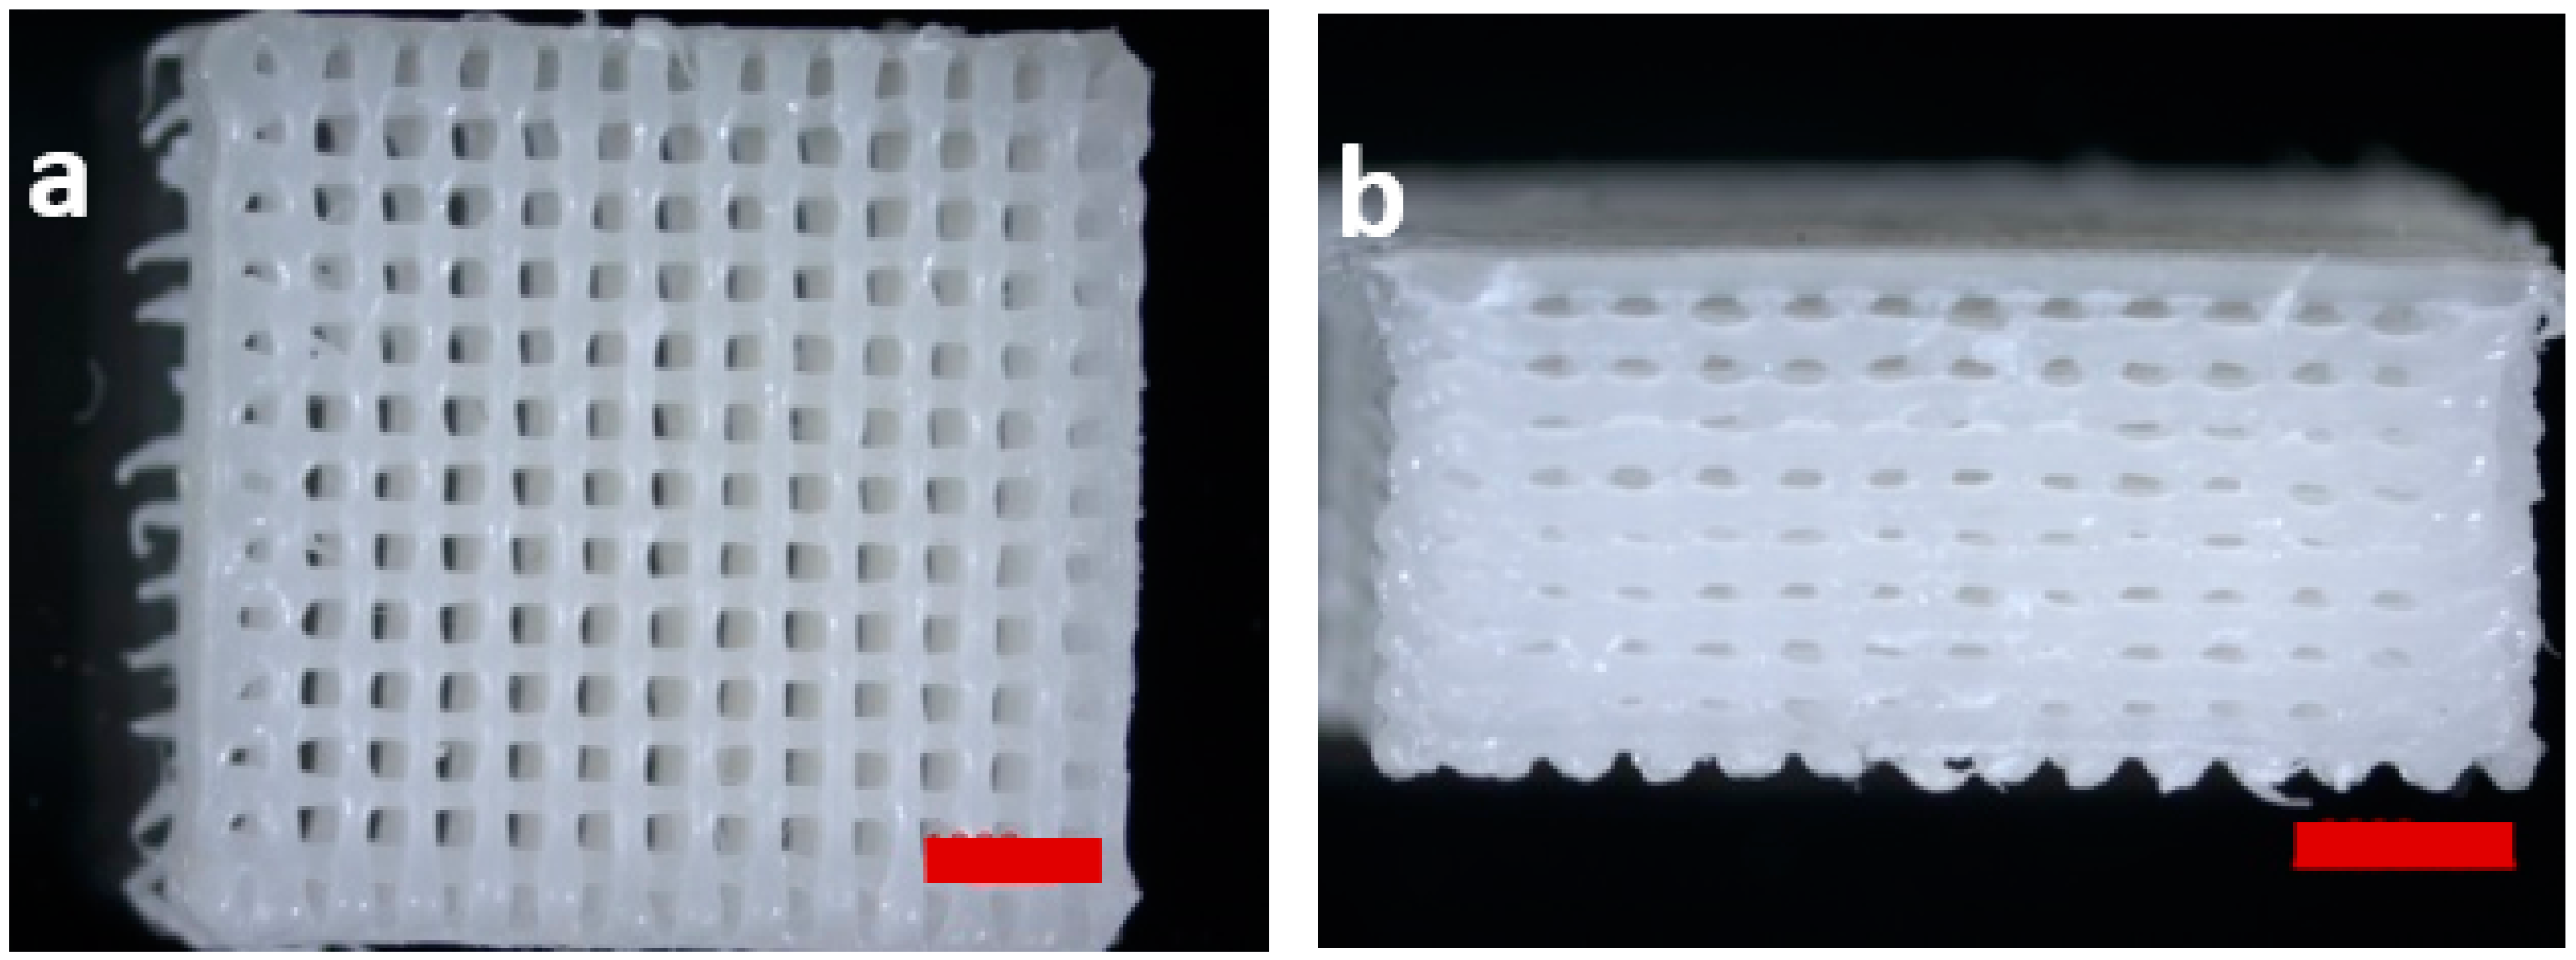
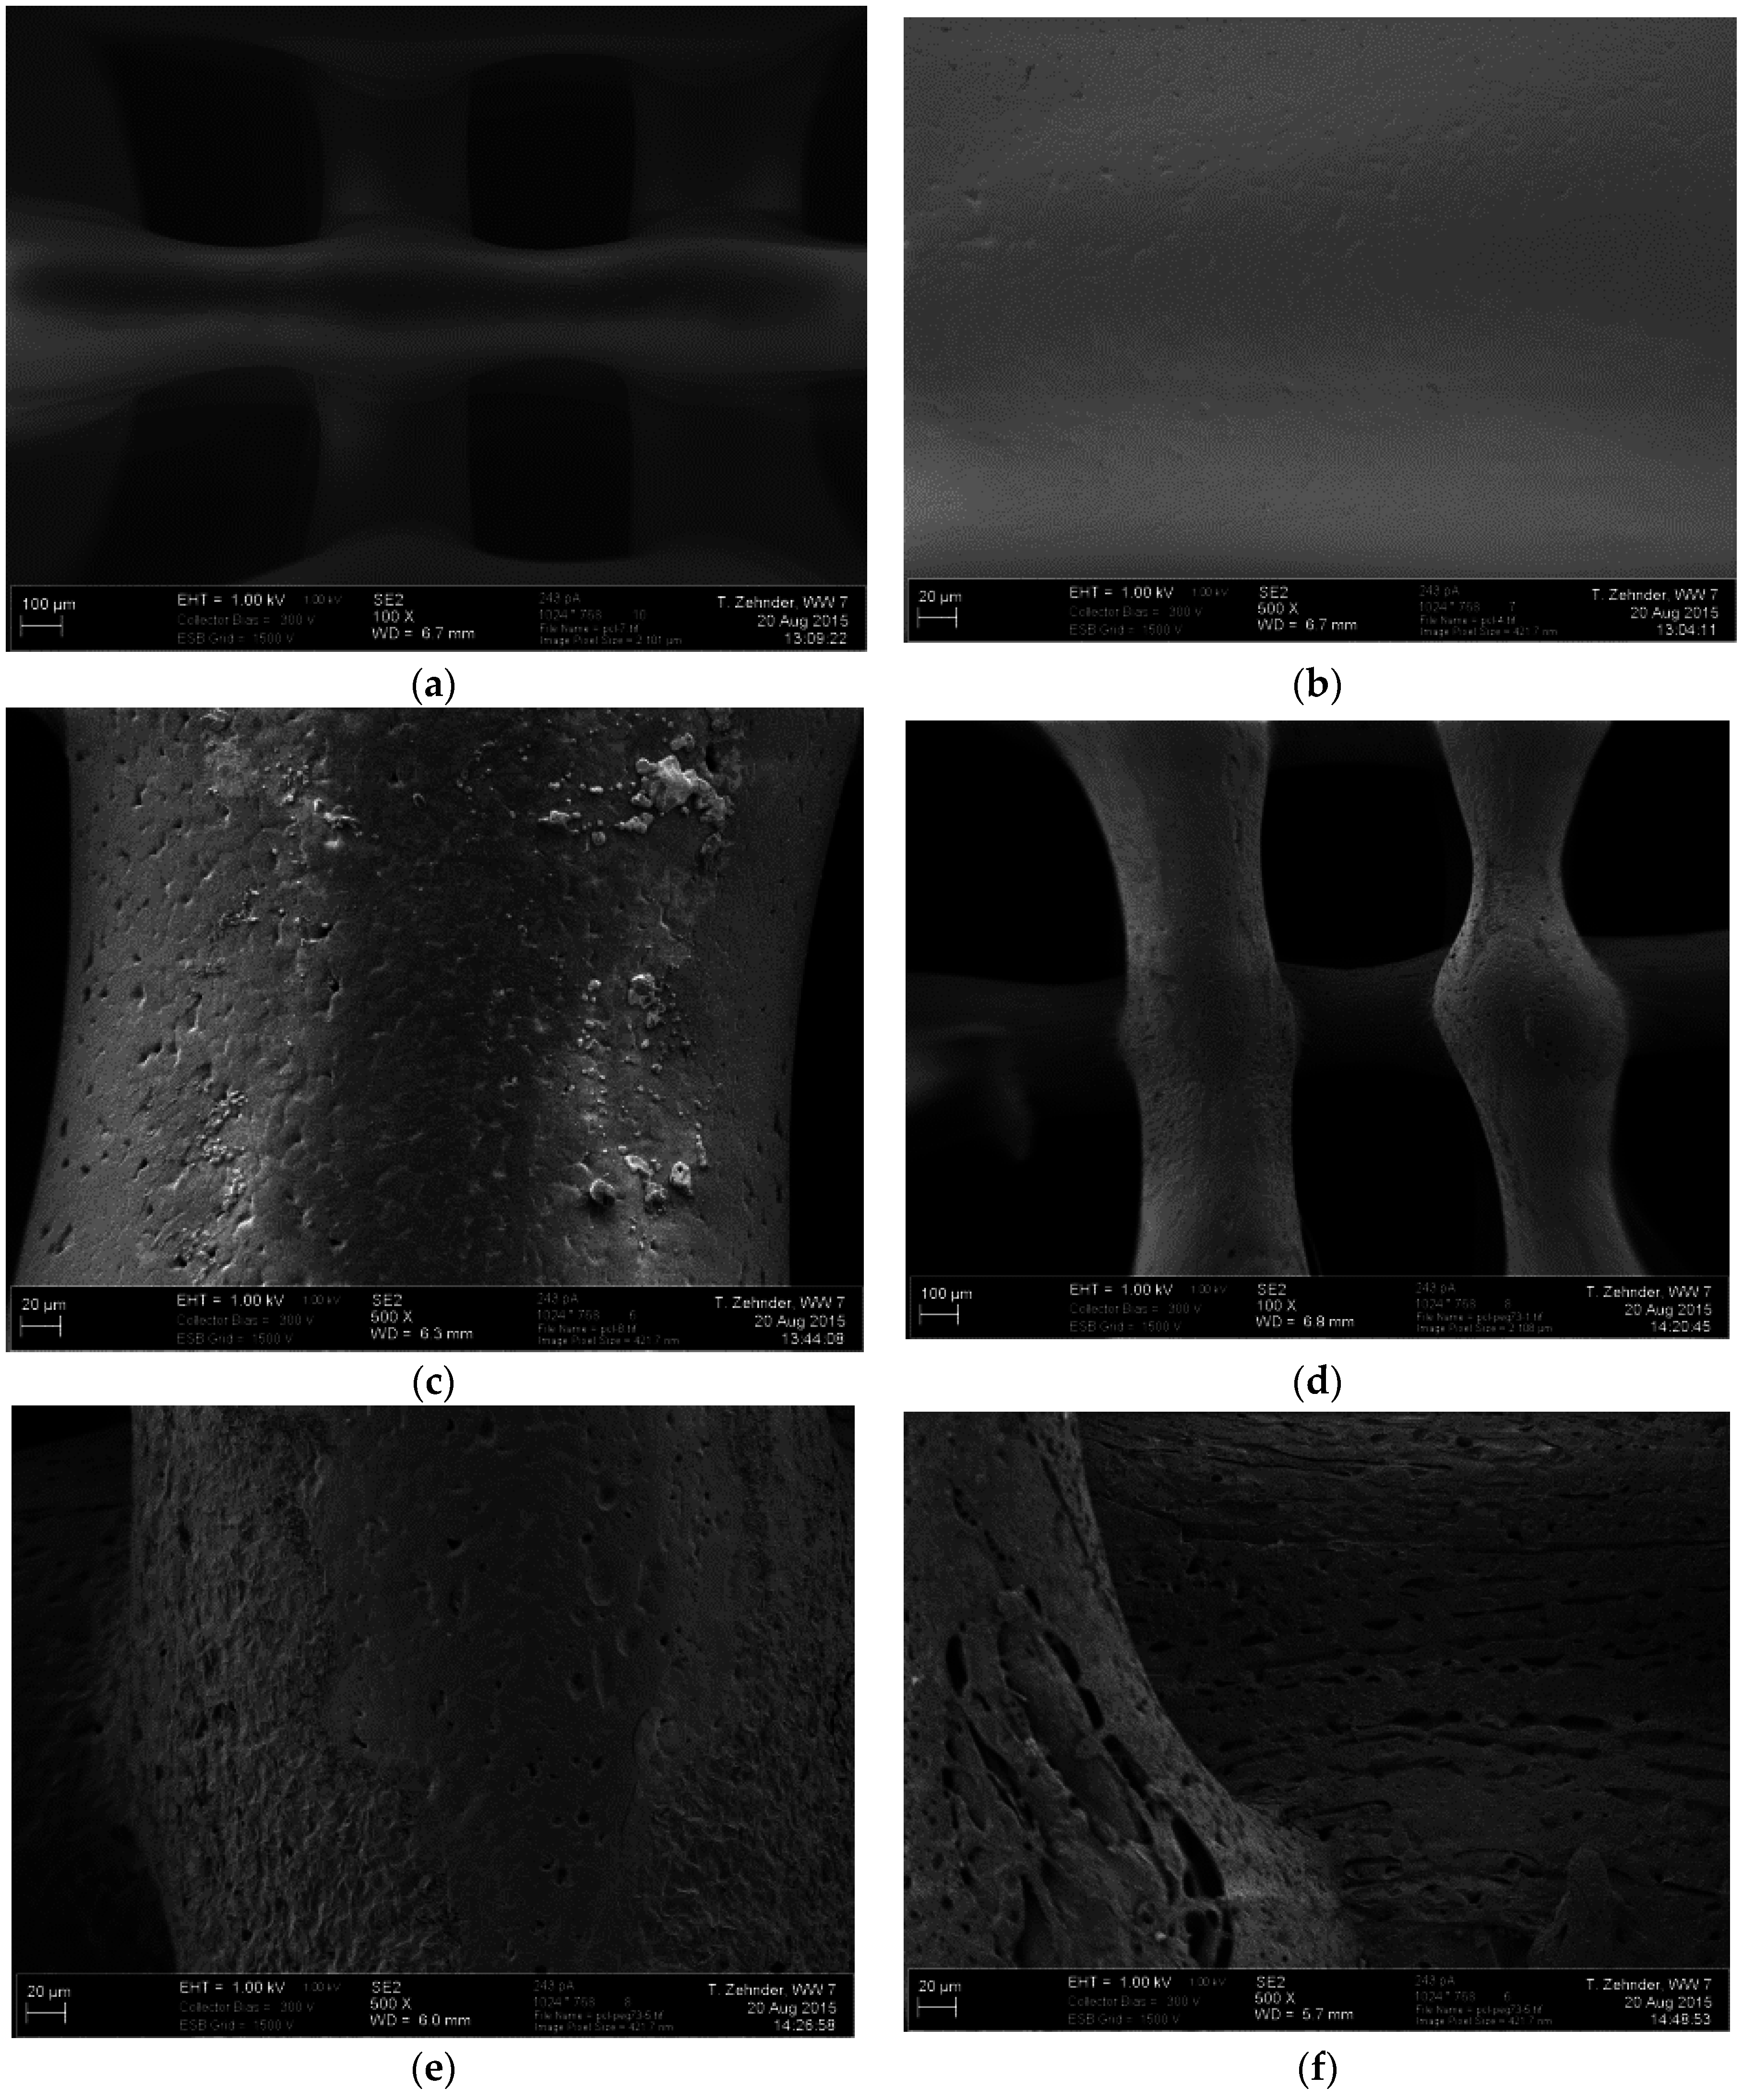
3.2.3. Scanning Electron Microscopy

For illustrating the influence of the rapid mass loss on the external and internal morphology of the scaffold struts, SEM images are presented in Figure 8 and Figure 9. In Figure 8a,d overview images of the scaffold structures and, in Figure 8b,e detailed spot images of PCL pure and PCL-PEG 7030 scaffolds after fabrication are shown. The surface of PCL appeared smooth, whereas the blend showed a rougher surface. The images in Figure 8c,f indicate the differences after the three days incubation period at 37 °C. The pure PCL surface is still smooth, but the blend surface shows pores and an even rougher structure. This enhances the results of the mass loss study and the fast release of the PEG content. The increased surface roughness could possibly influence the increase in the cell viability shown in Figure 5. The development of an interconnected pore structure after the PEG release from PCL-PEG blends is also reported by Cheng et al. [33]. The morphology of the pore structure in this study was dependent on the PEG content, causing discrete pores with lower PEG content and an interconnected pore structure with an increased PEG content of up to 10%–30%. Further images showing cross-sections of the struts are presented in Figure 9. The cross-sections of PCL and PCL-PEG 7030 scaffolds are shown after fabrication and after three days incubation in HBSS at 37 °C. There is no apparent difference in the internal structure of the PCL scaffolds before (Figure 8b) and after (Figure 8c) the incubation. The cross-section shows a homogeneous and dense morphology. However, the cross-section of the blend appears inhomogeneous, showing two phases before the incubation (Figure 8e). The morphology shows distributed round drops, possibly PEG, surrounded by a main phase, which is the PCL matrix. After the incubation, which goes along with the mass loss, the round drops are almost not visible and a porous internal structure remains (Figure 8f).

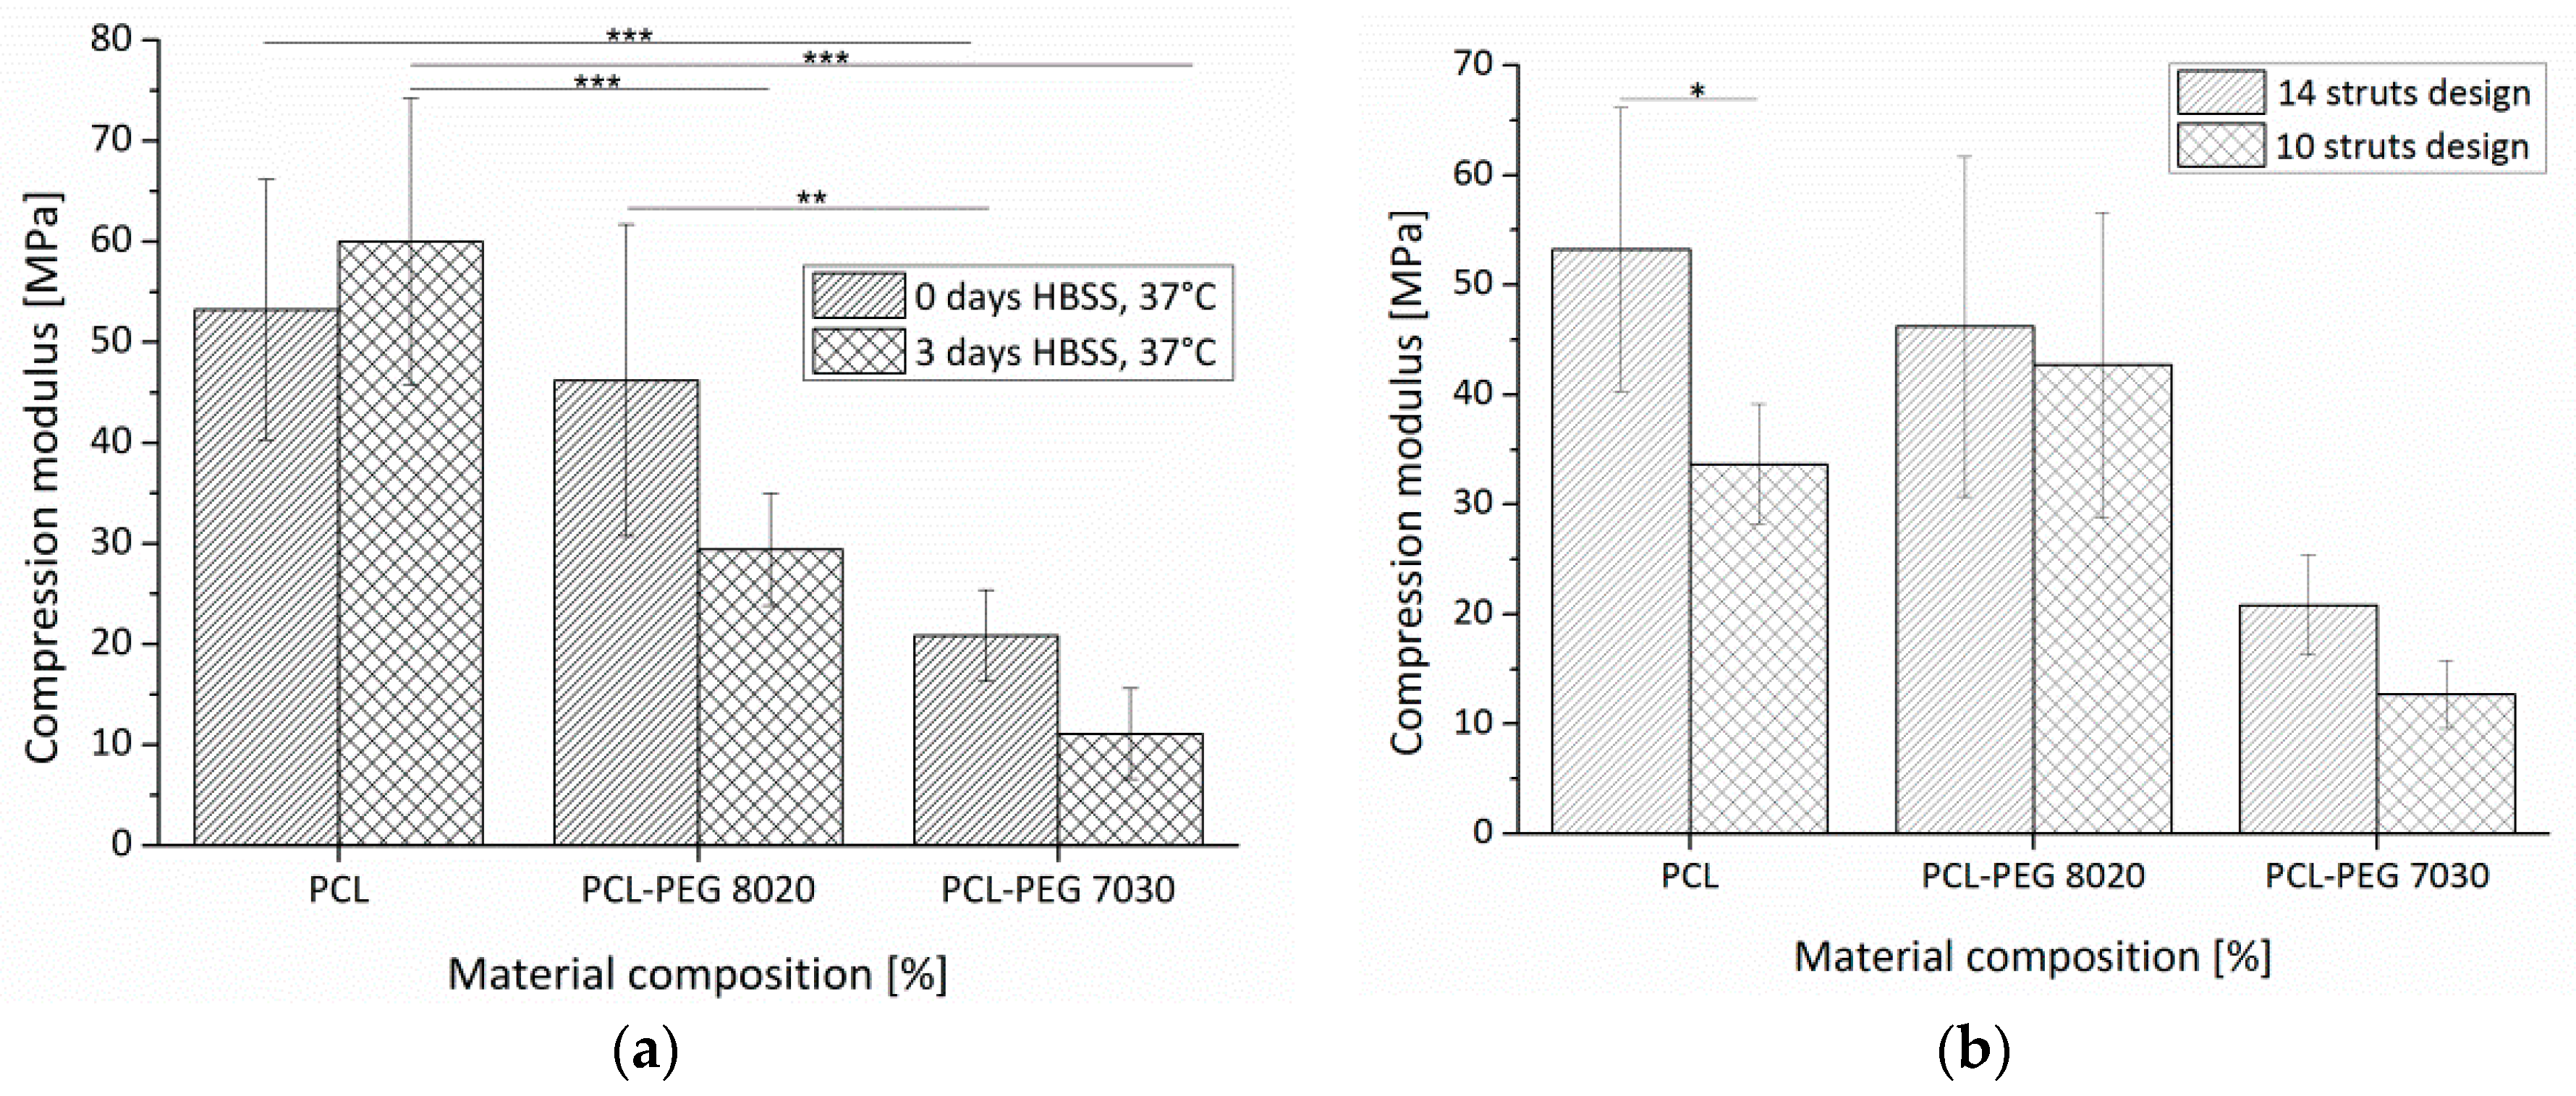
3.2.4. Mechanical Testing

The influences of the rapid mass loss and the differences in the material composition on the mechanical properties of the scaffolds are shown in Figure 10a.
The trend of a decreasing average stiffness for incubated scaffolds in comparison to as fabricated ones for both blend compositions was not significant. The PCL structure showed no decline in stiffness with values of 53 ± 13 MPa before and 60 ± 14 MPa after the incubation period. The range of values of the stiffness of PCL scaffolds are fitting with a study of Domingos et al. [39] reporting a compressive modulus of 52.5 ± 4.5 MPa for scaffolds with a comparable lay down pattern (0°/90°) and a strut distance of 550 µm. Hutmacher et al. [12] measured a compressive modulus of 41.9 ± 3.5 MPa for PCL scaffolds. This slightly decreased value could be caused by a varied lay down pattern of 0°/60°/120°, as also reported by Domingos et al. [39] decreased the stiffness in comparison to a 0°/90° pattern, which was used in our study. No differences in the mechanical properties of pre-conditioned PCL scaffolds have been also reported by Domingos et al. [39]. This issue is discussed controversially in the literature as Hutmacher et al. [12] showed an influence of the pre-treatment of the scaffolds on their mechanical properties. PCL scaffolds were not stiffer than PCL-PEG 8020 scaffold before incubation, but afterwards as the stiffness of the blend dropped from 46 ± 15 MPa to 29 ± 6 MPa, the difference was significant. Moreover, PCL scaffolds were significantly stiffer than PCL-PEG 7030 scaffolds before (21 ± 5 MPa) as well as after (11 ± 5 MPa) the incubation. There was also a significant difference between PCL-PEG 8020 and PCL-PEG 7030 scaffolds before incubation. In Figure 10b, the stiffness of scaffolds with 14 struts or 10 struts per layer is shown. In general, the scaffolds with a higher number of struts show a higher stiffness, but this difference is only significant for the PCL scaffolds. This result can be explained by the fact that the change in the porosity caused by the switch from the 14 strut to the 10 strut design is the highest for PCL. Thus, a critical increase of the porosity leads to a decrease of the scaffolds stiffness [39]. Scaffolds with a higher number of struts have a higher number of junctions between adjacent struts, which define the resistance against the compression force in the beginning of the test [15,39]. An increasing amount of PEG reduces the stiffness of the scaffolds. A possible reason could be a change in the crystallization behaviour of the PCL phase as the crystallisation and phase separation in PCL-PEG blends is a competitive process [40]. Schuurman et al. [18] investigated the mechanical properties of PCL and PCL/alginate scaffolds fabricated via a sequential plotting process showing that the PCL phase dominates the mechanical stability of such scaffolds and that there is no significant difference. Only compared to pure alginate bulk material the mechanical stability is increased for both types of scaffolds.

3.3. Hard-Soft Phase Scaffolds: In-Vitro Characterisation

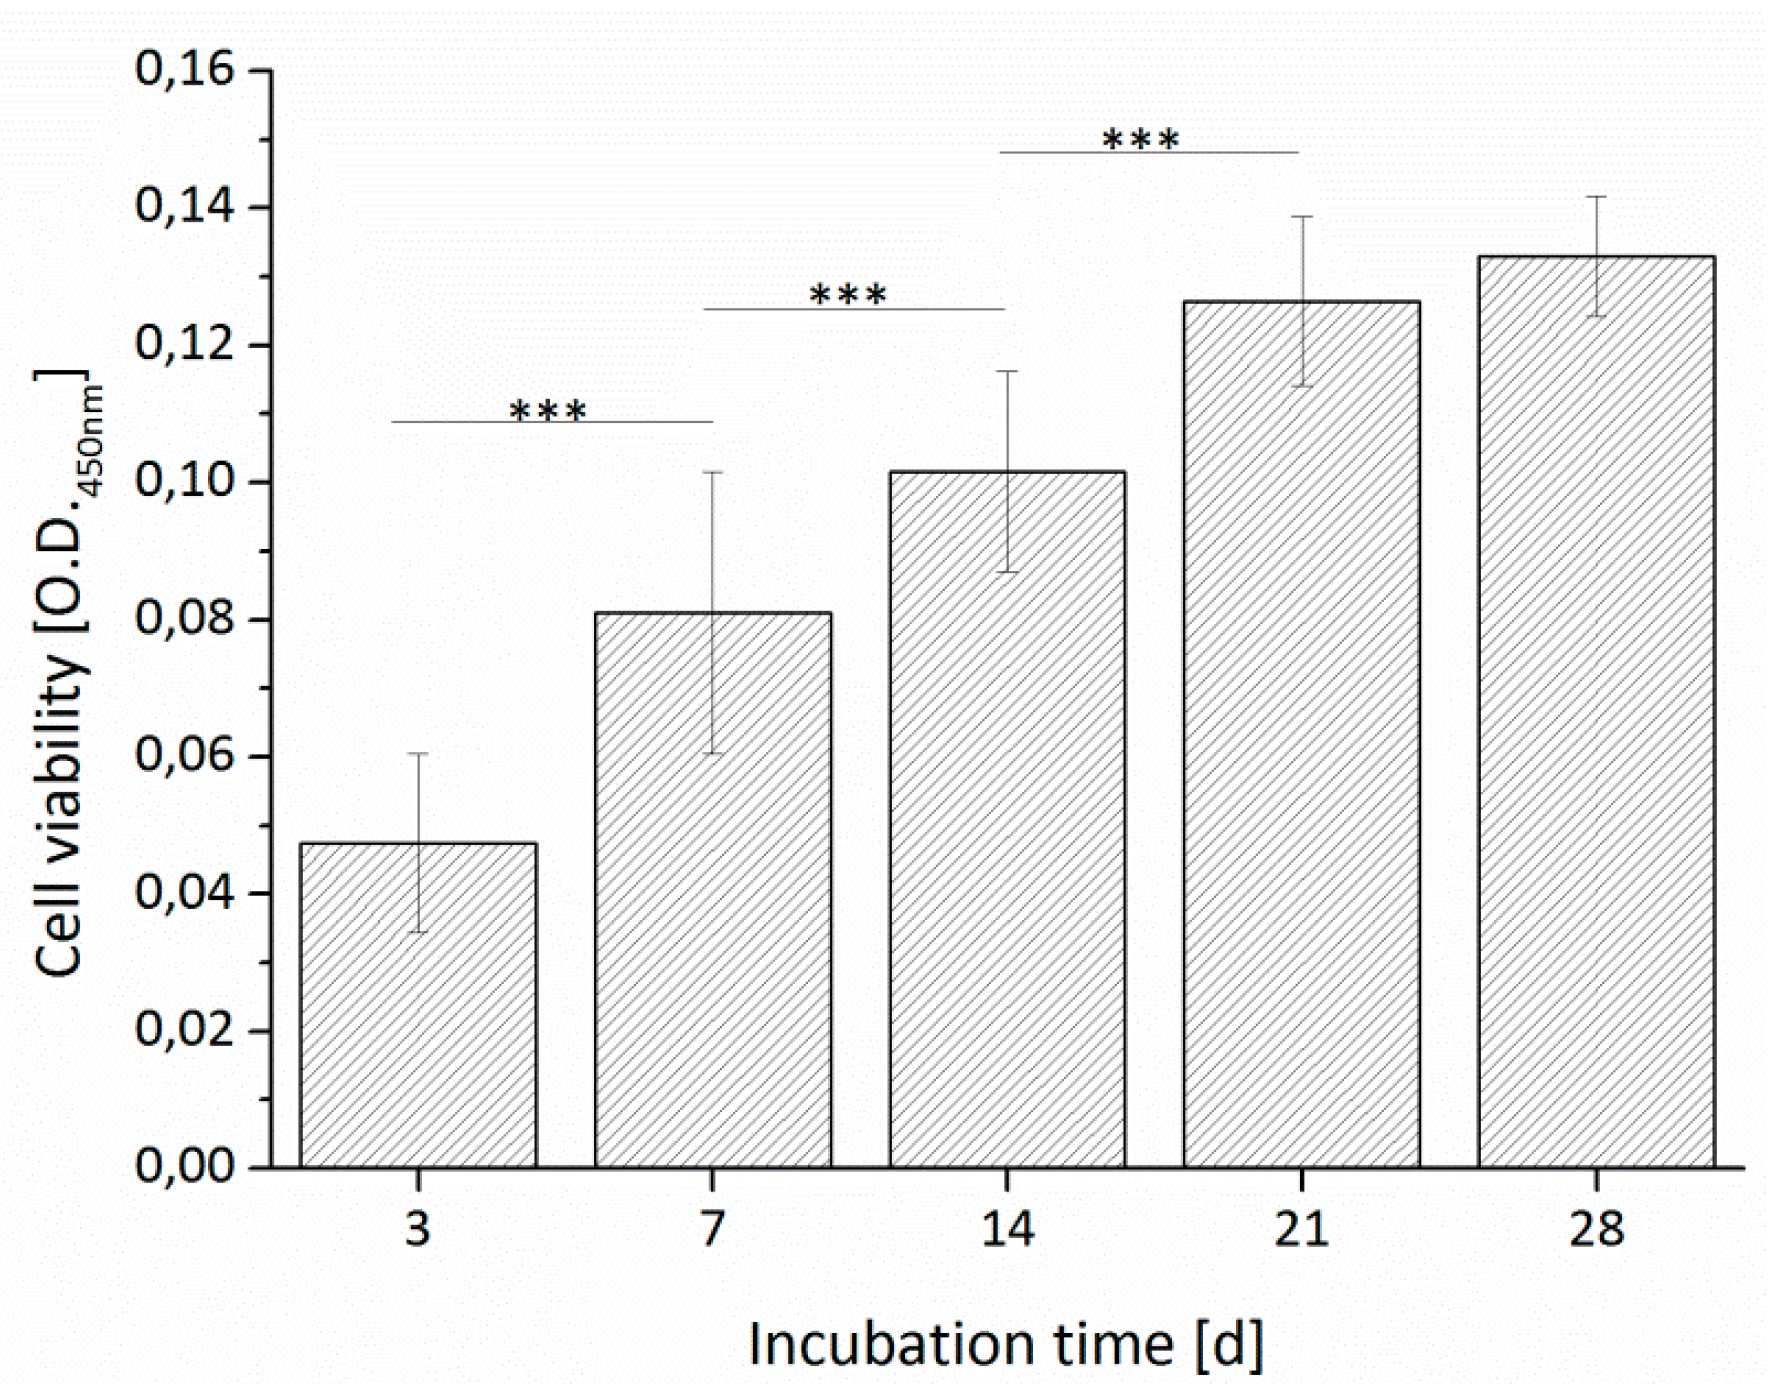
3.3.1. Cell Viability

In Figure 11, the cell viability of the PCL-PEG ADA-GEL scaffolds over an incubation time of 28 days is shown. The cell viability increased constantly from Day 3 to Day 21 with significant differences and balanced after Day 21. The results indicate that the processing conditions of the sequential bioplotting process are biocompatible [18,36]. The elevated temperatures for processing the PCL-PEG blend were not too critical as the cooling time for plotted PCL is quite short [36] (additional information in Figures S2 and S3). The cells are able to proliferate and the assay signal increased over time.
Hybrid constructs fabricated of PCL and cell-loaded alginate also showed an increase in cell number over an incubation period of 14 days [36]. This result of the cell viability kinetic is consistent with similar studies done with human osteoblast-like MG-63 cells, which were encapsulated in ADA-GEL hydrogel bioplotted structures [27] as well as in microcapsules [41]. Bioplotted ADA-GEL structures loaded with HCT116 cells also showed high cell viabilities after the plotting process [42].

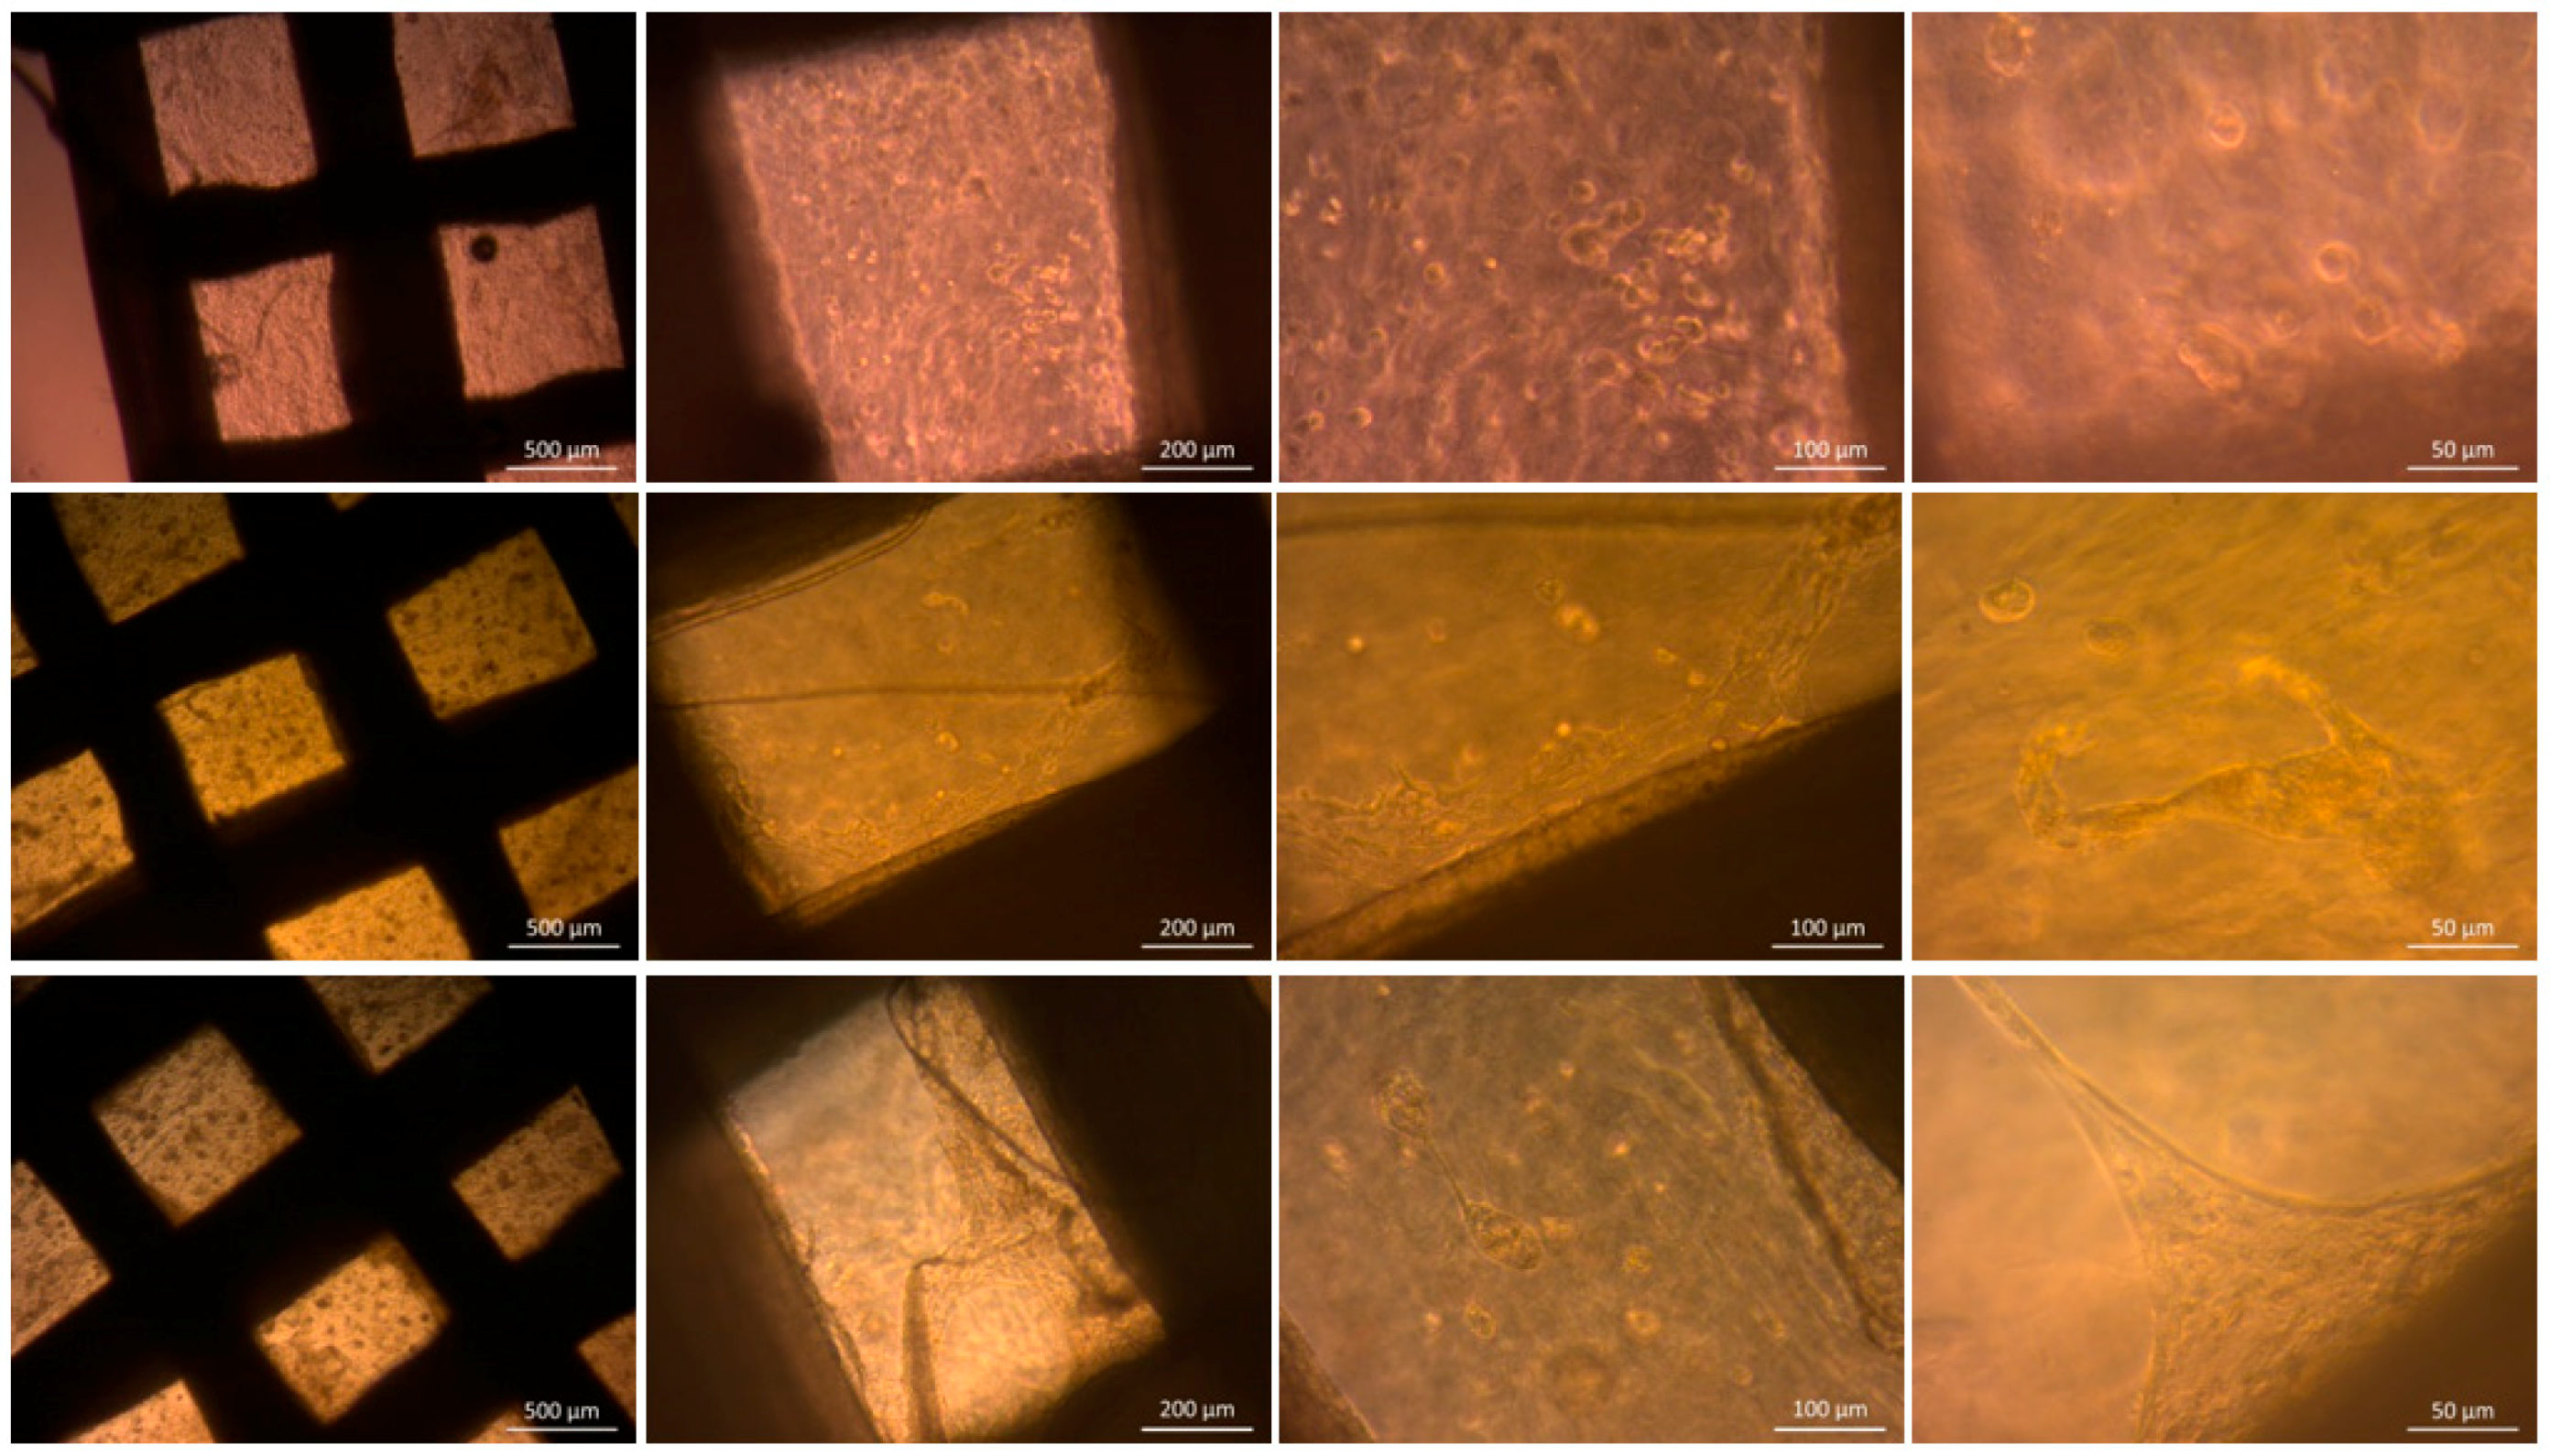
3.3.2. Optical Microscopy

The samples were observed over the whole incubation time by optical microscopy. In Figure 12, a selection of images starting right after the fabrication, at Day 14 and at Day 28 of the incubation period are presented.
Right after the fabrication single, round shaped cells are visible in the hydrogel phase. With on-going incubation time, at Day 14, the cells proliferated. Thus, cell agglomerates and cells with spreading morphology became visible. An interaction of the cells with PCL-PEG phase was observed, indicating cells migrating from the hydrogel to the support structure. This interaction and adhesion of the cells with the hard phase increased over time and can be seen after 28 days of incubation. The proliferation of the cells is possibly the reason for the increase of the cell viability in Figure 11.

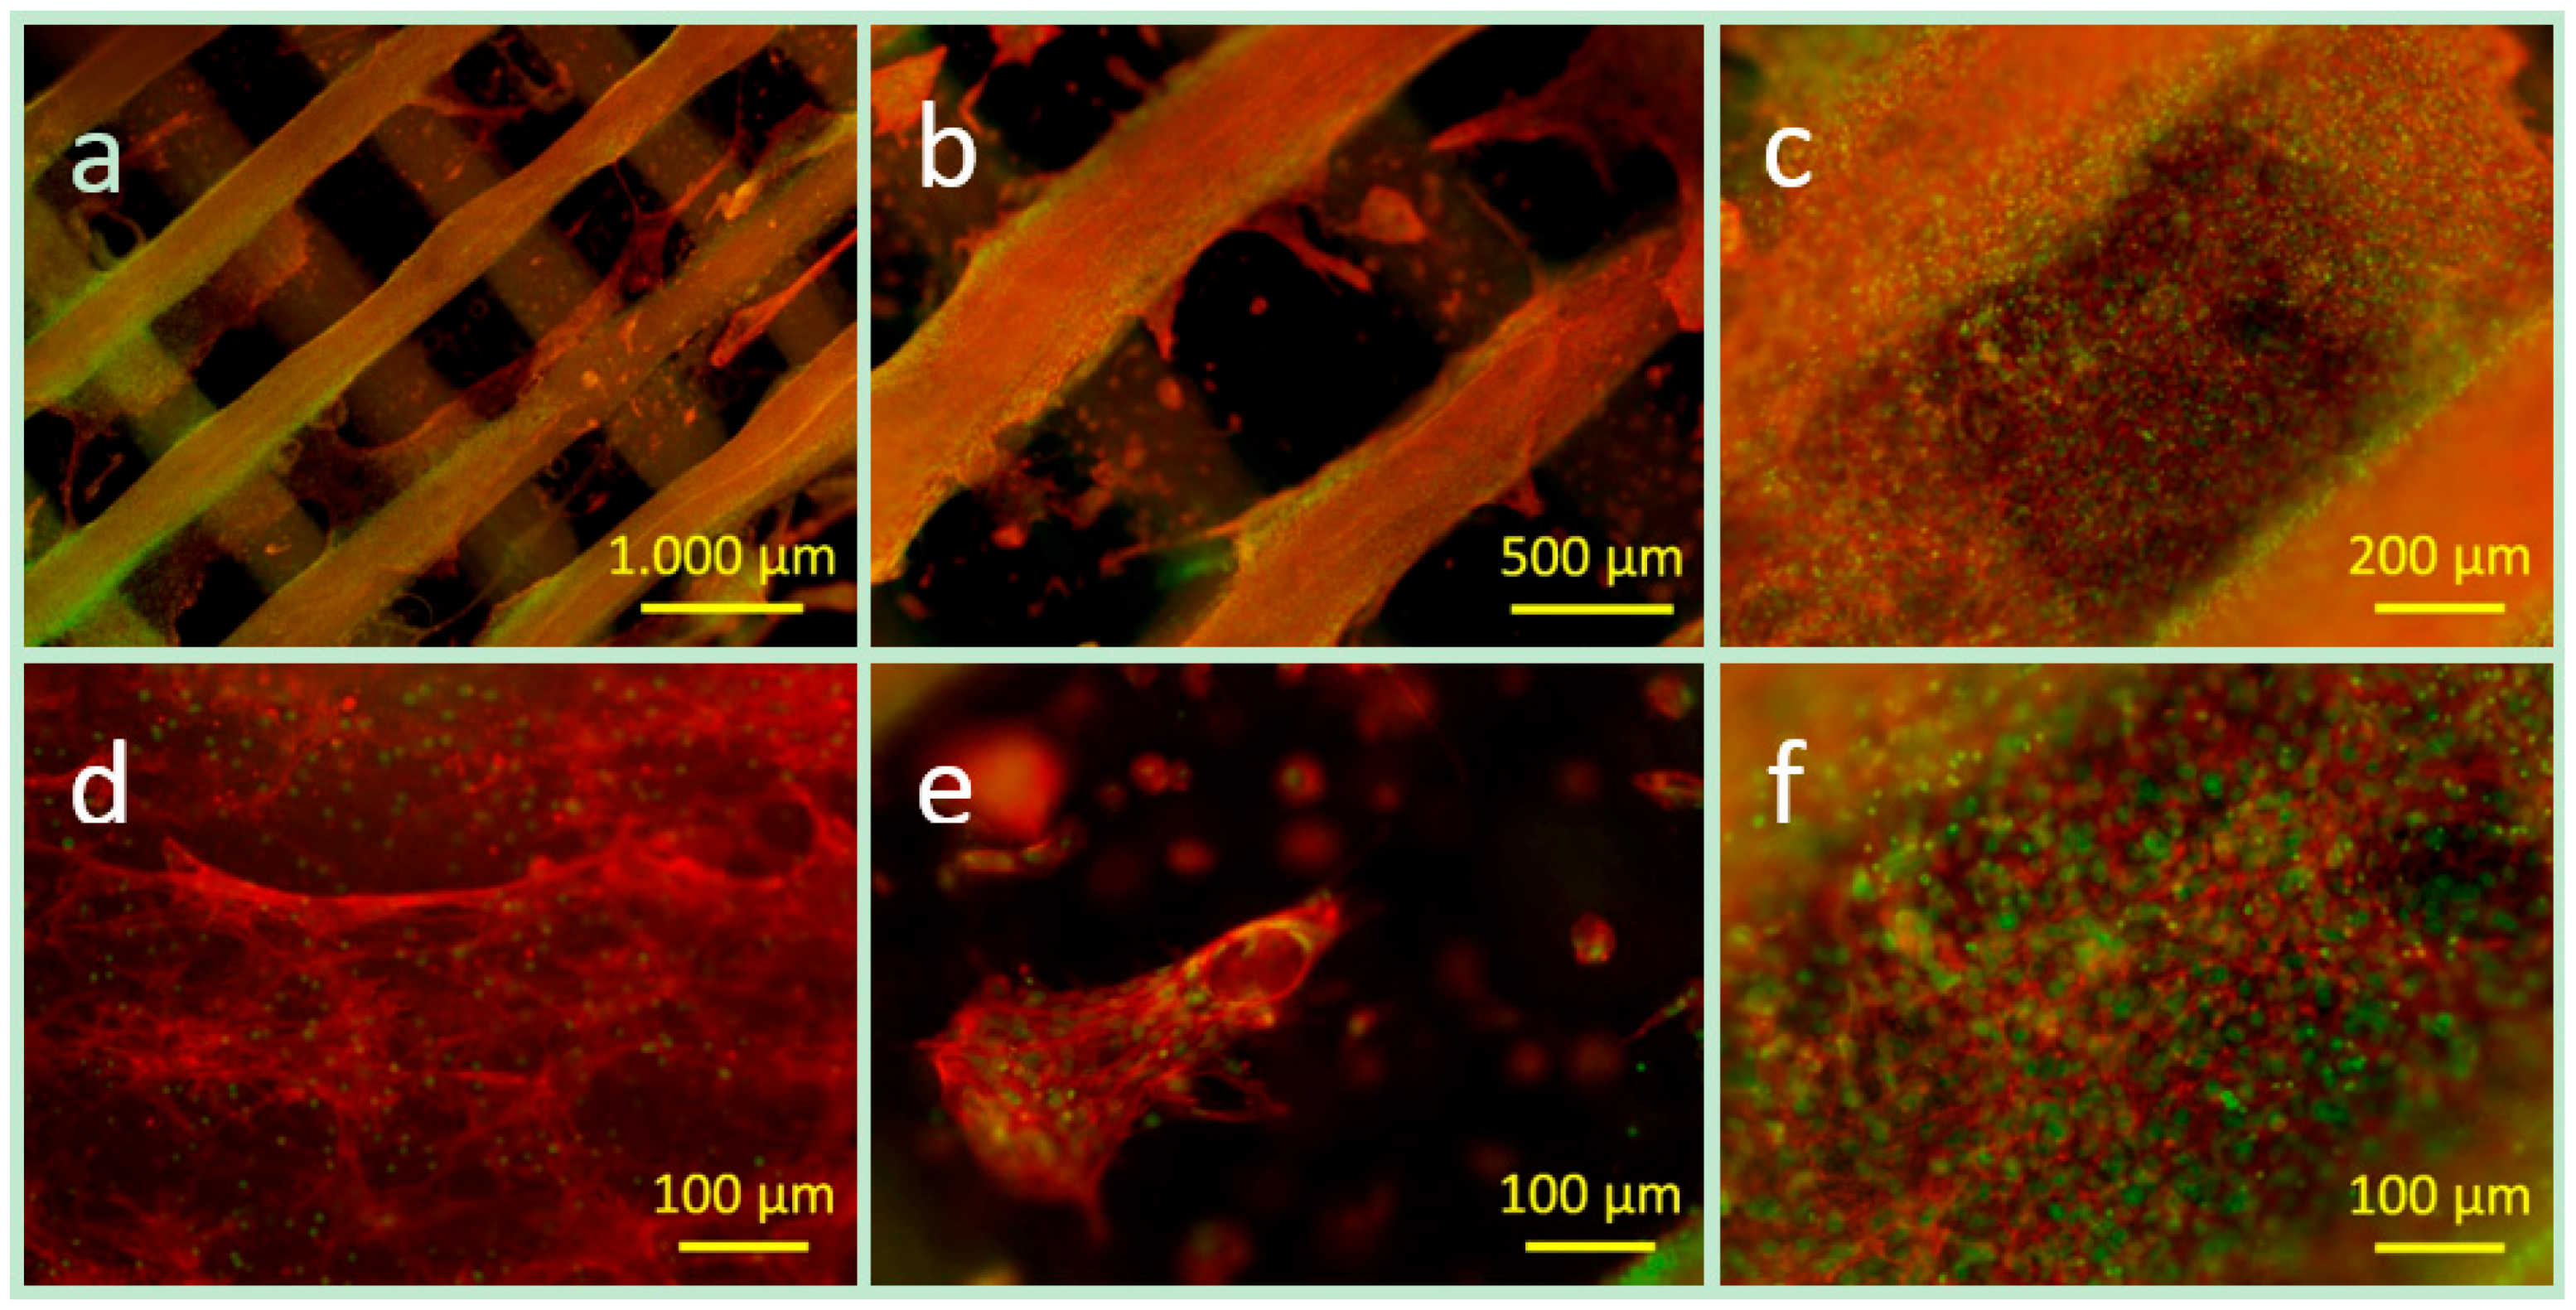
3.3.3. Cell Distribution and Cell Morphology

For imaging the cell adhesion and cell distribution after 28 days of incubation staining of the actin cytoskeleton (red) and the cell nuclei was performed as shown in Figure 13. In agreement with the results of optical microscopy, the fluorescence microscope images confirm that the cells migrated and proliferated on and along the PCL-PEG support structure and completely covered it, as shown in the overview images in Figure 13a,b. The detailed spot image in Figure 13d shows that the cells have a spreading morphology on the hard phase. Furthermore, the images emphasise that the cells proliferated and that also in the hydrogel phase area very large cell agglomerates could be seen in Figure 13a,c the whole area in between the hard phase is densely populated with cells. Figure 13e shows a cell agglomerate and also single spread cells in the hydrogel phase. These results indicate that a combination of PCL-PEG 7030 blend and ADA-GEL hydrogel enables movement of the cells from the hydrogel phase to the support structure. Thus, the hard phase is not only essential for the mechanical support, but also for the cellular response. This result is in contradiction to studies using PCL and cell-loaded pure alginate as in this case no influence or interaction of the immobilised cells with the PCL structure was reported [36]. The results could be explained by favourable properties of the ADA-GEL in comparison to pure alginate considering a faster degradation, influencing cell mobility, and cell-material interaction [23,41].

4. Conclusions

It was shown that PCL-PEG blends are appropriate for sequential bioplotting applications and scaffolds were produced at relatively reduced temperatures in comparison with pure PCL. The wetting behaviour and the cell behaviour were improved in comparison to pure PCL. A disadvantage of PCL is its long-term stability of several years, which eventually hinders the ingrowth of tissue [43]. The short-time degradation behaviour was increased by PEG blending in comparison to pure PCL. It remains an interesting task for the future to evaluate the long-time degradation of the scaffolds (several months). The mechanical properties were adjusted by varying the PEG content. The use of ADA-GEL instead of pure alginate enables cells to migrate causing an effective interaction of cells also with the PCL-PEG support structure. Possibly, this behaviour is beneficial for the establishment of the interface between new developed tissue and the support structure, which will only degrade over a longer time period providing sustained (time-dependent) mechanical support for the newly formed tissue.

Supplementary Materials

The following are available online at www.mdpi.com/1996-1944/9/11/887/s1. Fabrication of Cell-Loaded Two-Phase 3D Constructs for Tissue Engineering.

Acknowledgments

This work was supported by the TOPBiomat project of the “Emerging Fields Initiative (efi)” funded by the University of Erlangen-Nuremberg. The authors thank Dirk Dippold for the FTIR measurements and help with the mechanical testing and Matthias Herrmann for pre-evaluation of the plotting process. We thank D. W. Schubert for granting access to experimental facilities in the Institute of Polymer Materials (FAU).

Author Contributions

The experiments and the data analysis were done by Tobias Zehnder, Tim Freund and Merve Demir. The work was supervised by Aldo R. Boccaccini and Rainer Detsch. The manuscript was written by Tobias Zehnder, Aldo R. Boccaccini and Rainer Detsch.

Conflicts of Interest

The authors declare no conflicts of interest.

References

  1. Tang, D.; Tare, R.S.; Yang, L.Y.; Williams, D.F.; Ou, K.L.; Oreffo, R.O.C. Biofabrication of bone tissue: Approaches, challenges and translation for bone regeneration. Biomaterials 2016, 83, 363–382. [Google Scholar] [CrossRef] [PubMed]
  2. Ringeisen, B.R.; Pirlo, R.K.; Wu, P.K.; Boland, T.; Huang, Y.; Sun, W.; Hamid, Q.; Chrisey, D.B. Cell and organ printing turns 15: Diverse research to commercial transitions. MRS Bull. 2013, 38, 834–843. [Google Scholar] [CrossRef]
  3. Malda, J.; Visser, J.; Melchels, F.P.; Jüngst, T.; Hennink, W.E.; Dhert, W.J.A.; Groll, J.; Hutmacher, D.W. 25th Anniversary Article: Engineering Hydrogels for Biofabrication. Adv. Mater. 2013, 25, 5011–5028. [Google Scholar] [CrossRef] [PubMed]
  4. Melchels, F.P.W.; Domingos, M.A.N.; Klein, T.J.; Malda, J.; Bartolo, P.J.; Hutmacher, D.W. Additive manufacturing of tissues and organs. Prog. Polym. Sci. 2012, 37, 1079–1104. [Google Scholar] [CrossRef] [Green Version]
  5. Billiet, T.; Vandenhaute, M.; Schelfhout, J.; van Vlierberghe, S.; Dubruel, P. A review of trends and limitations in hydrogel-rapid prototyping for tissue engineering. Biomaterials 2012, 33, 6020–6041. [Google Scholar] [CrossRef] [PubMed]
  6. Wüst, S.; Müller, R.; Hofmann, S. Controlled Positioning of Cells in Biomaterials—Approaches Towards 3D Tissue Printing. J. Funct. Biomater. 2011, 2, 119–154. [Google Scholar] [CrossRef] [PubMed]
  7. Jüngst, T.; Smolan, W.; Schacht, K.; Scheibel, T.; Groll, J. Strategies and Molecular Design Criteria for 3D Printable Hydrogels. Chem. Rev. 2016, 116, 1496–1539. [Google Scholar] [CrossRef] [PubMed]
  8. Fedorovich, N.E.; Alblas, J.; Hennink, W.E.; Oner, F.C.; Dhert, W.J.A. Organ printing: The future of bone regeneration? Trends Biotechnol. 2011, 29, 601–606. [Google Scholar] [CrossRef] [PubMed]
  9. Visser, J.; Melchels, F.P.W.; Jeon, J.E.; van Bussel, E.M.; Kimpton, L.S.; Byrne, H.M.; Dhert, W.J.; Dalton, P.D.; Hutmacher, D.W.; Malda, J. Reinforcement of hydrogels using three-dimensionally printed microfibres. Nat. Commun. 2015, 6, 6933. [Google Scholar] [CrossRef] [PubMed]
  10. Utech, S.; Boccaccini, A.R. A review of hydrogel-based composites for biomedical applications: Enhancement of hydrogel properties by addition of rigid inorganic fillers. J. Mater. Sci. 2016, 51, 271–310. [Google Scholar] [CrossRef]
  11. Duan, B.; Hockaday, L.A.; Kang, K.H.; Butcher, J.T. 3D bioprinting of heterogeneous aortic valve conduits with alginate/gelatin hydrogels. J. Biomed. Mater. Res. A 2013, 101, 1255–1264. [Google Scholar] [CrossRef] [PubMed]
  12. Hutmacher, D.W.; Schantz, T.; Zein, I.; Ng, K.W.; Teoh, S.H.; Tan, K.C. Mechanical properties and cell cultural response of polycaprolactone scaffolds designed and fabricated via fused deposition modeling. J. Biomed. Mater. Res. 2001, 55, 203–216. [Google Scholar] [CrossRef]
  13. Declercq, H.A.; Desmet, T.; Berneel, E.E.M.; Dubruel, P.; Cornelissen, M.J. Synergistic effect of surface modification and scaffold design of bioplotted 3-D poly-ε-caprolactone scaffolds in osteogenic tissue engineering. Acta Biomater. 2013, 9, 7699–7708. [Google Scholar] [CrossRef] [PubMed]
  14. Won, J.-E.; Mateos-Timoneda, M.A.; Castano, O.; Planell, J.A.; Seo, S.-J.; Lee, E.-J.; Han, C.M.; Kim, H.W. Fibronectin immobilization on to robotic-dispensed nanobioactive glass/polycaprolactone scaffolds for bone tissue engineering. Biotechnol. Lett. 2014. [Google Scholar] [CrossRef] [PubMed]
  15. Hoque, M.E.; San, W.Y.; Wei, F.; Li, S.; Huang, M.-H.; Vert, M.; Hutmacher, D.W. Processing of polycaprolactone and polycaprolactone-based copolymers into 3D scaffolds, and their cellular responses. Tissue Eng. Part A 2009, 15, 3013–3024. [Google Scholar] [CrossRef] [PubMed]
  16. Jiang, C.-P.; Huang, J.-R.; Hsieh, M.-F. Fabrication of synthesized PCL-PEG-PCL tissue engineering scaffolds using an air pressure-aided deposition system. Rapid Prototyp. J. 2011, 17, 288–297. [Google Scholar] [CrossRef]
  17. Patrício, T.; Domingos, M.; Gloria, A.; D’Amora, U.; Coelho, J.F.; Bártolo, P.J. Fabrication and characterisation of PCL and PCL/PLA scaffolds for tissue engineering. Rapid Prototyp. J. 2014, 20, 145–156. [Google Scholar] [CrossRef]
  18. Schuurman, W.; Khristov, V.; Pot, M.W.; van Weeren, P.R.; Dhert, W.J.A.; Malda, J. Bioprinting of hybrid tissue constructs with tailorable mechanical properties. Biofabrication 2011, 3, 021001. [Google Scholar] [CrossRef] [PubMed]
  19. Shim, J.-H.; Kim, J.Y.; Park, M.; Park, J.; Cho, D.-W. Development of a hybrid scaffold with synthetic biomaterials and hydrogel using solid freeform fabrication technology. Biofabrication 2011, 3, 034102. [Google Scholar] [CrossRef] [PubMed]
  20. Lee, H.; Ahn, S.; Bonassar, L.J.; Chun, W.; Kim, G. Cell-Laden Poly(e-caprolactone)/Alginate Hybrid Scaffolds Fabricated by an Aerosol Cross-Linking Process for Obtaining Homogeneous Cell Distribution: Fabrication, Seeding Efficiency, and Cell Proliferation and Distribution. Tissue Eng. Part C Methods 2013, 19, 784–793. [Google Scholar] [CrossRef] [PubMed]
  21. Kang, H.-W.; Lee, S.J.; Ko, I.K.; Kengla, C.; Yoo, J.J.; Atala, A. A 3D bioprinting system to produce human-scale tissue constructs with structural integrity. Nat. Biotechnol. 2016, 34, 312–319. [Google Scholar] [CrossRef] [PubMed]
  22. Shim, J.-H.; Lee, J.-S.; Kim, J.Y.; Cho, D.-W. Bioprinting of a mechanically enhanced three-dimensional dual cell-laden construct for osteochondral tissue engineering using a multi-head tissue/organ building system. J. Micromech. Microeng. 2012, 22, 85014. [Google Scholar] [CrossRef]
  23. Grigore, A.; Sarker, B.; Fabry, B.; Boccaccini, A.R.; Detsch, R. Behavior of Encapsulated MG-63 Cells in RGD and Gelatine-Modified Alginate Hydrogels. Tissue Eng. Part A 2014, 20, 2140–2150. [Google Scholar] [CrossRef] [PubMed]
  24. Sarker, B.; Papageorgiou, D.G.; Silva, R.; Zehnder, T.; Gul-E-Noor, F.; Bertmer, M.; Kaschta, J.; Chrissafis, K.; Detsch, R.; Boccaccini, A.R. Fabrication of alginate—Gelatin crosslinked hydrogel microcapsules and evaluation of the microstructure and physico-chemical properties. J. Mater. Chem. B 2014, 2, 1470–1482. [Google Scholar] [CrossRef]
  25. Balakrishnan, B.; Lesieur, S.; Labarre, D.; Jayakrishnan, A. Periodate oxidation of sodium alginate in water and in ethanol–water mixture: A comparative study. Carbohydr. Res. 2005, 340, 1425–1429. [Google Scholar] [CrossRef] [PubMed]
  26. Bouhadir, K.H.; Lee, K.Y.; Alsberg, E.; Damm, K.L.; Anderson, K.W.; Mooney, D.J. Degradation of partially oxidized alginate and its potential application for tissue engineering. Biotechnol. Prog. 2001, 17, 945–950. [Google Scholar] [CrossRef] [PubMed]
  27. Zehnder, T.; Sarker, B.; Boccaccini, A.R.; Detsch, R. Evaluation of an alginate-gelatine crosslinked hydrogel for bioplotting. Biofabrication 2015, 7, 25001. [Google Scholar] [CrossRef] [PubMed]
  28. Elzein, T.; Nasser-Eddine, M.; Delaite, C.; Bistac, S.; Dumas, P. FTIR study of polycaprolactone chain organization at interfaces. J. Colloid Interface Sci. 2004, 273, 381–387. [Google Scholar] [CrossRef] [PubMed]
  29. Repanas, A.; Wolkers, W.; Gryshkov, O.; Müller, M.; Glasmacher, B. Pcl/Peg Electrospun Fibers as Drug Carriers for the Controlled Delivery of Dipyridamole. J. Silico In Vitro Pharmacol. 2015, 1, 1–10. [Google Scholar]
  30. Kolhe, P.; Kannan, R.M. Improvement in ductility of chitosan through blending and copolymerization with PEG: FTIR investigation of molecular interactions. Biomacromolecules 2003, 4, 173–180. [Google Scholar] [CrossRef] [PubMed]
  31. Mansur, H.S.; Oréfice, R.L.; Mansur, A.A.P. Characterization of poly(vinyl alcohol)/poly(ethylene glycol) hydrogels and PVA-derived hybrids by small-angle X-ray scattering and FTIR spectroscopy. Polymer 2004, 45, 7193–7202. [Google Scholar] [CrossRef]
  32. Douglas, P.; Albadarin, A.B.; Sajjia, M.; Mangwandi, C.; Kuhs, M.; Collins, M.N.; Walker, G.M. Effect of poly ethylene glycol on the mechanical and thermal properties of bioactive poly (ε-caprolactone) melt extrudates for pharmaceutical applications. Int. J. Pharm. 2016, 500, 179–186. [Google Scholar] [CrossRef] [PubMed]
  33. Cheng, L.; Lei, L.; Guo, S. In vitro and in vivo evaluation of praziquantel loaded implants based on PEG/PCL blends. Int. J. Pharm. 2010, 387, 129–138. [Google Scholar] [CrossRef] [PubMed]
  34. Woodruff, M.A.; Hutmacher, D.W. The return of a forgotten polymer—Polycaprolactone in the 21st century. Prog. Polym. Sci. 2010, 35, 1217–1256. [Google Scholar] [CrossRef] [Green Version]
  35. Patrício, T.; Domingos, M.; Gloria, A.; Bártolo, P. Characterisation of PCL and PCL/PLA Scaffolds for Tissue Engineering. Procedia CIRP 2013, 5, 110–114. [Google Scholar] [CrossRef]
  36. Izadifar, Z.; Chang, T.; Kulyk, W.; Chen, X.; Eames, B.F. Analyzing Biological Performance of 3D-Printed, Cell-Impregnated Hybrid Constructs for Cartilage Tissue Engineering. Tissue Eng. Part C Methods 2016, 22, 173–188. [Google Scholar] [CrossRef] [PubMed]
  37. Huang, M.-H.; Li, S.; Hutmacher, D.W.; Schantz, J.-T.; Vacanti, C.A.; Braud, C.; Vert, M. Degradation and cell culture studies on block copolymers prepared by ring opening polymerization of ε-caprolactone in the presence of poly(ethylene glycol). J. Biomed. Mater. Res. A 2004, 69, 417–427. [Google Scholar] [CrossRef] [PubMed]
  38. Lam, C.X.; Savalani, M.M.; Teoh, S.H.; Hutmacher, D.W. Dynamics of in vitro polymer degradation of polycaprolactone-based scaffolds: Accelerated versus simulated physiological conditions. Biomed. Mater. 2008, 3, 034108. [Google Scholar] [CrossRef] [PubMed]
  39. Domingos, M.; Intranuovo, F.; Russo, T.; de Santis, R.; Gloria, A.; Ambrosio, L.; Ciurana, J.; Bartolo, P. The first systematic analysis of 3D rapid prototyped poly(ε-caprolactone) scaffolds manufactured through BioCell printing: The effect of pore size and geometry on compressive mechanical behaviour and in vitro hMSC viability. Biofabrication 2013, 5, 045004. [Google Scholar] [CrossRef] [PubMed]
  40. Chuang, W.-T.; Jeng, U.-S.; Sheu, H.-S.; Hong, P.-D. Competition between phase separation and crystallization in a PCL/PEG polymer blend captured by synchronized SAXS, WAXS, and DSC. Macromol. Res. 2006, 14, 45–51. [Google Scholar] [CrossRef]
  41. Sarker, B.; Rompf, J.; Silva, R.; Lang, N.; Detsch, R.; Kaschta, J.; Fabry, B.; Boccaccini, A.R. Alginate-based hydrogels with improved adhesive properties for cell encapsulation. Int. J. Biol. Macromol. 2015, 78, 72–78. [Google Scholar] [CrossRef] [PubMed]
  42. Ivanovska, J.; Zehnder, T.; Lennert, P.; Sarker, B.; Boccaccini, A.R.; Hartmann, A.; Schneider-Stock, R.; Detsch, R. Biofabrication of 3D Alginate-Based Hydrogel for Cancer Research: Comparison of Cell Spreading, Viability, and Adhesion Characteristics of Colorectal HCT116 Tumor Cells. Tissue Eng. Part C Methods 2016, 22, 708–715. [Google Scholar] [CrossRef] [PubMed]
  43. Kundu, J.; Shim, J.-H.; Jang, J.; Kim, S.-W.; Cho, D.-W. An additive manufacturing-based PCL-alginate-chondrocyte bioprinted scaffold for cartilage tissue engineering. J. Tissue Eng. Regen. Med. 2015, 9, 1286–1297. [Google Scholar] [CrossRef] [PubMed]
Figure 1. Scheme of a hard-phase (PCL-PEG) scaffold with typical double-strut structure.
Materials 09 00887 g001
Figure 2. Scheme of a hard-soft phase scaffold with the hard thermoplastic phase (grey) and the soft hydrogel phase (yellow) containing the cells.
Materials 09 00887 g002
Figure 3. FTIR spectra of PCL, PCL-PEG blend and PEG plotted plates (the relevant peaks are discussed in the text).
Materials 09 00887 g003
Figure 4. Fluorescence microscope image of PCL and PCL-PEG plates seeded with ST2 cells showing cytoplasm (red) and cell nuclei (blue) after two days of incubation: (a) PCL; (b) PCL-PEG 8020; and (c) PCL-PEG 7030.
Materials 09 00887 g004
Figure 5. Cell viability of PCL and PCL-PEG plates seeded with ST2 cells over an incubation period of 21 days. Asterisks denote significant difference of pairwise comparison * p < 0.05; ** p < 0.01; *** p < 0.001.
Materials 09 00887 g005
Figure 6. Stereomicroscope images of a plotted PCL-PEG (7030) scaffold as fabricated: topview (a); and side view (b) (scale bar = 2 mm).
Materials 09 00887 g006
Figure 7. Mass loss of PCL and PCL-PEG blend scaffolds after three days of incubation at 37 °C.
Materials 09 00887 g007
Figure 8. Electron microscopy images of the surfaces of PCL scaffolds as fabricated (a,b), and after three days of incubation in HBSS (c); and PCL-PEG 7030 scaffolds as fabricated (d,e), and after three days of incubation in HBSS (f) at 37 °C.
Materials 09 00887 g008
Figure 9. Electron microscopy images of the cross-sections of PCL scaffolds as fabricated (a,b), and after three days of incubation in HBSS (c); and PCL-PEG 7030 scaffolds as fabricated (d,e), and after three days of incubation in HBSS (f) at 37 °C.
Materials 09 00887 g009
Figure 10. Compressive stiffness of PCL and PCL-PEG blend scaffolds with different compositions in dependence of: (a) storage time in HBSS at 37 °C; and (b) different scaffolds design. Asterisks denote significant difference of pairwise comparison. * p < 0.05; ** p < 0.01; *** p < 0.001.
Materials 09 00887 g010
Figure 11. Cell viability of a PCL-PEG 7030 ADA-GEL construct with ST2 cells up to 28 days of incubation. Asterisks denote significant difference of pairwise comparison. *** p < 0.001.
Materials 09 00887 g011
Figure 12. Optical microscope images of PCL-PEG ADA-GEL constructs with ST2 cells: after fabrication (upper row); after 14 days of incubation (middle row); and after 28 days of incubation (bottom row).
Materials 09 00887 g012
Figure 13. Fluorescence microscope images (af) of the actin cytoskeleton (red) and the cell nuclei (green) of ST2 cells in a PCL-PEG ADA-GEL construct after 28 days of incubation of different magnification: (a,b) overview images; (c) densely packed area of the cells covering both materials; (d) cell morphology on the hard phase; (e) cell agglomerate and spread single cells in hydrogel; and (f) densely packed area of cells (hydrogel phase).
Materials 09 00887 g013
Table 1. Scaffold geometry data for PCL and PCL-PEG blend scaffolds for two different design set-ups using 14 or 10 lines per layer.
Design (Lines Per Layer)MaterialStrut Width (µm)Pore Size (µm)Porosity (%)
14PCL358 ± 15401 ± 2041 ± 3
14PCL-PEG 8020425 ± 118318 ± 12333 ± 13
14PCL-PEG 7030313 ± 73434 ± 6752 ± 9
10PCL313 ± 72801 ± 6765 ± 5
10PCL-PEG 8020380 ± 79712 ± 7646 ± 5
10PCL-PEG 7030307 ± 84794 ± 10465 ± 10

