
Improved Sectional Image Analysis Technique for Evaluating Fiber Orientations in Fiber-Reinforced Cement-Based Materials


Abstract
:1. Introduction
2. Fiber Distribution Evaluation Method
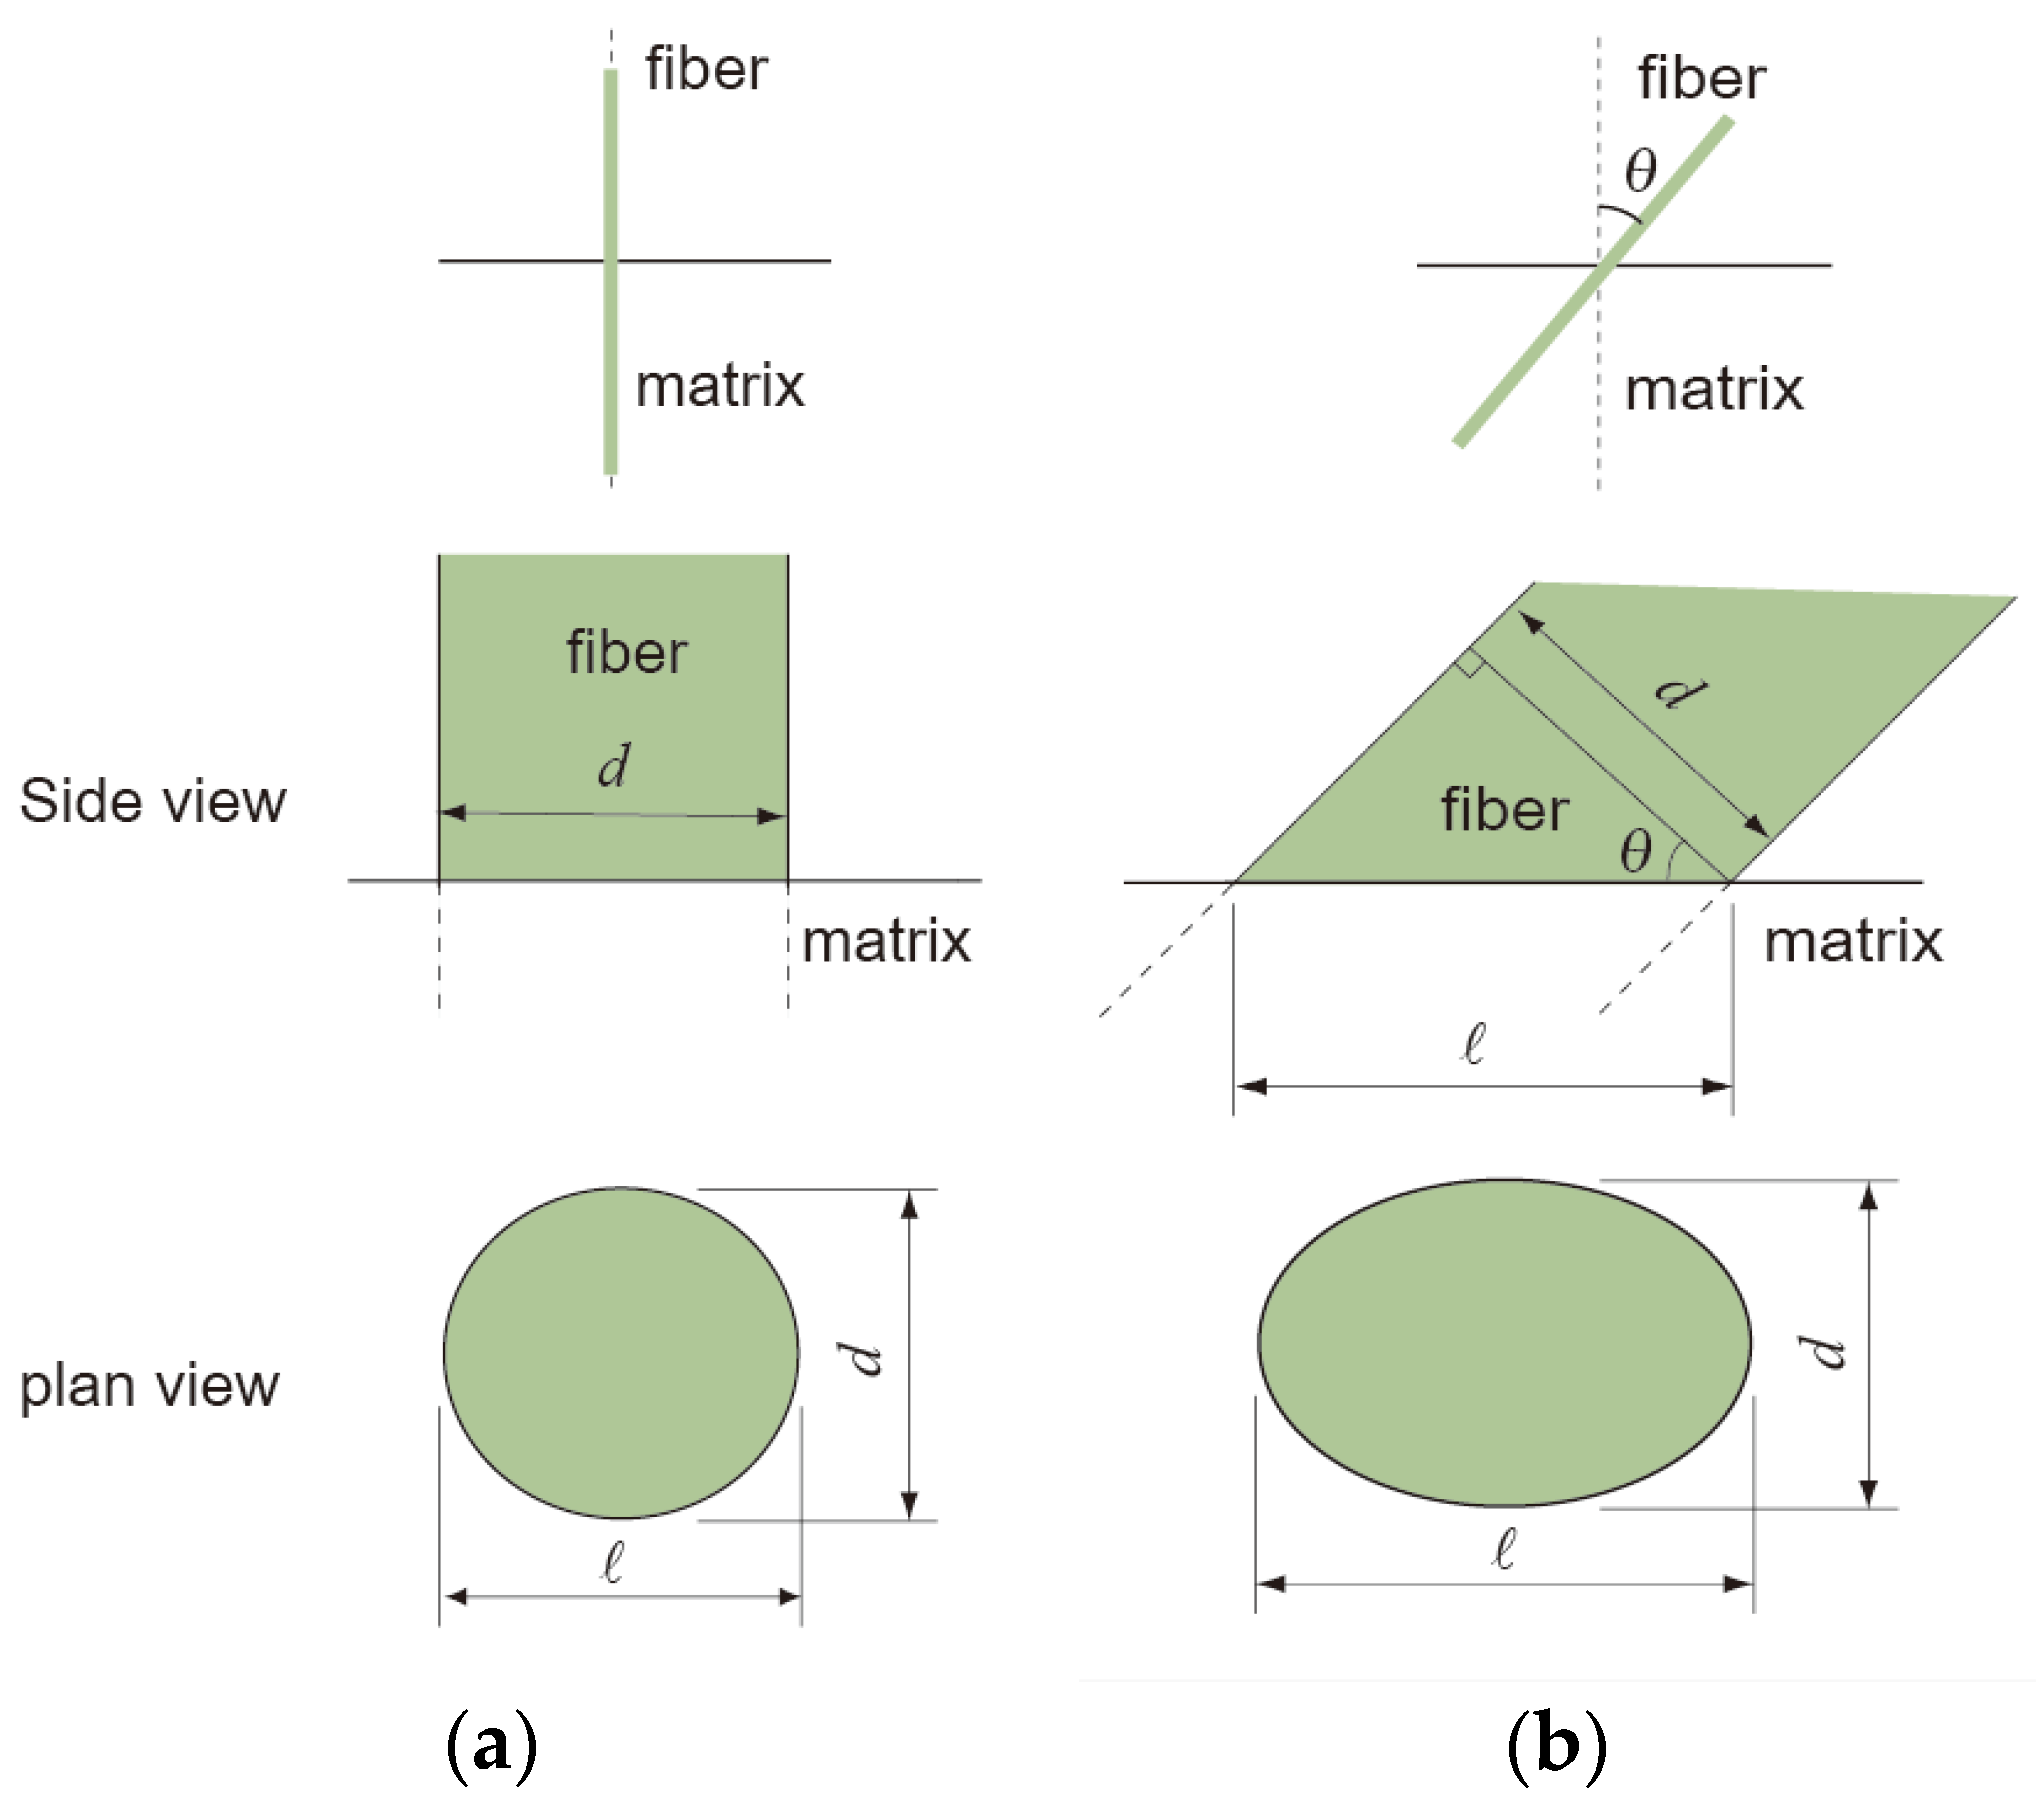
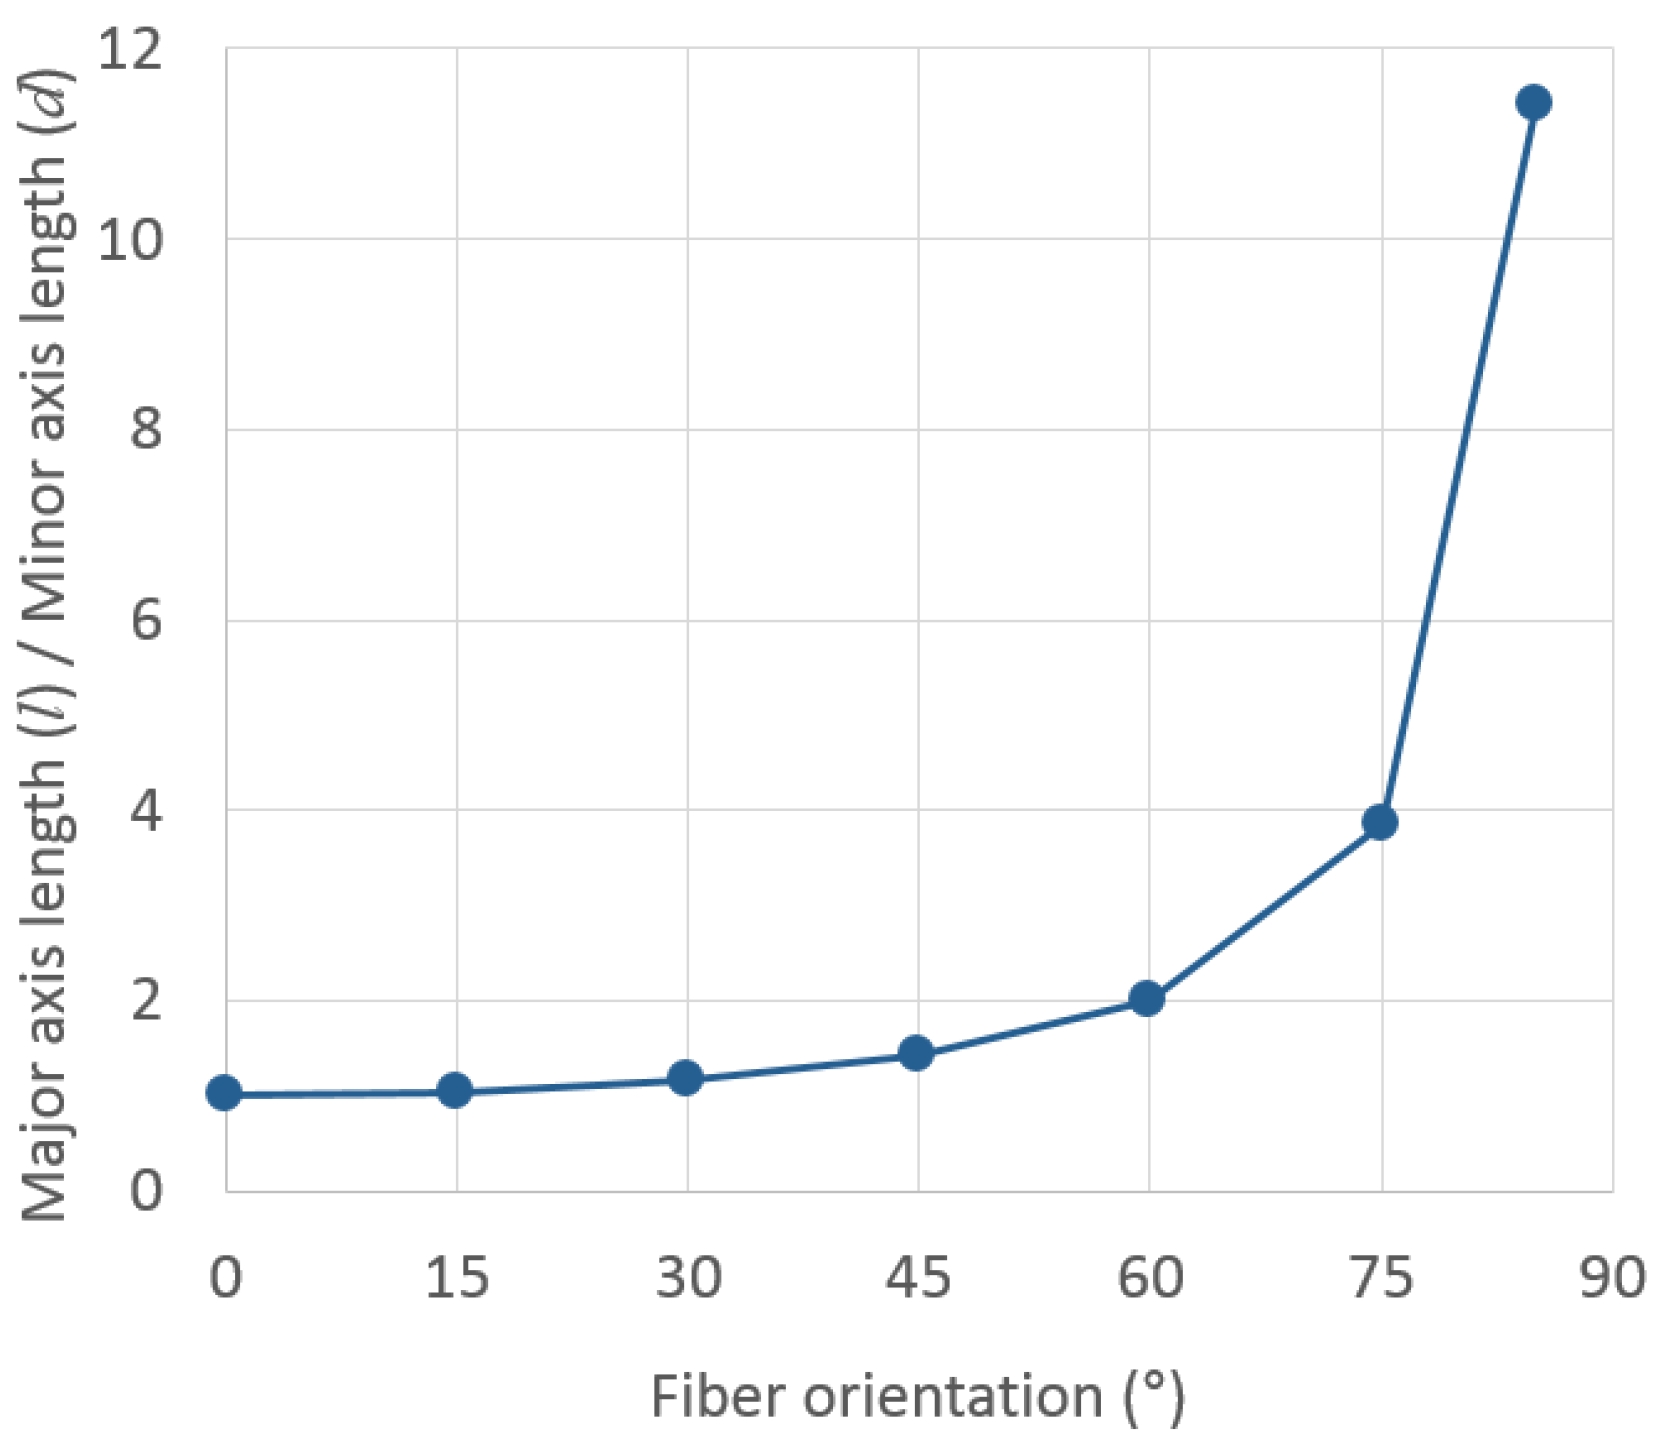
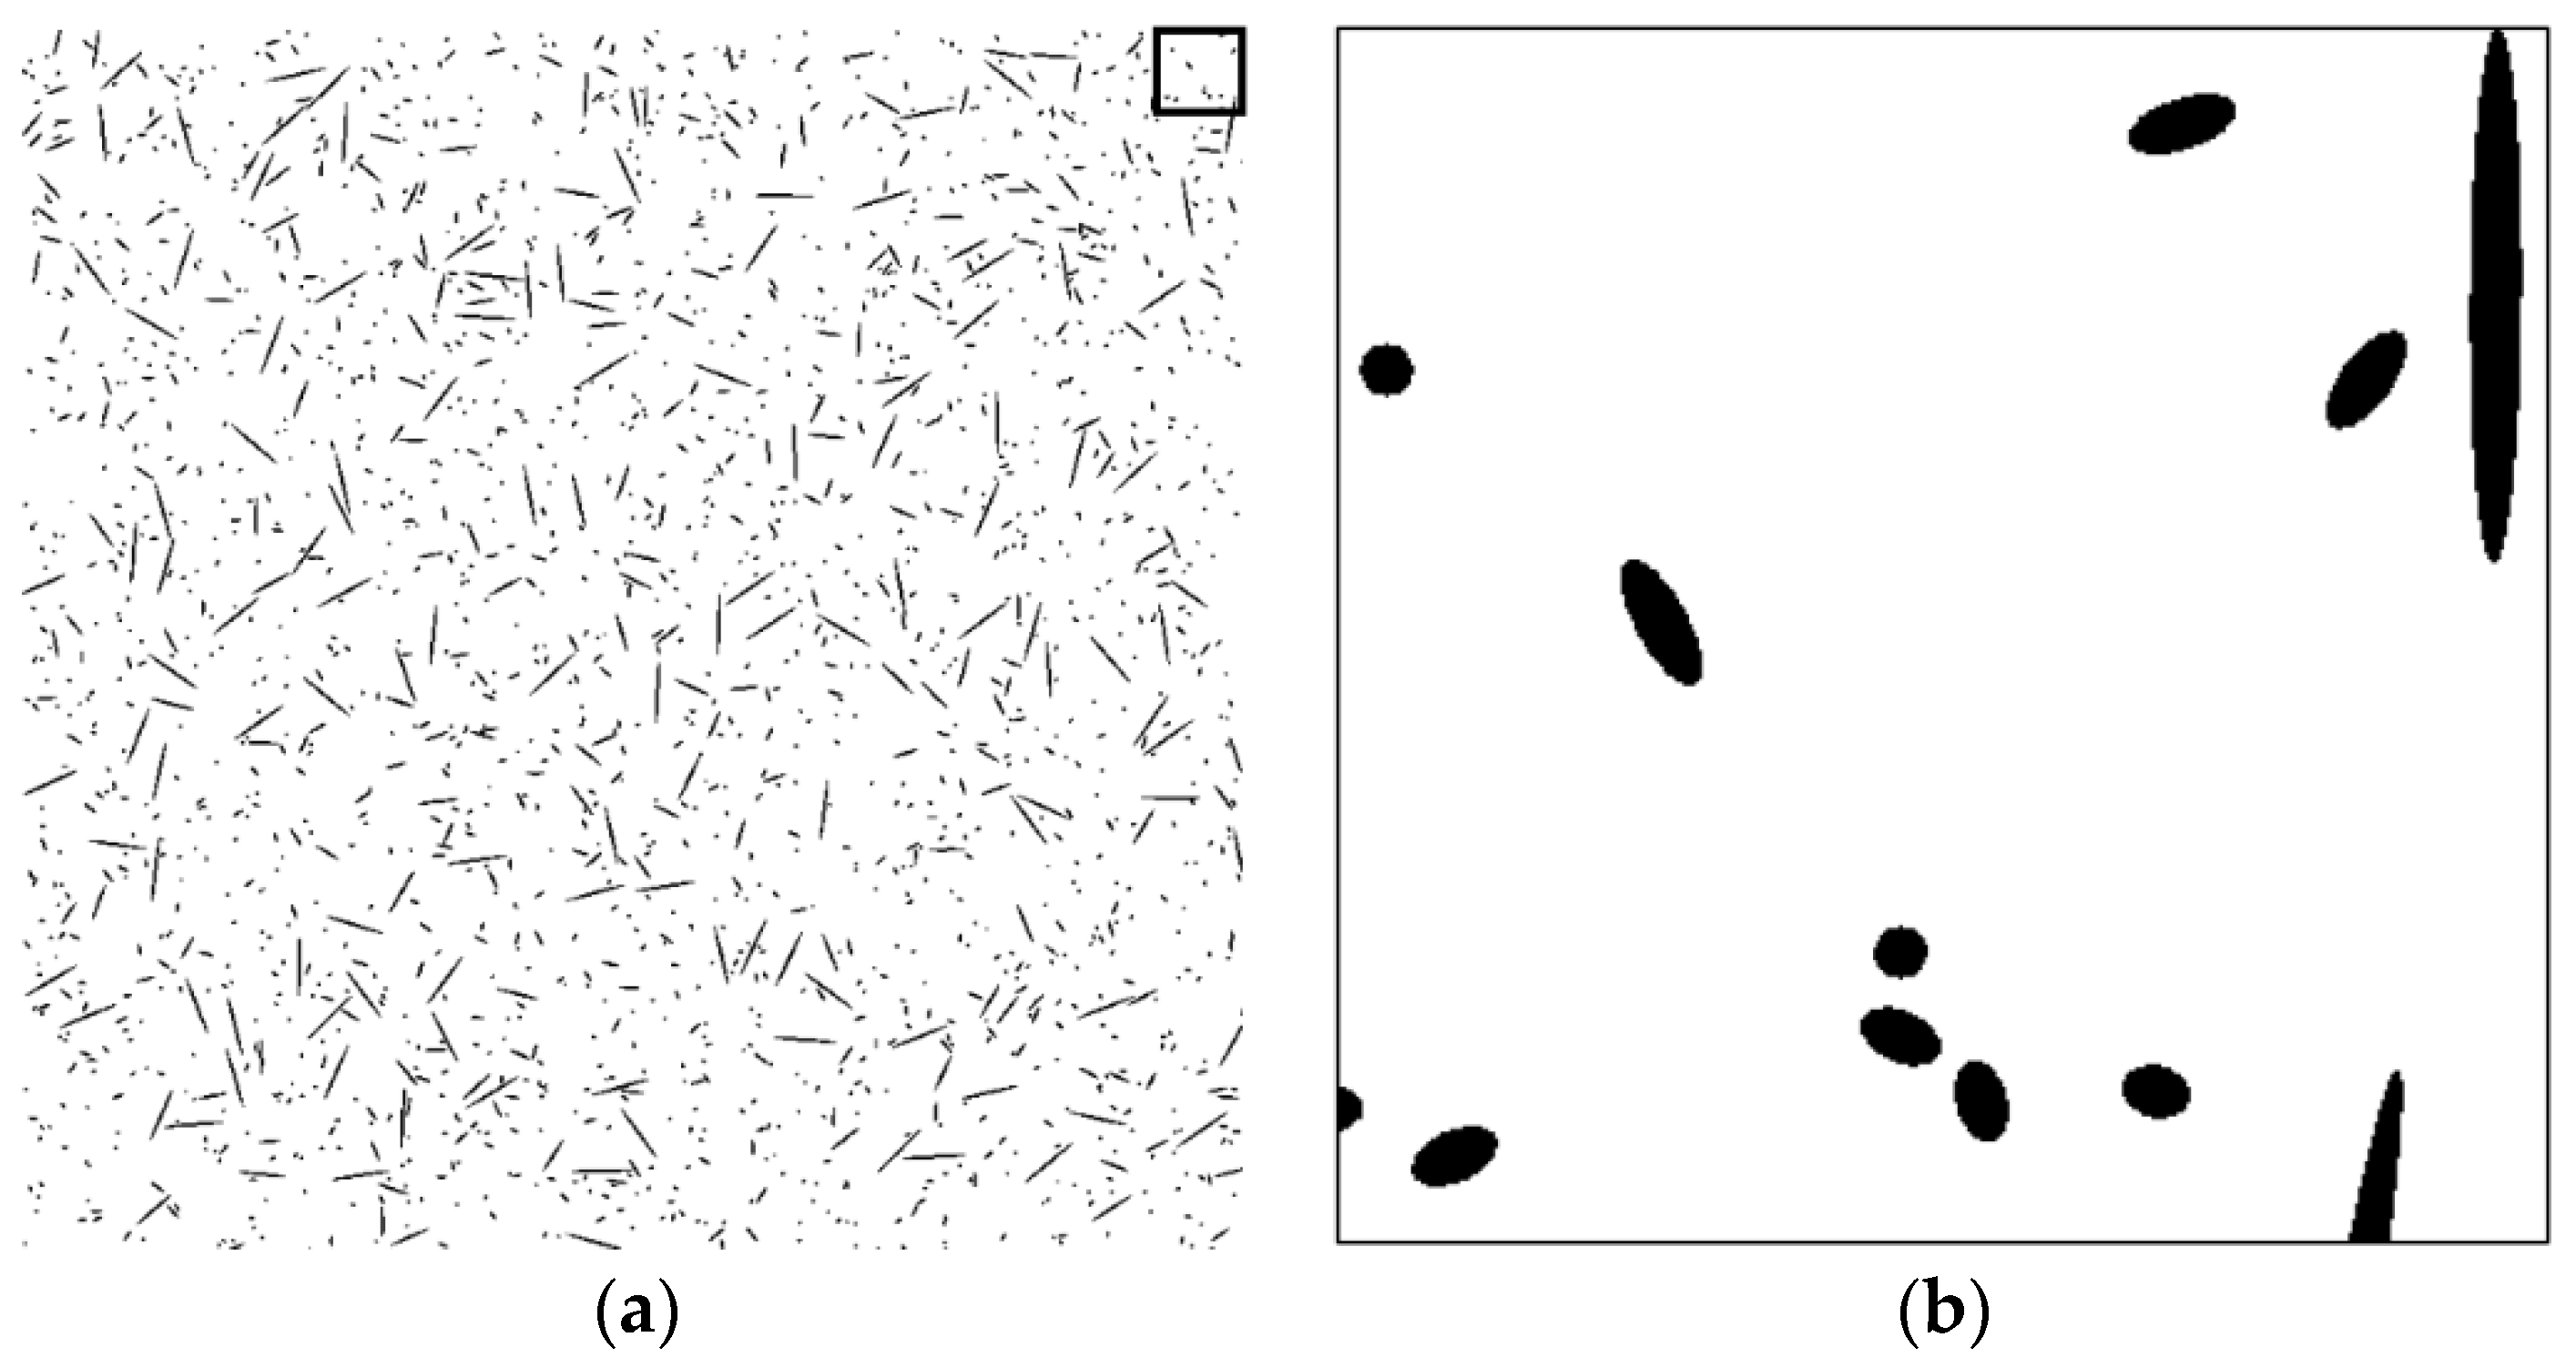
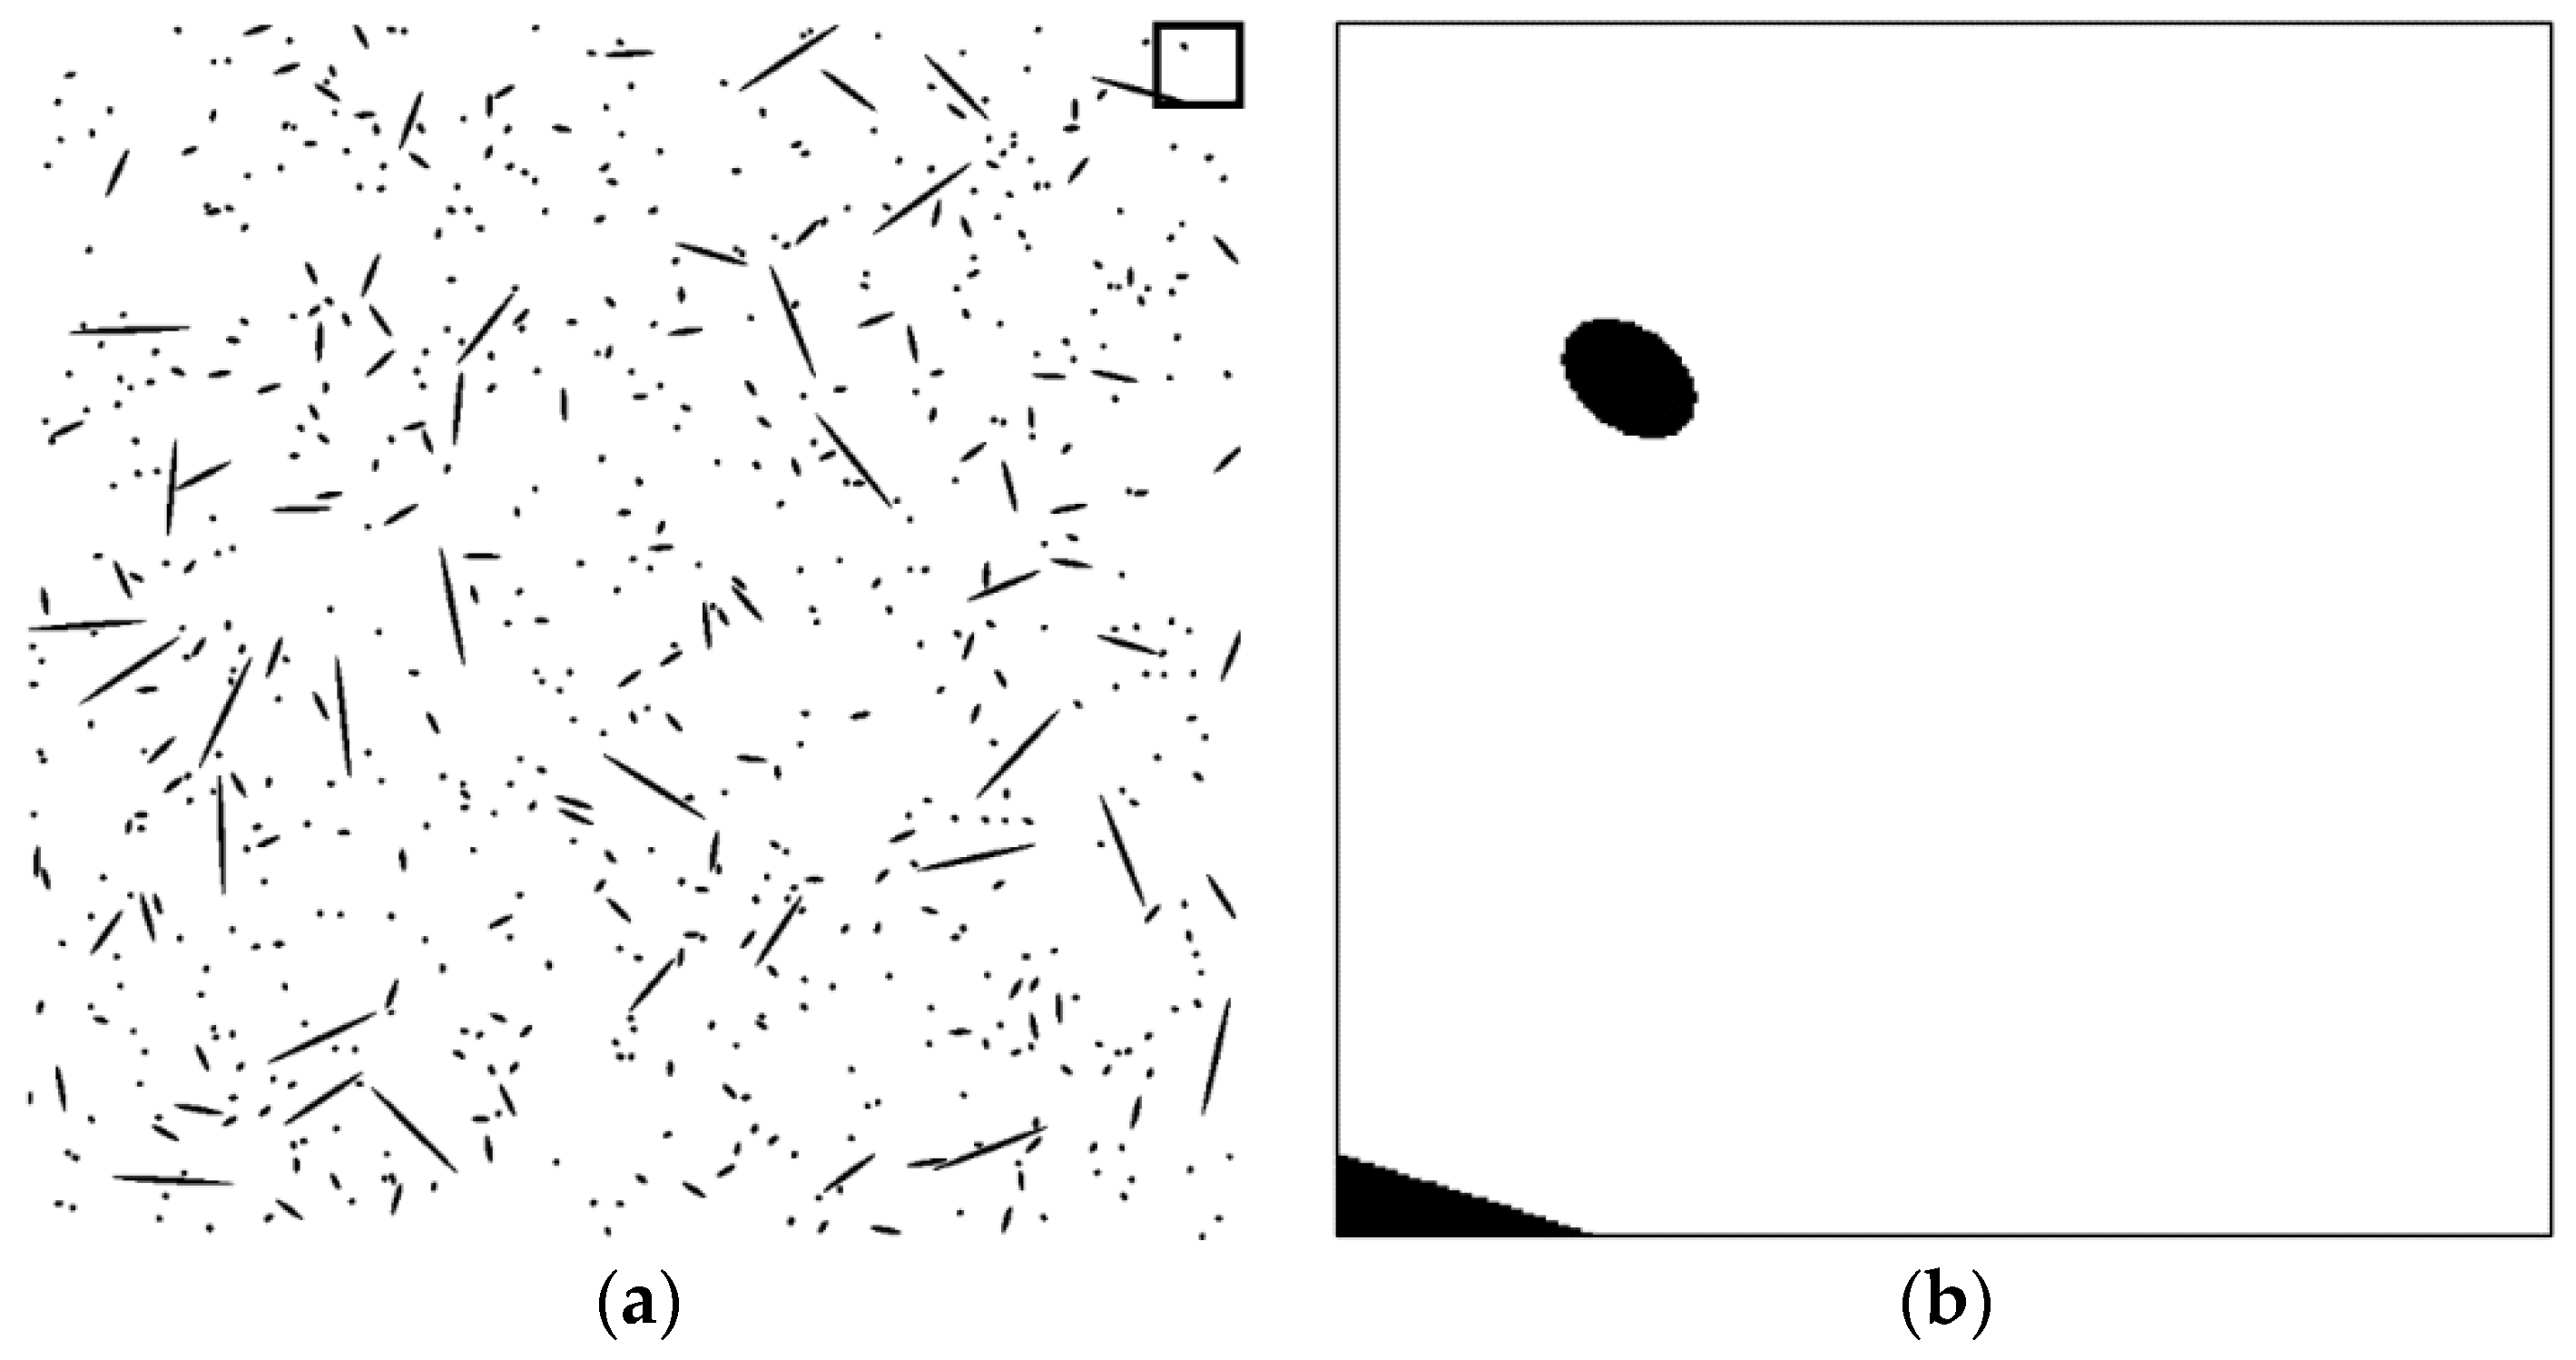
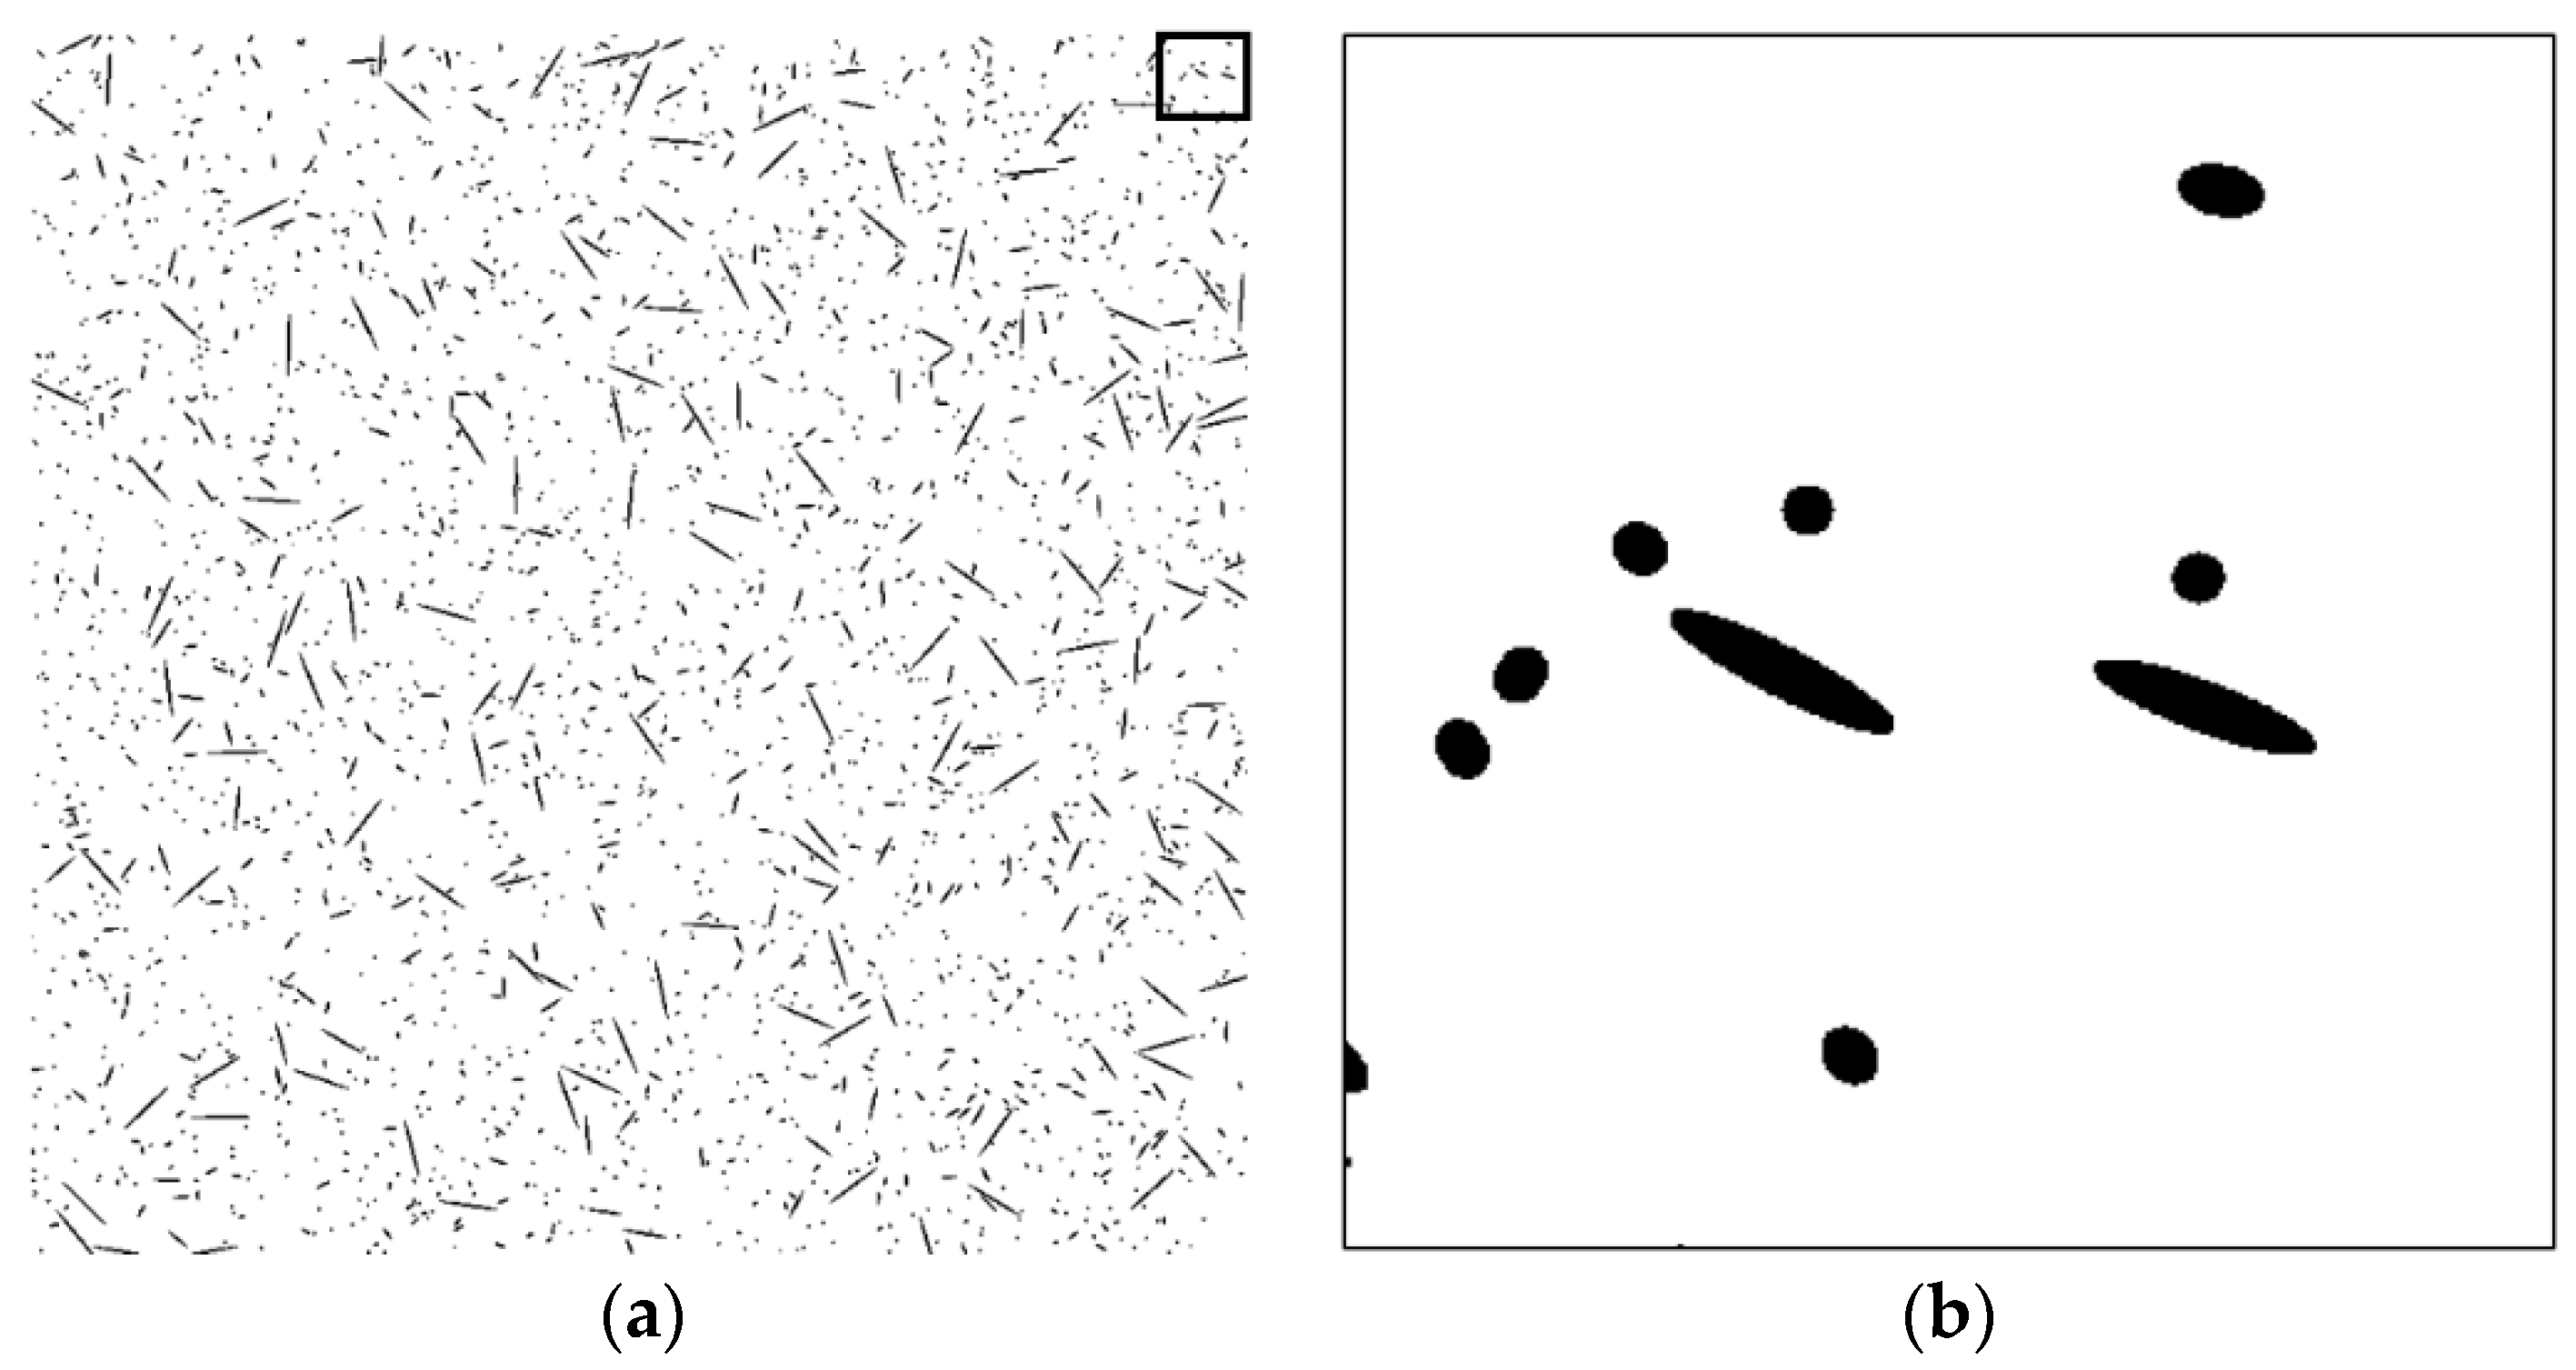
2.1. Image Analysis for the Evaluation of the Fiber Orientation Distribution

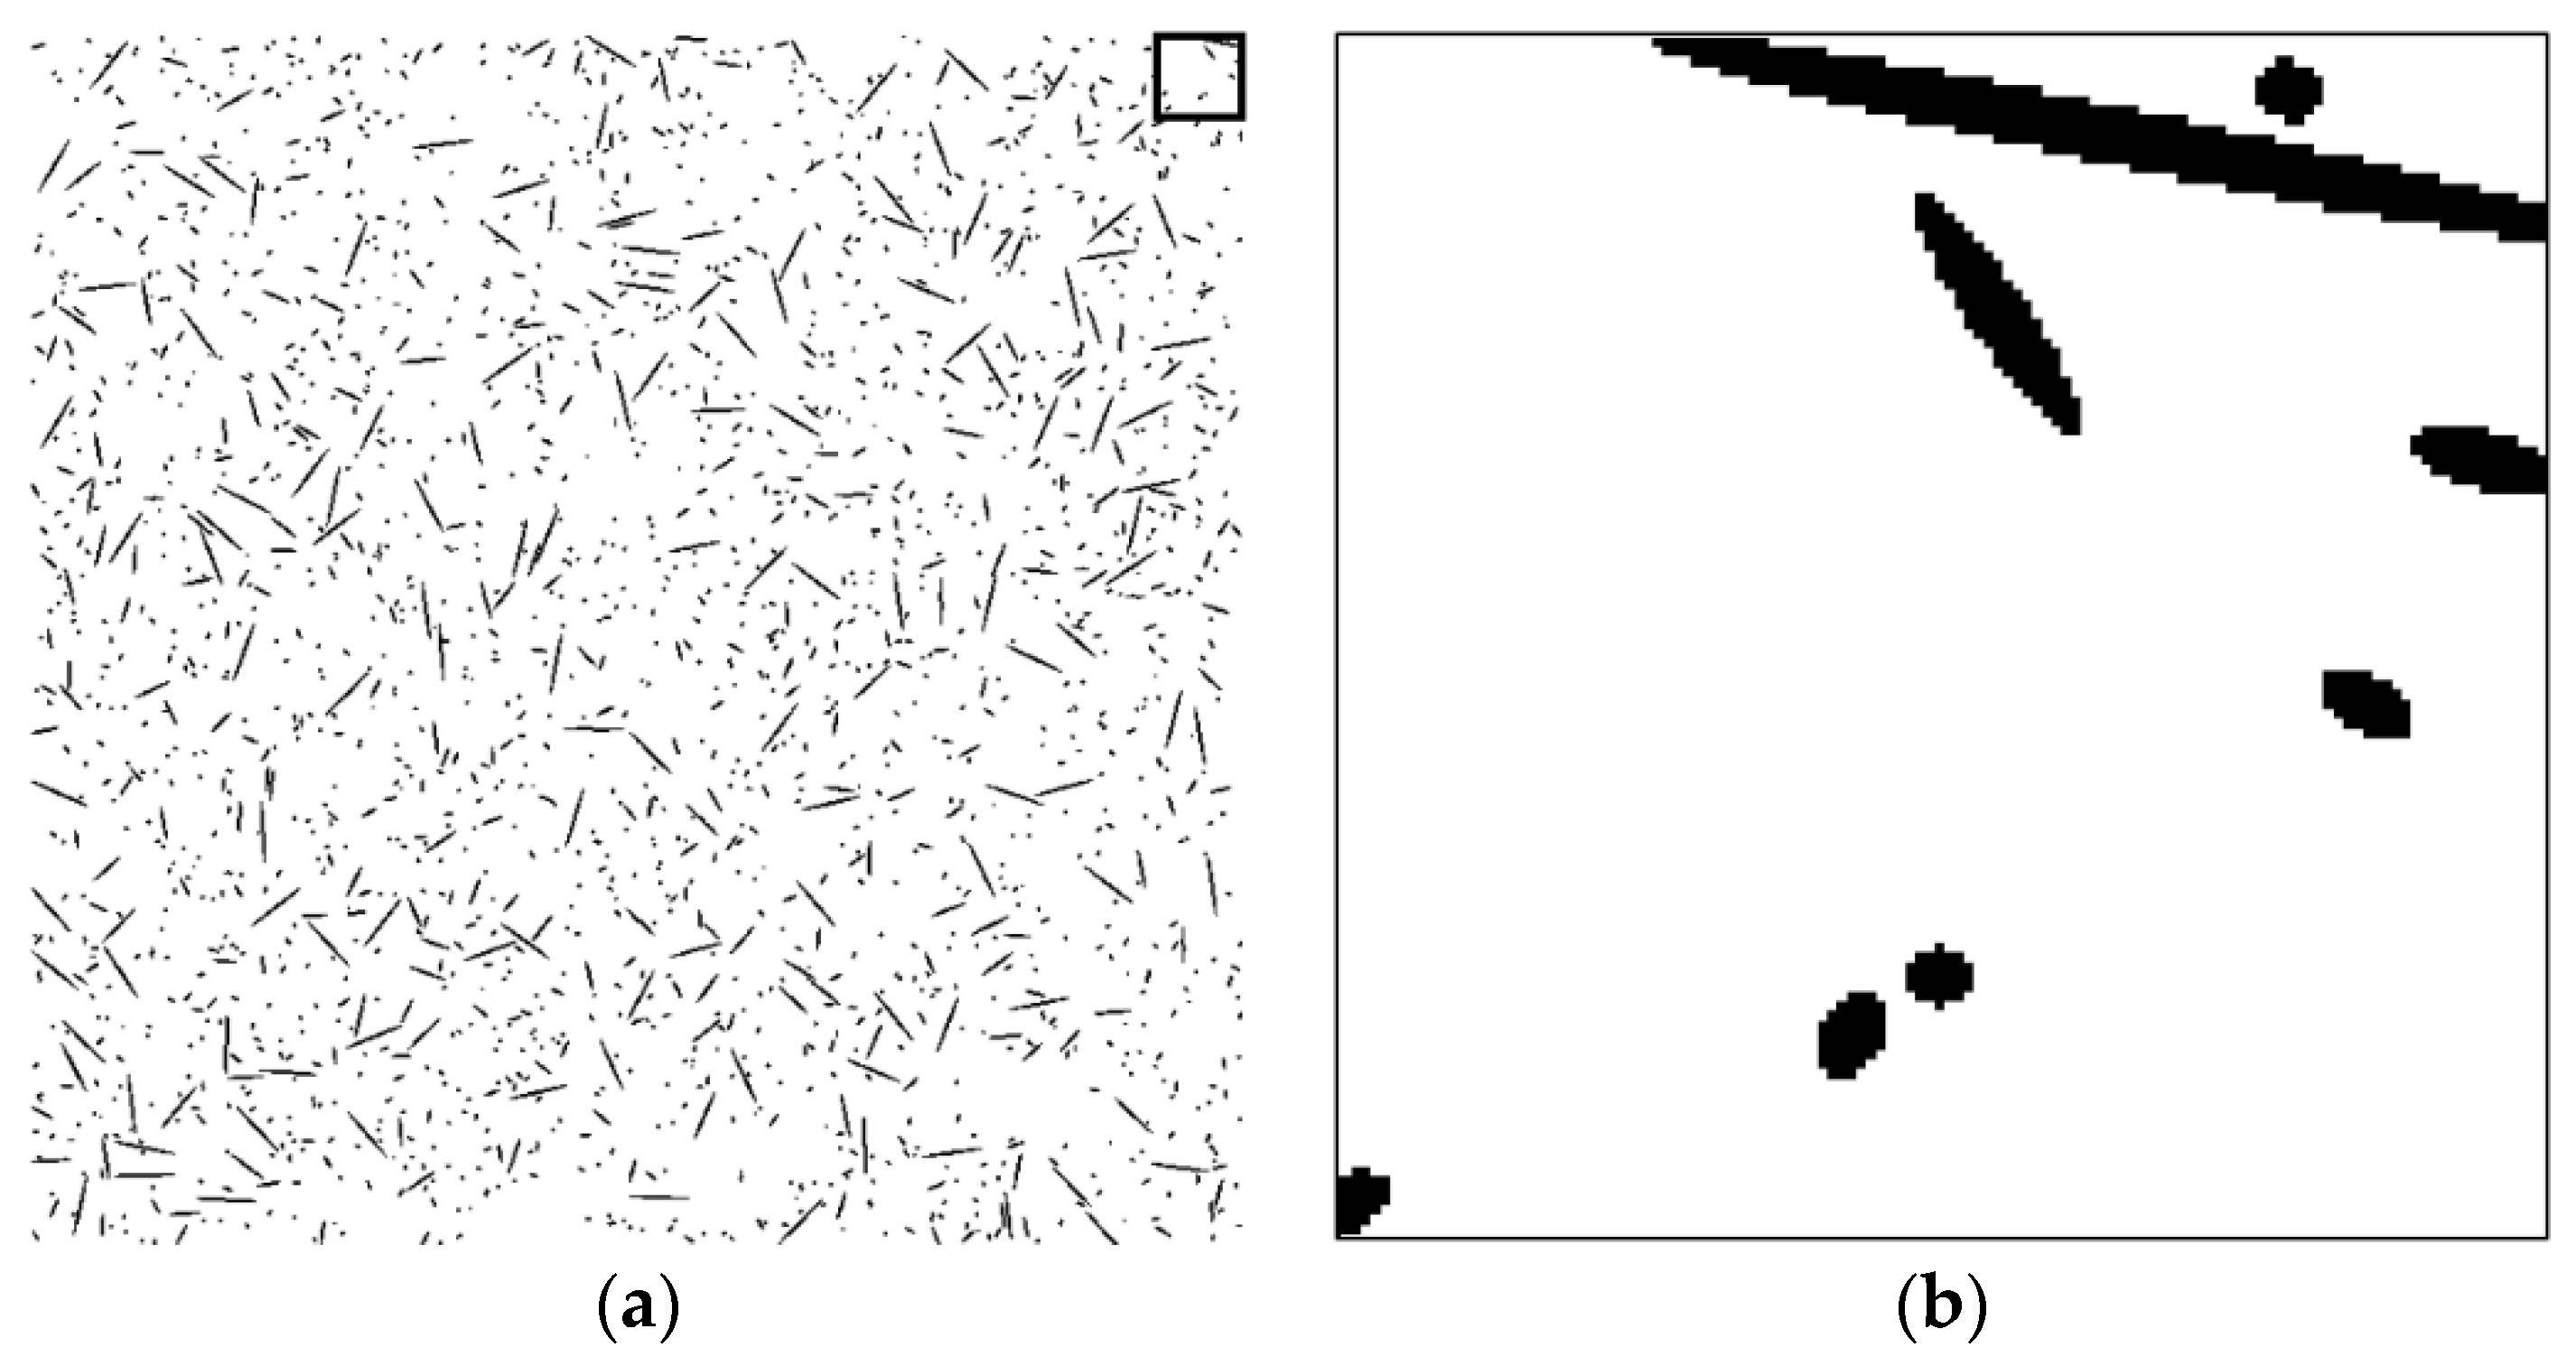
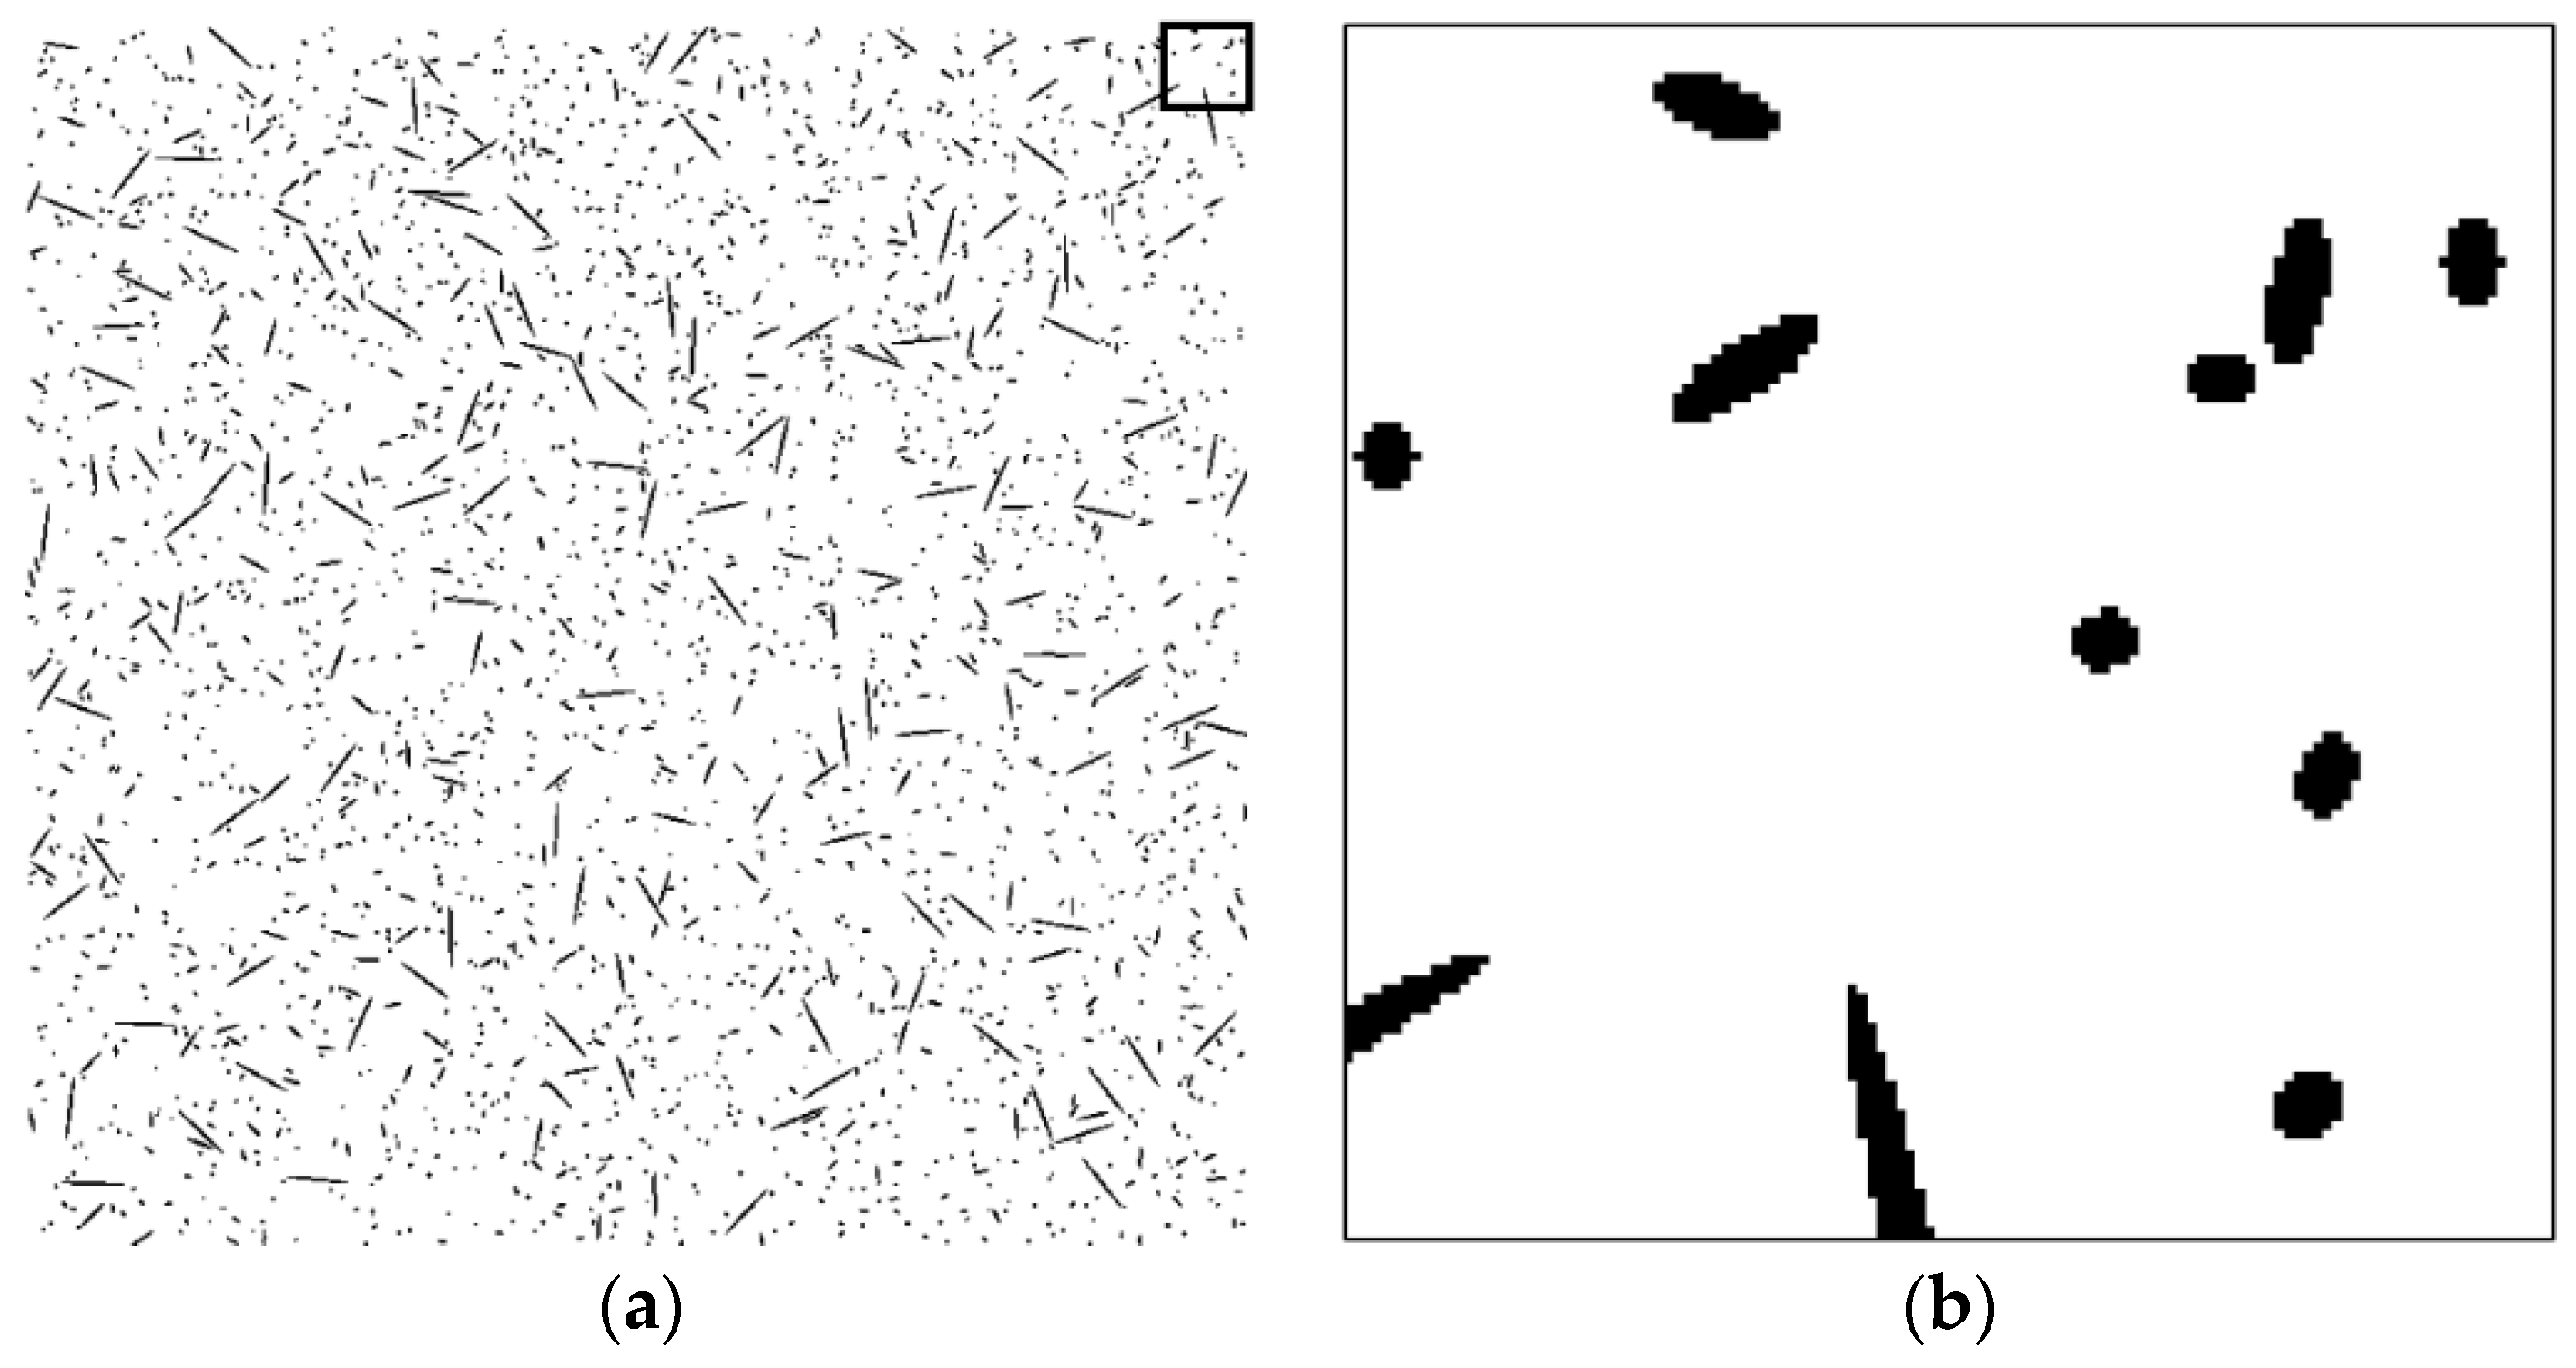
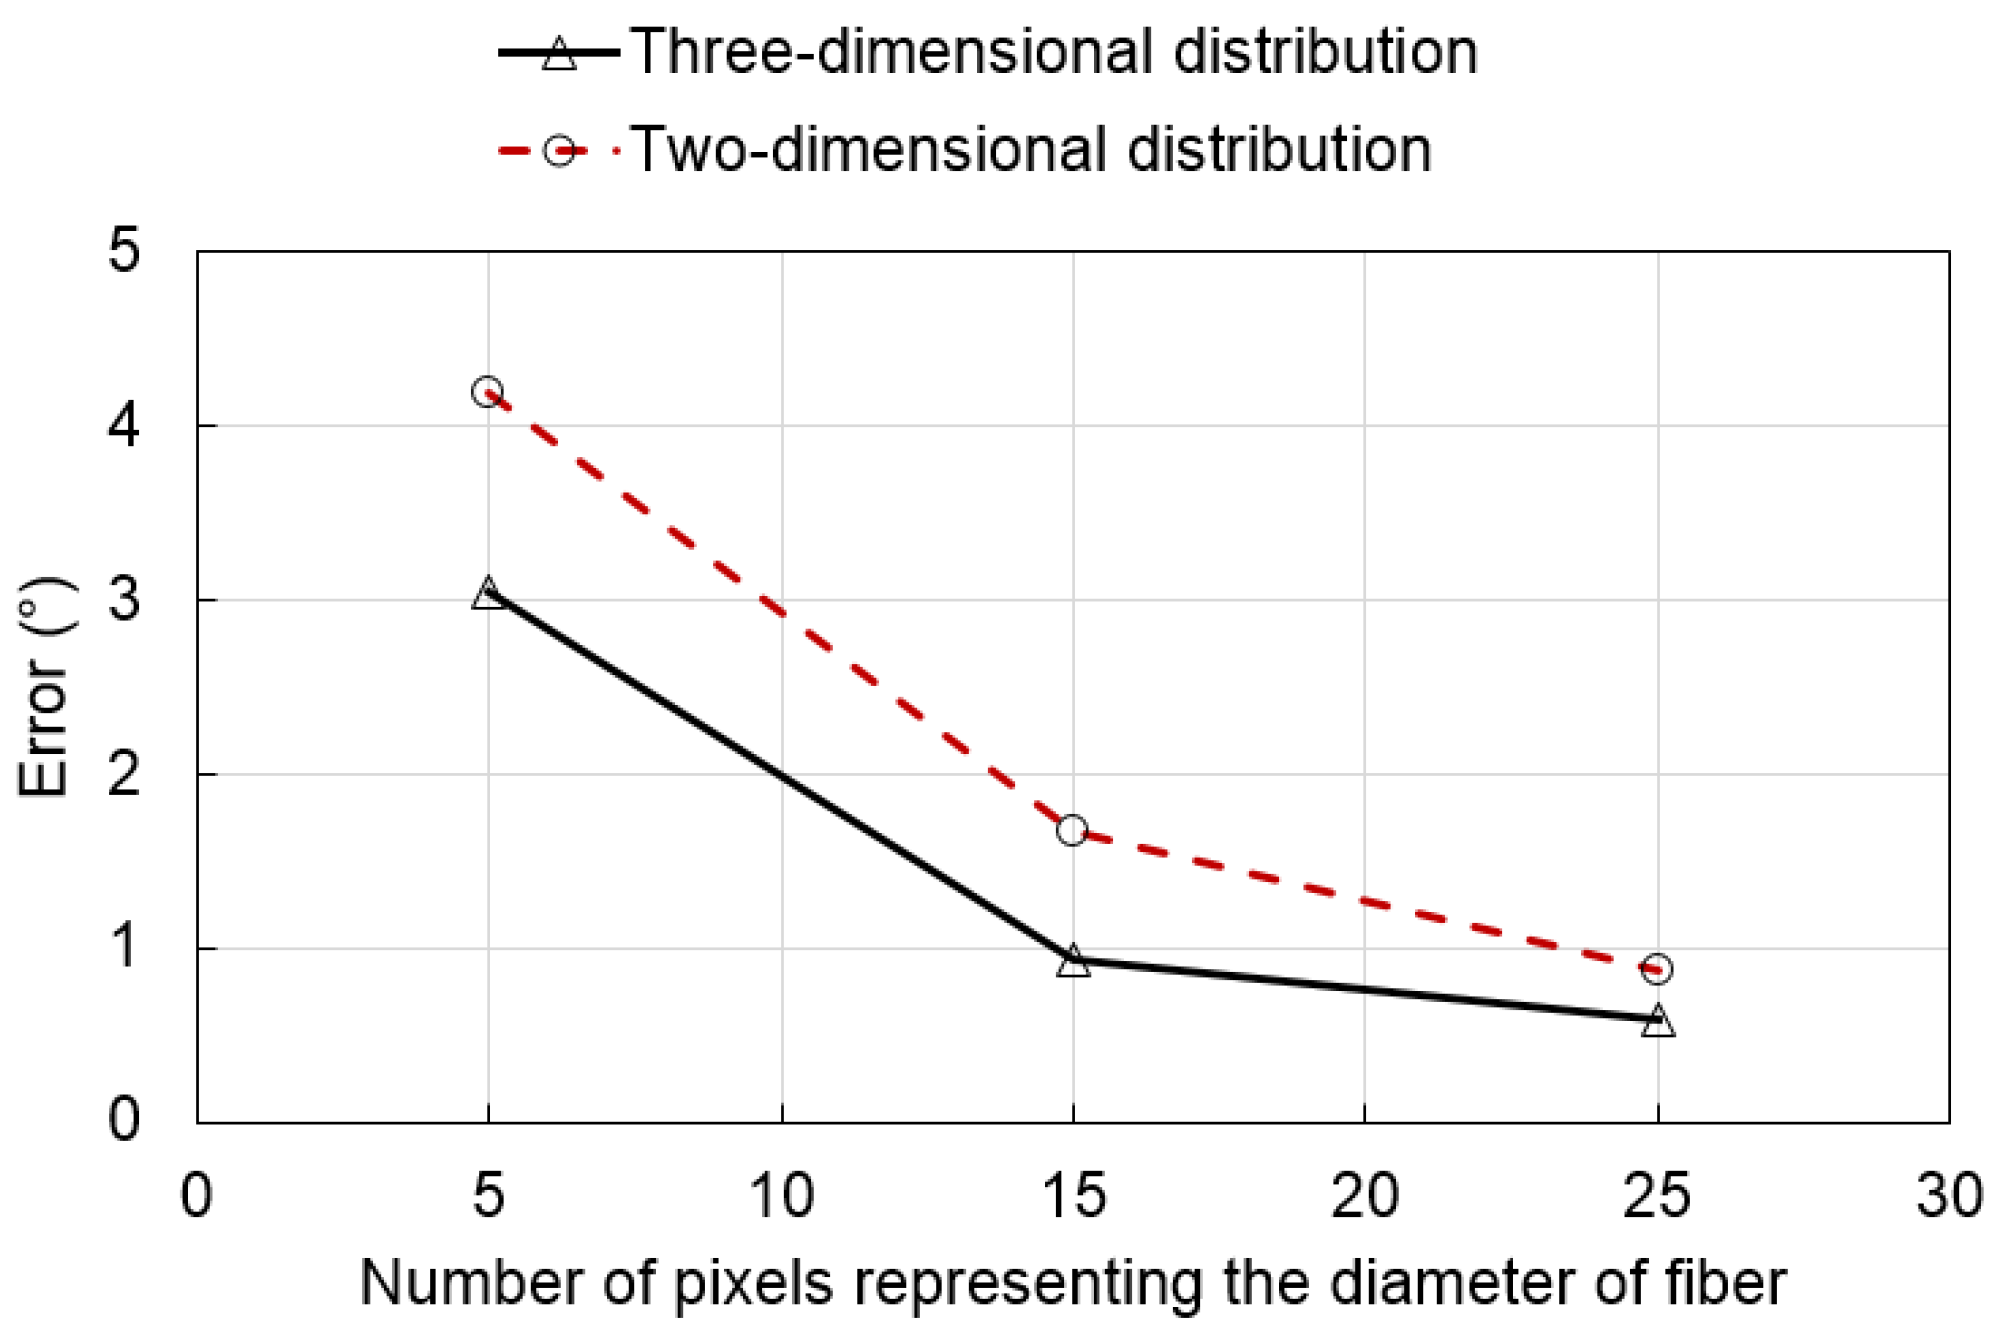
2.2. Effect of the Number of Pixels on the Detection Accuracy

| Fiber Orientation (°) | Fiber Image |
|---|---|
| 0 |  |
| 15 |  |
| 30 |  |
| 45 |  |
| 60 |  |
| 75 |  |
| 85 |  |

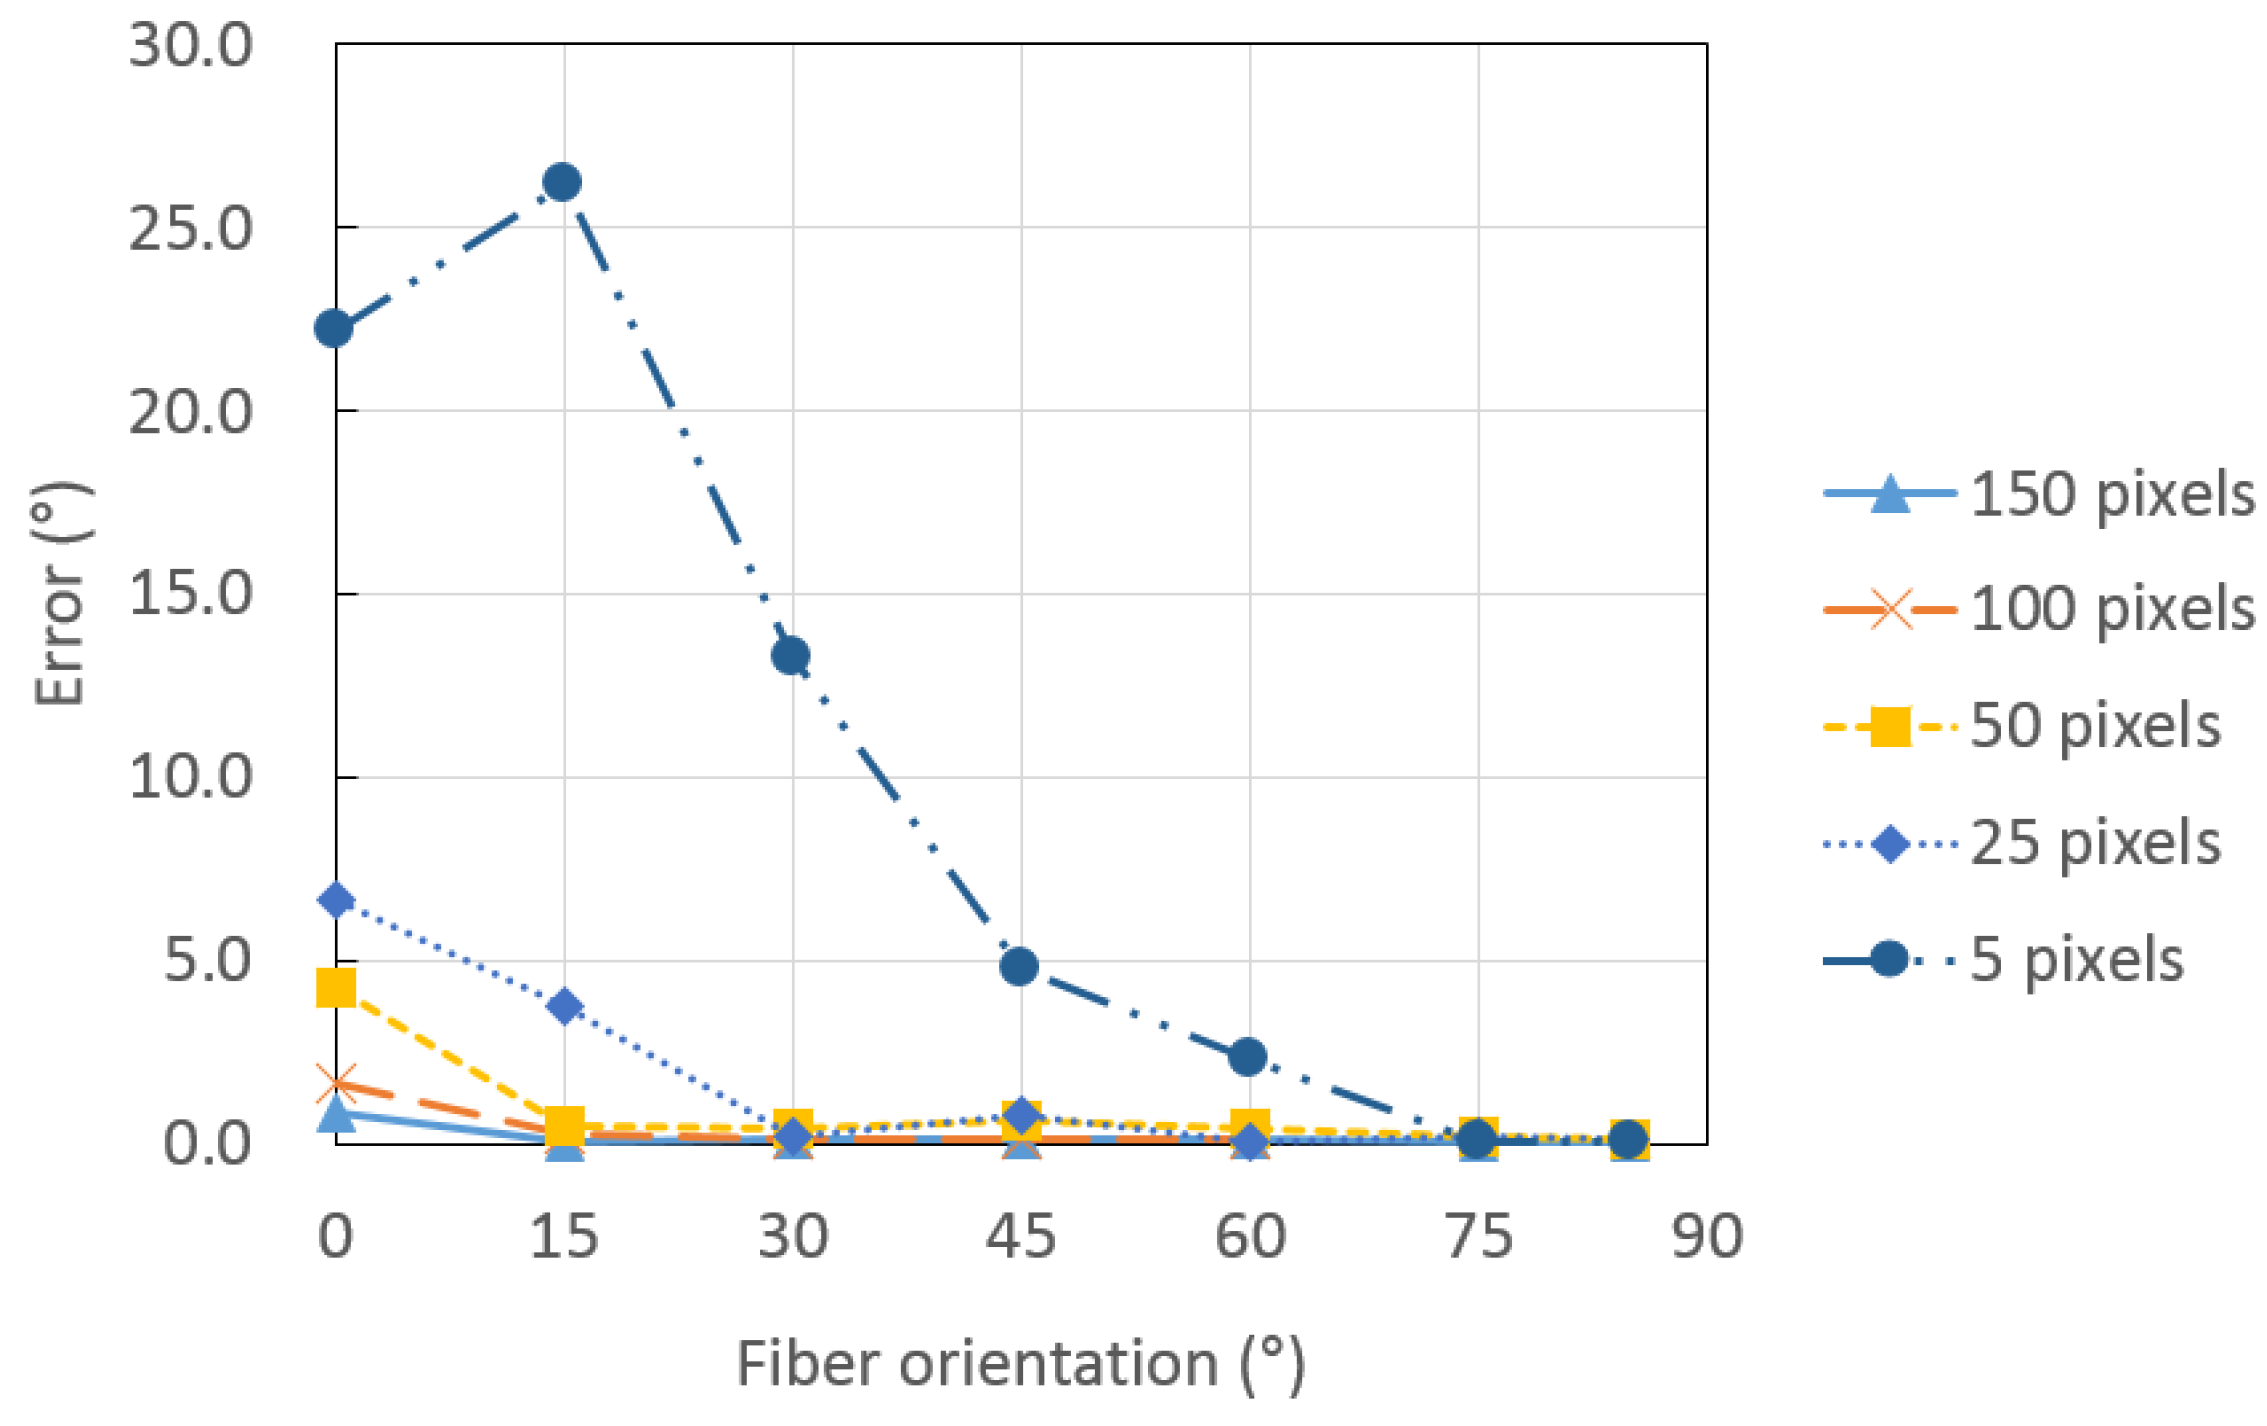
| Number of Pixels in the Diameter of the Fiber | Fiber Orientation (°) | ||||||
|---|---|---|---|---|---|---|---|
| 0 | 15 | 30 | 45 | 60 | 75 | 85 | |
| 150 | 0.8 | 14.9 | 29.9 | 44.9 | 59.9 | 74.9 | 85.0 |
| 100 | 1.7 | 14.7 | 29.9 | 44.9 | 59.9 | 74.9 | 85.0 |
| 50 | 4.3 | 14.5 | 29.6 | 44.4 | 59.6 | 74.8 | 84.9 |
| 25 | 6.6 | 18.7 | 30.2 | 45.7 | 59.9 | 74.8 | 84.9 |
| 5 | 22.2 | 41.2 | 43.2 | 49.8 | 62.3 | 75.1 | 84.9 |
| Number of Pixels in the Diameter of the Fiber | Real Diameter of the Fiber (μm) | ||
|---|---|---|---|
| 10 | 40 | 200 | |
| 150 | 0.07 | 0.27 | 1.33 |
| 100 | 0.10 | 0.40 | 2.00 |
| 50 | 0.20 | 0.80 | 4.00 |
| 25 | 0.40 | 1.60 | 8.00 |
| 5 | 2.00 | 8.00 | 40.00 |
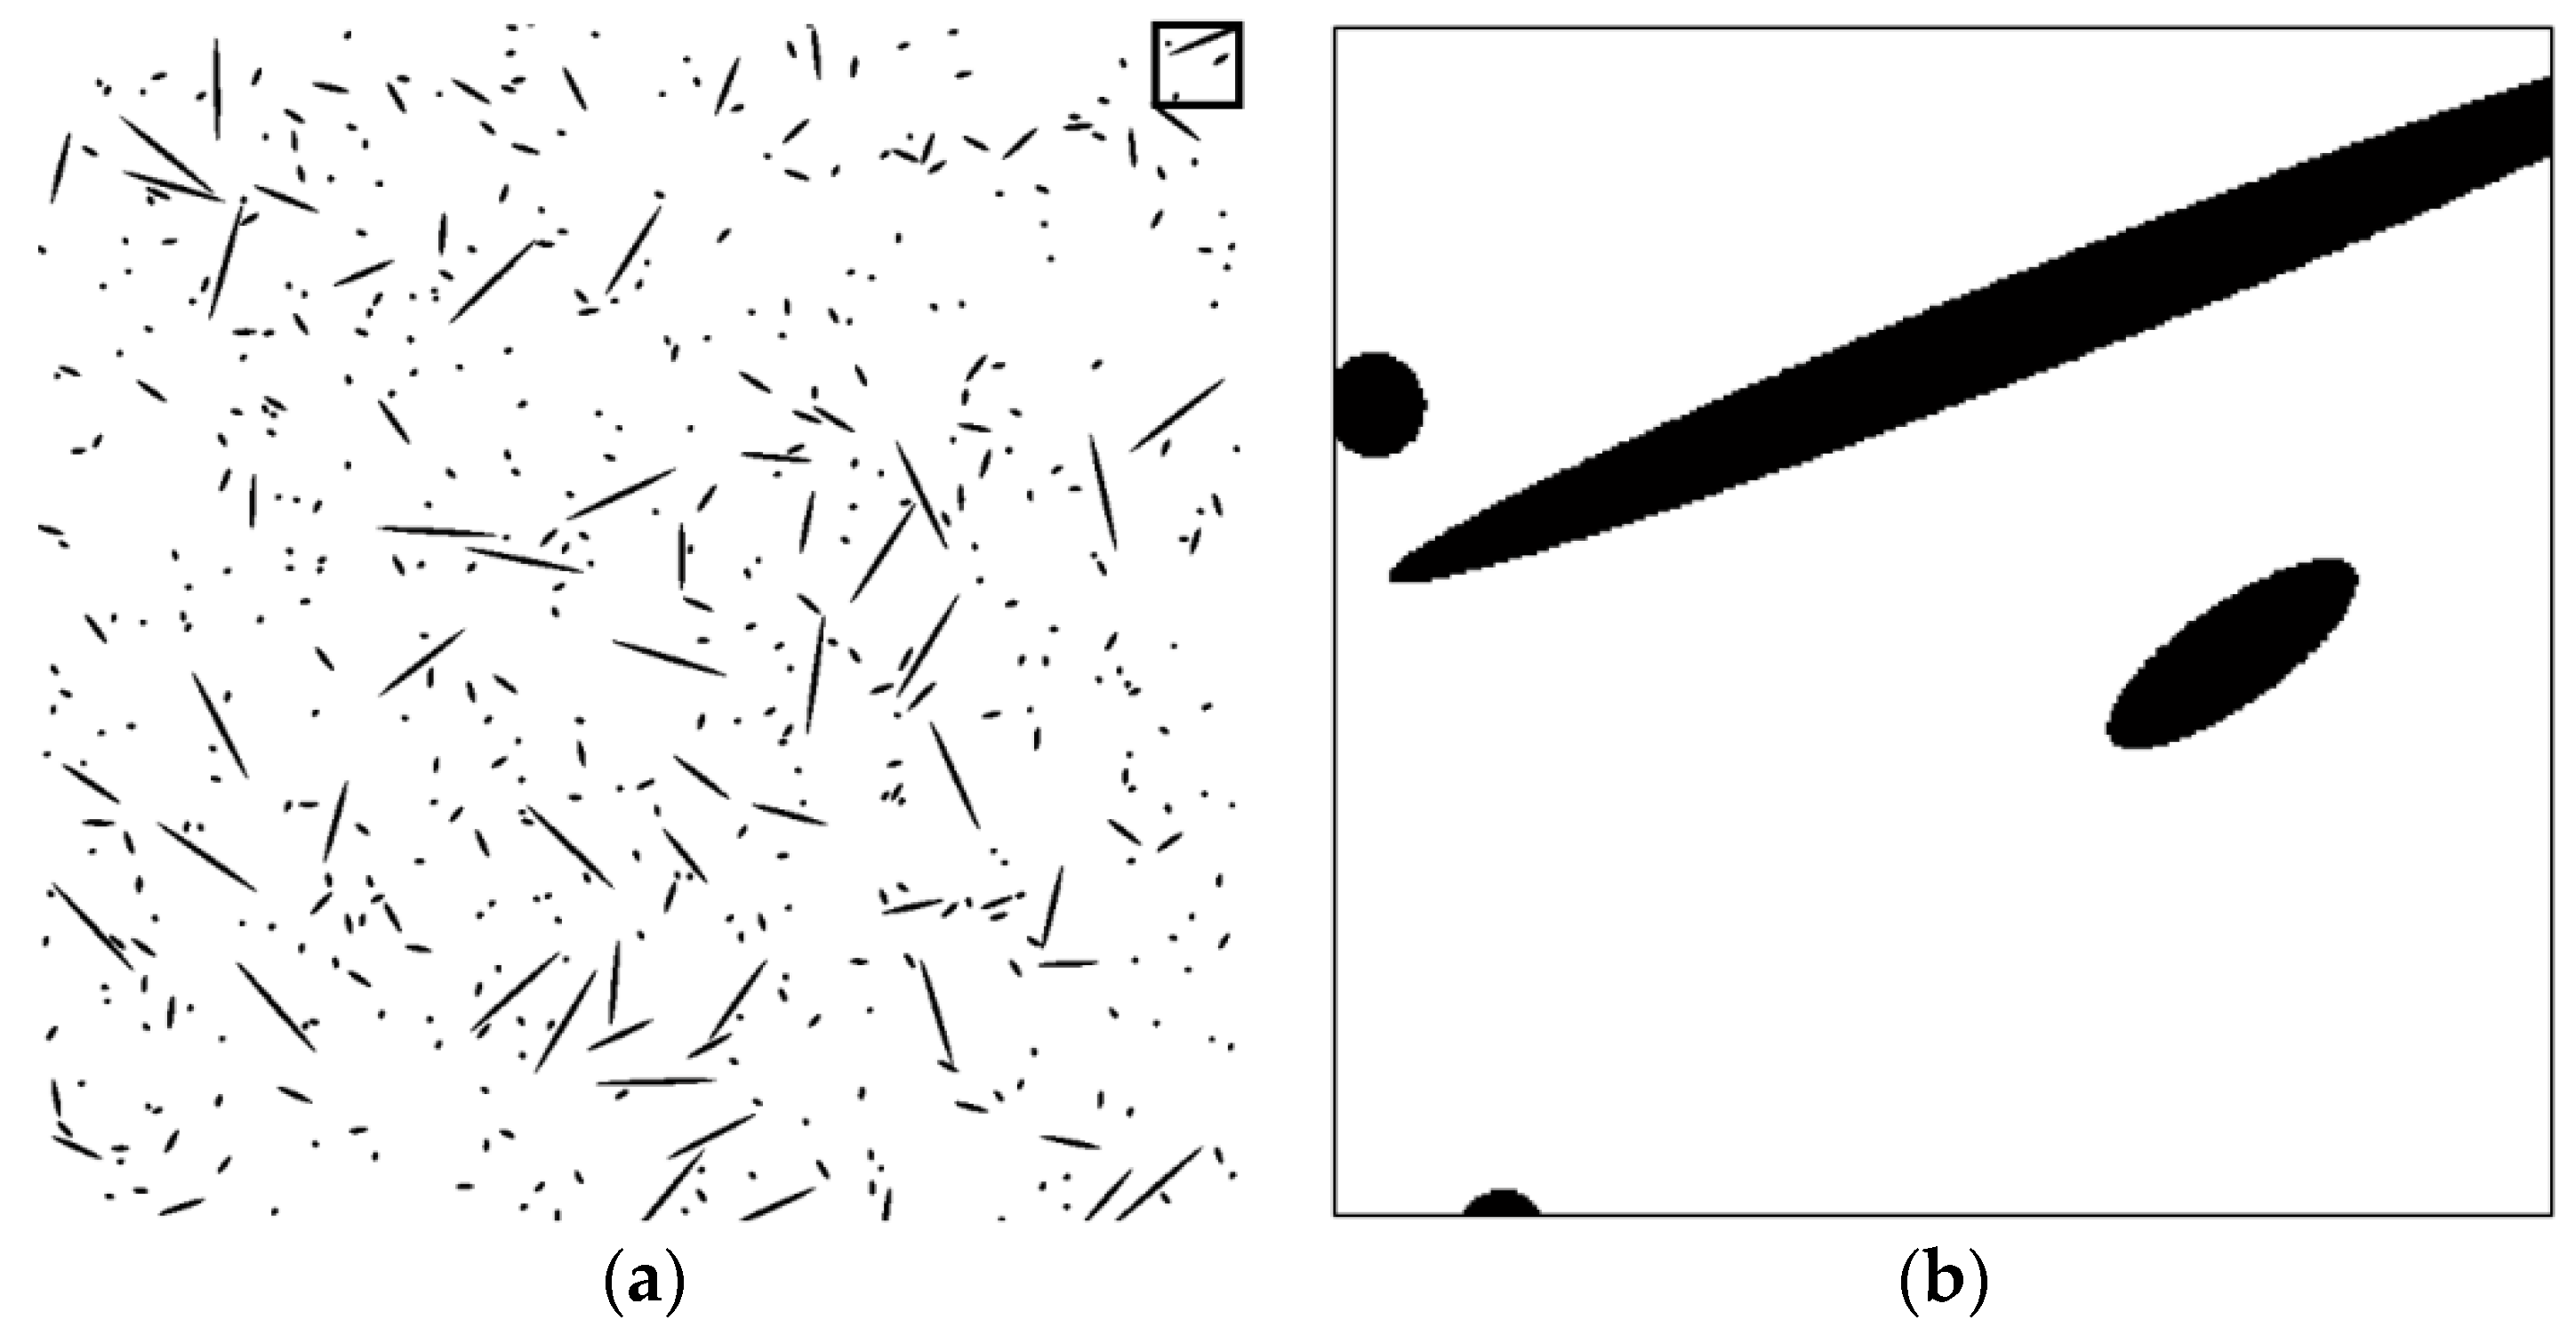
3. Image Analysis for Enhancing the Evaluation Accuracy of the Fiber Orientation Distribution
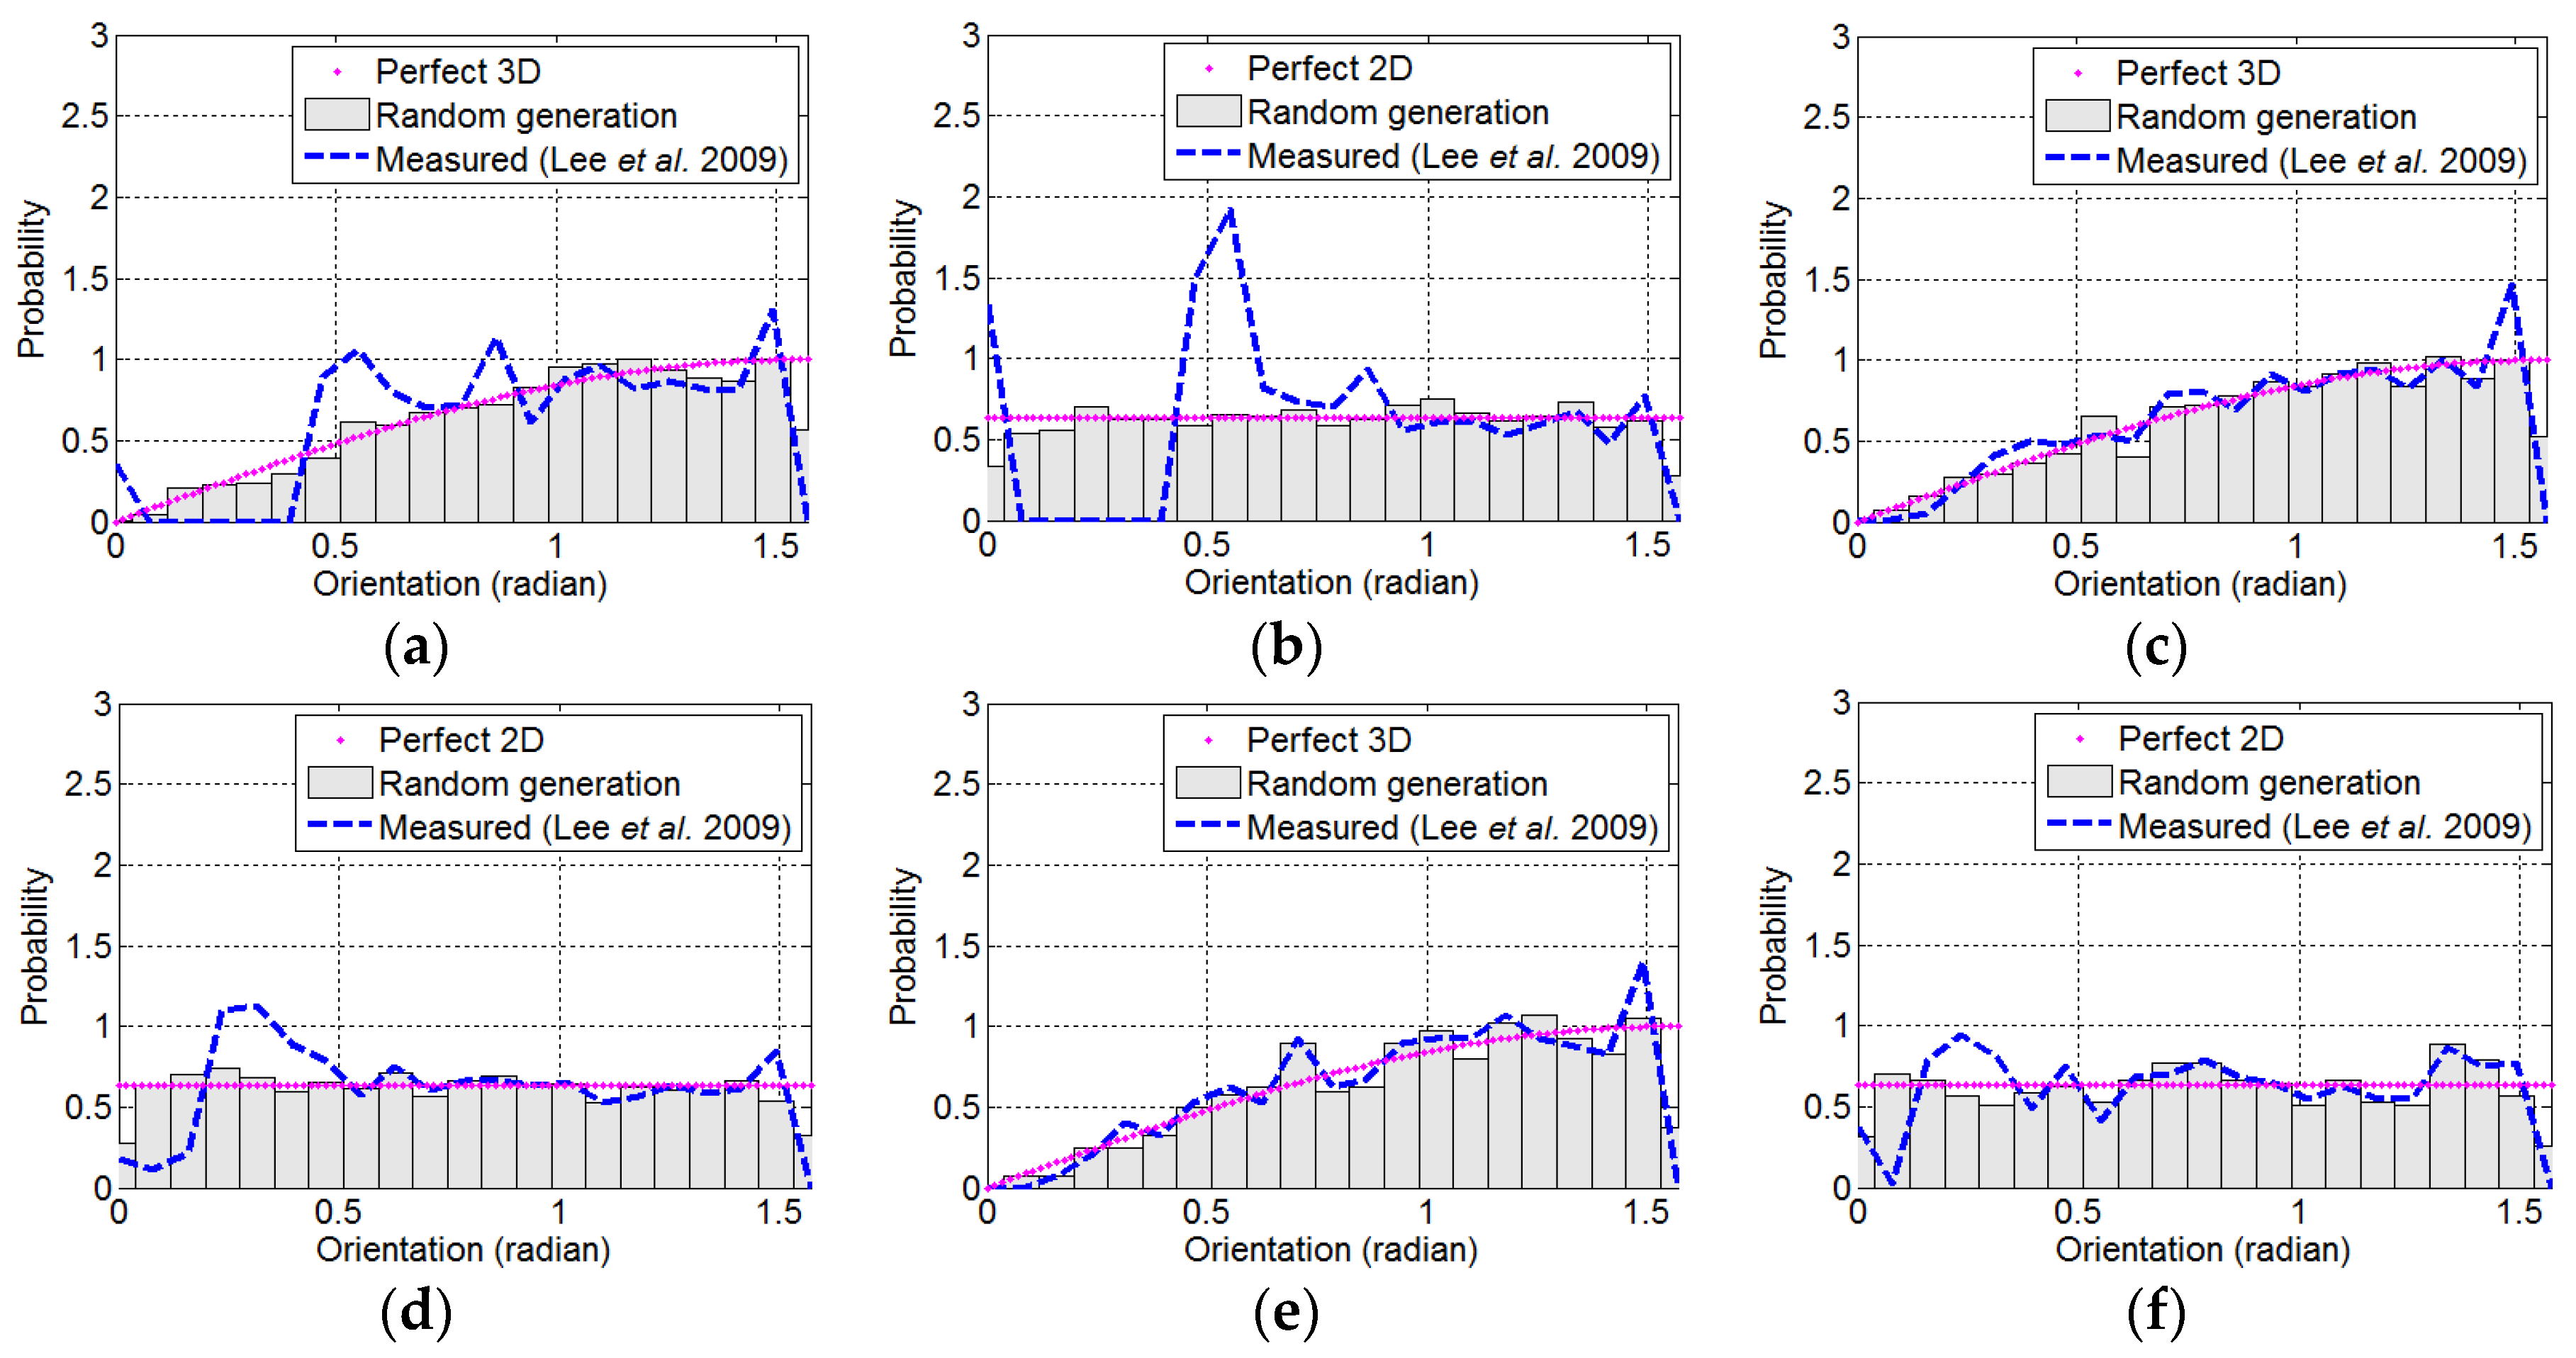
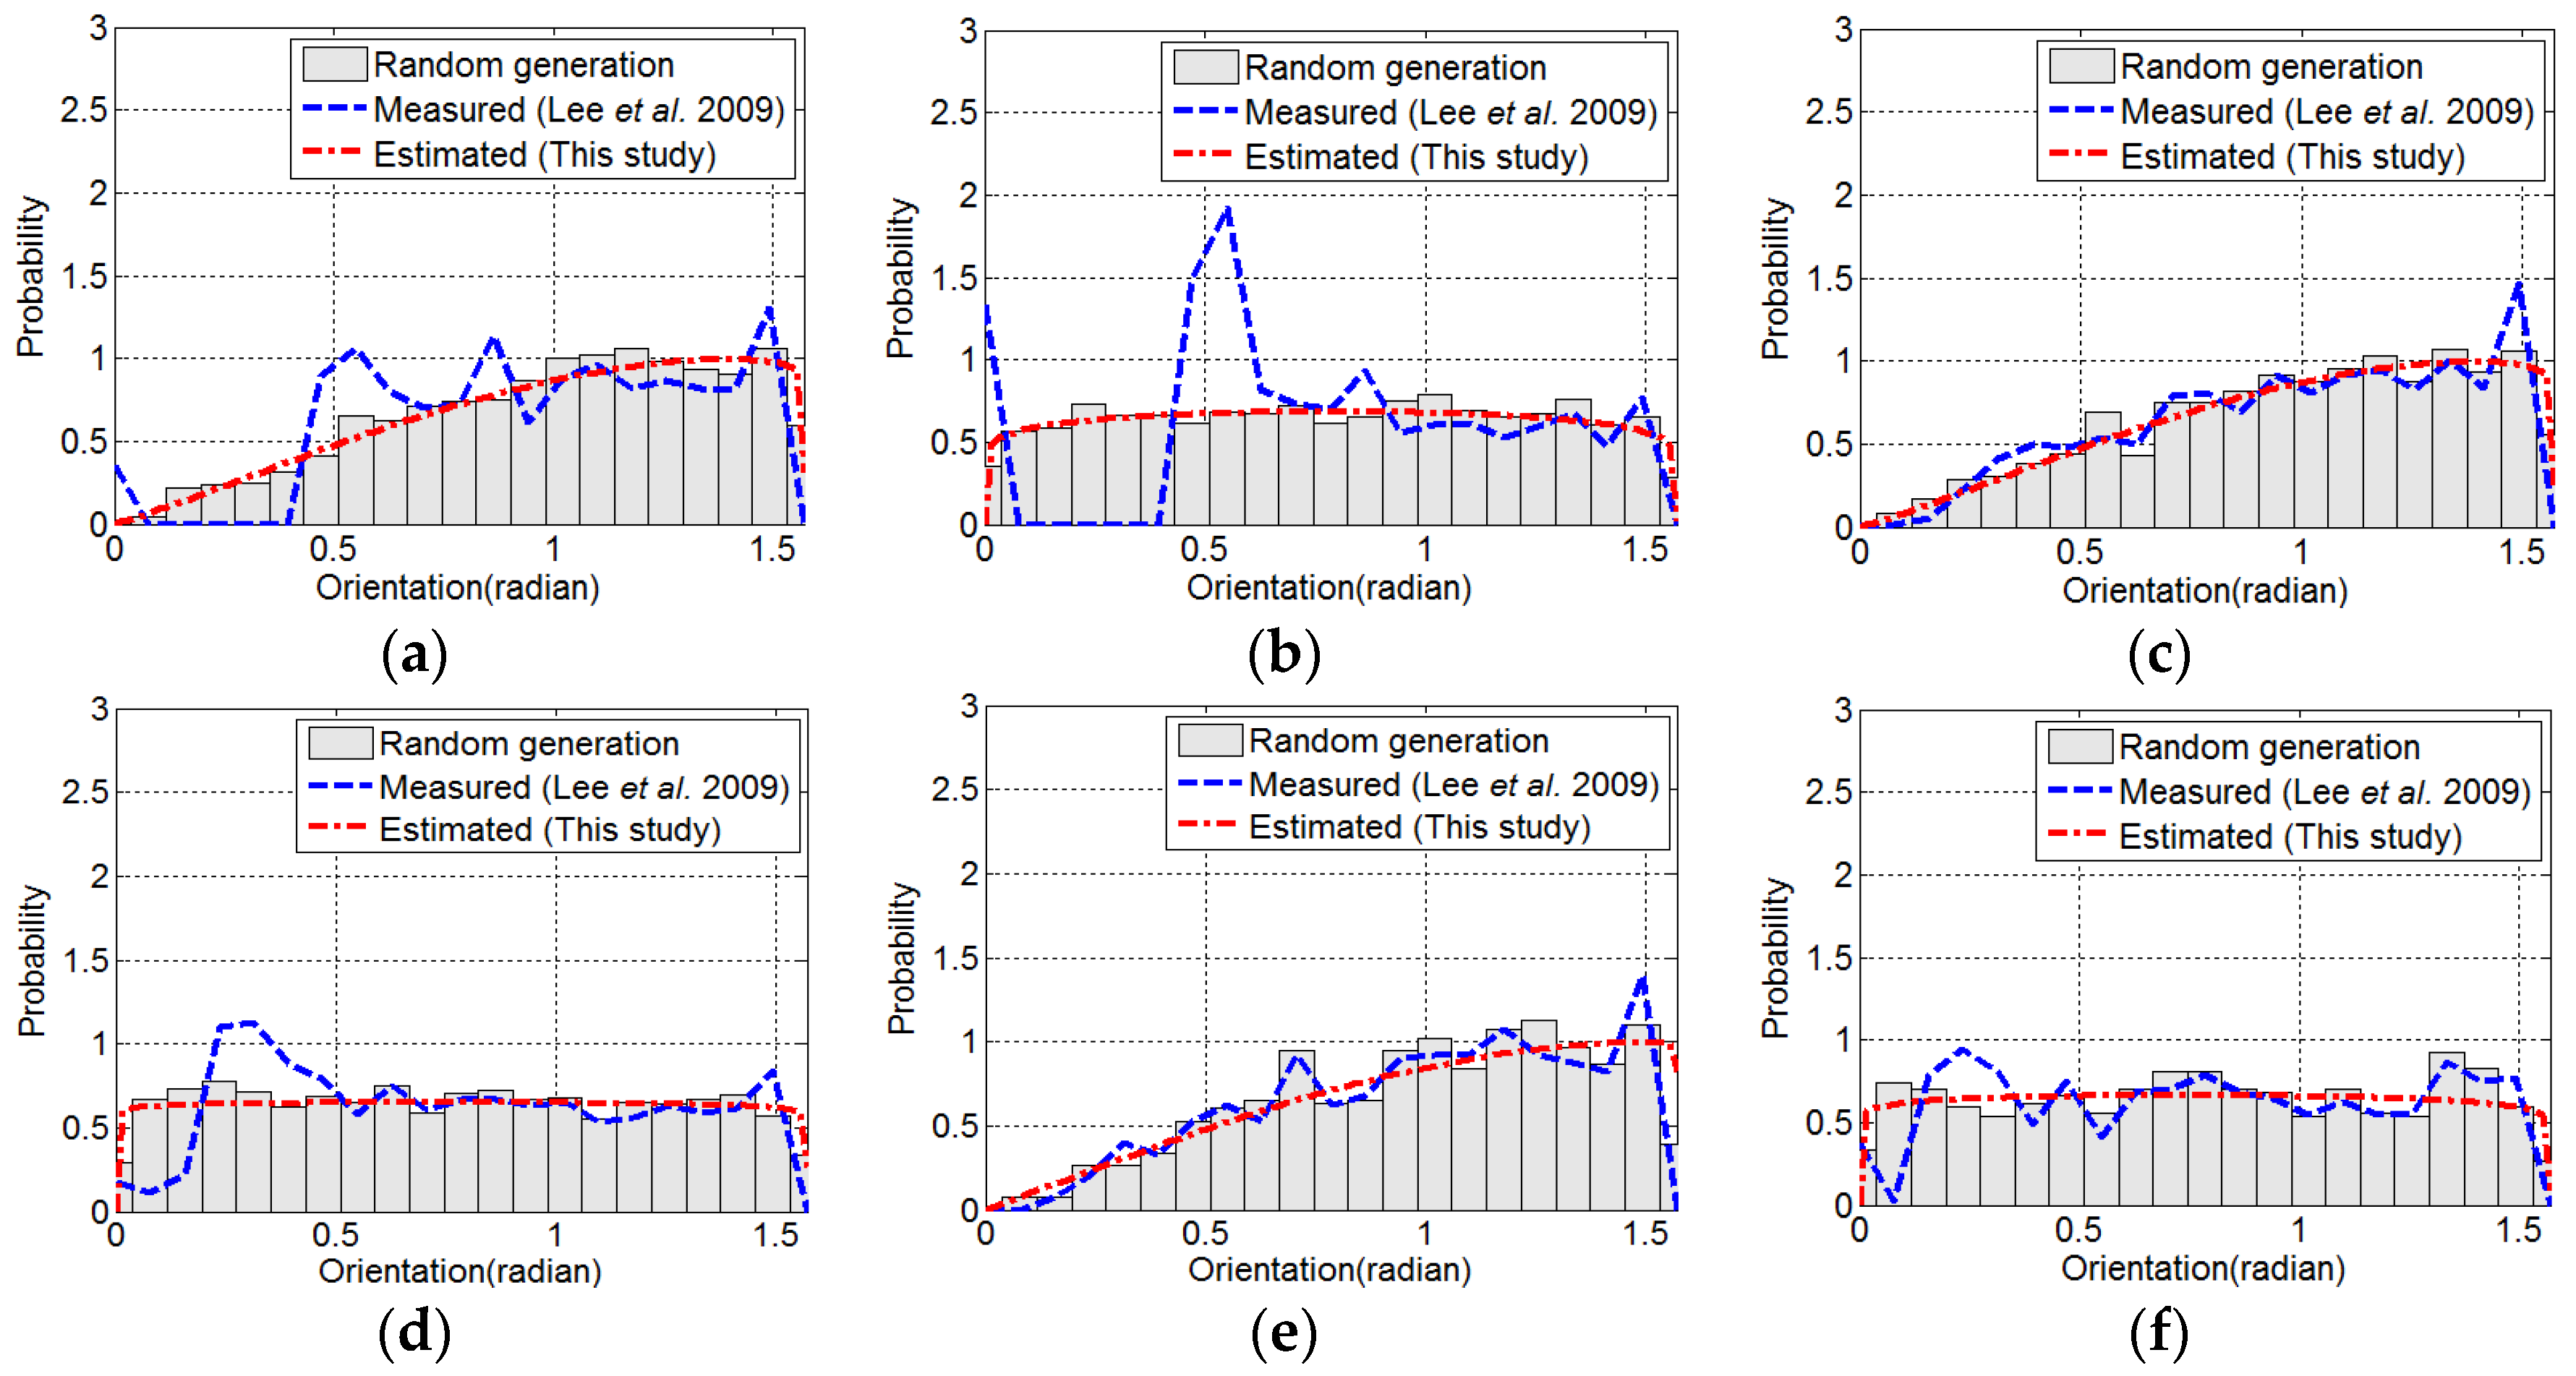
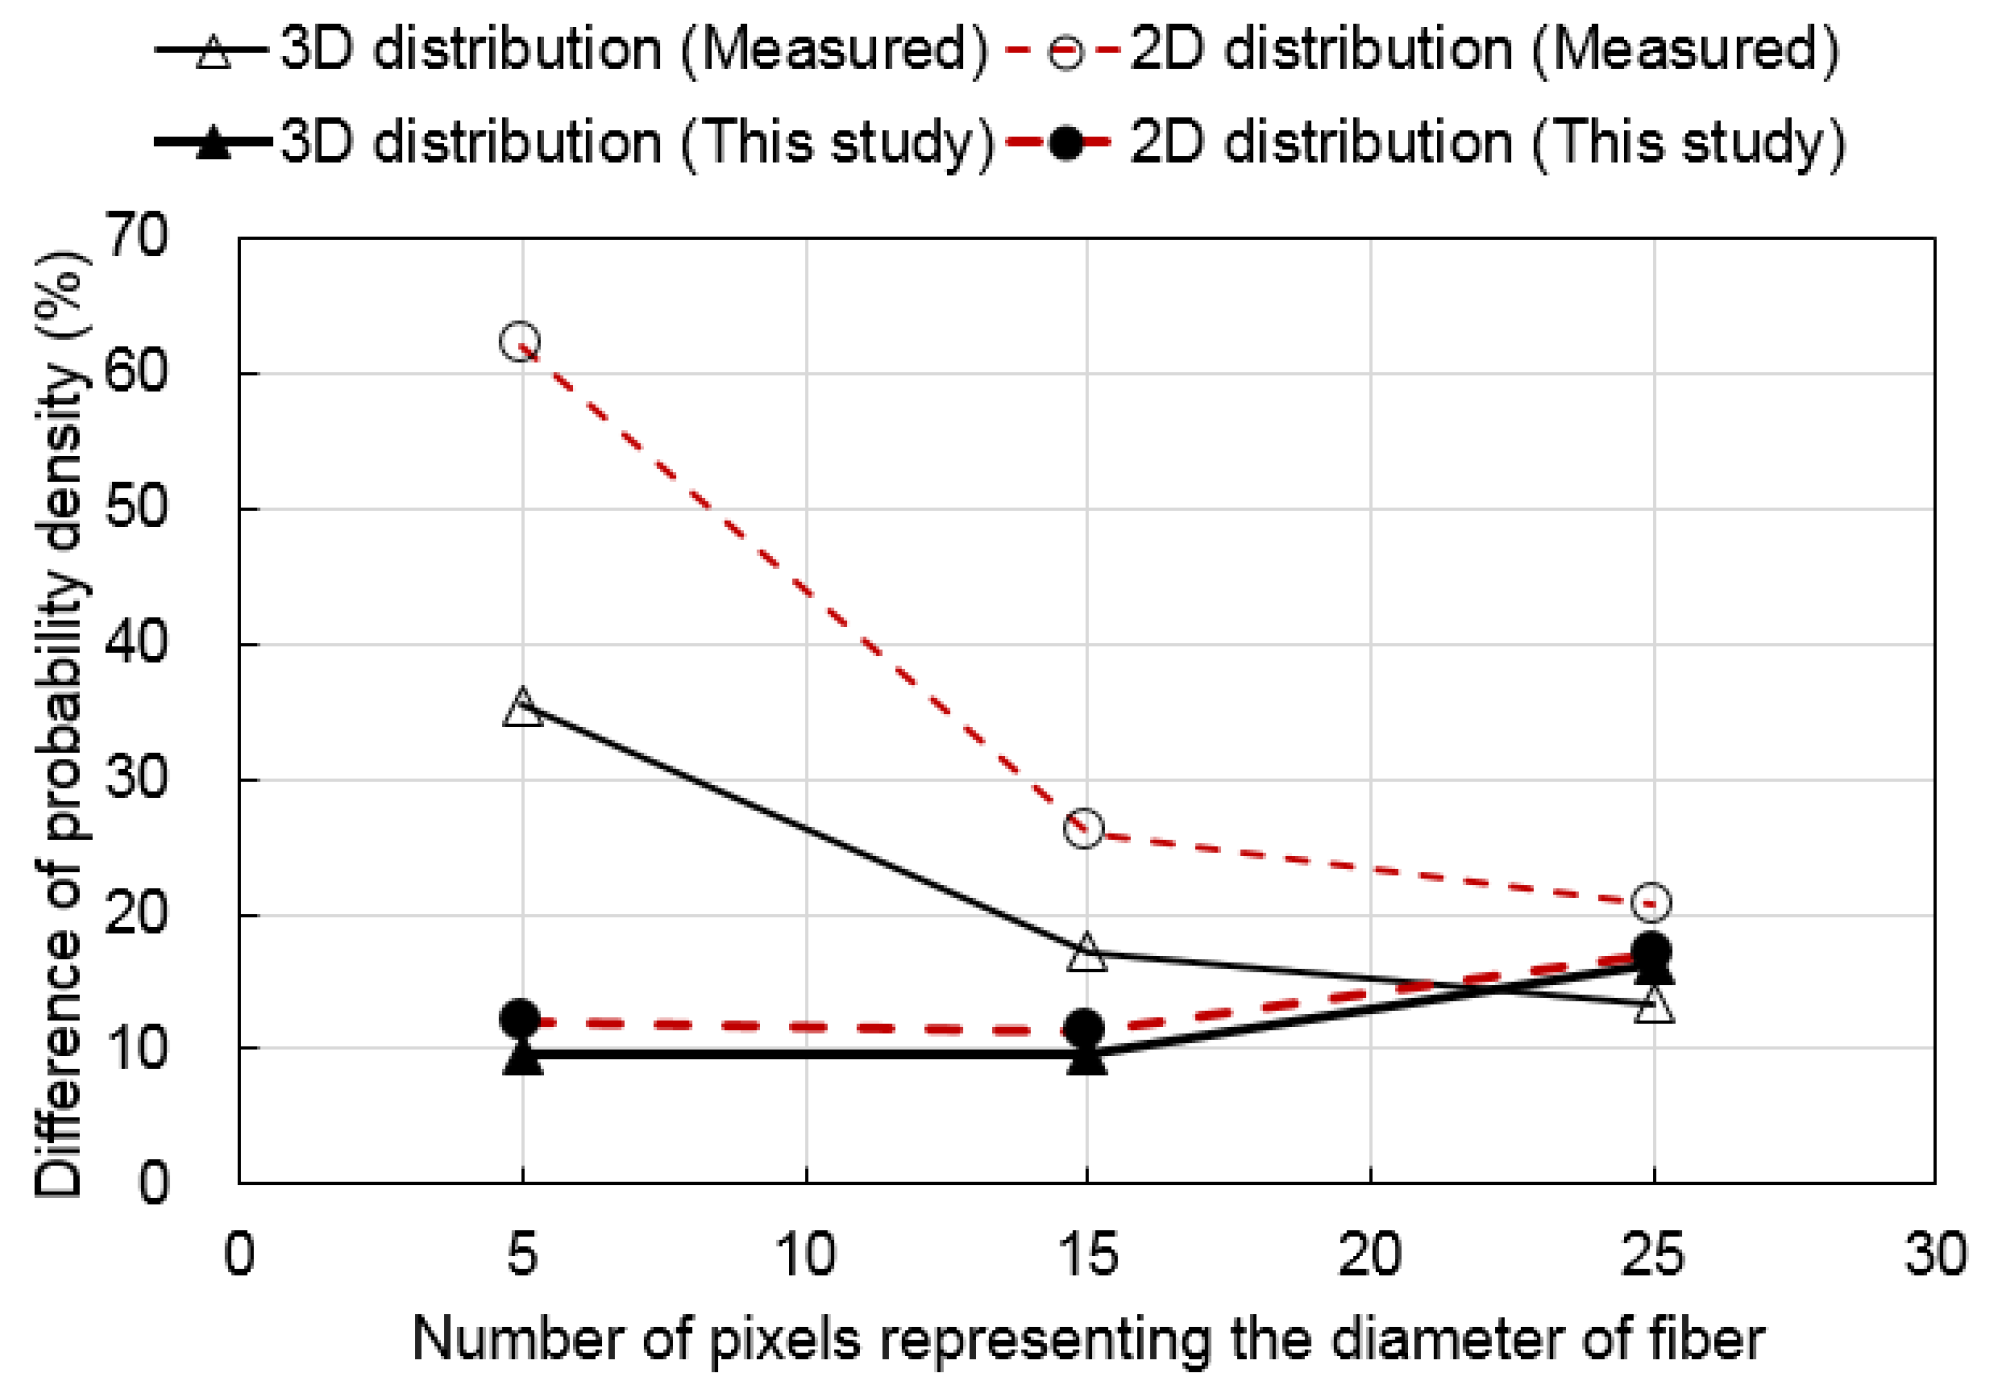
4. Validation of the Proposed Technique
| Image ID | Number of Pixels in the Diameter of the Fiber | Area (Pixel2) | Dimension of the Fiber Orientation Distribution | Number of Fibers |
|---|---|---|---|---|
| I05-3 | 5 | 2000 × 2000 | 3 | 2038 |
| I05-2 | 2 | 2594 | ||
| I15-3 | 15 | 6000 × 6000 | 3 | 2038 |
| I15-2 | 2 | 2594 | ||
| I25-3 | 25 | 5000 × 5000 | 3 | 510 |
| I25-2 | 2 | 649 |


5. Conclusions
Acknowledgments
Author Contributions
Conflicts of Interest
References
- Romualdi, J.P.; Batson, G.B. Mechanics of crack arrest in concrete. J. Eng. Mech. Division 1963, 89, 147–168. [Google Scholar]
- American Concrete Institute (ACI) Committee. 544.1r-96: Report on Fiber Reinforced Concrete; ACI: Farmington, MI, USA, 1996. [Google Scholar]
- Li, V.C. Tailoring ECC for special attributes: A review. Int. J. Concr. Struct. Mater. 2012, 6, 135–144. [Google Scholar] [CrossRef]
- Dupont, D.; Vandewalle, L. Distribution of steel fibres in rectangular sections. Cem. Concr. Compos. 2005, 27, 391–398. [Google Scholar] [CrossRef]
- Jain, L.; Wetherhold, R. Effect of fiber orientation on the fracture toughness of brittle matrix composites. Acta Metall. Mater. 1992, 40, 1135–1143. [Google Scholar] [CrossRef]
- Kwon, S.H.; Kang, S.-T.; Lee, B.Y.; Kim, J.-K. The variation of flow-dependent tensile behavior in radial flow dominant placing of ultra high performance fiber reinforced cementitious composites (UHPFRCC). Constr. Build. Mater. 2012, 33, 109–121. [Google Scholar] [CrossRef]
- Lee, B.Y.; Kim, J.K.; Kim, Y.Y. Prediction of ecc tensile stress-strain curves based on modified fiber bridging relations considering fiber distribution characteristics. Comput Concr. 2010, 7, 455–468. [Google Scholar] [CrossRef]
- Lee, B.Y.; Kim, J.-K.; Kim, J.-S.; Kim, Y.Y. Quantitative evaluation technique of polyvinyl alcohol (pva) fiber dispersion in engineered cementitious composites. Cem. Concr. Compos. 2009, 31, 408–417. [Google Scholar] [CrossRef]
- Tosun-Felekoğlu, K.; Felekoğlu, B.; Ranade, R.; Lee, B.Y.; Li, V.C. The role of flaw size and fiber distribution on tensile ductility of PVA-ECC. Compos. B Eng. 2014, 56, 536–545. [Google Scholar] [CrossRef]
- Zerbino, R.; Tobes, J.; Bossio, M.; Giaccio, G. On the orientation of fibres in structural members fabricated with self compacting fibre reinforced concrete. Cem. Concr. Compos. 2012, 34, 191–200. [Google Scholar] [CrossRef]
- Mobasher, B.; Stang, H.; Shah, S. Microcracking in fiber reinforced concrete. Cem. Concr. Res. 1990, 20, 665–676. [Google Scholar] [CrossRef]
- Poitou, A.; Chinesta, F.; Bernier, G. Orienting fibers by extrusion in reinforced reactive powder concrete. J. Eng. Mech. 2001, 127, 593–598. [Google Scholar] [CrossRef]
- Kang, S.T.; Lee, B.Y.; Kim, J.-K.; Kim, Y.Y. The effect of fibre distribution characteristics on the flexural strength of steel fibre-reinforced ultra high strength concrete. Constr. Build. Mater. 2011, 25, 2450–2457. [Google Scholar] [CrossRef]
- Krenchel, H. Fibre Reinforcement; Akademisk Forlag: Copenhagen, Denmark, 1964. [Google Scholar]
- Aveston, J.; Kelly, A. Theory of multiple fracture of fibrous composites. J. Mater. Sci. 1973, 8, 352–362. [Google Scholar] [CrossRef]
- Laws, V. The efficiency of fibrous reinforcement of brittle matrices. J. Phys. D Appl. Phys. 1971, 4, 1737. [Google Scholar] [CrossRef]
- Li, V.C. Postcrack scaling relations for fiber reinforced cementitious composites. J. Mater. Civ. Eng. 1992, 4, 41–57. [Google Scholar] [CrossRef]
- Morton, J.; Groves, G. The effect of metal wires on the fracture of a brittle-matrix composite. J. Mater. Sci. 1976, 11, 617–622. [Google Scholar] [CrossRef]
- Redon, C.; Li, V.C.; Wu, C.; Hoshiro, H.; Saito, T.; Ogawa, A. Measuring and modifying interface properties of pva fibers in ECC matrix. J. Mater. Civ. Eng. 2001, 13, 399–406. [Google Scholar] [CrossRef]
- Lin, Z.; Kanda, T.; Li, V.C. On interface property characterization and performance of fiber reinforced cementitious composites. Concr. Sci. Eng. 1999, 1, 173–184. [Google Scholar]
- Eik, M.; Herrmann, H. Raytraced images for testing the reconstruction of fibre orientation distributions. Proc. Est. Acad. Sci. 2012, 61, 128–136. [Google Scholar] [CrossRef]
- Guild, F.J.; Summerscales, J. Microstructural image analysis applied to fibre composite materials: A review. Composites 1993, 24, 383–393. [Google Scholar] [CrossRef]
- Liu, J.; Sun, W.; Miao, C.; Liu, J.; Li, C. Assessment of fiber distribution in steel fiber mortar using image analysis. J. Wuhan Univ. Technol. Mater. Sci. Ed. 2012, 27, 166–171. [Google Scholar] [CrossRef]
- Mlekusch, B. Fibre orientation in short-fibre-reinforced thermoplastics ii. Quantitative measurements by image analysis. Compos. Sci. Technol. 1999, 59, 547–560. [Google Scholar] [CrossRef]
- Mlekusch, B.; Lehner, E.A.; Geymayer, W. Fibre orientation in short-fibre-reinforced thermoplastics i. Contrast enhancement for image analysis. Compos. Sci. Technol. 1999, 59, 543–545. [Google Scholar] [CrossRef]
- Sebaibi, N.; Benzerzour, M.; Abriak, N.E. Influence of the distribution and orientation of fibres in a reinforced concrete with waste fibres and powders. Constr. Build. Mater. 2014, 65, 254–263. [Google Scholar] [CrossRef]
- Benson, S.D.; Karihaloo, B.L. CARDIFRC: Manufacture and constitutive behaviour. In Proceedings of the International Symposium Dedicated to Professor Surendra Shah, Dundee, Scotland, UK, 3–4 September 2003; pp. 233–244.
- Bordelon, A.C.; Roesler, J.R. Spatial distribution of synthetic fibers in concrete with X-ray computed tomography. Cem. Concr. Compos. 2014, 53, 35–43. [Google Scholar] [CrossRef]
- Pujadas, P.; Blanco, A.; Cavalaro, S.; de la Fuente, A.; Aguado, A. Fibre distribution in macro-plastic fibre reinforced concrete slab-panels. Constr. Build. Mater. 2014, 64, 496–503. [Google Scholar] [CrossRef]
- Stähli, P.; Custer, R.; van Mier, J.G. On flow properties, fibre distribution, fibre orientation and flexural behaviour of FRC. Mater. Struct. 2008, 41, 189–196. [Google Scholar] [CrossRef]
- Stroeven, P. Morphometry of fibre reinforced cementitious materials. Matér. Constr. 1979, 12, 9–20. [Google Scholar] [CrossRef]
- Chung, D. Dispersion of short fibers in cement. J. Mater. Civ. Eng. 2005, 17, 379–383. [Google Scholar] [CrossRef]
- Ozyurt, N.; Woo, L.Y.; Mason, T.O.; Shah, S.P. Monitoring fiber dispersion in fiber-reinforced cementitious materials: Comparison of ac-impedance spectroscopy and image analysis. ACI Mater. J. 2006, 103, 340–347. [Google Scholar]
- Lee, B.Y.; Kim, T.; Kim, Y.Y. Fluorescence characteristic analysis for discriminating fibers in cementitious composites. J. Adv. Concr. Technol. 2010, 8, 337–344. [Google Scholar]
- Eberhardt, C.; Clarke, A.; Vincent, M.; Giroud, T.; Flouret, S. Fibre-orientation measurements in short-glass-fibre composites—II: A quantitative error estimate of the 2d image analysis technique. Compos. Sci. Technol. 2001, 61, 1961–1974. [Google Scholar] [CrossRef]
- Otsu, N. A threshold selection method from gray-level histograms. Automatica 1975, 11, 23–27. [Google Scholar]
- Vincent, L. Morphological grayscale reconstruction in image analysis: Applications and efficient algorithms. IEEE Trans. Image Process. 1993, 2, 176–201. [Google Scholar] [CrossRef] [PubMed]
- Vincent, L.; Soille, P. Watersheds in digital spaces: An efficient algorithm based on immersion simulations. IEEE Trans. Pattern Anal. Mach. Intell. 1991, 6, 583–598. [Google Scholar] [CrossRef]
- Choi, J.-I.; Lee, B.Y. Bonding properties of basalt fiber and strength reduction according to fiber orientation. Materials 2015, 8, 6719–6727. [Google Scholar] [CrossRef]
- Lee, B.Y.; Cho, C.G.; Lim, H.-J.; Song, J.-K.; Yang, K.-H.; Li, V.C. Strain hardening fiber reinforced alkali-activated mortar—A feasibility study. Constr. Build. Mater. 2012, 37, 15–20. [Google Scholar] [CrossRef]
- Park, S.H.; Kim, D.J.; Ryu, G.S.; Koh, K.T. Tensile behavior of ultra high performance hybrid fiber reinforced concrete. Cem. Concr. Compos. 2012, 34, 172–184. [Google Scholar] [CrossRef]
- Xia, M.; Hamada, H.; Maekawa, Z. Flexural stiffness of injection molded glass fiber reinforced thermoplastics. Int. Polym. Process. 1995, 10, 74–81. [Google Scholar] [CrossRef]
- Golberg, D.E. Genetic Algorithms in Search, Optimization, and Machine Learning; Addison-Wesley: Boston, MA, USA, 1989. [Google Scholar]
- Haupt, R.L.; Haupt, S.E. Practical Genetic Algorithms, 2nd ed.; John Wiley & Sons, Inc.: Hoboken, NJ, USA, 2004. [Google Scholar]
- Lee, B.Y.; Kim, J.H.; Kim, J.K. Optimum concrete mixture proportion based on a database considering regional characteristics. J. Comput. Civil. Eng. 2009, 23, 258–265. [Google Scholar] [CrossRef]
© 2016 by the authors; licensee MDPI, Basel, Switzerland. This article is an open access article distributed under the terms and conditions of the Creative Commons by Attribution (CC-BY) license (http://creativecommons.org/licenses/by/4.0/).
Share and Cite
Lee, B.Y.; Kang, S.-T.; Yun, H.-B.; Kim, Y.Y. Improved Sectional Image Analysis Technique for Evaluating Fiber Orientations in Fiber-Reinforced Cement-Based Materials. Materials 2016, 9, 42. https://doi.org/10.3390/ma9010042
Lee BY, Kang S-T, Yun H-B, Kim YY. Improved Sectional Image Analysis Technique for Evaluating Fiber Orientations in Fiber-Reinforced Cement-Based Materials. Materials. 2016; 9(1):42. https://doi.org/10.3390/ma9010042
Chicago/Turabian StyleLee, Bang Yeon, Su-Tae Kang, Hae-Bum Yun, and Yun Yong Kim. 2016. "Improved Sectional Image Analysis Technique for Evaluating Fiber Orientations in Fiber-Reinforced Cement-Based Materials" Materials 9, no. 1: 42. https://doi.org/10.3390/ma9010042