2.1. Synthesis of ZrO2 Particles
The synthesis of a ZrO
2 colloidal solution is the first step towards the formation of YSZ ceramics via the interparticle route. As described in the experimental section, zirconium oxynitrate is selected as precursor. When it’s dissolved in water, a cyclic tetramer is formed, [Zr
4(OH)
8(OH
2)
16]
8+, in which Zr atoms are eightfold coordinated by four OH– groups and four water molecules [
26]. The tetramer complexes play an important role in the formation of ZrO
2 nanoparticles, by heating the aqueous solution, the tetramer complexes will deprotonate as shown in Equation (1) [
27]:
As illustrated by Matsui
et al. [
27], the deprotonated tetramer starts to polymerise and when supersaturation of these polymeric species occurs, nuclei are formed. Finally, agglomeration occurs and secondary particles are formed consisting out of several primary particles.
Microwave hydrothermal treatment of solution A at different reaction temperatures and times resulted in ZrO
2 suspensions with a variety of particle sizes (
Table 1.). Synthesis at temperatures above 160 °C resulted in precipitation. These precipitates could also be found in synthesis procedures that took longer than 5 min at 160 °C. Several washing steps are introduced to purify the synthesised colloidal systems for further characterisation.
Table 1.
Overview of microwave treated solution A where the temperature and duration of the synthesis are represented in function of the particle size and crystallinity.
Table 1.
Overview of microwave treated solution A where the temperature and duration of the synthesis are represented in function of the particle size and crystallinity.
| Temperature (°C) | Duration (min) | Particles size [a] (nm) | Crystalline | Present phase | Crystallite size (nm) |
|---|
| 140 | 5 | 37 | No | – | – |
| 140 | 60 | 47 | Yes | Monoclinic ZrO2 | 3.13 ± 0.11 |
| 150 | 5 | 45 | Yes | Monoclinic ZrO2 | 2.64 ± 0.11 |
| 150 | 30 | 52 | Yes | Monoclinic ZrO2 | 3.37 ± 0.10 |
| 160 | 5 | 50 | Yes | Monoclinic ZrO2 | 3.35 ± 0.10 |
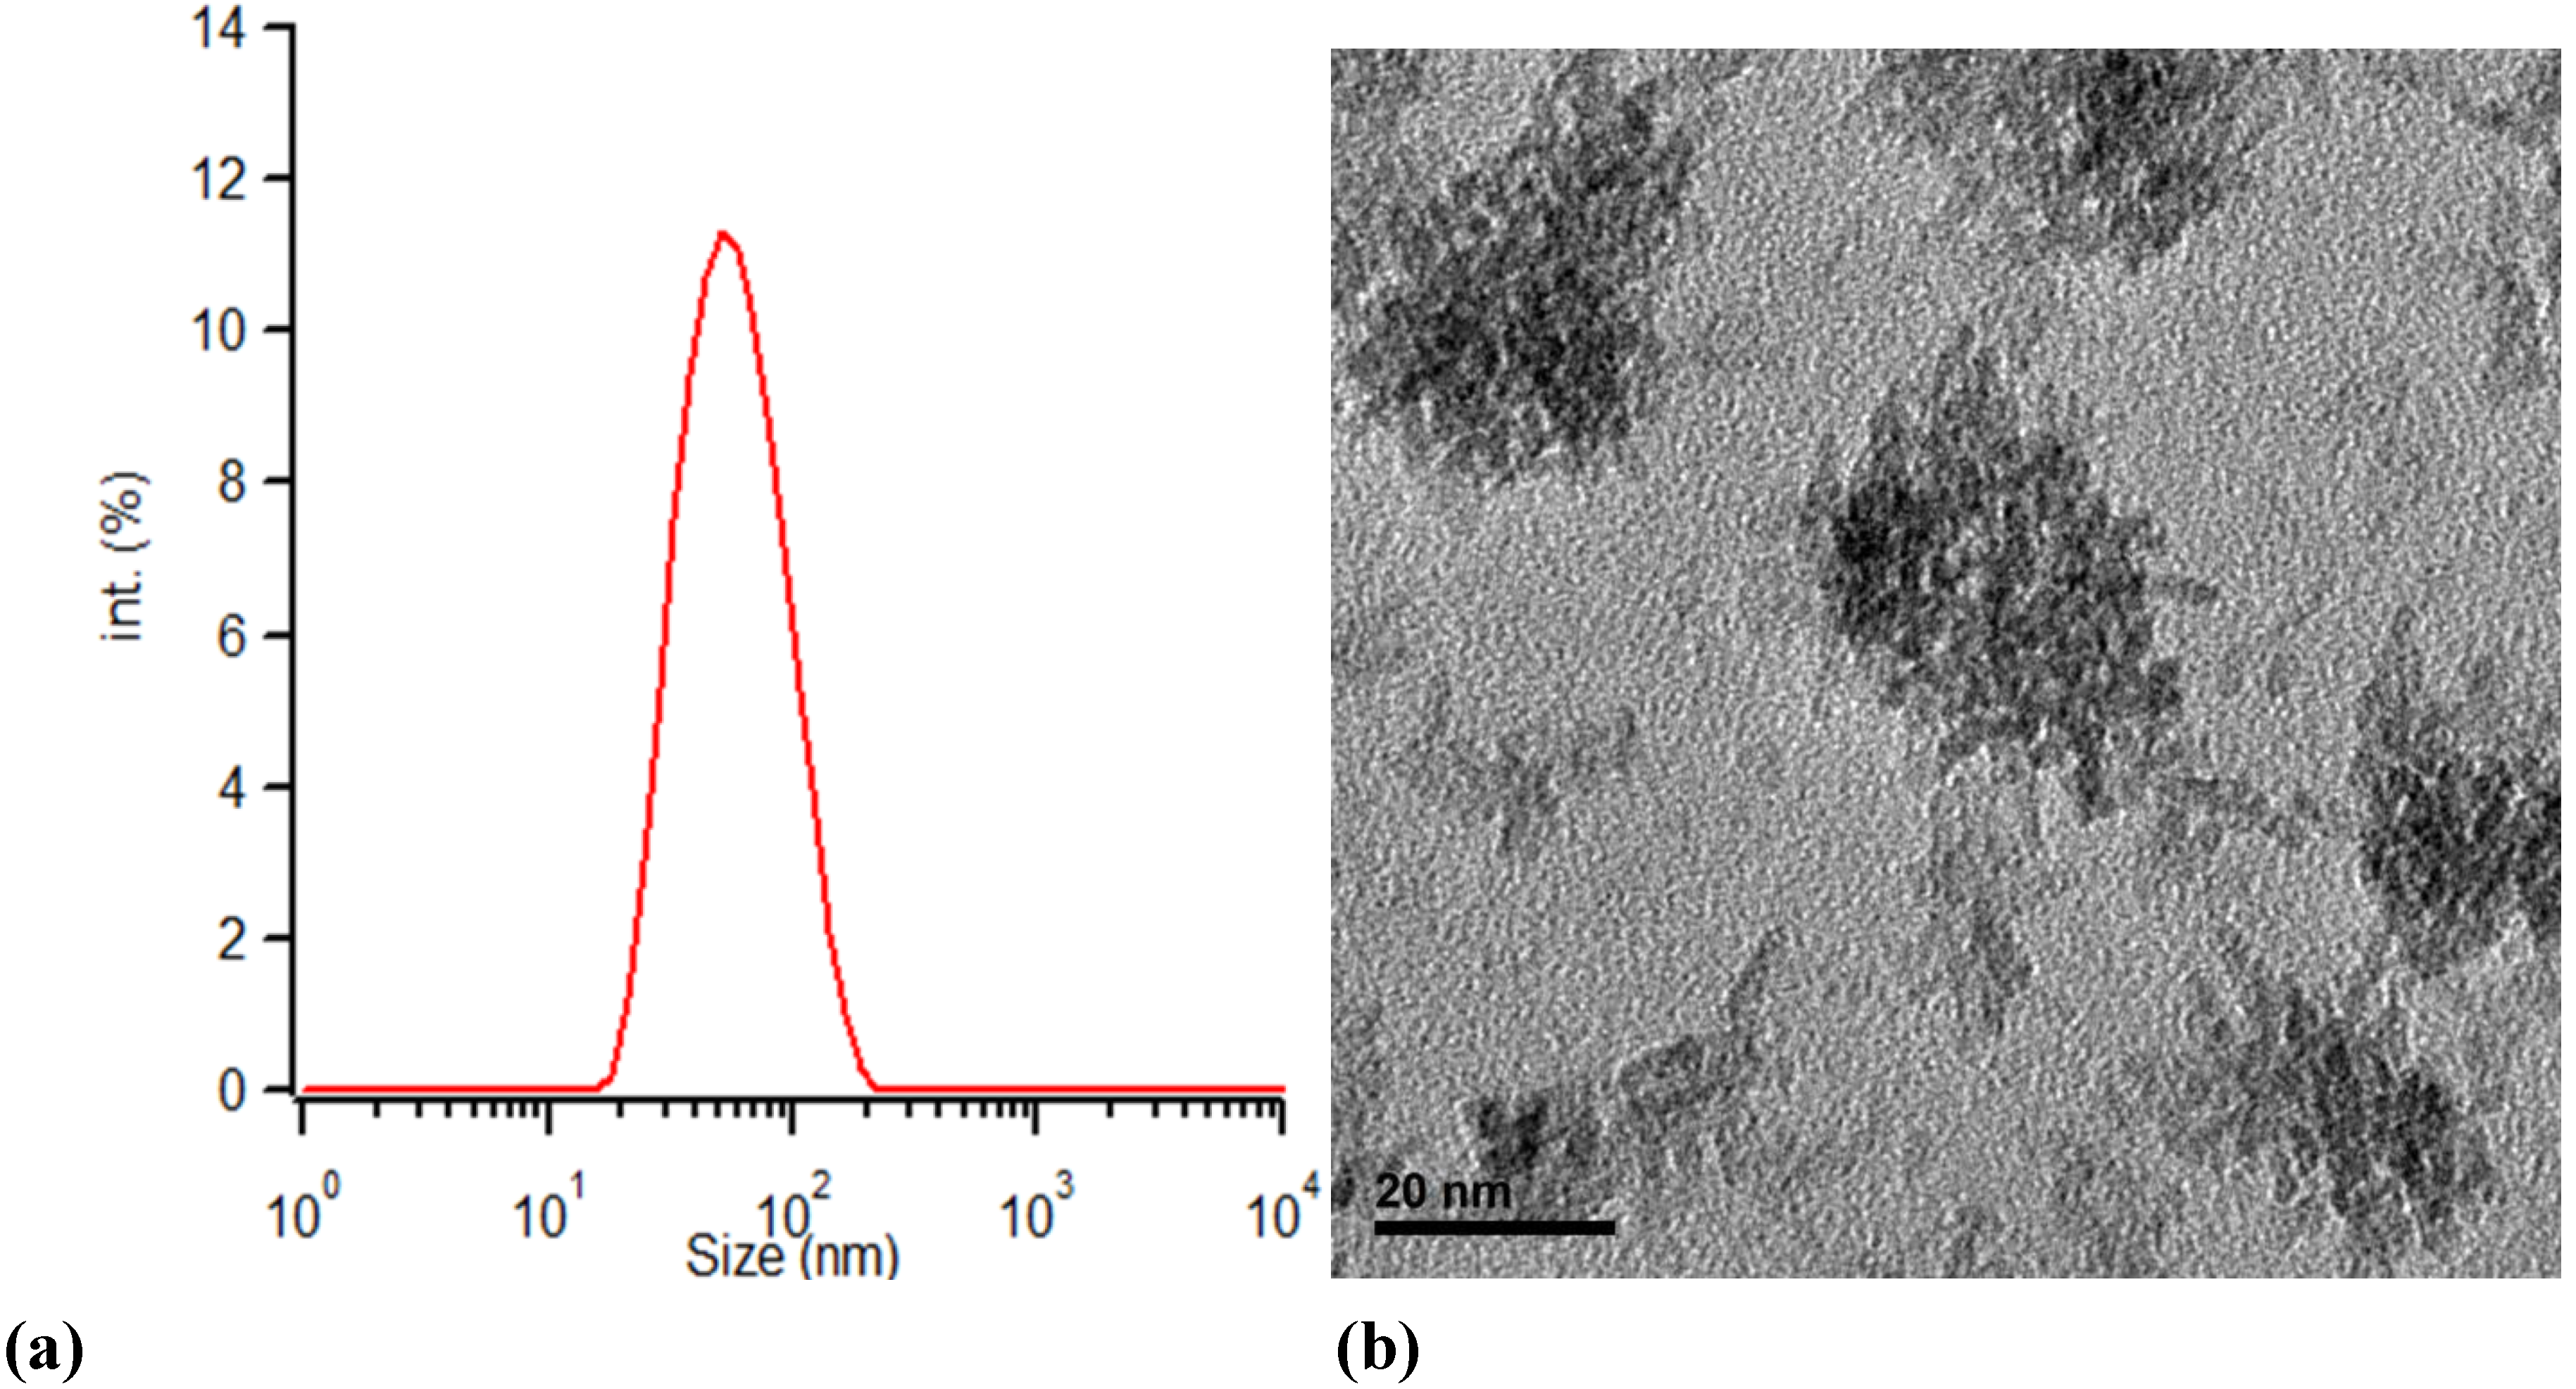
As illustrated in
Figure 1, TEM and DLS measurements of a sample synthesized at 150 °C for 30 min agree about the particles size considering that TEM measurements show the real particle size while DLS measures the hydrodynamic radius of the particles, the synthesized particles meet the expectations of Matsui
et al. [
27]. The primary particles aggregate and form secondary particles of 50 nm diameter. The primary particles are rod shaped while the secondary structures have irregular shapes.
Figure 1.
(a) The particle size of ZrO2 particles synthesized by microwave treatment of solution A at 150 °C for 30 min measured by DLS; and (b) TEM micrograph of the solution A treated for 30 min at 150 °C.
Figure 1.
(a) The particle size of ZrO2 particles synthesized by microwave treatment of solution A at 150 °C for 30 min measured by DLS; and (b) TEM micrograph of the solution A treated for 30 min at 150 °C.
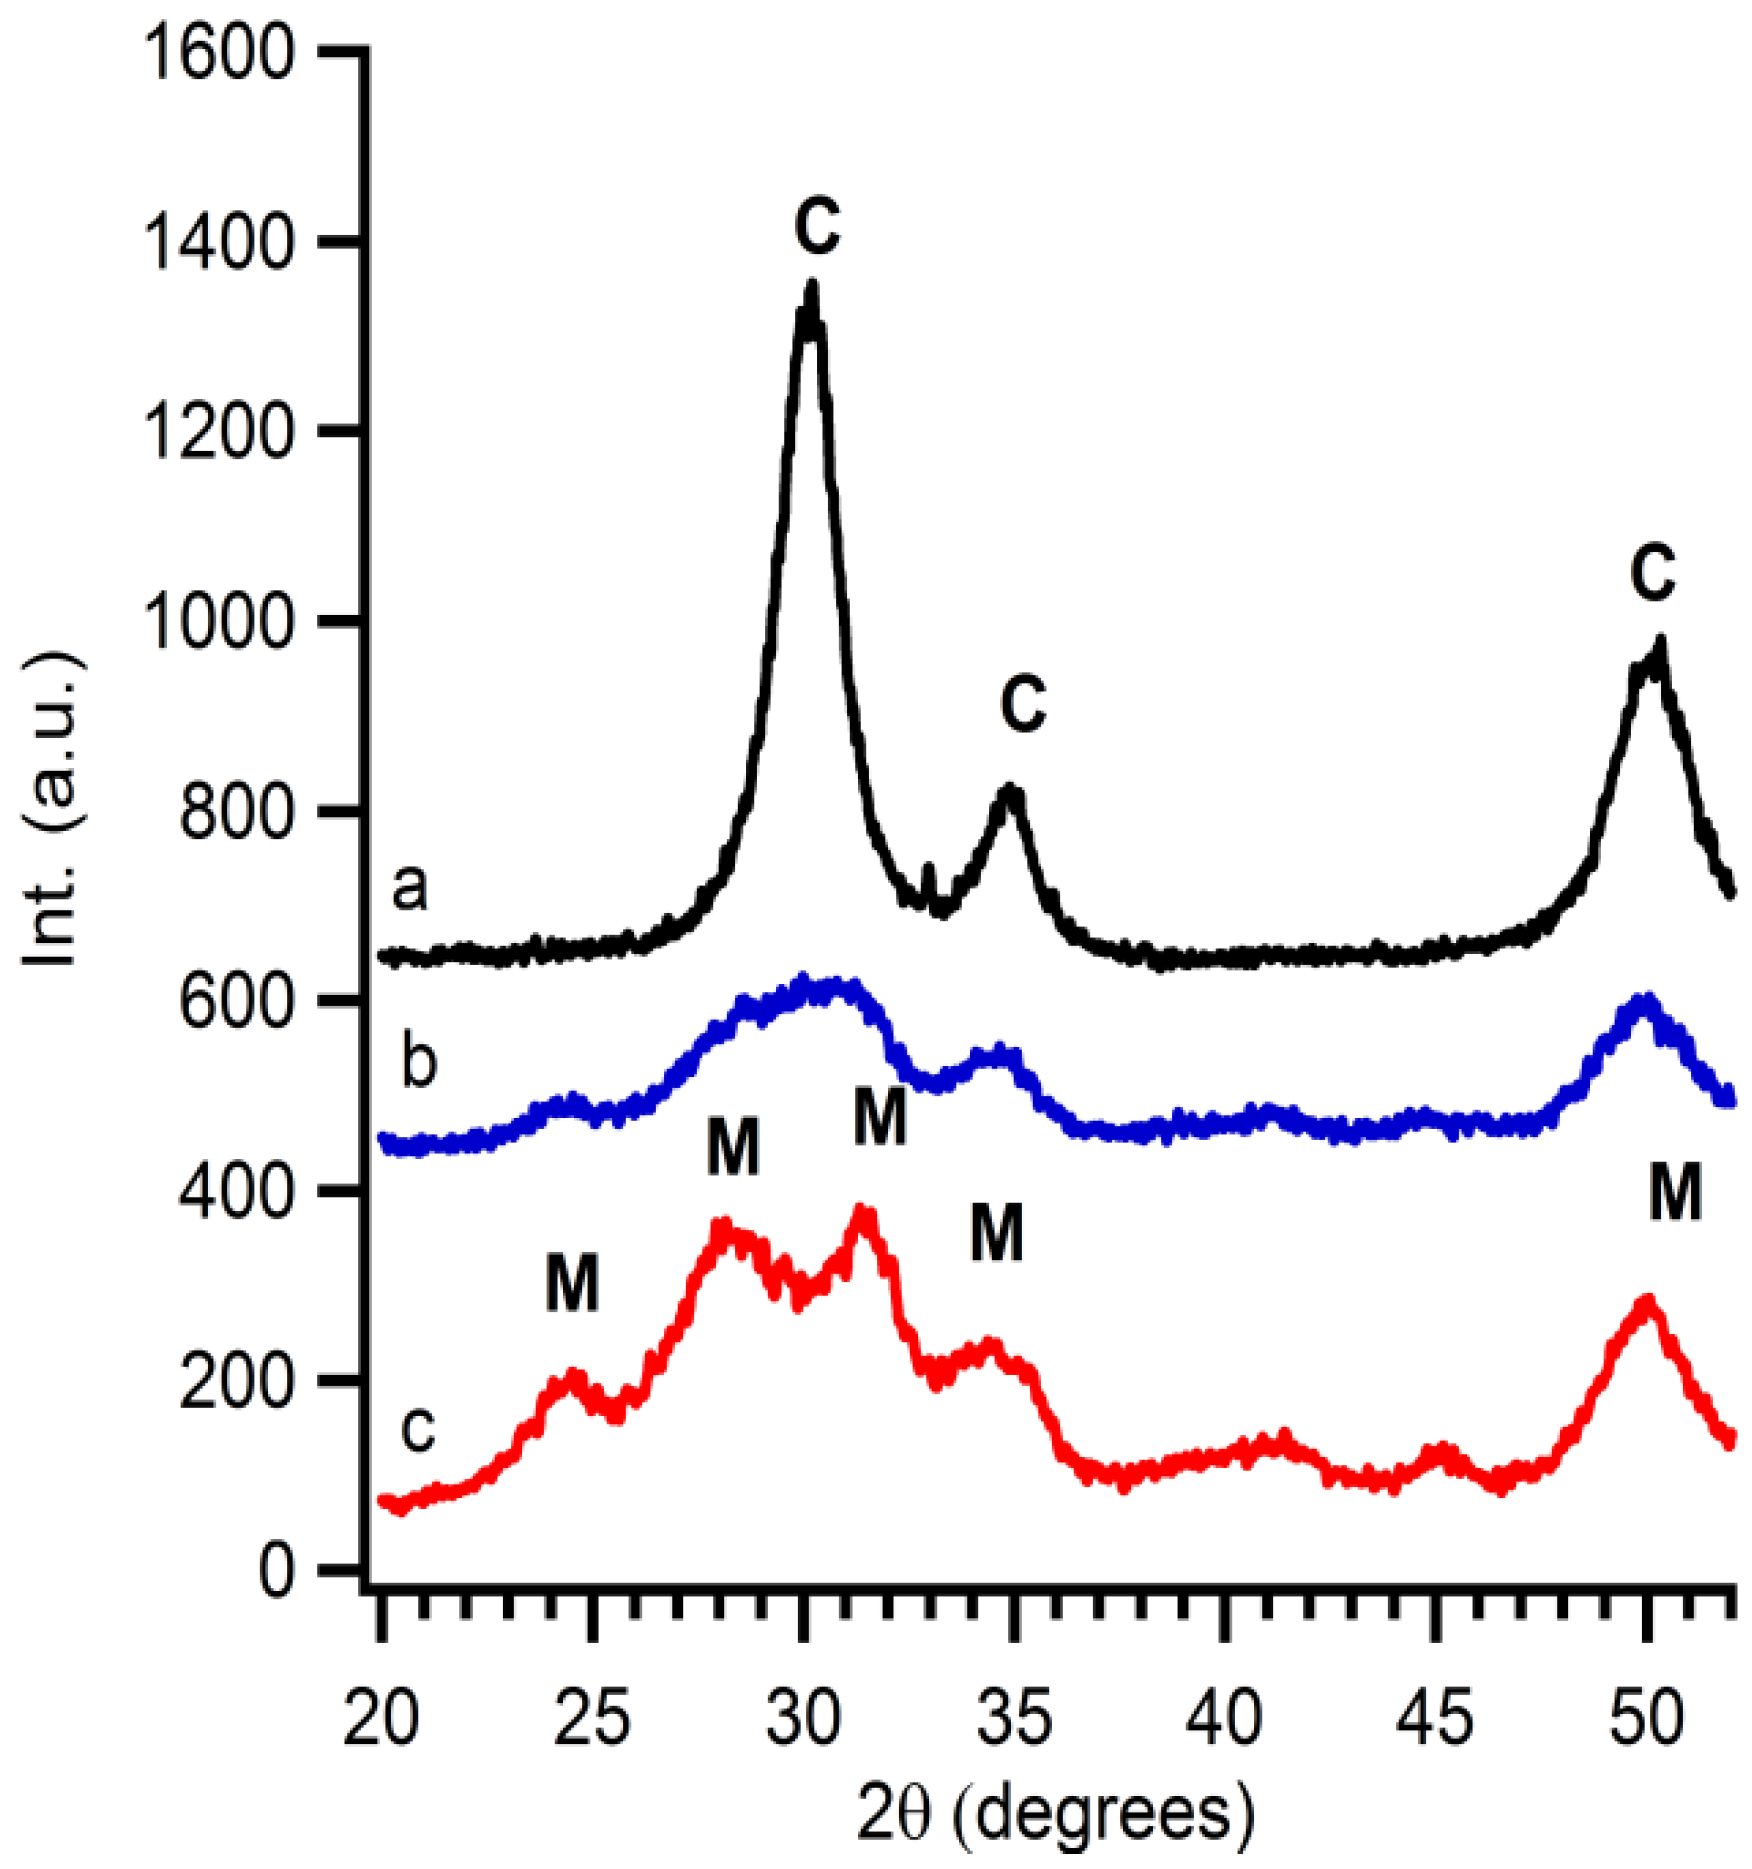
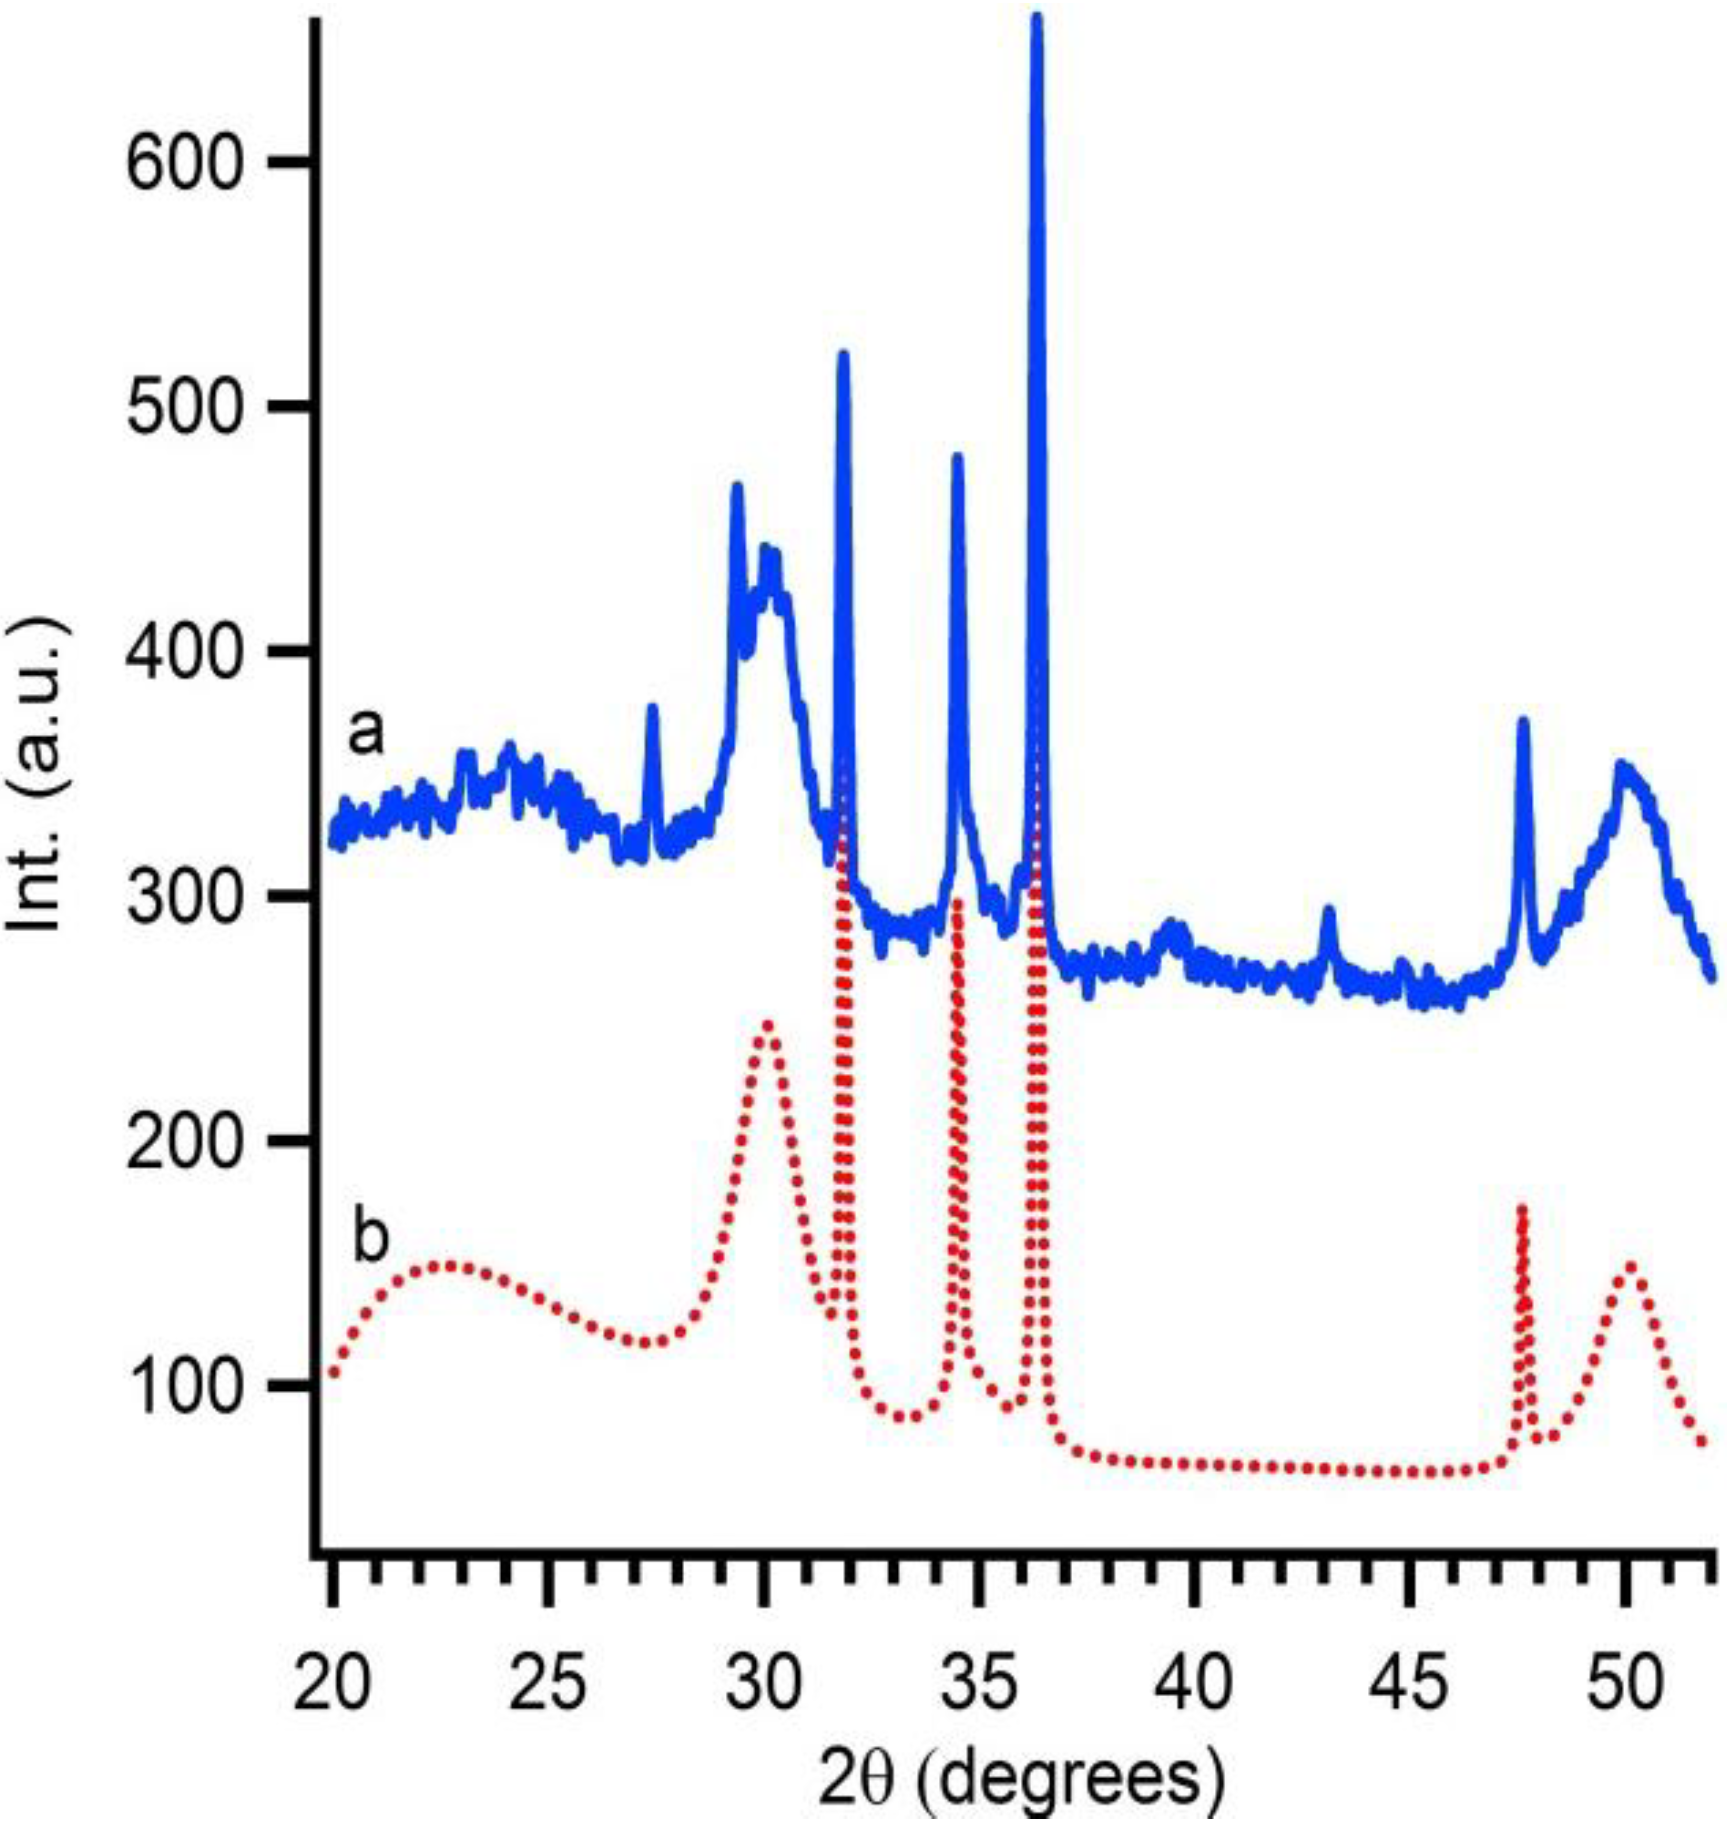
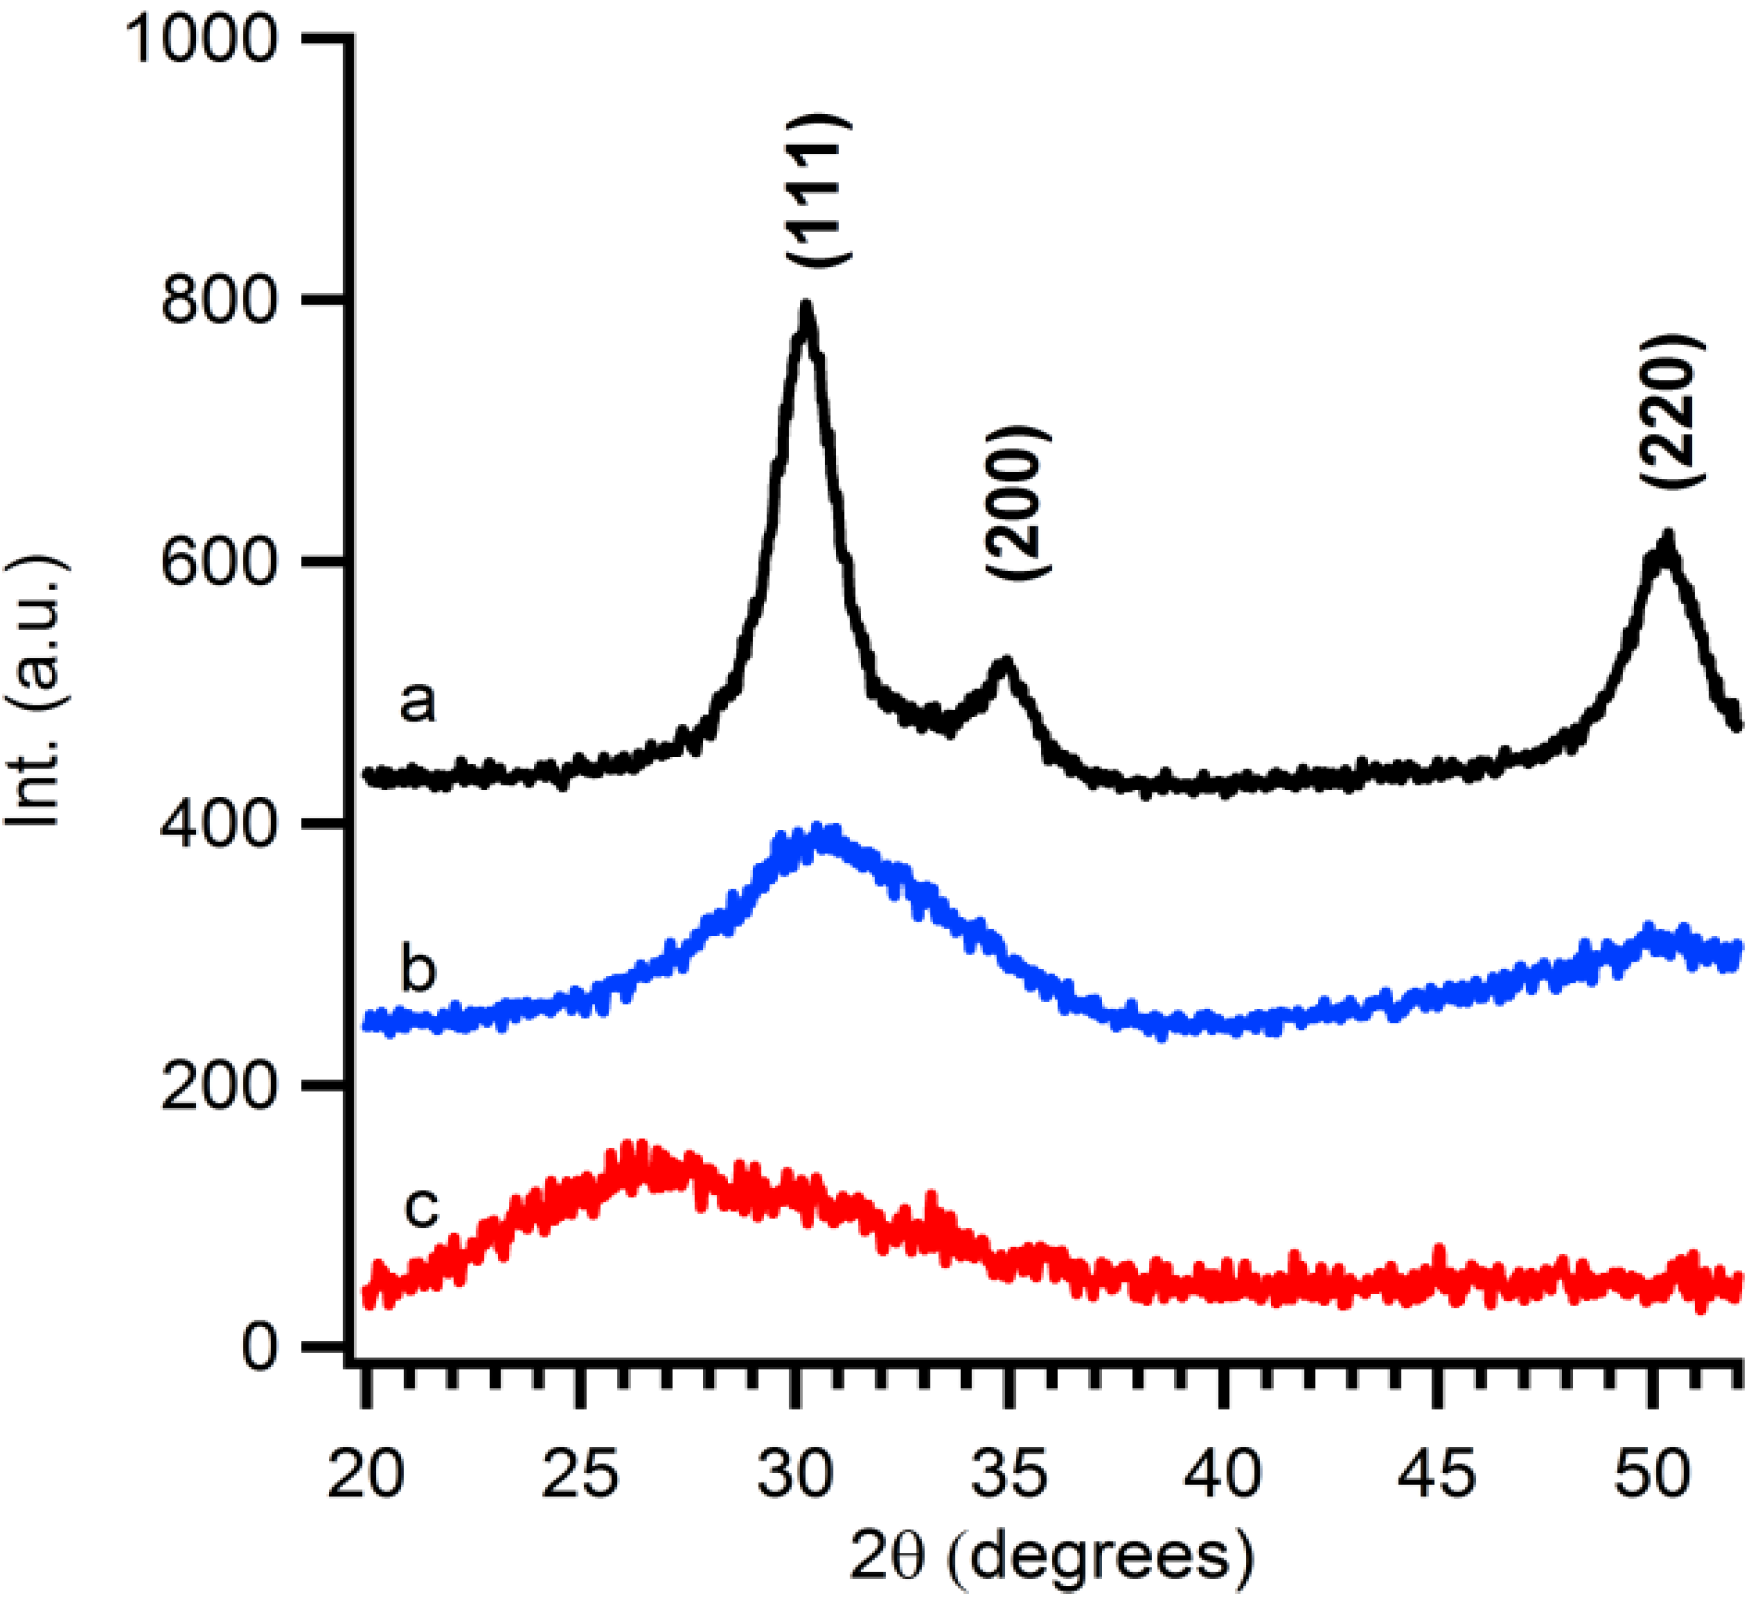
X-ray diffraction patterns are taken from purified particles which are precipitated and dried for 12 hours at 60 °C. The observed reflections show the presence of Baddeleyite (monoclinic ZrO
2), pdf card # 36-0420. As shown in
Figure 2, the crystallinity of the ZrO
2 particles is influenced by two parameters,
i.e., the temperature and reaction time. The crystallinity of the particles increases with longer synthesis times. At fixed reaction time, for example at 5 min, a temperature influence is visible. Higher temperatures favour the formation of crystalline material. The crystallite size is calculated by a simple Rietveld refinement with the help of
TOPAS-Academic,
V4.1 software [
28]. It is noticed that the crystallite size shows the same trend the crystallinity. Longer reaction times or higher reaction temperatures result in larger crystallite sizes. This can be attributed to higher growth rates of the crystallites at higher temperatures or more time given to the system to grow.
Figure 2.
XRD patterns of precipitated particles derived from microwave treated solution A at (a) 160 °C for 5 min; (b) 150 °C for 30 min; (c) 150° C for 5 min; (d) 140 °C for 60 min; and (e) 140 °C for 5 min.
Figure 2.
XRD patterns of precipitated particles derived from microwave treated solution A at (a) 160 °C for 5 min; (b) 150 °C for 30 min; (c) 150° C for 5 min; (d) 140 °C for 60 min; and (e) 140 °C for 5 min.
The stabilization of these particles is also investigated. After synthesis the zeta potential has a value of 25 mV that indicates electrostatic stabilization. 1D proton NMR confirmed this hypothesis. After purification PEG1000 was found neither in the solution nor on the particles. Despite the absence of ligands in the colloidal solution, the ZrO
2 suspension remains stable [
29]. As the pH level of this suspension is around 0.9, thus very acidic and not suited for industrial applications, an attempt was made to raise the pH. Higher pH levels make a less corrosive solution and more suited for the ink jet printing system. Precipitation is observed when the pH level is raised by the addition of a base. The formation of the precipitation could be avoided by addition of complexing ligands such as citric acid (CA) before the pH level is raised up to 7. In this case, a stable solution is obtained. Ethanolamine (EA) is used to adjust the pH level because it is a high boiling alkaline component that is harder to evaporate than ammonium hydroxide, which is often used in chemical solution methods.
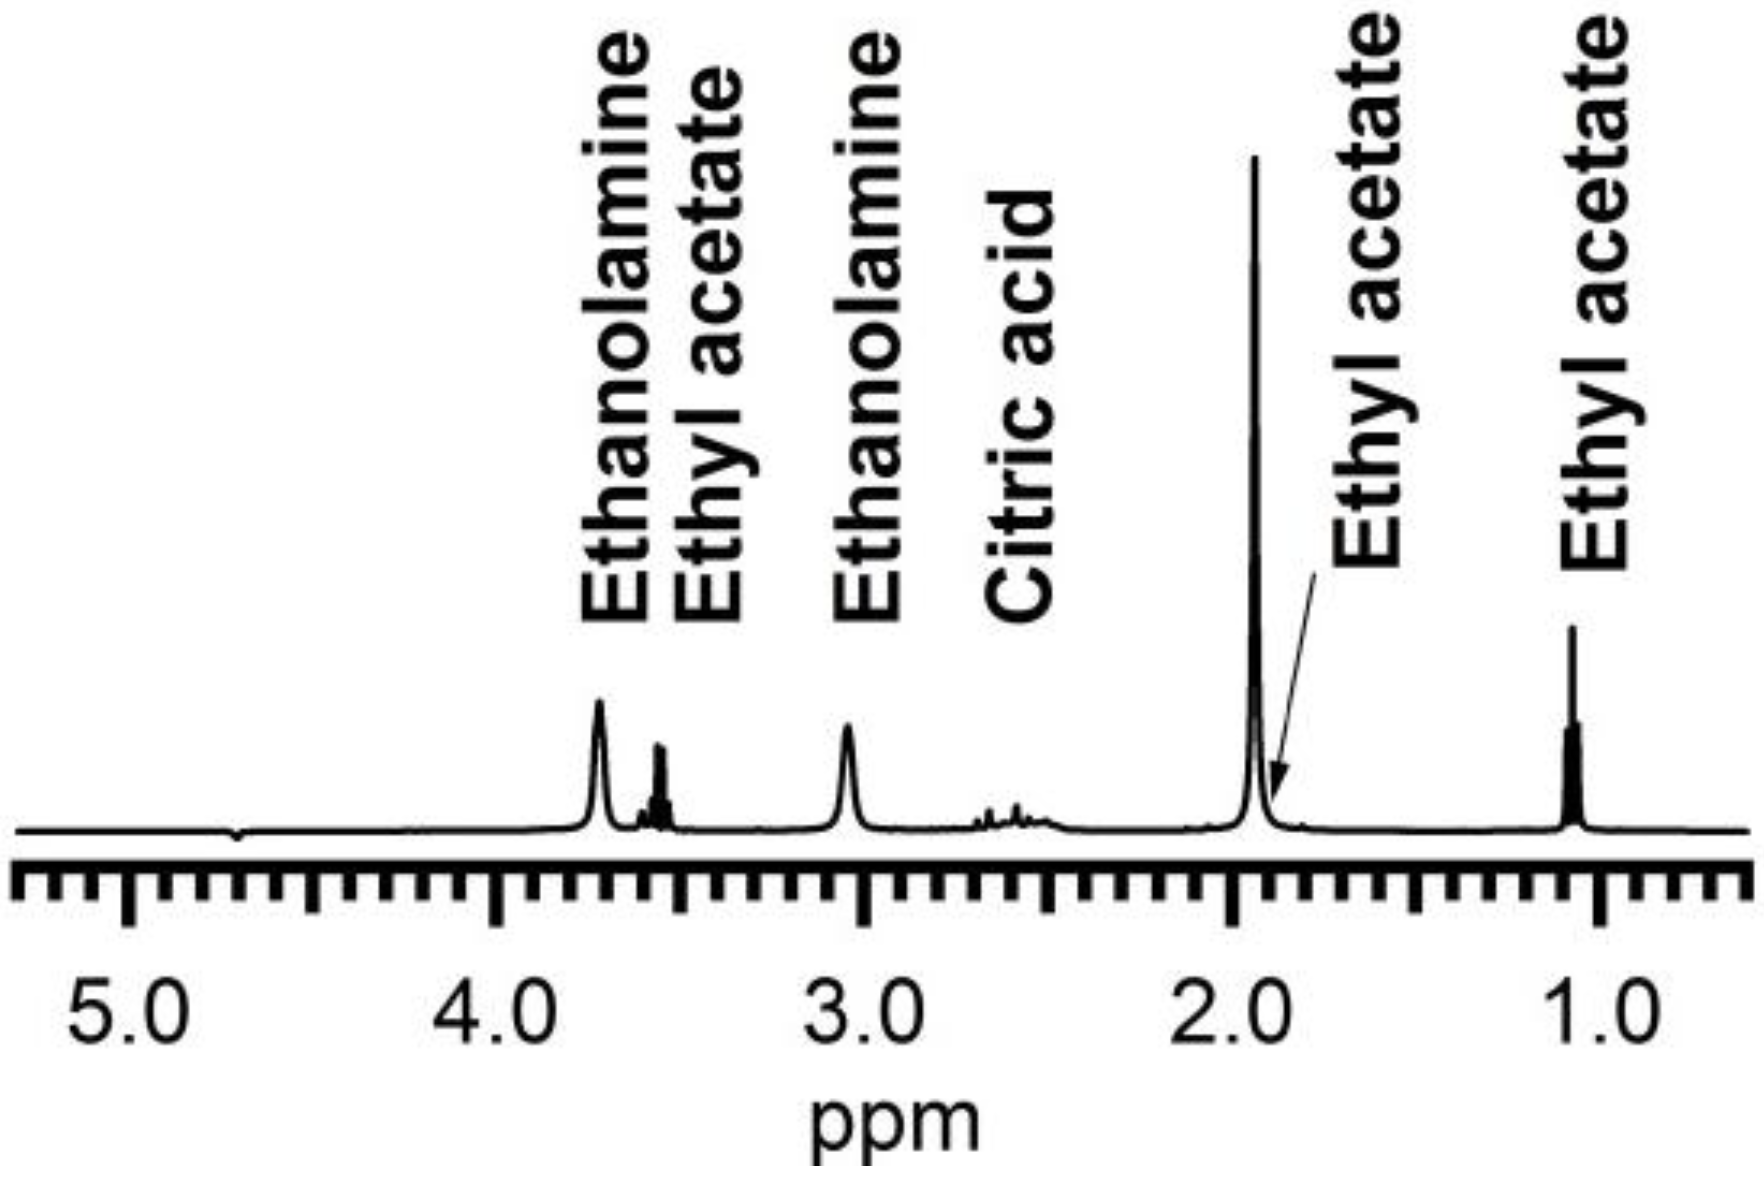
1H NMR spectroscopy was used to investigate the presence of organic ligands in the dispersion and their possible interaction with the ZrO
2 particles, using recently established methods for semi-conductor colloidal quantum dots [
30]. The presence of CA and EA even after washing steps is easily confirmed by noting the presence of their fingerprint in the 1D
1H NMR spectrum (
Figure 3). The signals at 3.7 and 3.05 ppm can be assigned to each of the methylene groups in EA and appear markedly broadened, a sign of interaction with the surface of a larger particle. The resonances around 2.6 ppm, with sharper lines and scalar coupling fine structure characteristic for small non interacting molecules, are assigned to CA. These appear on top of a broader background that could be attributed to bound CA, in slow or no chemical exchange with the particle surface [
31]. Other, equally sharp signals are attributed to ethyl acetate (
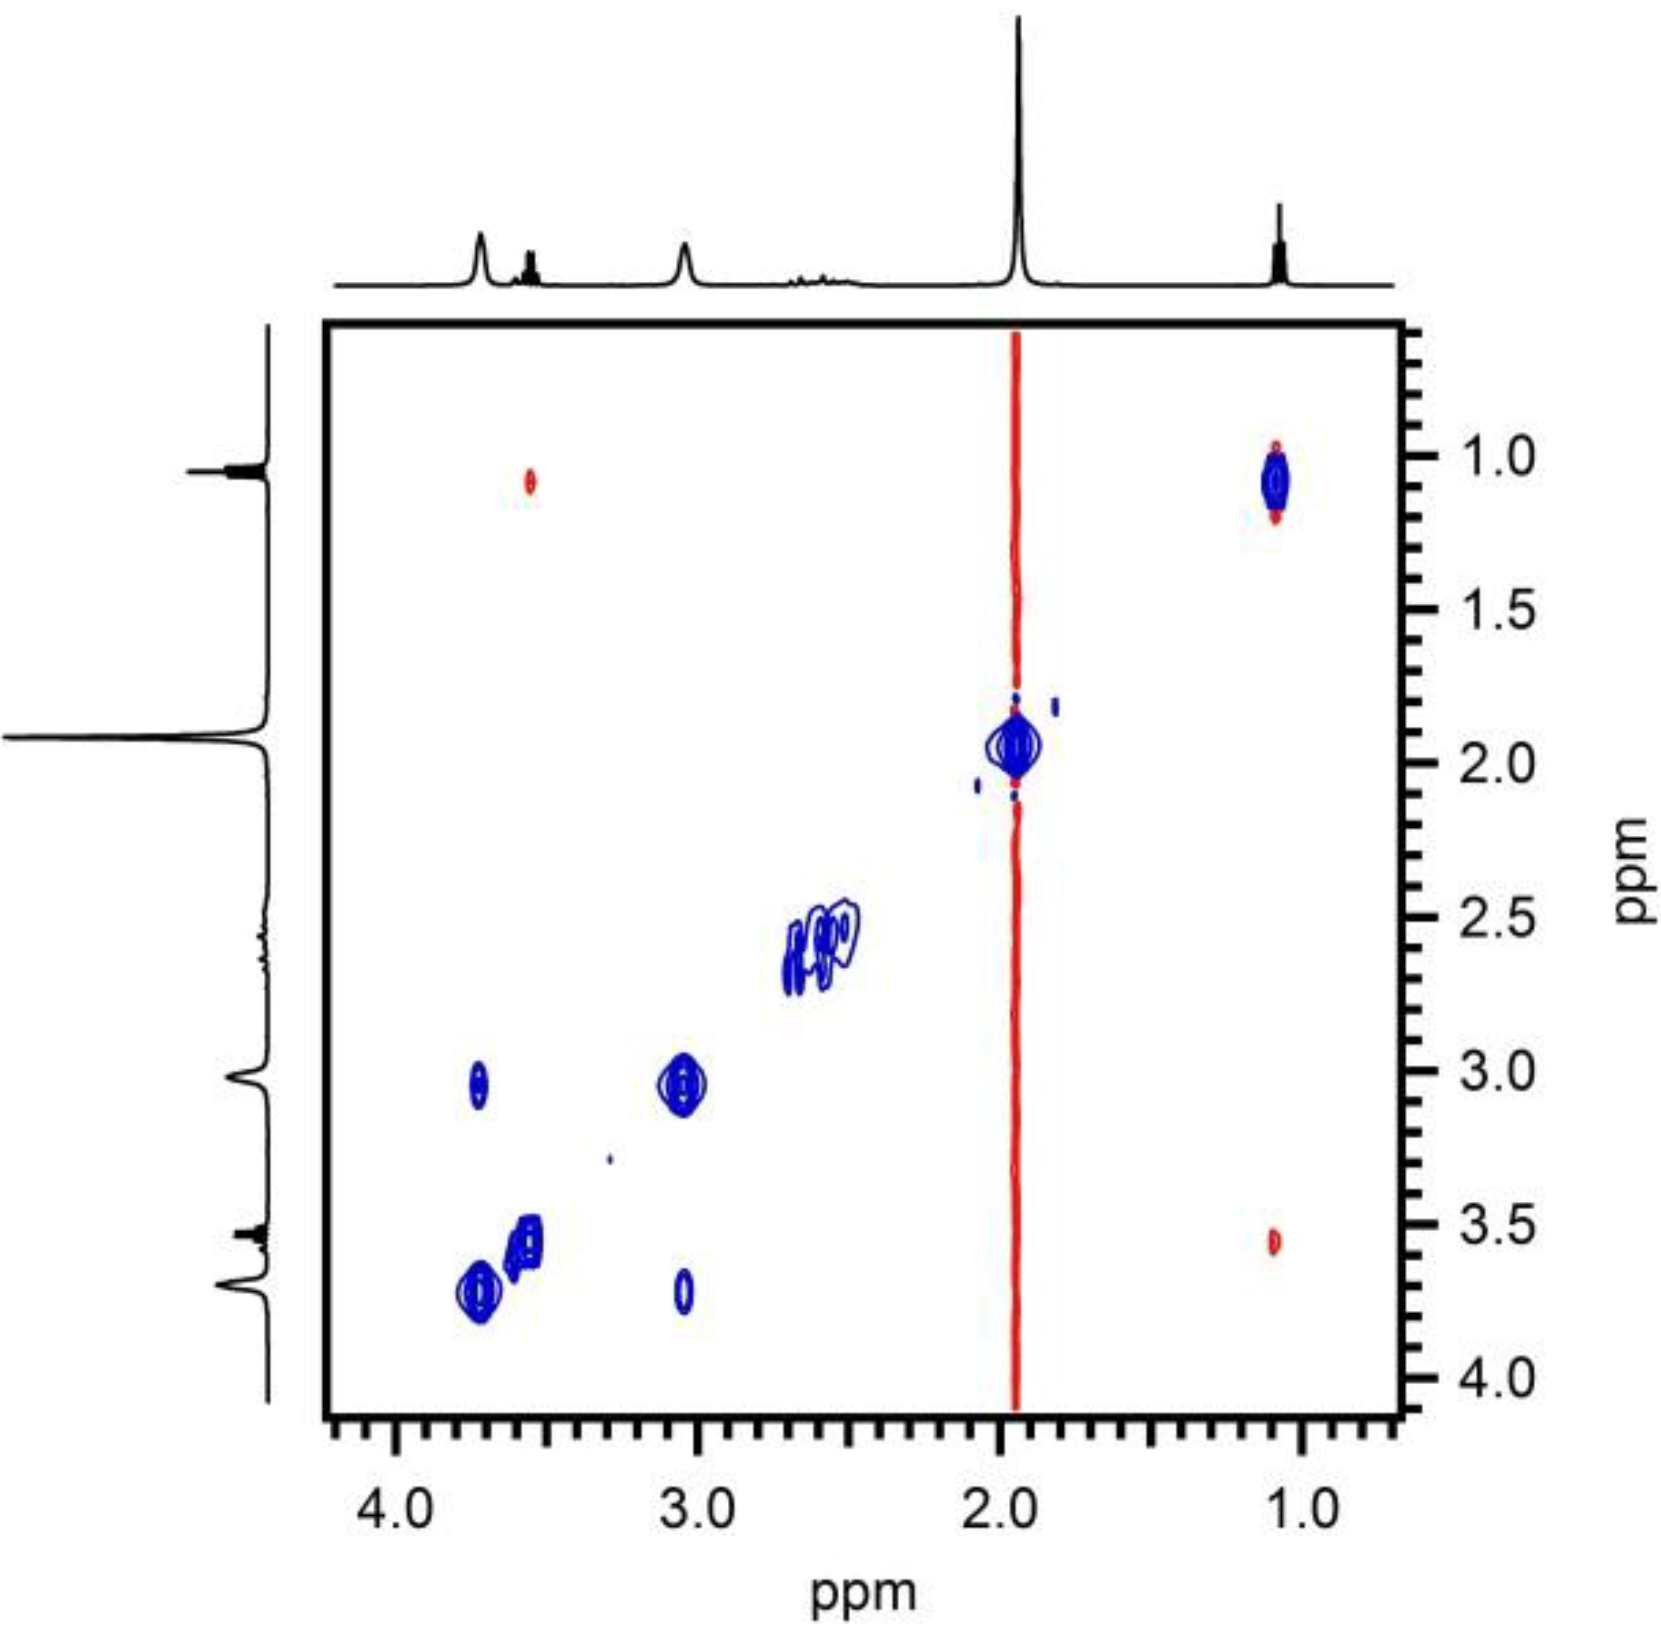
Figure 3). The 2D NOESY (Nuclear Overhauser Enhancement Spectroscopy) spectrum (
Figure 4) displays both strong negative and weak positive NOE (Nuclear Overhauser Enhancement) cross peaks as a result of cross-relaxation by dipolar interaction between proton spins that occur close (<5 A) to one-another in space. As has been discussed in more detail elsewhere [
30,
31], the fast reorientational dynamics of small molecules in solution causes the slow development of weak and positive NOE cross-peaks. On the other hand, the much slower reorientational dynamics of large molecules in solution results in rapid development of strong and negative NOE cross-peaks. Since the reorientation dynamics of ligands that are bound to the nanoparticle surface will be dominated by the large nanoparticle, strong and negative NOE cross-peaks are expected for any ligand that spends time interacting with the particle surface [
30]. Translating this to the case at hand, the following can be concluded. The small positive NOEs visible between the methyl and methylene resonance in the ethylgroup of ethyl acetate indicate that this molecule is free in solution at all times. Between the two EA methylene
1H resonances however, large negative NOEs are visible, indicating that EA does interact with the nanoparticle surface and acts as ligand. The occurrence of two sets of signals for CA, one low intensity and broadened and one sharper resonances, suggests CA occurs in two separately visible states. As the resonances of each species are insufficiently spaced, the nature of the NOE contacts cannot be established here. This notwithstanding it appears some CA is also interacting with the surface. Thus EA and most probably also CA contribute to the stabilisation of the dispersion thereby preventing the precipitation from occurring at neutral pH levels.
Figure 3.
1D proton NMR spectrum of solution A after microwave treatment, purification and the addition of CA and EA.
Figure 3.
1D proton NMR spectrum of solution A after microwave treatment, purification and the addition of CA and EA.
Figure 4.
2D NOESY spectrum of solution A microwave treated at 150 °C during 30 min after purification and the addition of CA and EA. Positive and negative NOE cross-peaks appear in red and blue and are attributed to their respective species.
Figure 4.
2D NOESY spectrum of solution A microwave treated at 150 °C during 30 min after purification and the addition of CA and EA. Positive and negative NOE cross-peaks appear in red and blue and are attributed to their respective species.
2.2. Interparticle Route towards YSZ
When the interparticle route is followed Y(NO
3)
3·
xH
2O should be added at the ZrO
2 suspension in the correct stoichiometric conditions. The exact yttrium concentration after addition is checked by XRF. In this case, 16 mol% of yttrium nitrate is added to synthesize 8YSZ at the end. A thermal treatment of this solution gives rise to diffusion of Y into the ZrO
2 particles resulting in 8YSZ. The conversion from monoclinic ZrO
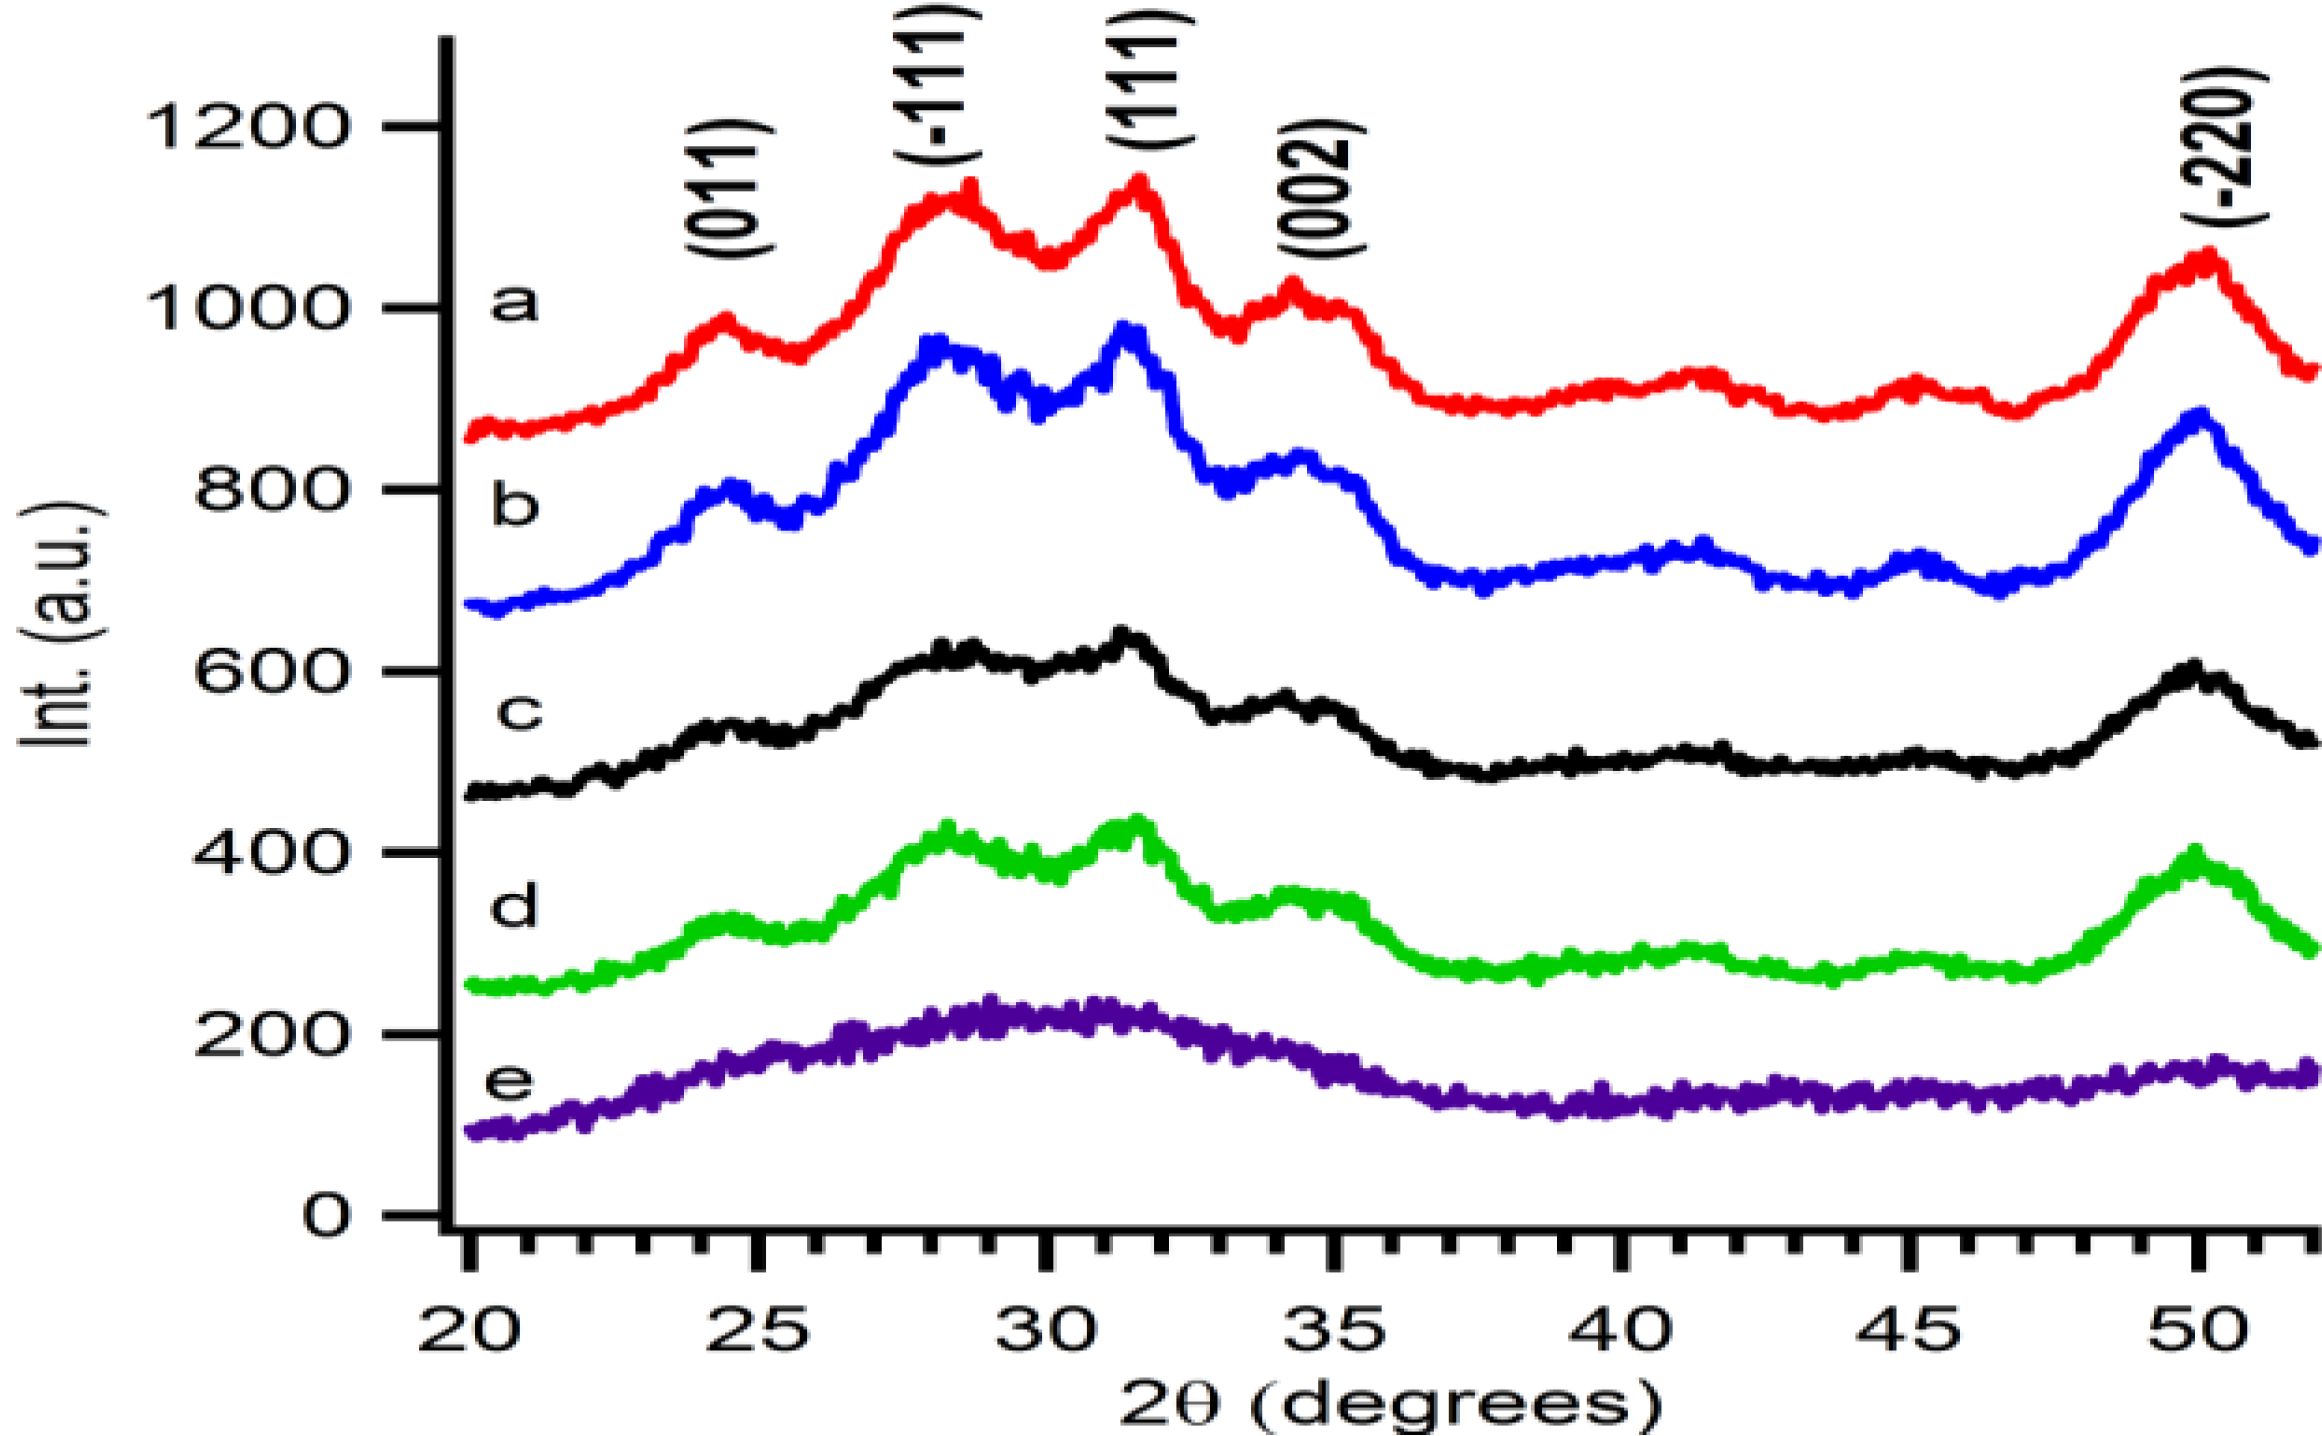
2 to cubic YSZ is monitored by XRD taken after each annealing step (
Figure 5). Monoclinic zirconia is already observed before calcination. After calcination of the suspension at 300 °C for 1 hour, a slight change in crystal structure is noticed, indicating that a mixture of monoclinic ZrO
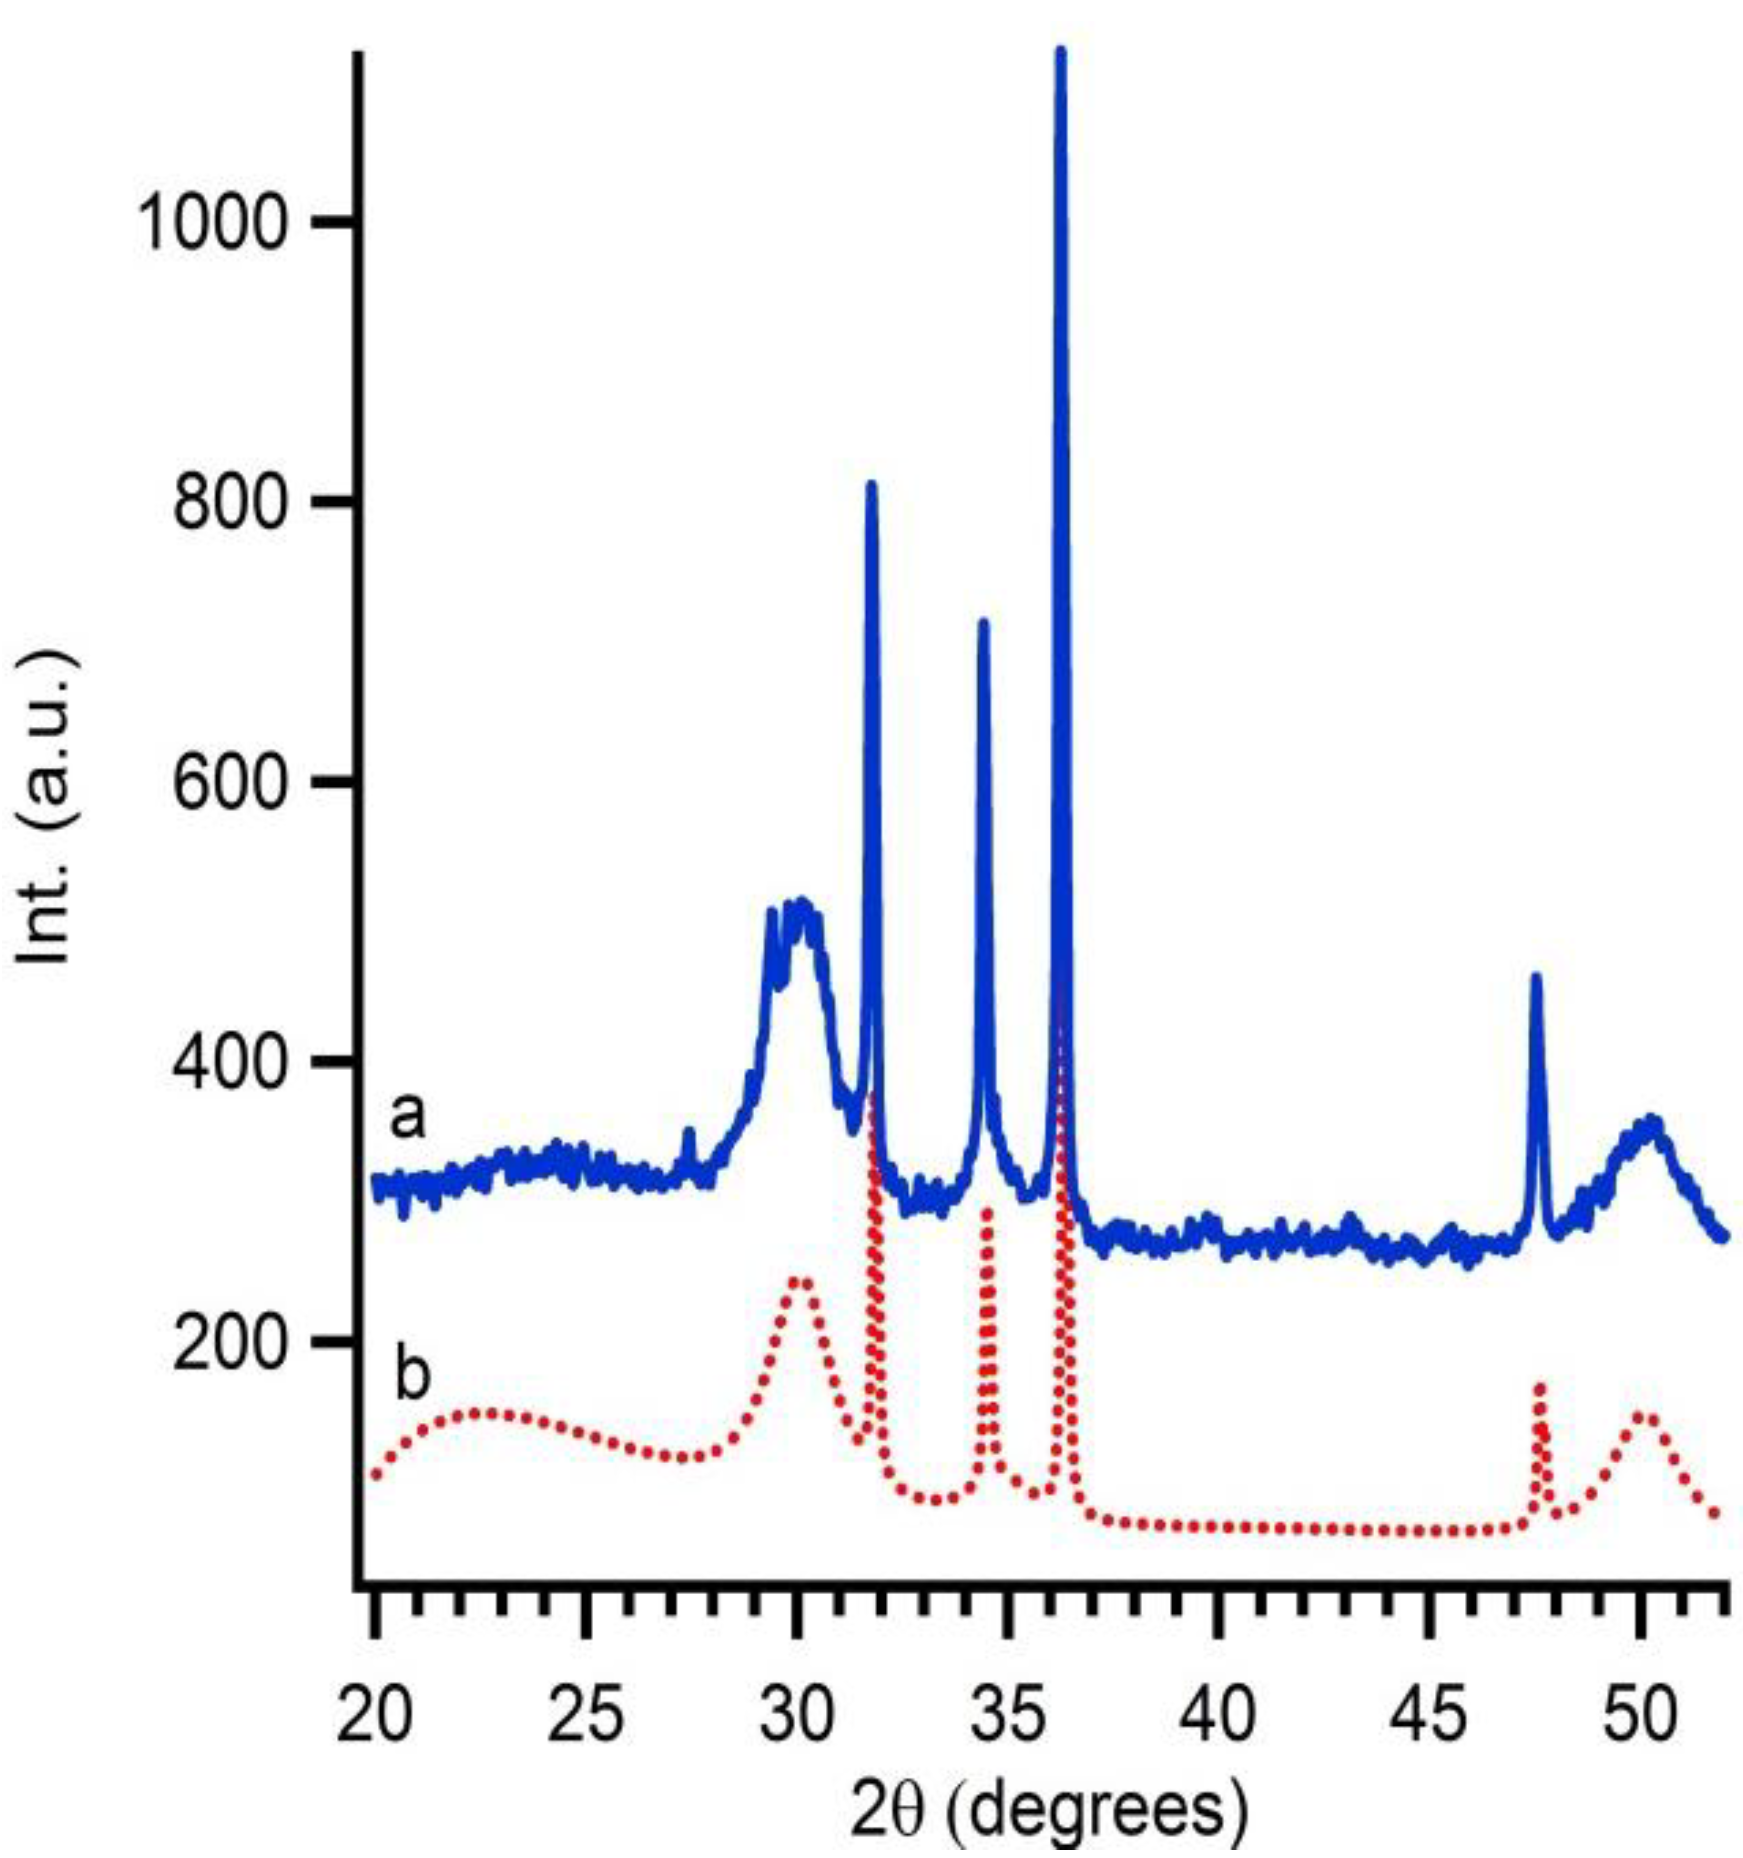
2 and cubic YSZ is obtained. This demonstrates the start of a phase transformation from the monoclinic to cubic crystal structure. Samples calcined at 400 °C during 1 hour only show the presence of 8YSZ. Gibson
et al. [
32] addressed the fact that the difference between nanosized cubic YSZ and tetragonal YSZ is hard to distinguish. Therefore, additional XRD measurements are performed. Because the crystallinity is too low, no reflections are observed in the 2θ region of 72 to 75. Therefore samples are mixed with a 10 wt% internal standard (ZnO). Software is used to perform Rietveld refinement (Topas Academic). The fit includes ZnO, tetragonal and cubic YSZ. The calculated plot with a goodness of fit of 1.18 matches cubic 8YSZ mixed with internal standard fits the experimental data (
Figure 6). No secondary phases such as tetragonal YSZ, Y
2O
3 or monoclinic ZrO
2 are detected in the diffraction pattern. This gives proof that the diffusion of dopants into 50 nm colloidal systems is possible and the interparticle route is a good alternative to obtain mixed or doped ceramic oxides at reduced temperatures.
Figure 5.
The influence of the temperature on the diffusion of Y into ZrO2 nanoparticles shown by XRD measurements (a) treated at 400 °C for 1 h; (b) treated at 300 °C for 1 h; and (c) as-synthesised, M marks the diffraction peaks of monoclinic ZrO2; and C the diffraction peaks of YSZ.
Figure 5.
The influence of the temperature on the diffusion of Y into ZrO2 nanoparticles shown by XRD measurements (a) treated at 400 °C for 1 h; (b) treated at 300 °C for 1 h; and (c) as-synthesised, M marks the diffraction peaks of monoclinic ZrO2; and C the diffraction peaks of YSZ.
Figure 6.
Rietveld refinement of the sample treated at 400 °C for 1 h with (a) the experimental data, sample inclusive internal standard; and (b) the calculated diffractogram.
Figure 6.
Rietveld refinement of the sample treated at 400 °C for 1 h with (a) the experimental data, sample inclusive internal standard; and (b) the calculated diffractogram.
2.3. Intraparticle Route towards YSZ
As mentioned before, zirconium ions are very sensitive to hydrolysis compared to yttrium ions. The hydrolysis of zirconium even occurs in strongly acidic solutions and the formation of polynuclear species takes the upper hand. Due to the extremely low solubility of these species (<10
−8 M), even at low pH ranges, precipitation will appear [
20]. Introducing chelating ligands can be a possible solution to lower the hydrolysis rate of the zirconium ions. The ligands can form complexes with both zirconium and yttrium ions. This will lower the amount of free ions in the solution. Hereby, hydrolysis of yttrium and zirconium can be controlled and tuned. Several ligands such as CA, nitrilotriacetic acid (NTA) and ethylene diaminetetraacetic acid (EDTA) were tested. Only the citric acid precursor (solution B) exposed the presence of the correct stoichiometric Y/Zr ratio after microwave treatment and several washing steps. The stoichiometry was determined by XRF measurements. The NTA precursors (solution C) were microwave treated for five to 10 min at 110 °C. Large precipitates were observed but no YSZ was formed. When EDTA precursors (solution D) were microwave treated for 60 min at 180 °C a stable colloidal solution is obtained, however, the quantity of reacted yttrium could not be controlled. XRF measurements showed a large variety in amount of yttrium present in the YSZ particles. The amount of yttrium inside the synthesised particles fluctuates from 0 to 6 mol%, which makes it hard to synthesise 8YSZ nanoparticles in a controlled manner.
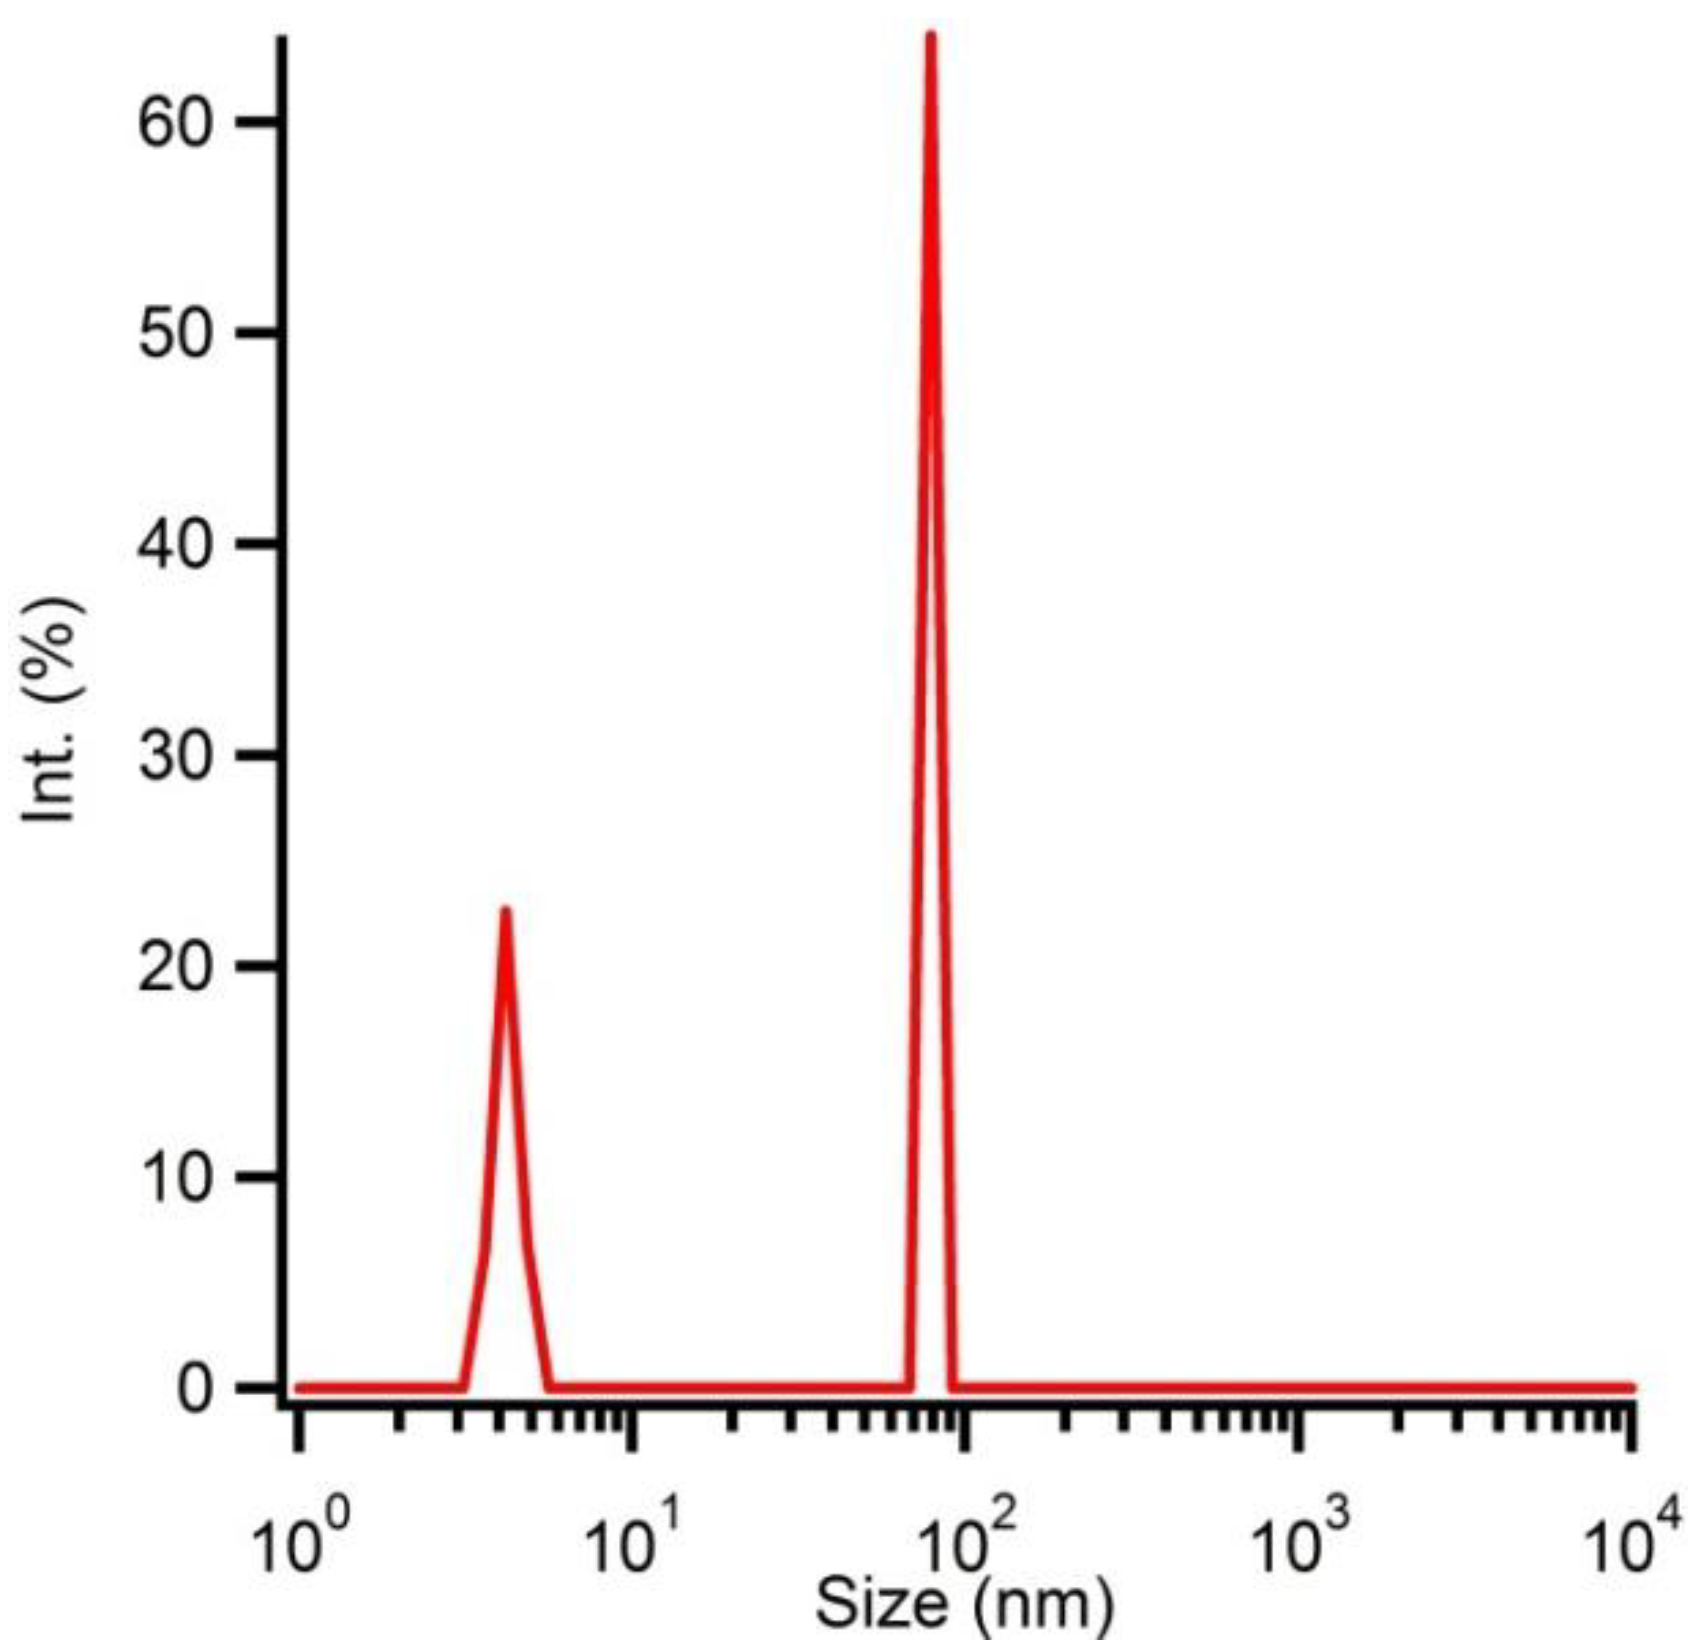
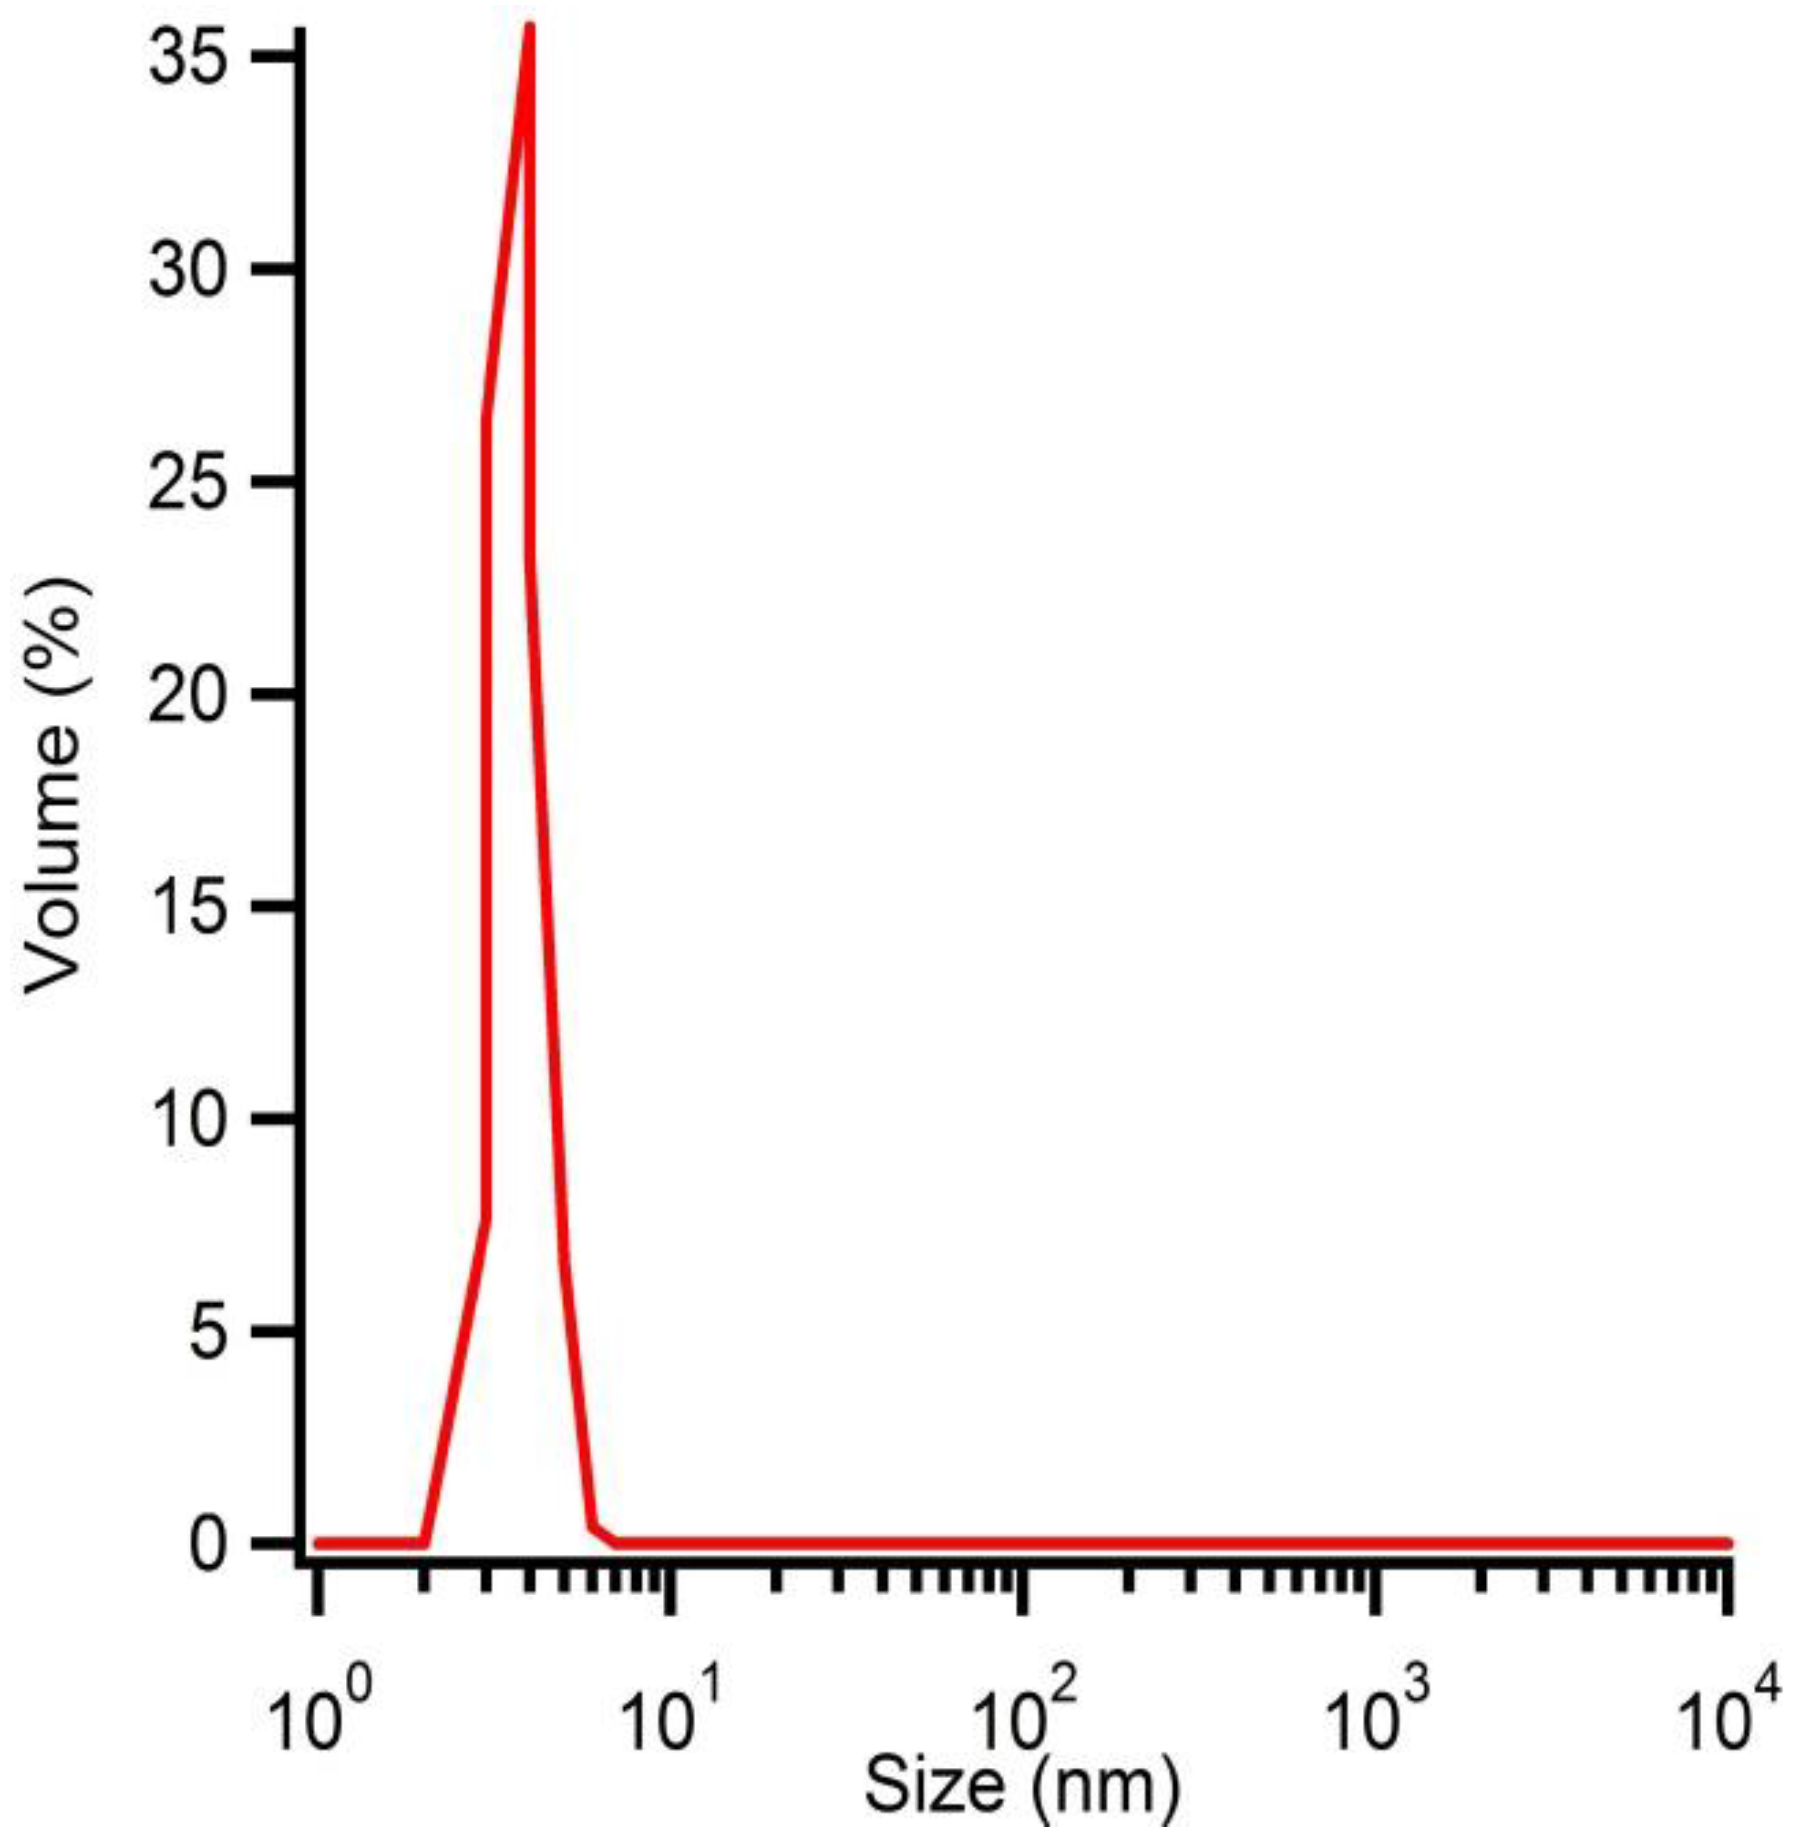
Solution B at pH 7 is microwave treated during 10 min at 180 °C. After purification and washing, the hydrodynamic radius of the particles is determined by DLS (
Figure 7) and polydispersive behaviour is observed. One distribution shows particles with an average hydrodynamic radius of 5 nm while the other distribution shows larger particles, which can be explained by aggregation of the smaller particles. However, a volumetric distribution shows monodisperse behaviour due to the correlation between the observed intensities and the particle volumes (
Figure 8). The size distribution is reported by relative intensities. To convert the monitored intensity distribution to a volumetric distribution, the volume of a sphere should be taken into account. This makes the intensity proportional to the cube of the particle diameter. Hereby, we can conclude that the amount of agglomerates is limited and most of the particles have an average hydrodynamic radius of 5 nm.
Figure 7.
Hydrodynamic radius of solution B microwave treated at 180 °C for 10 min determined by DLS measurements.
Figure 7.
Hydrodynamic radius of solution B microwave treated at 180 °C for 10 min determined by DLS measurements.
Figure 8.
Hydrodynamic radius of solution B microwave treated at 180 °C for 10 min determined by DLS measurements represented as a function of volume distribution.
Figure 8.
Hydrodynamic radius of solution B microwave treated at 180 °C for 10 min determined by DLS measurements represented as a function of volume distribution.
The as-synthesised YSZ particles don’t show any form of crystallinity. An additional thermal treatment transforms this colloidal solution into crystalline powders or thin films. As shown in
Figure 9, cubic YSZ is formed at 600 °C. All peaks can be assigned to the cubic phase of 8YSZ, pdf card # 30–1468. Also, in this case Rietveld refinement is performed on the sample which is thermal treated at 600 °C (
Figure 10). The fit of the calculated data matches the experimental (goodness of fit 1.21) and the formation of cubic 8YSZ is proven.
Figure 9.
The influence of thermal processing on the crystallinity of the YSZ nanoparticles shown by XRD measurements (a) treated at 600 °C for 1 h; (b) treated at 400 °C for 1 h; and (c) as-synthesised.
Figure 9.
The influence of thermal processing on the crystallinity of the YSZ nanoparticles shown by XRD measurements (a) treated at 600 °C for 1 h; (b) treated at 400 °C for 1 h; and (c) as-synthesised.
Figure 10.
Rietveld refinement of the sample treated at 600 °C with (a) the experimental data, sample inclusive internal standard; and (b) the calculated diffractogram.
Figure 10.
Rietveld refinement of the sample treated at 600 °C with (a) the experimental data, sample inclusive internal standard; and (b) the calculated diffractogram.
The crystallisation temperature of the amorphous particles via the intraparticle route is 200 °C higher than the interparticle approach which makes this a more energy consuming process. When stable crystalline YSZ nanoparticles in aqueous solution could be obtained, the intraparticle approach would be preferred to synthesise thin films. The interparticle route is accompanied by an additional phase transformation as pure zirconia particles are formed in the first step of the process. These monoclinic particles will change to a cubic crystal structure after the interdiffusion of yttrium ions. This phase transformation is associated with a change in crystal lattice dimensions. During thin film processing, a phase transformation is often associated with stresses and cracks [
33,
34]. Though, the intraparticle route can avoid the diffusion step of the yttrium ions into the zirconia matrix, the obtained amorphous YSZ particles need a higher post-thermal treatment. The intraparticle approach can be most promising if the crystallinity of the YSZ particles could be improved.

 ,
, 

