3. Results and Discussion
Typical measured values of the diffraction efficiency
η at temperatures 25 °C <
T < 82 °C were in the range of 1%–5%. For
T > 82 °C, the diffraction efficiency was drastically decreasing with increasing temperature and at
T = 90 °C its value was more than two orders of magnitude smaller than at
T < 82 °C. This observation signifies that the presence of LC orientational order is crucial for efficient holographic recording. The origin of the recording process induced by UV light at all temperatures is the same, namely
trans-to-
cis isomerization of the azomesogene (diazene) side groups. However, at
T < 82 °C the conformational state of these side groups is strongly coupled with the orientational order of the non-photosensitive mesogenic side groups, which means that an increased concentration of the
cis groups
Nc causes a decrease of the scalar nematic order parameter
S (
S =< (3cos
2θ − 1)/2> (where
θ is the angle between the long axis of the mesogenic molecules and
n). The decrease of
S results in spontaneous contraction of the sample in the direction of
n, very similar to the effect of the increasing temperature [
12]. The outcome of both perturbation mechanisms (
trans-to-
cis isomerization and heating) is schematically illustrated in
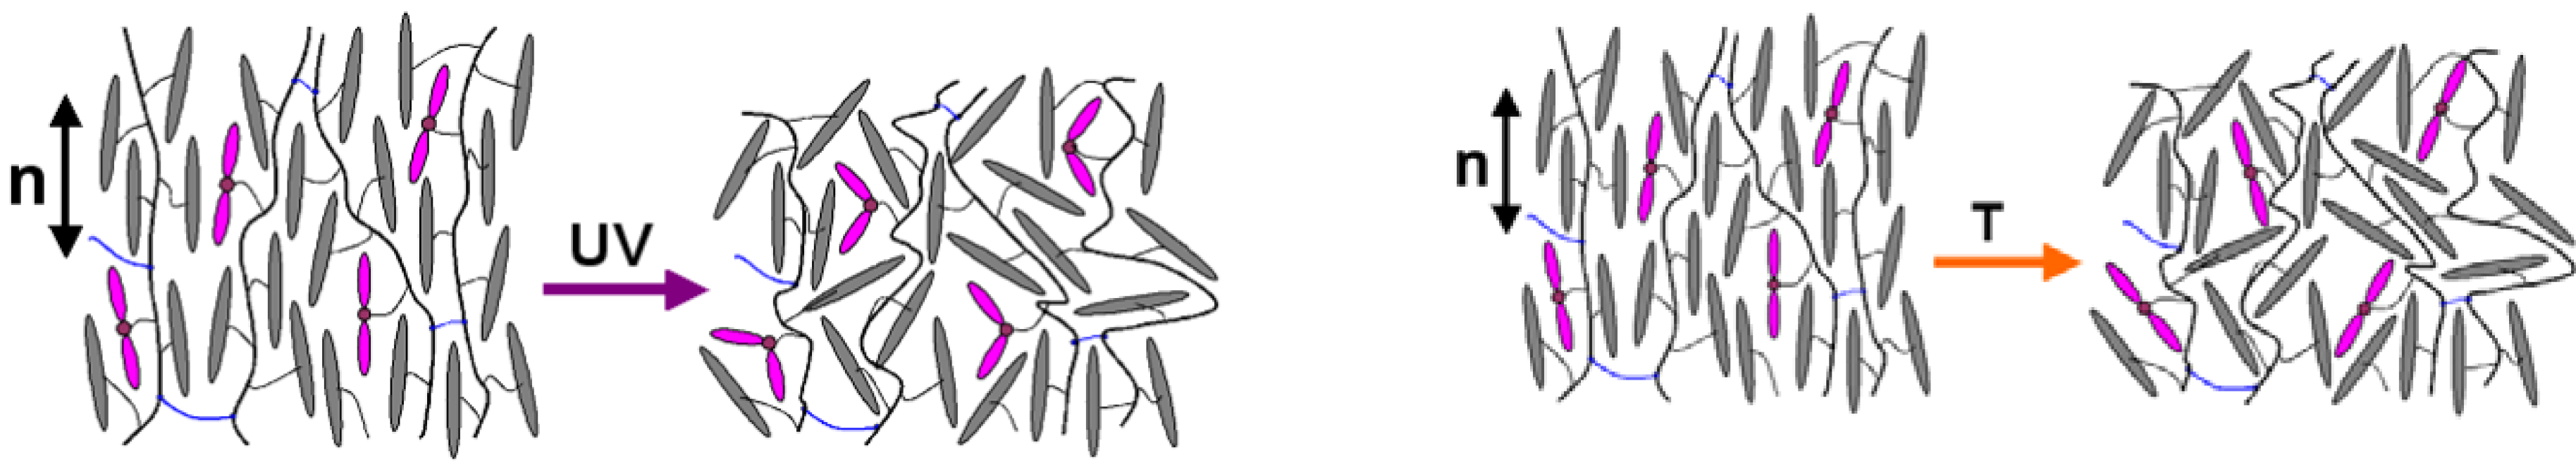
Figure 3. Important for holographic recording is that a decrease of
S also results in the proportional decrease of the optical birefringence of the material
Δn =
Δ(
ne−
no)
ΔS (where
e and
o denote extraordinary and ordinary ray, respectively), which can have values as large as Δ
n~0.1 [
8,
9]. For
T > 82 °C, the nematic orientational order is drastically reduced and its coupling with the conformational state of the azomesogenic side groups practically vanishes. Thus modifications of the refractive index can take place only via direct modification of the optical polarizability of azo-molecules,
i.e., via modification of the contribution of the azo molecules to the net refractive index of the material at the probe wavelength
λP, and consequently the resultant patterning effect is much weaker. At high temperatures azo-doped LCEs become similar to the conventional azo-doped elastomeric materials.
Figure 3.
Schematic illustration of the effect of UV-light-induced trans-to-cis isomerization (left) and heating (right) on the orientational order of a liquid crystal elastomers (LCE). Pink colored double ellipsoids denote azomesogenic side groups and gray colored ellipsoids denote usual mesogenic side groups. Black lines denote polymer chains and blue lines denote cross-links between them. Both isomerization and heating produce a decrease of the LC order parameter S. Consequently, contraction of the film in the direction of the nematic director n and elongation in the direction perpendicular to n take place.
For a sinusoidal interference pattern of the UV light intensity with
I = I0(1 +
CosKgr), the spatial dependence of the concentration of
cis isomers
Nc can be written as [
2,
3]:
where
r is a coordinate vector,
t is the recording time, 1/
τeff =
A(1 +
CosKgr) + 1/
τ,
A is a rate constant of the UV-light-induced
trans-to-
cis isomerization, which is proportional to
I0,
τ is the relaxation time of the thermally-induced
cis‑to-
trans back-isomerization, and
No is the total concentration of the azomesogens. At this point we need to mention that Equation 1 is valid only for the top-most layer of the sample. Due to the strong absorption of the UV light, the intensity of recording radiation decreases with increasing sample depth and consequently the recording process is less effective at larger depths. Our recent investigation of this problem using numerical simulations revealed that in the beginning of the UV illumination the grating structure is recorded in a surface region with an effective thickness of 2 μm [
10]. However, at longer illumination times a reduced concentration of the absorptive
trans-azomesogens in the surface layer causes an increase of the penetration depth of the UV light and subsequently at very long illumination times the effective thickness of the grating structure increases to 20 μm. From this one can anticipate that, although the kinetics of the
trans-
cis isomerization process itself is in general quite simple, its dependence on spatial variations of the UV light intensity and its non-local coupling to the LC orienational order will in total bring a complicated time dependence of the refractive index modifications during holographic recording. In contrast, the relaxation (spontaneous erasure) of the grating structure is governed only by the thermally-induced
trans-to-
cis back-isomerization and should therefore behave much more simply. The relaxation of the concentration of cis-isomers
Nc can be written as [
2,
3]:
where
Nc(
r, 0) denotes the profile established at the end of the recording process.
The main difference between Equations 1 and 2 is that the effective recording time τeff in Equation 1 strongly varies with position in the sample, as it depends on the intensity of the UV light that is changing along the direction of the grating vector Kg as well as with the depth of the sample. The relaxation time τ in Equation 2, on the other hand, is supposed to be more or less spatially independent, because the thermal gradients in the sample are suppressed by heat diffusion.
Let us now shift the discussion from the expectations to the experimental results.
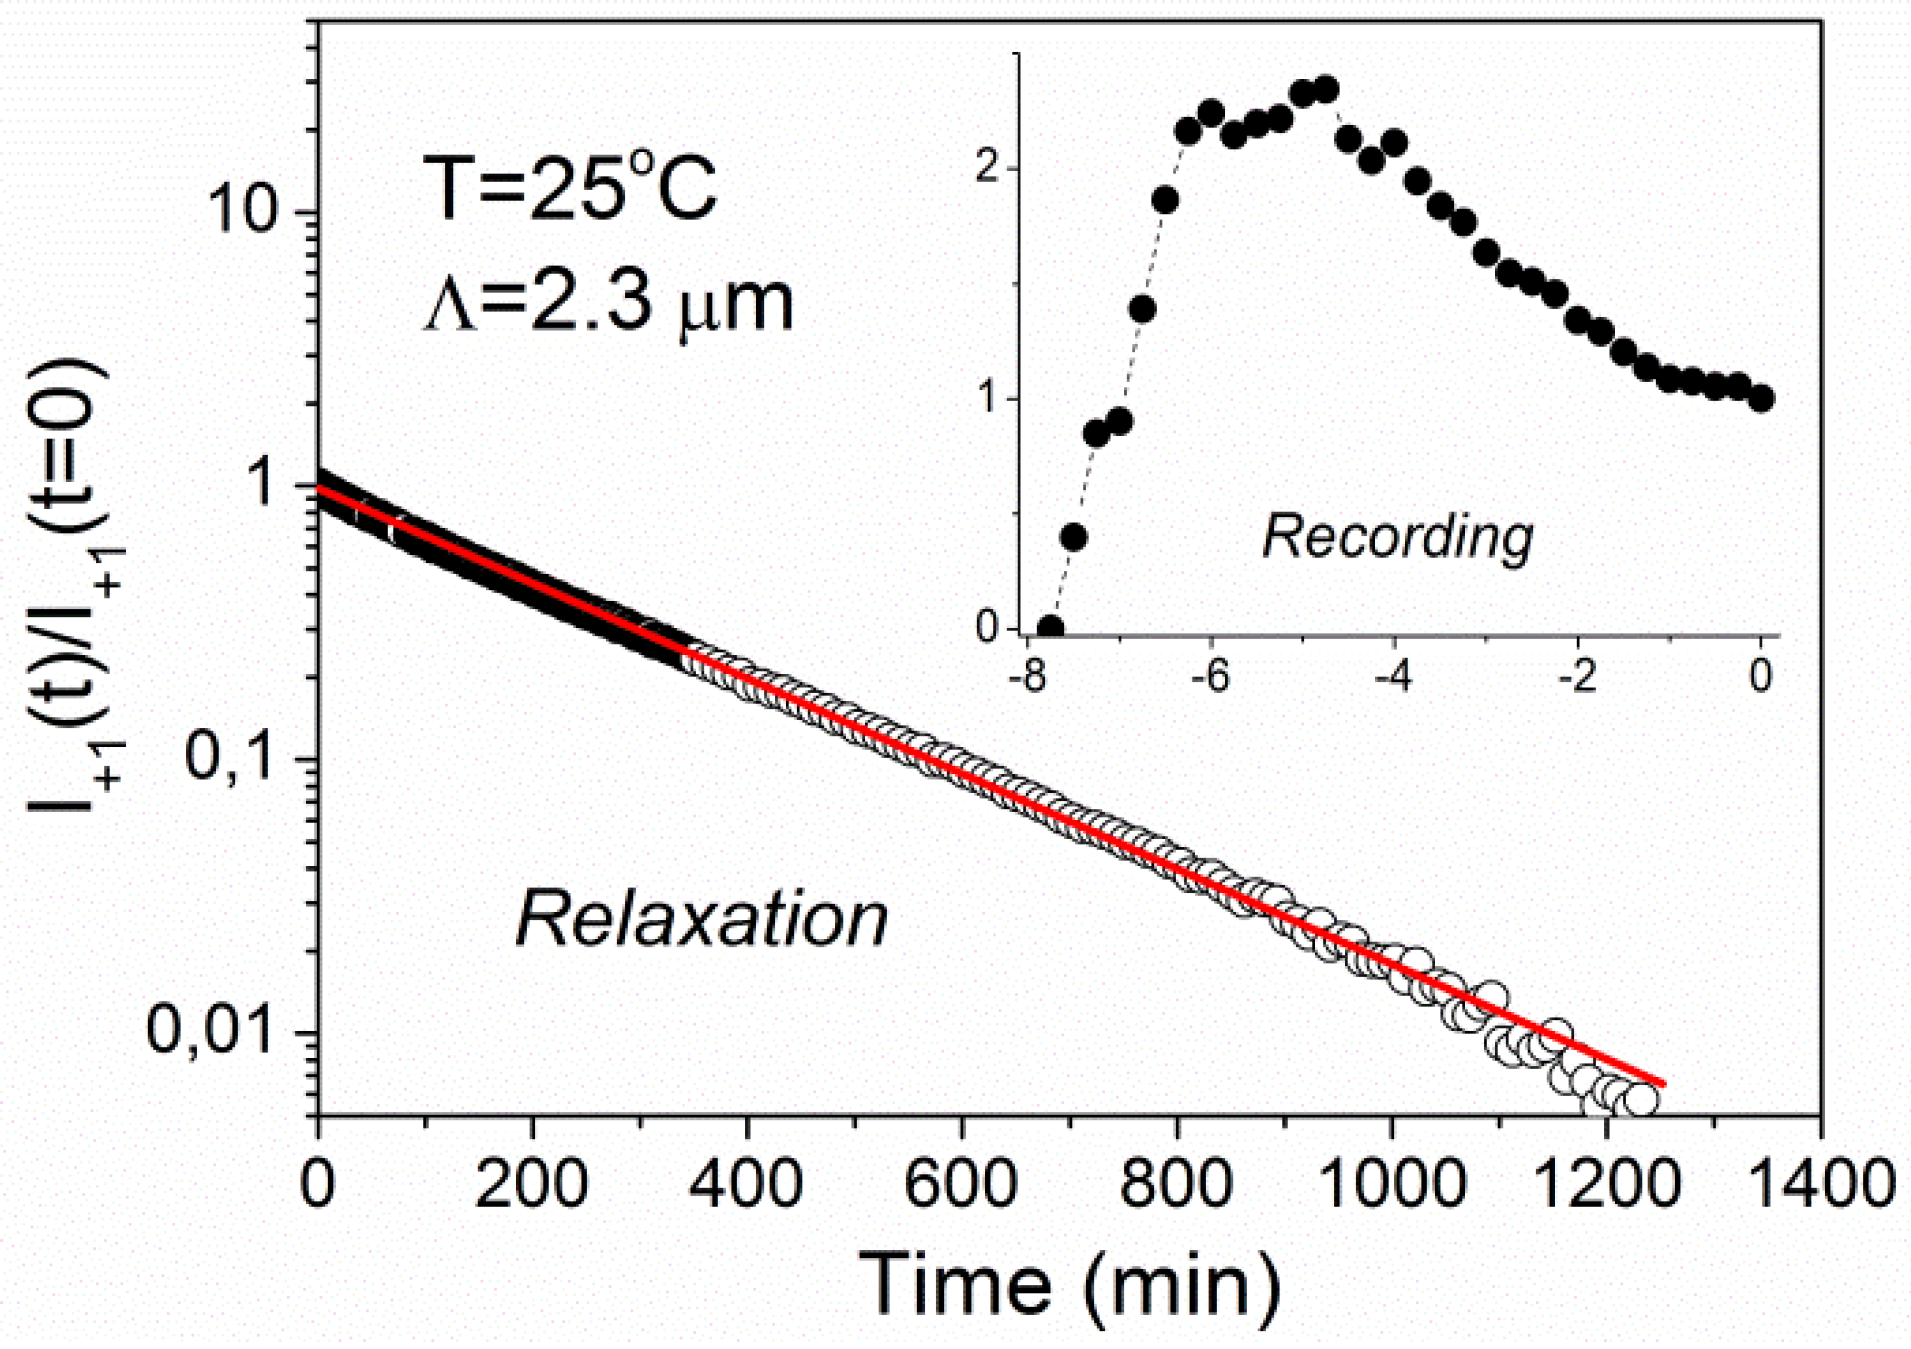
Figure 4 shows time dependence of the intensity of the +1st order diffraction peak measured during recording of a holographic grating with the grating period of 2.3 μm at
T = 25 °C and its subsequent relaxation. The value
t = 0 corresponds to the end of recording process (
i.e., beginning of relaxation process). The intensity is normalized to
I+1 = 1 at
t = 0. The relaxation kinetics exhibits a simple single-exponential decay with relaxation time
τ = 247 ± 1 min. The recording kinetics (see inset of
Figure 4) shows a nonmonotonic behavior with a maximum at the recording time of about 3 min.
Figure 4.
Time dependence of diffracted intensity during recording (inset) and relaxation for a grating with the period of Λ = 2.3 μm at T = 25 °C. The solid line is a fit to single-exponential decay.
Figure 4.
Time dependence of diffracted intensity during recording (inset) and relaxation for a grating with the period of Λ = 2.3 μm at T = 25 °C. The solid line is a fit to single-exponential decay.
We assume that at
T = 25 °C the profile of the extraordinary refractive index modulation Δ
ne(
r) follows the profile of
Nc(
r),
i.e., that we have Δ
ne(
r)
Nc(
r). Then the nonmonotonic behavior during recording can be attributed to a saturation of the concentration of
cis-isomers. Taking into account that in our experiments
τ is large compared to A
−1, Equation 1 can be simplified so that only the exponential term in the square brackets is retained. For short recording times the dependence of
Nc(
r) is then sinusoidal,
i.e., it can be described as
while for long illumination times one obtains
Nc(
r)
N0 everywhere except at the minima of the interference pattern, where
Nc(
r) = 0. According to this, the intensity of the ±1st order diffraction peaks, which is proportional to the fundamental Fourier component of the refractive index modulation, increases in the beginning of the recording process and then decreases at long recording times. Therefore, at the same time one might start awaiting higher order diffraction peaks associated with higher harmonics to appear. As shown in a recent paper of Fally
et al. [
24] such behavior is actually expected in all kinds of two-state photo-excitable systems.
In LS-LCEs, however, there are also other phenomena that might as well lead to the result shown in the inset of
Figure 1. As already mentioned before, due to photo-induced “bleaching” of the absorptive
trans isomers, the effective thickness of the recorded holographic grating increases with increasing recording time. Consequently, the diffraction properties are shifting from the thin to the thick grating regime and the width of the Bragg peak decreases [
23]. Because in our experiments the probe beam was entering the sample at normal incidence, this can bring a nonmonotonic dependence of diffraction intensity on the recording time. To further resolve this phenomenon, systematic investigations of the angular dependence of the diffraction properties for different recording times are needed, which is out of the scope of this paper. Another possibility is to use samples with the thickness much smaller than the penetration depth of the UV light.
An additional phenomenon that can cause a nonmonotonic dependence is self-diffraction of the recording UV beams. It can alter the original profile of the interference pattern, for instance by “leakage” of the intensity into higher diffraction orders. While a probe beam at
λP = 632.8 nm experiences only the refractive index modulation, the recording beam experiences a combination of both, refractive index and absorption modulation, which makes the situation more complicated [
25]. This problem, which was already partially considered in the framework of paraxial approximation in [
10], also requires further analysis.
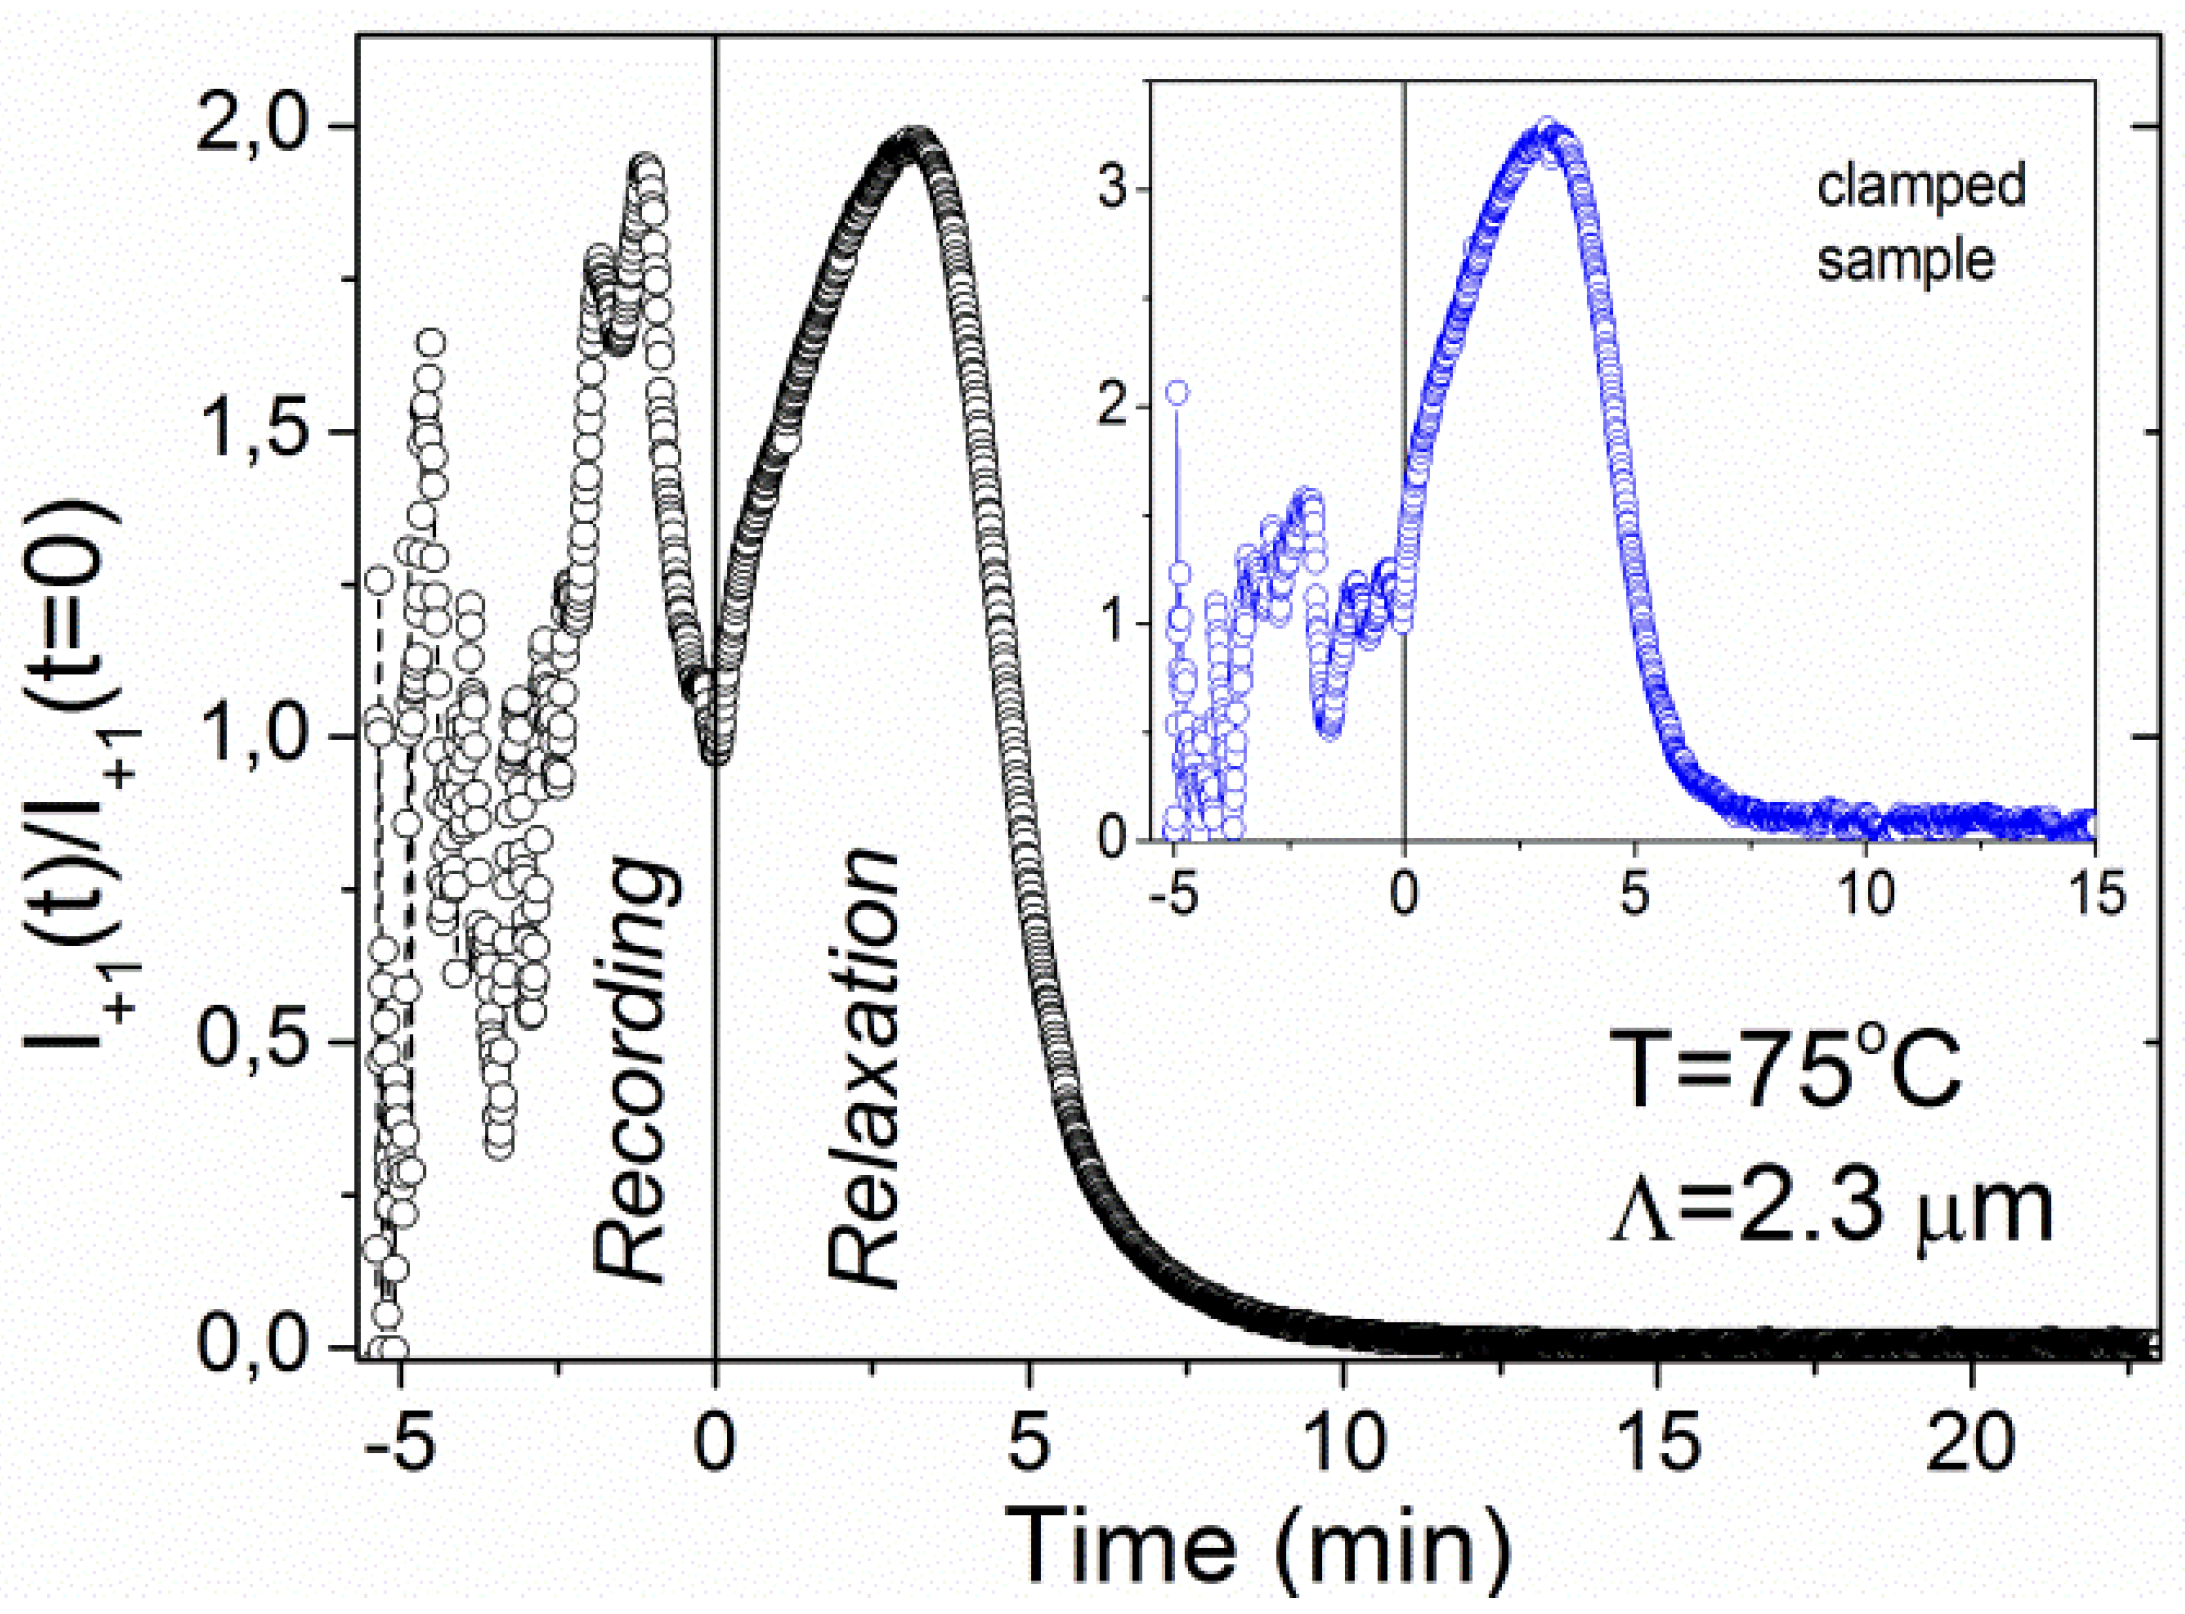
At higher temperatures some additional features appear.
Figure 5 shows recording and relaxation kinetics of a grating with
Λ = 2.3 μm fabricated at
T = 75 °C. The UV beams were terminated at
t = 5.4 min, which is marked by the dashed vertical line. During the recording process diffracted intensity shows very irregular behavior of the oscillatory type. But, even more surprisingly, the relaxation kinetics becomes nonmonotonic too. In subsequent repetitions of the experiment, the features observed during the recording were qualitatively similar, but the details were different. In contrast to this, the relaxation kinetics was well reproducible.
Figure 5.
Time dependence of the diffracted intensity during recording and relaxation of the grating with Λ = 2.3 μm at T = 75 °C. The inset shows a result obtained for the clamped sample (stretched 5% with respect to the initial length).
Figure 5.
Time dependence of the diffracted intensity during recording and relaxation of the grating with Λ = 2.3 μm at T = 75 °C. The inset shows a result obtained for the clamped sample (stretched 5% with respect to the initial length).
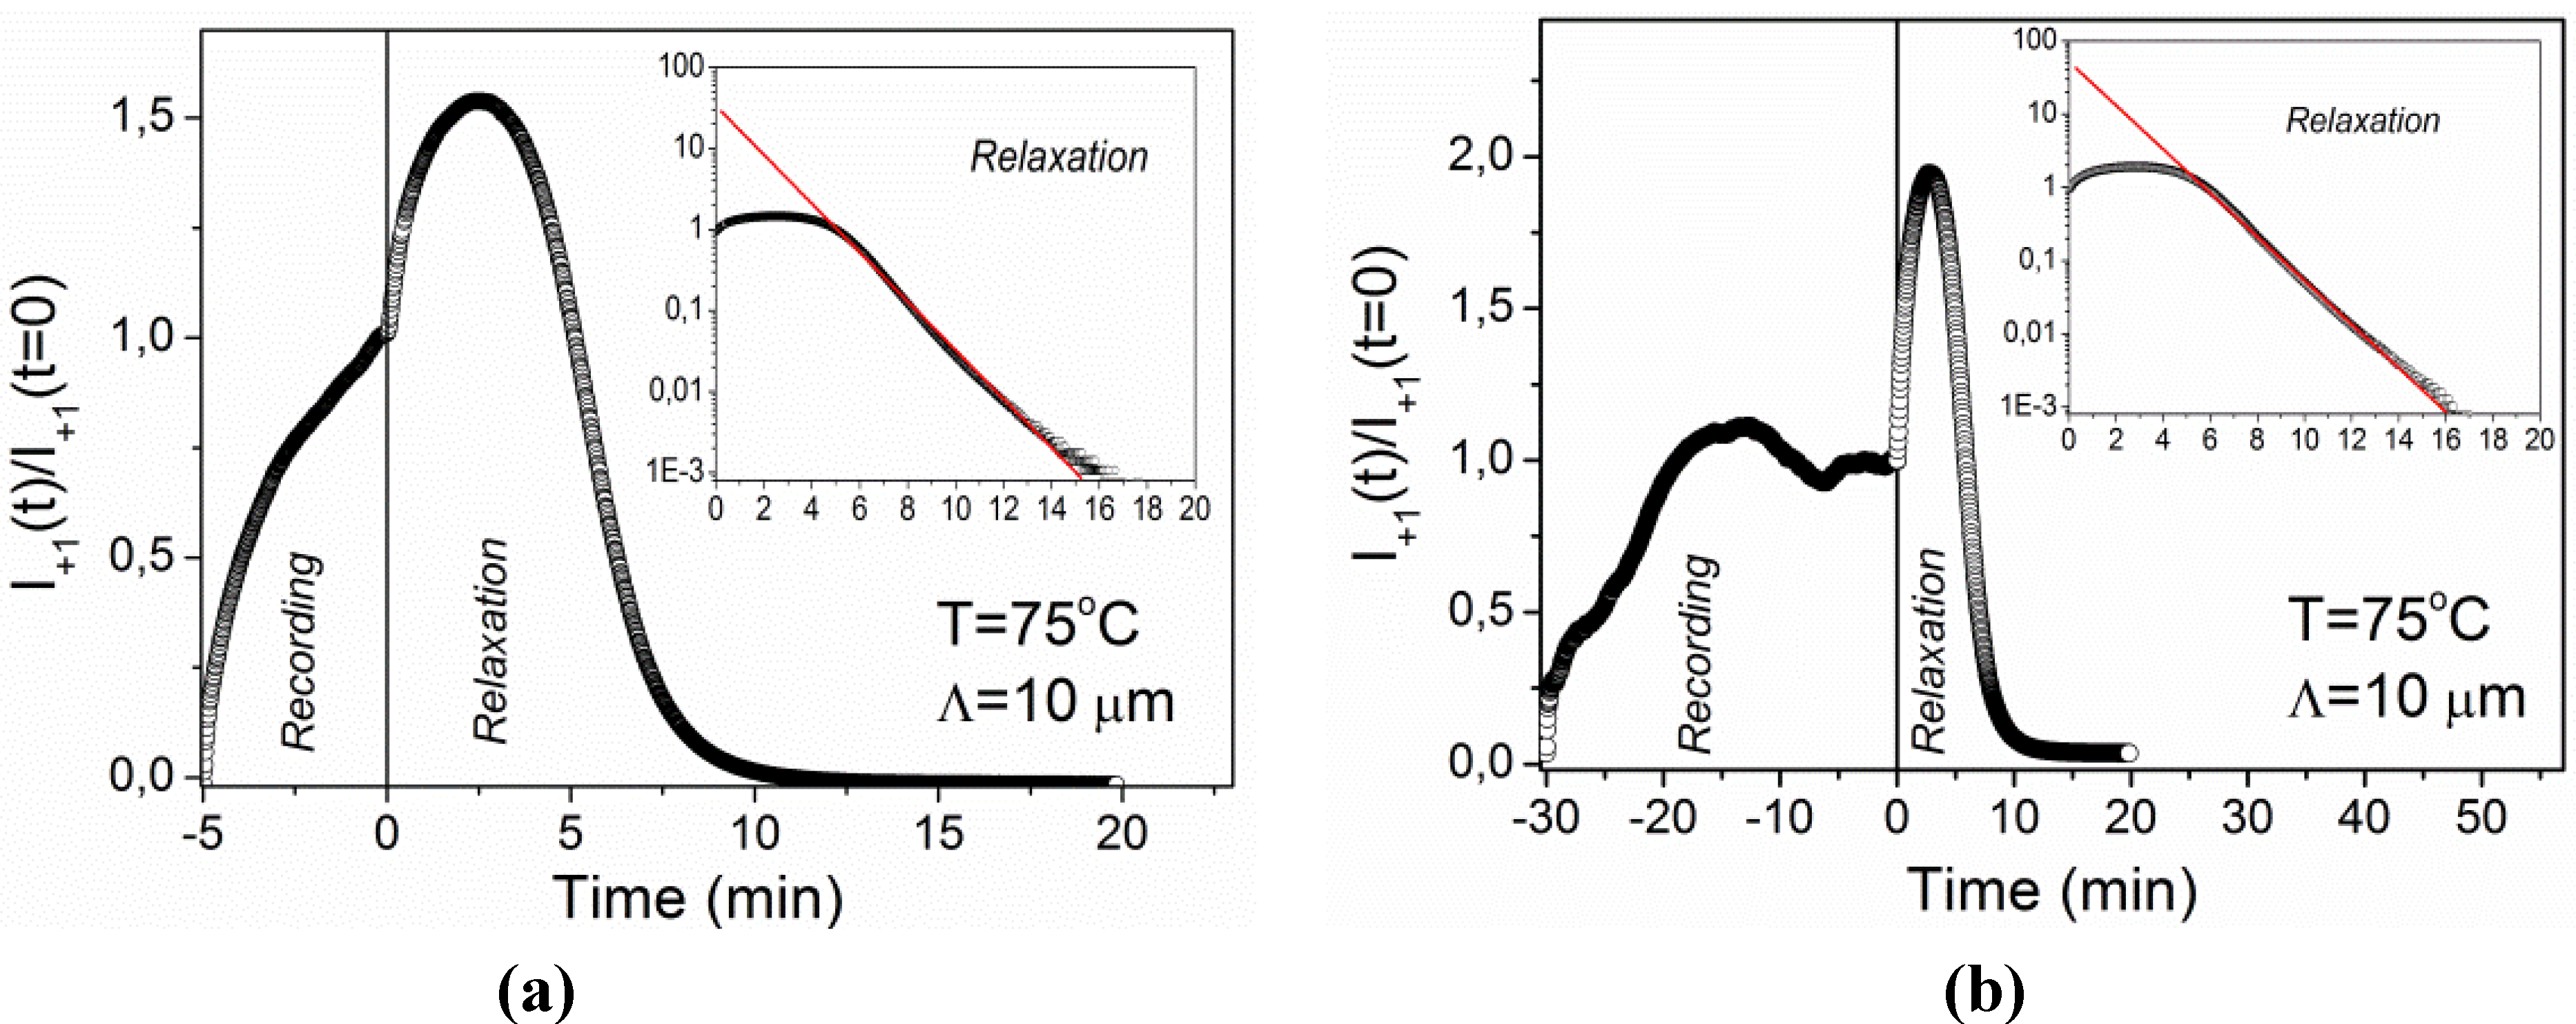
The experiment was repeated by recording a grating with a grating period of
Λ = 10 μm under the same conditions. The result is shown in
Figure 6a. In this case the recording kinetics is monotonic and quite smooth, while the relaxation kinetics exhibits the same features as for the grating with
Λ = 2.3 μm. Additional analysis of the relaxation process reveals that at long times after the termination of the UV exposure diffracted intensity decays exponentially. The fit to exponential decay (taking into account only data for relaxation times
trel > 5 min) is shown in the inset of
Figure 6a and gives a relaxation time of
τ = 1.47 ± 0.01 min. The same type of grating was also recorded for 30 min (
Figure 6b). In this case the recording kinetics is nonmonotonic and resembles the features observed for
Λ = 2.3 μm at
T = 25 °C (
Figure 4), while the relaxation kinetics is the same as for 5 min of recording (see inset of
figure 6b).
Figure 6.
Time dependence of diffracted intensity during recording and relaxation of the grating with Λ = 10 μm at T = 75 °C: (a) recording for 5 min; (b) recording for 30 min. The insets show the relaxation process on a logarithmic scale. Solid lines are fits to single-exponential decay.
Figure 6.
Time dependence of diffracted intensity during recording and relaxation of the grating with Λ = 10 μm at T = 75 °C: (a) recording for 5 min; (b) recording for 30 min. The insets show the relaxation process on a logarithmic scale. Solid lines are fits to single-exponential decay.
The usual explanation for the irregular behavior of the diffracted intensity during recording is vibrations in the experimental setup. Due to the vibrations, the positions of maxima and minima in the intensity profile of the recording beams shift with respect to the recording material, which causes smearing of the holographic pattern. In LCEs, however, such dynamic shifting does not occur only due to the external vibrations, but is an intrinsic property of the material itself. This is because, as discussed in the beginning of this section, light-induced
tran-to-
cis isomerization causes spontaneous shrinkage of the surface layer of the sample, which in general leads to bending. In addition to this,
tran-to-
cis isomerization also causes heating [
3], which generates shape modifications in the entire sample volume due to heat diffusion. These modifications strongly affect the diffraction efficiency, if length contraction Δ
L of the film along the nematic director
n is larger than
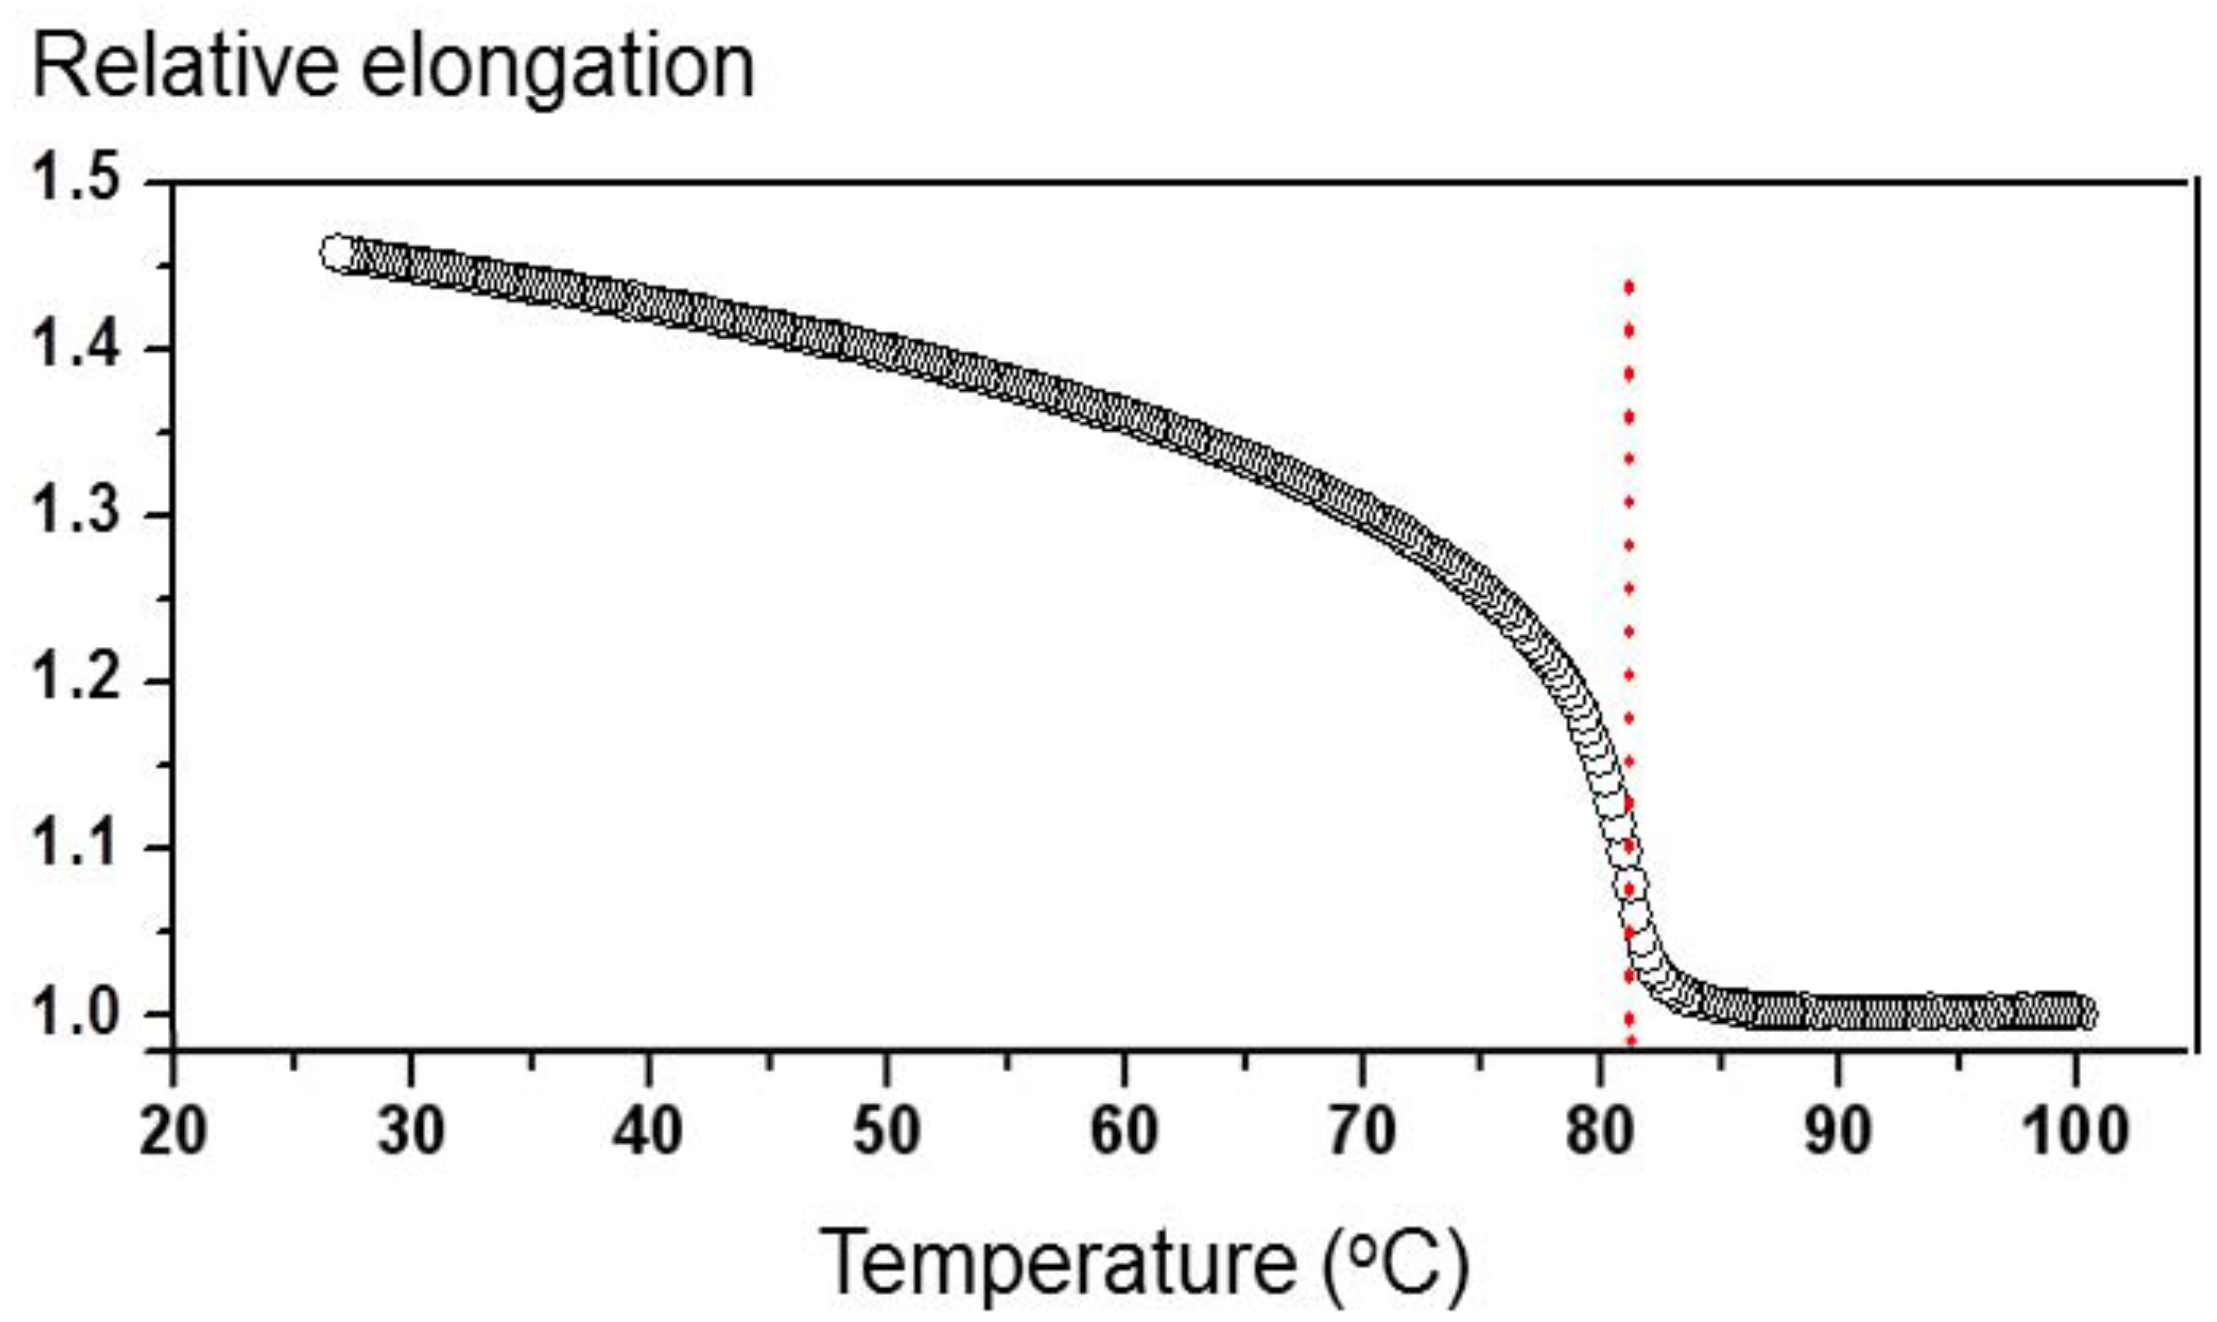
Λ. As can be seen from
Figure 1, the same modification of temperature (or
Nc) in the vicinity of
Tc produces much larger modifications of the sample length as at room temperature. Due to this, the effect is much more pronounced at
T = 75 °C.
One apparently straightforward solution of the problem is to clamp the film to prevent its contraction. However, our preliminary investigations showed that oscillations in clamped samples are indeed significantly reduced, but they do not completely vanish (see inset of
Figure 5). We assume that this is due to the structural inhomogeneities in the film, which cause some regions of the film to contract on behalf of the stretching of the others. A similar effect was recently observed during holographic recording in clamped films of azobenzene thermoplastic elastomers [
26]. One possible way to eliminate or at least reduce such problems can be to put the sample in between the glass plates.
Our results indicate that extensive systematic investigations are needed before any relevant quantitative analysis of the recording kinetics is possible. Therefore, in the following, the discussion will focus on the erasure (relaxation) kinetics. At all investigated temperatures, after an initial phase, time dependence of diffraction intensity could have been well fitted with a single-exponential decay. This decay is related to the thermally driven process of
cis-to-
trans back isomerization as given by Equation 2. Considering a linear relation between refractive index modification and concentration of the
cis isomers, Δ
ne(
r)
Nc(
r), and a quadratic dependence of the diffraction efficiency on refractive index modulation
η (Δ
ne)
2 [
24], that is valid at low diffraction efficiencies observed in our samples, one obtains
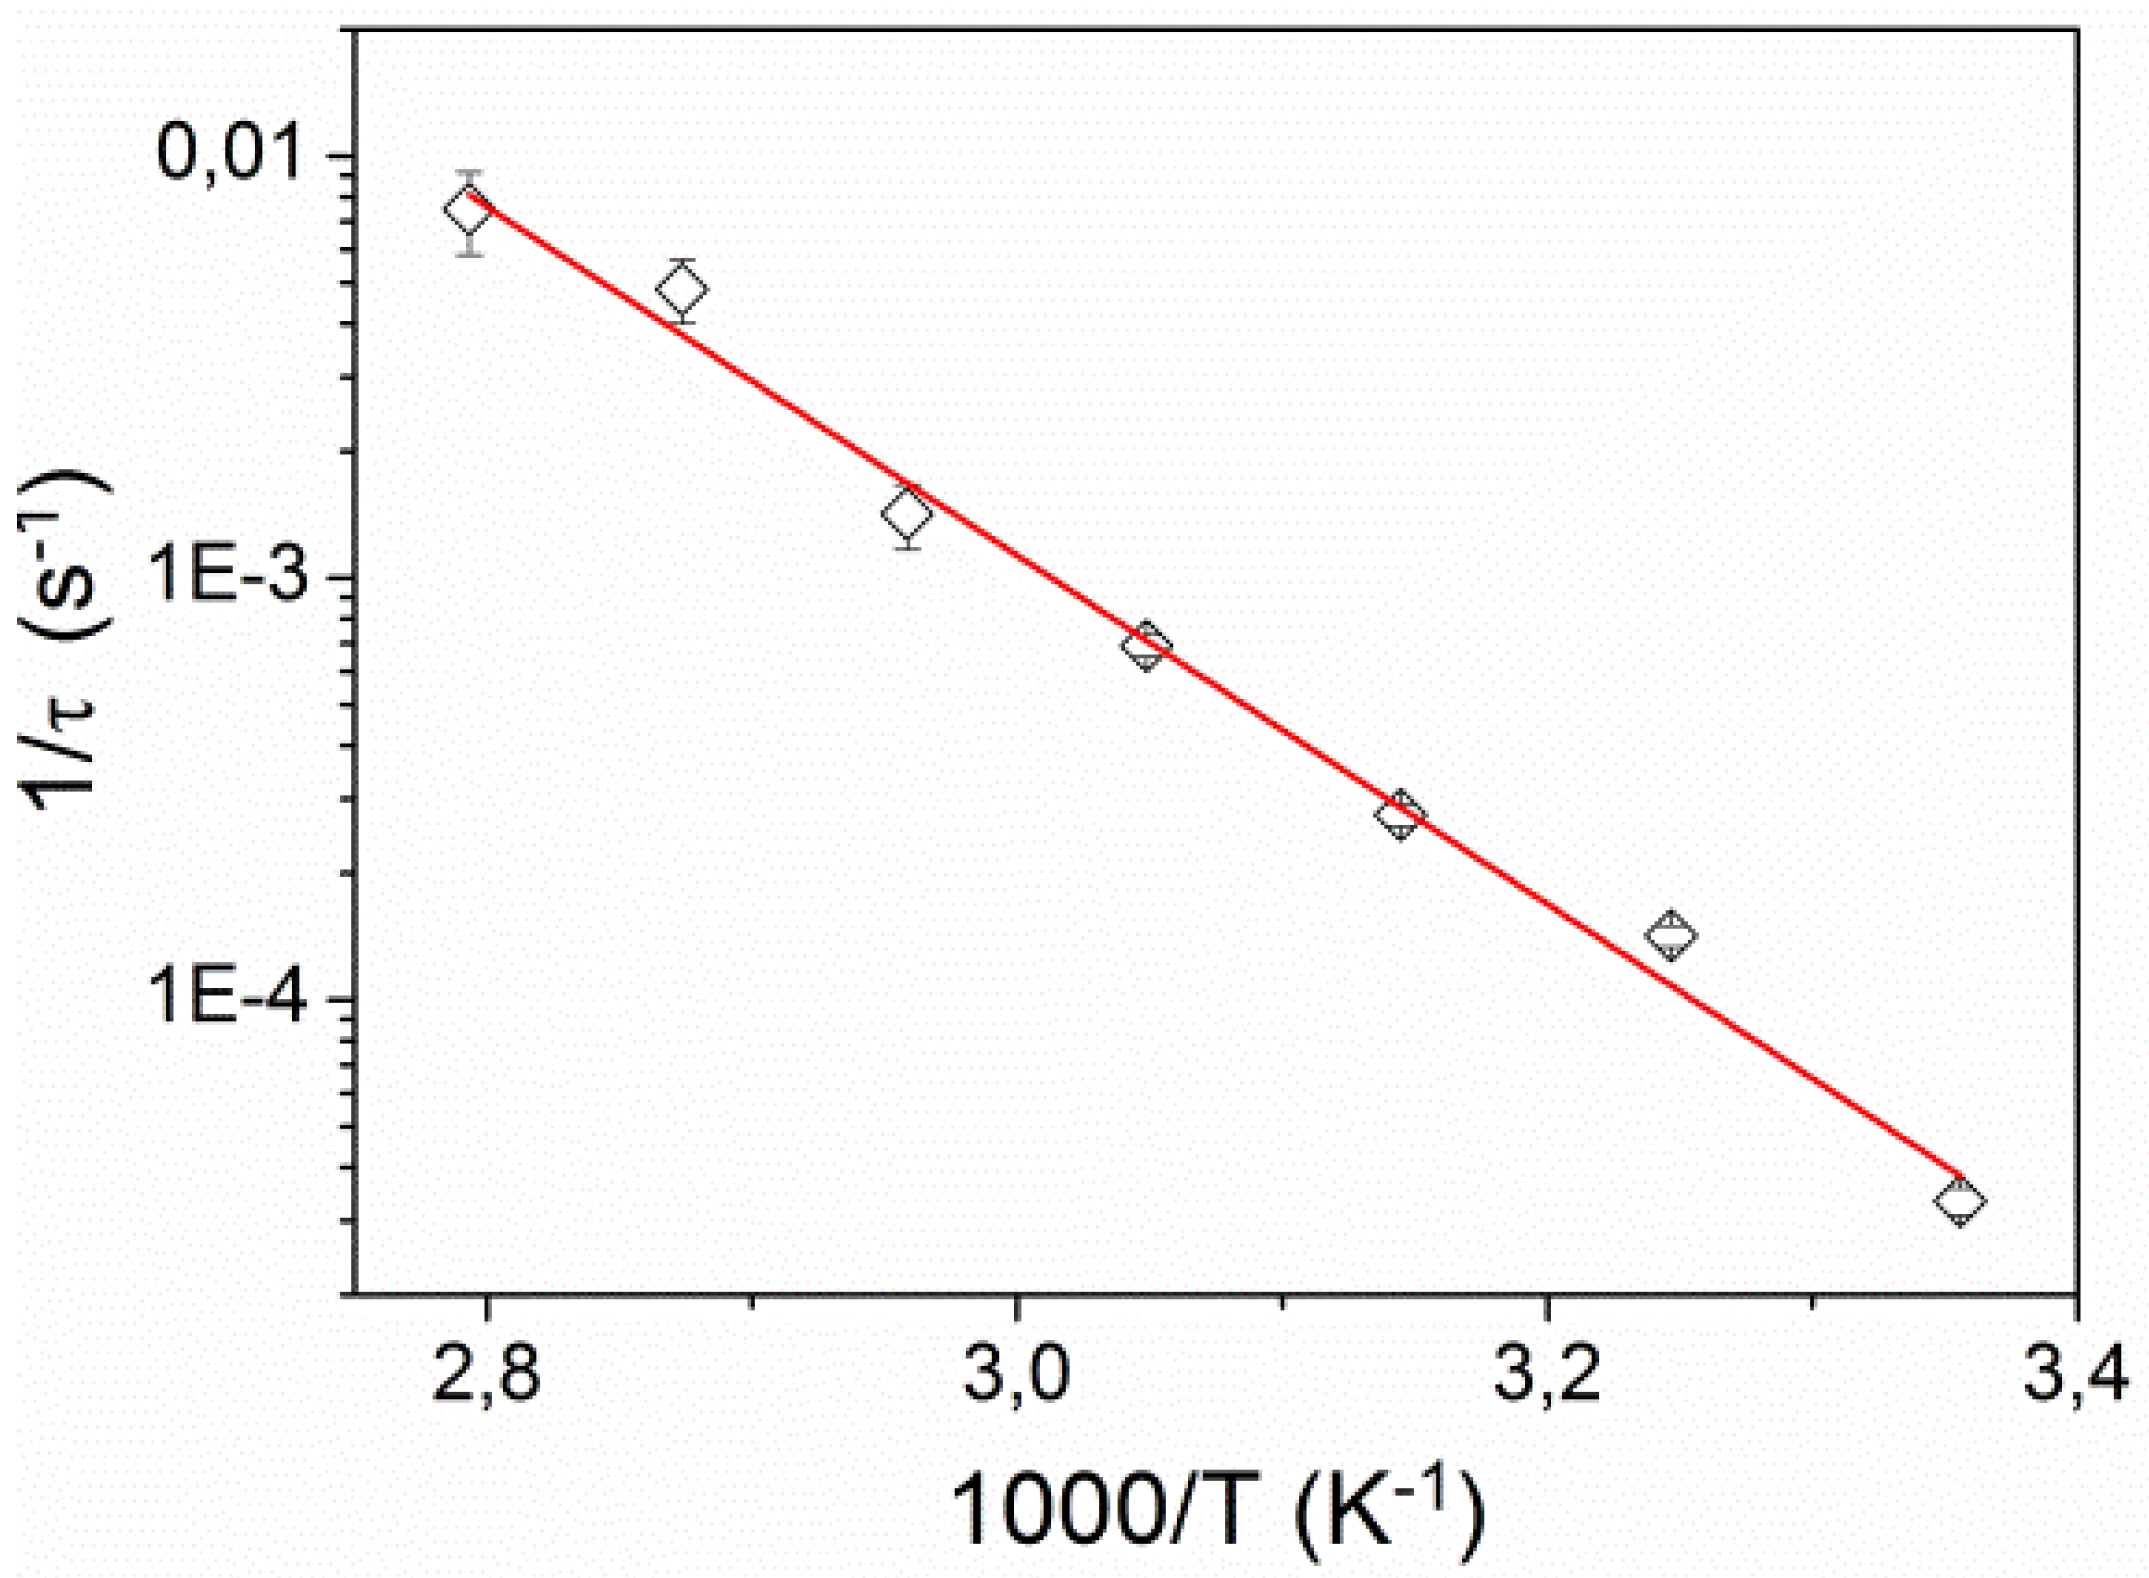
Figure 7 shows the dependence of the corresponding inverse relaxation time 1/
τ on inverse temperature. It exhibits the Arrhenius behavior
where
kB is the Boltzmann constant and
Ea is activation energy. We found
Ea = 0.87 ± 0.05 eV (83.5 ± 5 kJ/mol), which is very similar to activation energies found for
cis-to-
trans isomerization of azobenzene molecules incorporated into other LCE matrices and polymer hosts [
16,
27,
28].
Figure 7.
Inverse relaxation time 1/τ as a function of inverse temperature. The solid line is a fit to the Arrhenius relation.
Figure 7.
Inverse relaxation time 1/τ as a function of inverse temperature. The solid line is a fit to the Arrhenius relation.
The nonmonotonic relaxation kinetics (
Figure 5 and
Figure 6) observed in the interval (
Tc0 − 2.0 K) <
T <
Tc0, is in our opinion related to two properties: (i) the fact that our gratings are smeared and therefore have a low contrast, and (ii) the breakdown of the linear relationship
Nc(
r) in the vicinity of
Tc0. The conventional theoretical model for LS-LCEs assumes that
cis isomers act as impurities in the nematic phase and consequently cause a decrease of the transition temperature
Tc [
2,
3,
16]. When
Nc(
r) = 0 (in the dark), the temperature dependence of
S in our type of samples is proportional to the temperature dependence of the spontaneous elongation of the sample as shown in
Figure 1 [
22]. When
Nc(
r) > 0, the dependence
S(T − Tc) remains the same, but the value of
Tc decreases proportionally to the value of the
Nc,
i.e.,
Tc(
Nc) =
Tc0 −
βNc, where
β is a proportionality constant [
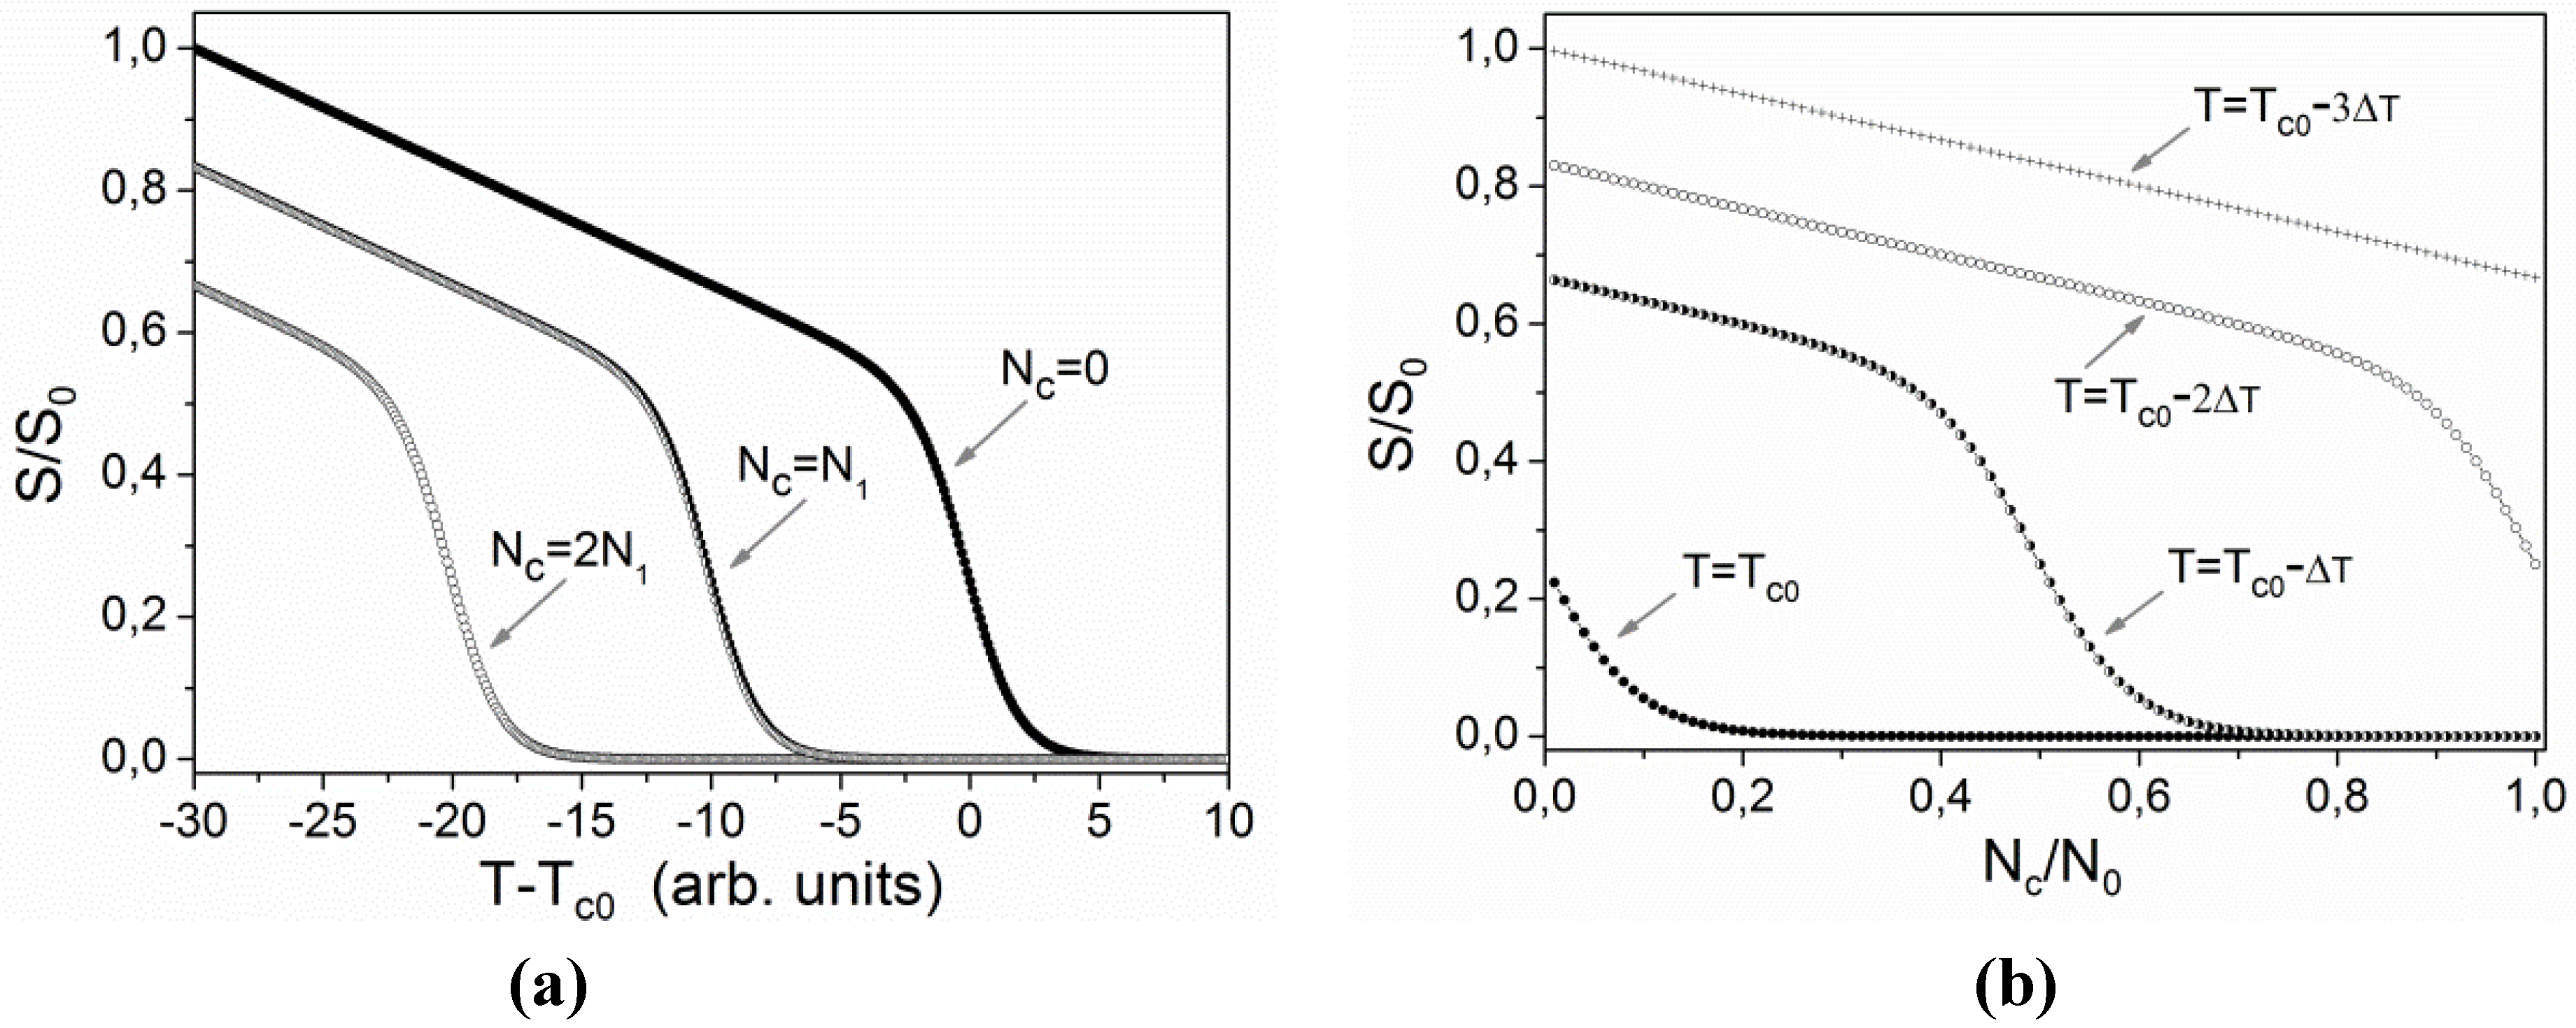
3]. The corresponding behavior is illustrated in
Figure 8a using a tilted sigmoidal function
f(
x) = (
a −
bx)/(1 + e
x), where
x(
T − Tc) and
fS, to qualitatively describe the dependence of
S(
T) in the vicinity of
Tc.
Figure 8b shows the associated dependence of
S(
Nc)/
S0, where
S0 is order parameter at some reference temperature, for four different temperatures. One can notice, that for temperatures slightly below
Tc0 the behavior of
S/
S0 as a function of
Nc/
N0 is very nonlinear. In accordance to this a derivative
dS/
dNc exhibits a pronounced maximum at some specific value of
Nc.
Figure 8.
Qualitative illustration of the effects of temperature T and concentration Nc of cis isomers on the order parameter S: (a) dependence on temperature at three fixed values of concentration; (b) dependence on concentration at four fixed temperatures.
Figure 8.
Qualitative illustration of the effects of temperature T and concentration Nc of cis isomers on the order parameter S: (a) dependence on temperature at three fixed values of concentration; (b) dependence on concentration at four fixed temperatures.
Due to smearing of the grating structure a spatial variation of
Nc, which would be in the ideal case given by Equation 3, is in reality much weaker and can be described as
where Δ
N <<
.
During the relaxation process both,
and Δ
N, decrease exponentially with time,
i.e.,
=
e
-t/τ and Δ
N(
t) = Δ
N(0)e
−t/τ. The associated spatial variation of the order parameter
S can be approximately described by the first two terms of the Taylor series expansion
where
dS/
dNc is evaluated at
. In
Figure 8b one can see that for temperatures slightly below
Tc0 (see for instance the curve for
T =
Tc0 − Δ
T) the derivative
dS/
dNc is practically zero for large values of
Nc/
N0, then at (
Nc/
N0)~0.5 it attains a maximum and at lower values of
Nc/
N0 it becomes constant. This essentially means that the same relative variation of concentration of
cis isomers
causes the largest relative variation of the order parameter Δ
S/S0 at some intermediate value of
. The refractive index modulation Δ
ne(
r,
t) is proportional to order parameter variation Δ
S(r,t) [
8]. From this it follows that, despite the fact that Δ
N(
t) in Equation 7 decays exponentially, its multiplication with
dS/
dNc, which exhibits a maximum at some specific value of
, can lead to an overall nonmonotonic dependence of the diffracted intensity during relaxation of the grating. At temperatures considerably below
Tc0 (see for instance the curve for
T =
Tc0 − 3Δ
T in
Figure 8b) the value of
dS/
dNc is practically constant and consequently Δ
S(
r,
t) also Δ
ne(
r,
t) decreases exponentially with time. We think that a similar scenario should work in all systems in which there exists a strong non-linear relation between the concentration of
cis and
trans isomers and the refractive index of the medium. However, if the transition related to the phenomenon is not continuous, the effect is much more difficult to be observed experimentally.

