Article

Flow Induced Vibration and Energy Extraction of an Equilateral Triangle Prism at Different System Damping Ratios

State Key Laboratory of Hydraulic Engineering Simulation and Safety, Tianjin University, Tianjin 300072, China
*
Author to whom correspondence should be addressed.
Energies 2016, 9(11), 938; https://doi.org/10.3390/en9110938
Submission received: 25 August 2016 / Revised: 23 October 2016 / Accepted: 3 November 2016 / Published: 10 November 2016
(This article belongs to the Special Issue Sustainable Energy Technologies)

Abstract

:
The flow induced vibration and energy extraction of an equilateral triangle prism elastically mounted in a water channel are investigated experimentally at different system damping ratios ζtotal with the constant oscillating mass Mosc and system stiffness K. A power take-off system with a variable damping function is developed. The translation-rotation equation of the vibration system deduced in the study indicates that the total oscillating mass includes the material mass, and the equivalent mass due to the rotation of the gears and rotor. Besides, increasing load resistance can result in a decrease in ζtotal when K and Mosc remain unchanged. The prism experiences, in turn, soft galloping, hard galloping 1 and hard galloping 2 with increasing ζtotal. As ζtotal increases up to 0.335, only the vortex-induced vibration is observed because the extremely high ζtotal prevents the prism from galloping. The response amplitude decreases with the increasing ζtotal. In addition, higher ζtotal promotes the galloping to start at a higher reduced velocity. The galloping characteristics of the prism, including large amplitude responses in an extremely large range of flow velocities, excellent vibration stationarity, and steady vibration frequencies, are beneficial for improving energy conversion. The prism can extract hydraulic energy for the flow velocity U > 0.610 m/s. The harnessed power Pout and the energy conversion efficiency ηout increase with increasing ζtotal in the galloping zone. The maximum Pout and ηout reach 53.56 W and 40.44%, respectively. The optimal system damping ratio for extracting energy is the maximum system damping ratio that the prism can overcome to experience stable galloping.

1. Introduction

Flow induced vibration (FIV) of a rigid cylinder on springs immersed in a steady transverse flow has been a subject of interest for the past several decades. An elastically mounted smooth circular cylinder can only undergo vortex-induced vibration (VIV) in isolated conditions [1,2,3], but non-circular sections (such as squares and triangles) can be subject to galloping [4,5,6,7].
VIV occurs due to the alternating shedding of vortices from either side of the bluff cylinder [1]. The alternating shedding of vortices gives rise to periodic changes in the pressure distribution on the cylinder surface, which indicates that the VIV of bodies is a self-excited motion. However, galloping, characterized by the large amplitude and low frequency oscillation normal to the flow, is caused by a coupling between the aerodynamic forces and the across-flow oscillation induced in the structure [8]. The periodically varying angle of attack results in periodic changes in the aerodynamic forces acting on the cylinder.
FIV is always treated as a destructive phenomenon in the civil engineering field because it can lead to the failure of the oscillating structure. Many researchers have devoted great efforts to the suppression of FIV. With an entirely opposite objective, in early studies [9,10]. Bernitsas and his colleagues developed the vortex induced vibration for aquatic clean energy (VIVACE) converter. The VIVACE unit, which captures the hydrokinetic energy in ocean currents or rivers utilizing the FIV of a cylinder or cylinder array, is an innovative energy harnessing device with a high energy density, low operable flow velocities and low maintenance cost. Besides, this device satisfies all of the requirements set by the California Energy Commission and the U.S. DOE [9]. In order to convert more hydrokinetic energy to mechanical energy and subsequently to electrical energy over broader velocity range, Chang et al. [11], Park et al. [12] and Ding [13] tried to enhance the FIV of the circular cylinder by altering the cylinder surface roughness with the help of Passive Turbulence Control (PTC). The maximum energy conversion efficiency was increased from 22% [10] to 28% [13].
Numerous publications have reported that flow around an elastically mounted circular cylinder can induce the periodic vibration of the cylinder in a certain range of flow velocities. However, non-circular section cylinders with symmetric sharp edges, such as rectangular section prisms as well as isosceles or equilateral triangular cylinders could be more susceptible to undergoing FIV because the symmetric apex angles on their surface appear to be helpful for the flow to separate from the body surface. Kluger [14] and Sorribes-Palmer et al. [15] explained the role of different dimensionless parameters in the determination of maximum energy extraction. In the last decades, the FIV of non-circular section bodies has received more and more attention from scientists. Most of the studies have concentrated on square or rectangular section bodies [16,17,18,19,20,21,22]. Nemes et al. [21] investigated the influence of the orientation of the square prism on FIV and found that the prism with a low mass ratio can undergo the combination of VIV and galloping in a narrow range of flow approaching angles. This phenomenon was also observed by Barrero–Gil and Fernandez–Arroyo [22]. In contrast to the research related to the flow past circular and rectangular section cylinders, there are limited studies that focus on a triangular cylinder immersed in a uniform flow because the triangular prism is seldom used in building structures. Several researchers have emphasized the influence of the wind direction and the cross-sectional shape on the flow past a triangular cylinder [23,24,25,26]. They demonstrated that the fluctuating cross-flow forces connected with the vortex shedding vary significantly with the incident flow orientation and the aspect ratio. Furthermore, Alonso et al. [27,28] comprehensively studied the transverse galloping stability of triangular prisms based on the Glauert-Den Hartog criterion and dynamical tests. They concluded that the stability to transverse galloping of triangular cross-section cylinders depends on the cross-sectional geometry and the angle of attack. In addition, Lin Ding et al. [6] investigated the FIV perpendicular to the flow of an equilateral triangular prism on springs by means of numerical calculations and indicated that the FIV of an elastically mounted equilateral triangular cylinder can be divided into the initial and upper branches of VIV, the transition branch from the VIV branch to the galloping branch, and the galloping branch, regarding the amplitude and frequency responses. Xu and Ou [7] also performed a numerical investigation of the FIV of elastically mounted cylinders with different sections and concluded that the FIV of the square and triangle prisms change from vortex induced vibration to galloping as the ratio of the natural frequency to the Strouhal frequency (the vortex shedding frequency of the fixed cylinder) decreases.
As indicated by previous researchers, the triangular prism on springs can also undergo strong FIV in an extremely broad range of flow velocities. The prism enters into galloping mode when the velocity of the incident flow increases beyond a threshold value, and its response amplitude increases with increasing flow velocities in the galloping branch. Consequently, the use of a triangular prism as an alternative oscillator to extract energy from a fluid flow has obvious advantages. However, as far as we know, almost all of the researches on the FIV of triangular prisms were investigated by means of wind tunnel tests [8,25,26,27,28] or numerical simulations [6,7,23,24]. There is a lack of experimental data concerning the characteristics and application of the FIV of elastically mounted triangle cylinders immersed in the water flow. However, there are great differences between the dimensionless parameters (including M*, A*, Ur and ζ) in the air and water environments.
The objective of the present study was to examine the FIV characteristics of an equilateral triangle prism elastically mounted in water at high damping ratios as well as the effects of the damping ratio on the FIV and energy conversion. In Section 2, the experimental apparatus is described, and the translation-rotation equation of the vibration system is deduced. The results of free decay experiments are presented in Section 3. In Section 4, the results of FIV tests and the energy extraction are discussed. The conclusions are summarized at the end.

2. Experimental Apparatus and Mathematical Model

2.1. Water Channel

The experiments are performed in the recirculating water channel at the State Key Laboratory of Hydraulic Engineering Simulation and Safety of Tianjin University. The channel has a main test section of 1 m in width and 1.5 m in depth. The water in the channel is forced by an impeller powered by a 90 kW variable frequency motor, which provides flow velocities in the range from 0 to approximately 1.6 m/s, corresponding to Reynolds Numbers (Re = U·D/ν where ν is the kinematic viscosity of water) ranging from 0 to 1.29 × 10⁵.

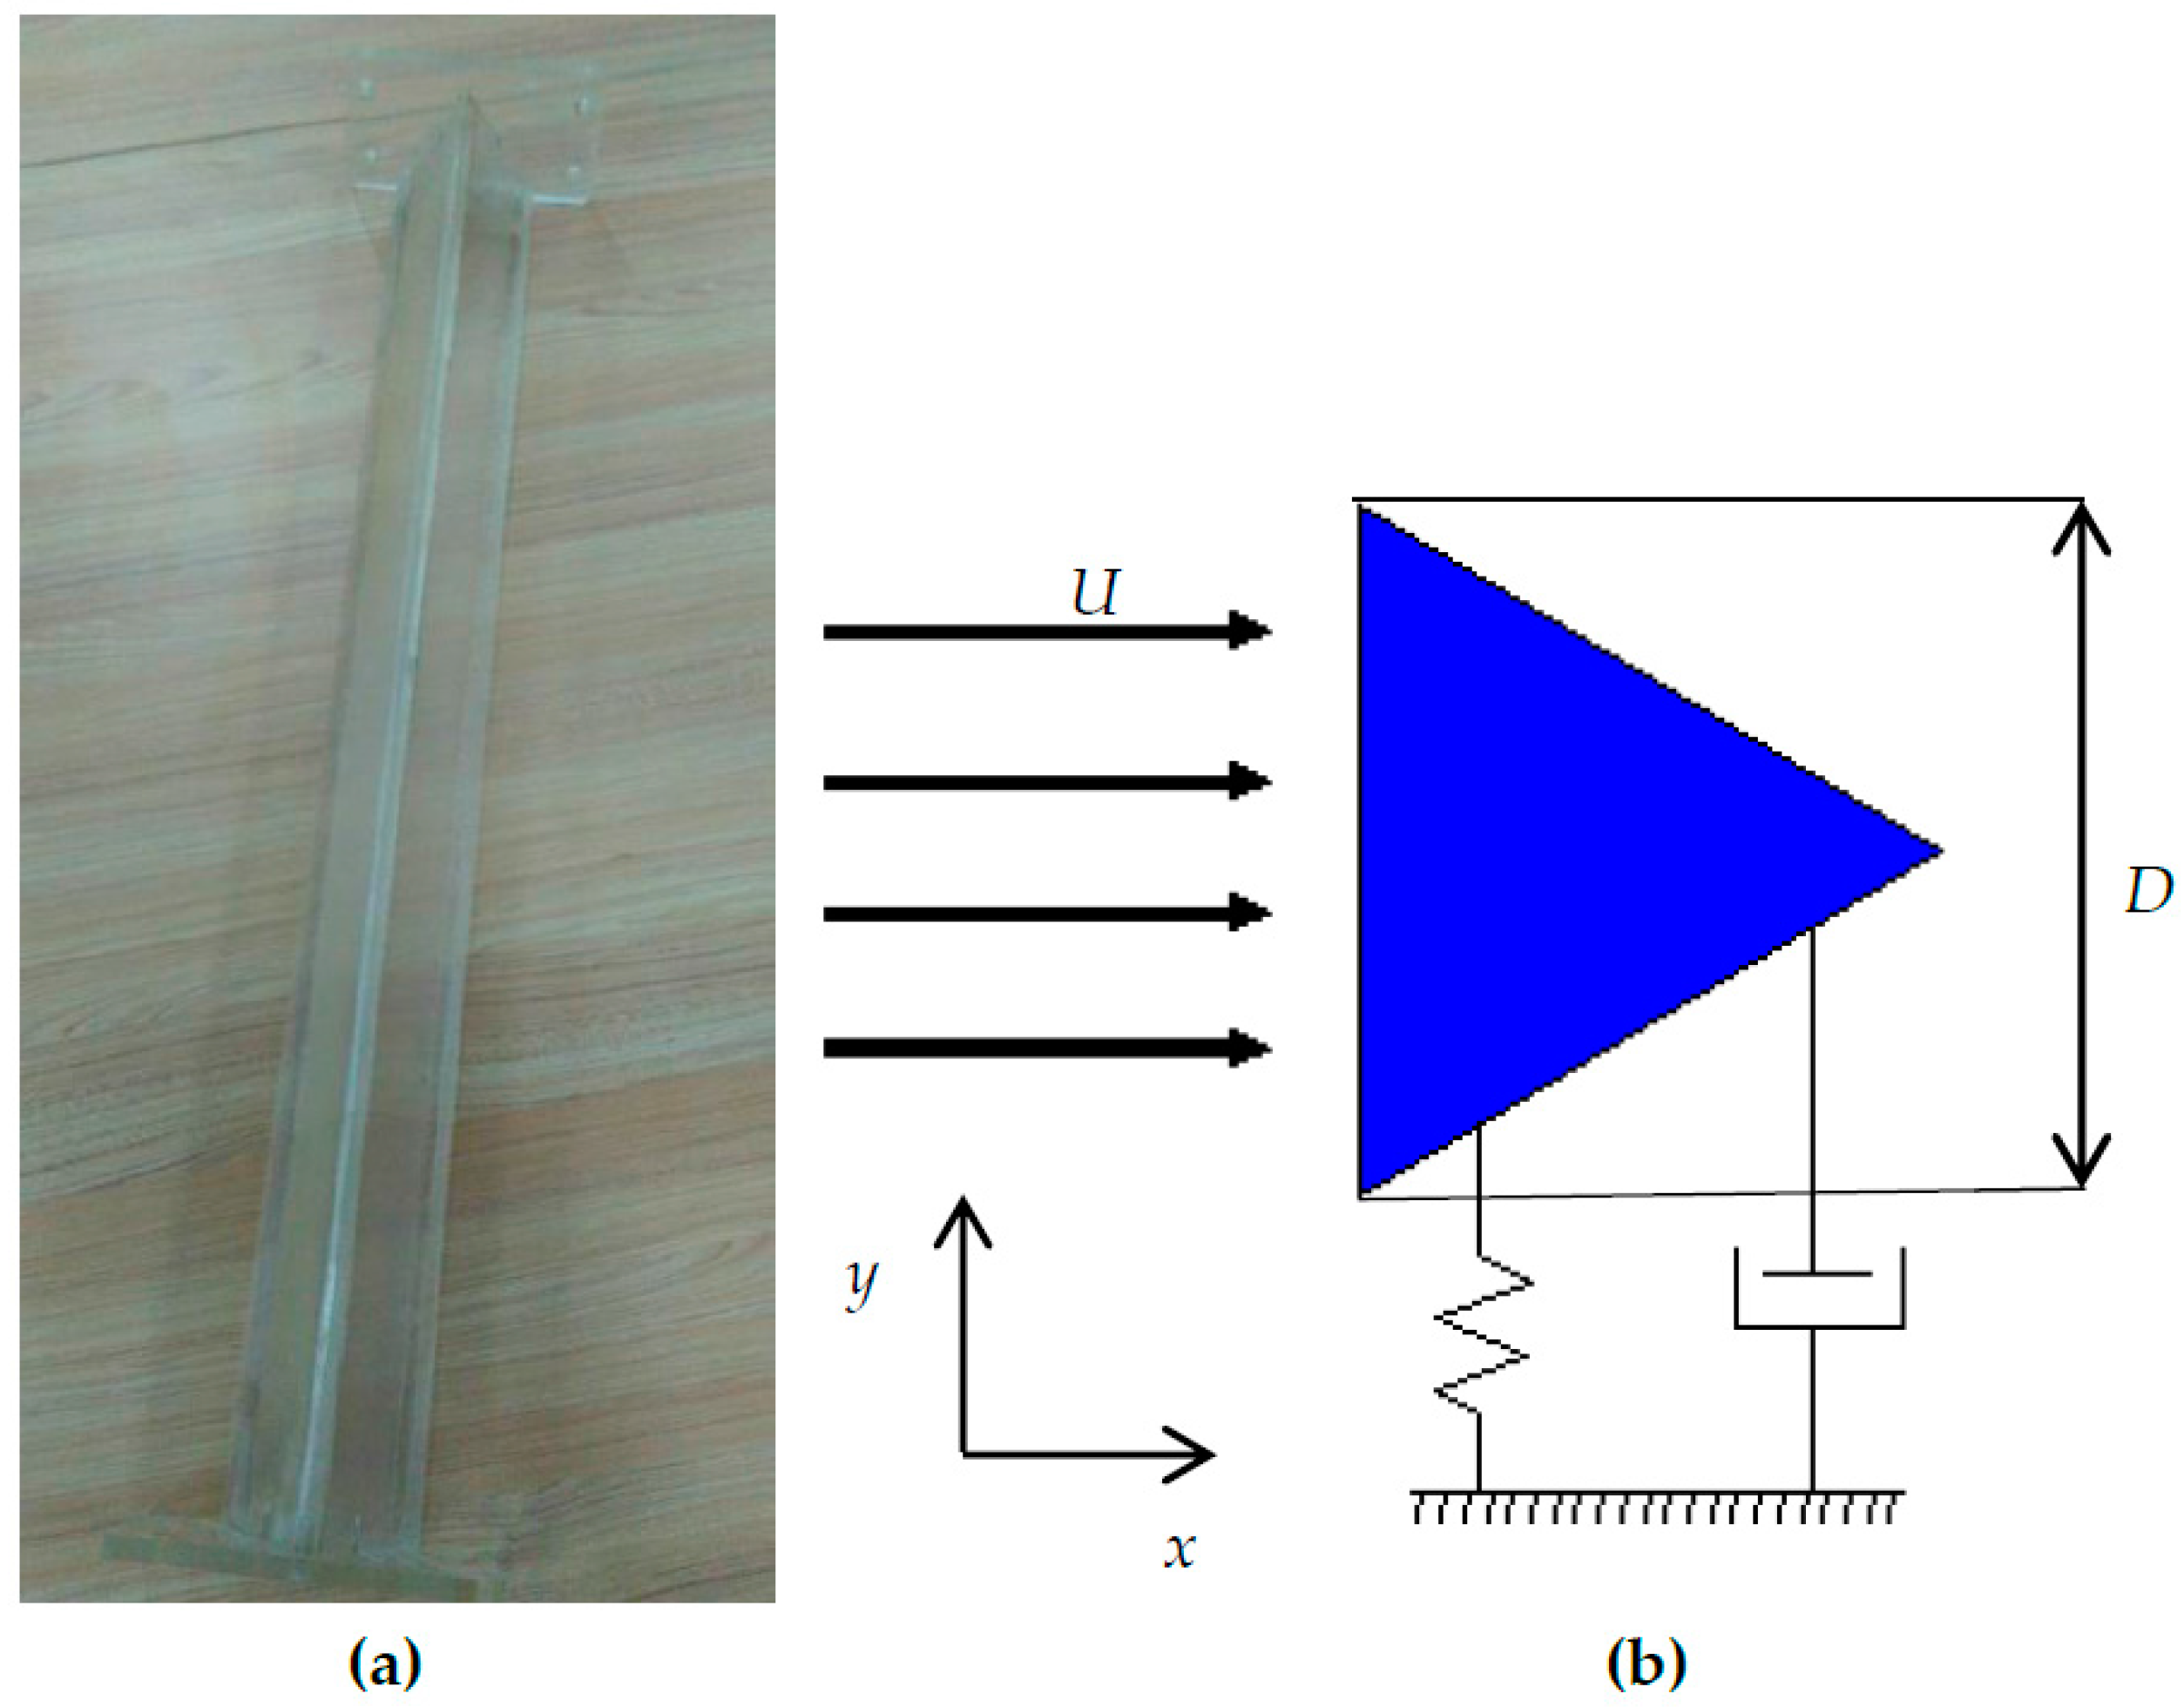
2.2. Vibration System

Figure 1 shows the vibration system consisting of Parts 1–8 as identified and listed in Table 1. The test prism is mounted on side struts and constrained to move in the y direction (perpendicular to the flow direction) using linear bearings. The side struts are made of duralumin plate, and each side strut with dimensions of 1.51 × 0.1 × 0.006 m is 1.616 kg in weight. The side struts, the power take-off system and the linear bearings are connected rigidly by the connection structure suspended by tension springs. Besides, the upper and the lower ends of the spring are fixed on the vertical points to keep the spring in vertical condition. The springs are always under tension in the test process.
The equilateral triangle prism in the present investigation is made of polymethyl methacrylate. Endplates with dimensions of 0.18 × 0.11 × 0.01 m are attached on the both ends of the prism to induce parallel shedding at high Reynolds number tests [29,30,31], as shown in Figure 2a. The oscillator is mounted on the side struts. A gap of 34 mm is maintained between the walls of the water channel and the side struts. The cross section of the equilateral triangular prism is 0.1 m in length. One of the side edges is placed facing the incident flow, as depicted in Figure 2b, because triangular cross-section prisms are prone to galloping instability when the base of the triangle is facing the flow [8]. The oscillator particulars are listed in Table 2. Note that the displaced fluid mass is defined as m d = ρ D 2 L 3 / 4 .
The vertical displacement measurement is performed using a non-contact magnetic induction displacement transducer with a measuring range from 0 to 800 mm. The accuracy of the displacement transducer is within ±0.05%, giving a displacement measurement resolution of 0.001%FS. The flow velocity is measured using the Pitot tube with a differential pressure transmitter. The accuracy of the differential pressure transmitter is within ±0.1% of the 6 kPa linear range available, and its resolution is within 0.01% FS. The voltage measurement is done by directly connecting the generator to the data acquisition system. All the data are recorded for a time interval of 30 s at a 50 Hz sampling rate.

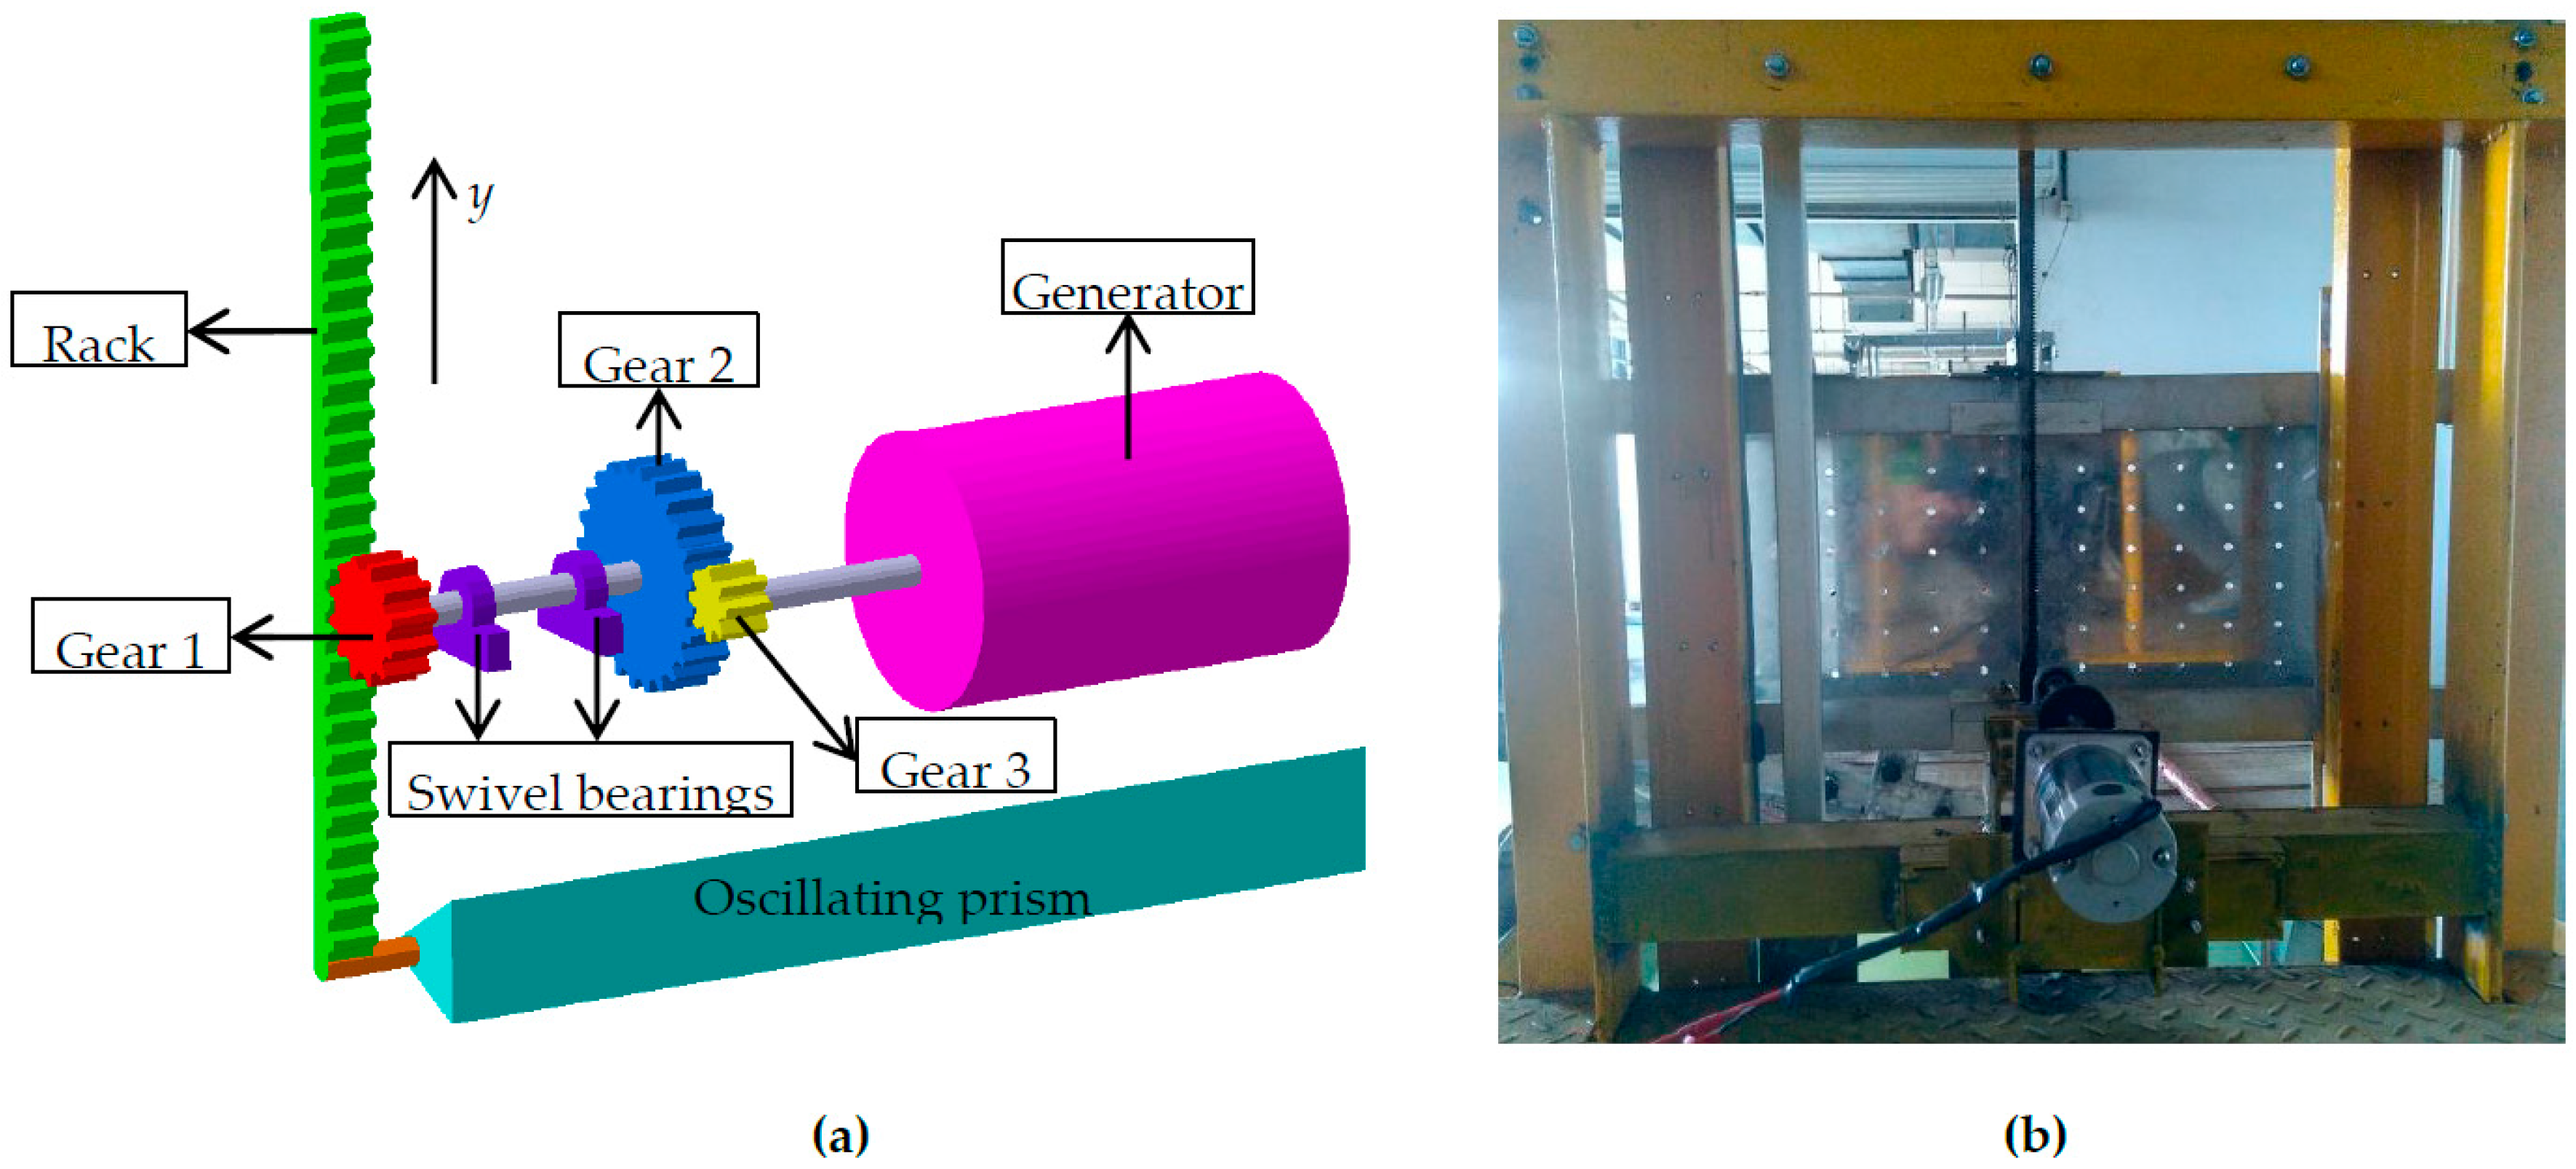
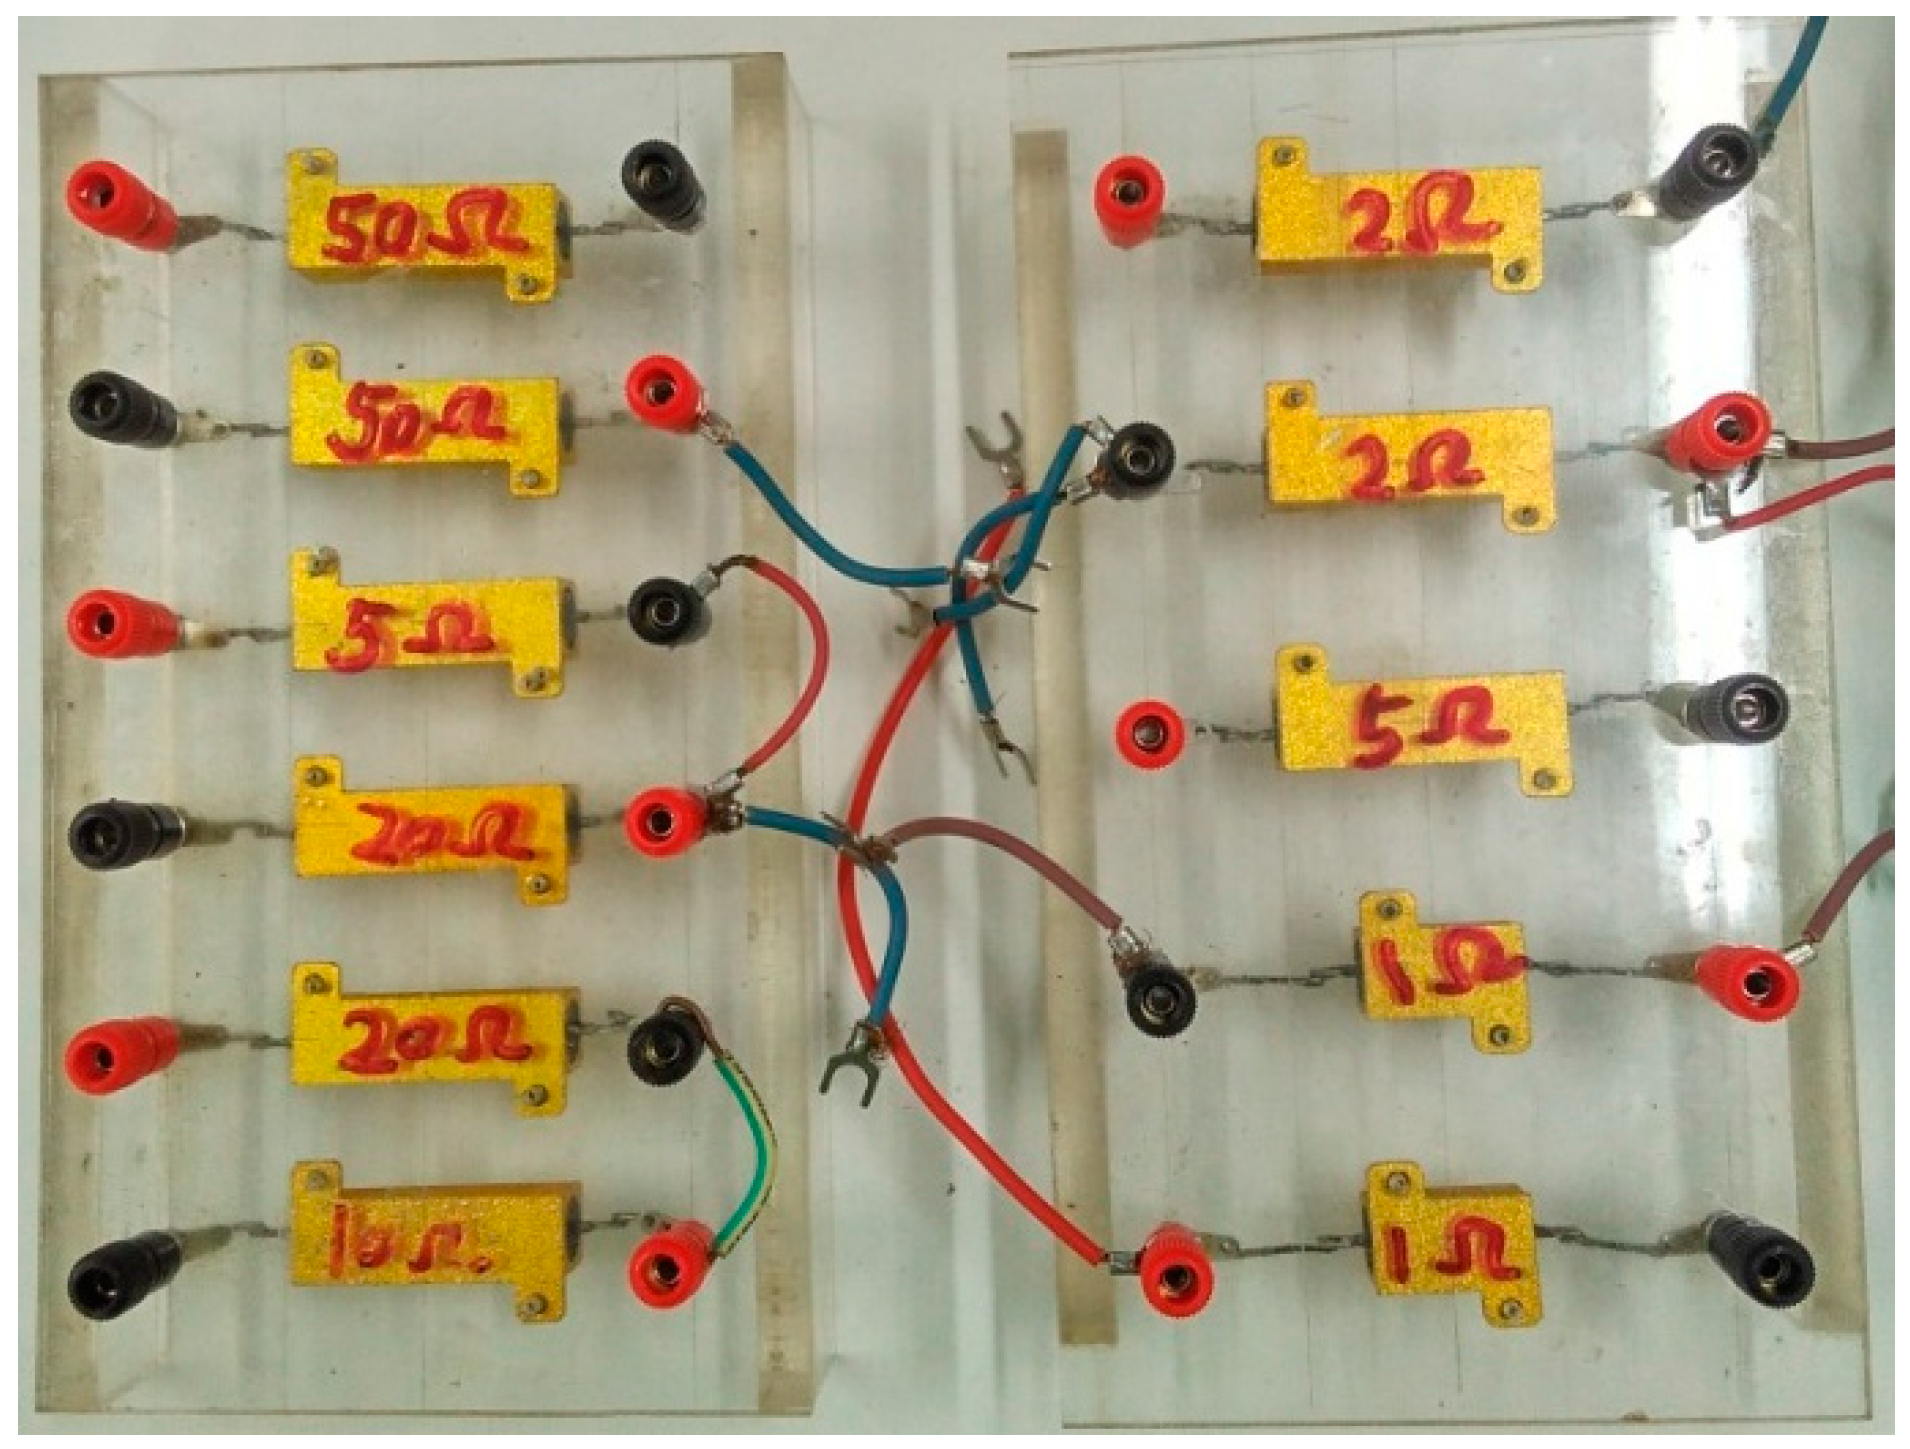
2.3. Power Take-off System

When a generator runs, the wire loop cutting across the magnetic induction lines yields an induction current. However, the electromotive force due to the induction current always resists the relative motion between the stator and rotor. A power take-off system with the function of variable damping is developed depending on this principle, which is shown in Figure 3.
The power take-off system consists of a rack, three gears with different diameters, and a generator. The rack mounted on the connection structure meshing with Gear 1 converts the linear oscillatory mechanical motion of the prism in FIV to a rotational oscillatory motion of Gear 1. Gear 1 connects with Gear 2 via swivel bearings, and Gear 3 mounted on the generator shaft meshes with Gear 2. Gear 1, Gear 2 and Gear 3 constitute a variable speed system.
Assuming that both shafts are rigid and that there is no slip in the transmission system, the rack is equal to Gear 1 in linear velocity due to the engagement between the rack and Gear 1, which is:
V 1 = y ˙
where Vi and y ˙ are linear velocities of Gear i and the rack (prism), respectively.
Gear 1 and Gear 2 revolve around the same shaft. Correspondingly, their angular velocities are equal:
θ ˙ 1 = θ ˙ 2
where θ ˙ i denotes the angular velocity of Gear i.
The linear velocity of Gear i can be calculated by:
V i = r i θ ˙ i
where ri is the radius of Gear i.
Substituting Equations (3) into (2) yields:
V 1 r 1 = V 2 r 2
From Equations (1) and (4), the linear velocity of Gear 2 can be expresses as:
V 2 = r 2 r 1 V 1 = r 2 r 1 y ˙
Due to the relation that Gear 3 meshes with Gear 2, the linear velocity of Gear 3 can be written as:
V 3 = V 2 = r 2 r 1 y ˙
Gear 3 and the generator rotor revolving around the generator shaft yields:
θ ˙ g = θ ˙ 3 = V 3 r 3 = r 2 r 1 r 3 y ˙
where θ ˙ g is the angular velocity of the generator rotor.
The linear velocity of the generator rotor is given by the following equation:
V g = r g θ ˙ g = r 4 r 2 r 1 r 3 y ˙
where Vg denotes the linear velocity of the generator rotor, and rg is the radius of the generator rotor.
The induced voltage of the generator is defined as:
E = BlVg
where B is the magnetic flux density, and l is the length of the wire cutting the a magnetic field perpendicularly to the field lines.
The induced current is defined as:
I = E R 0 + R L
where R0 denotes the inner resistance of the generator, and RL is the external load resistance.
The electromotive force created by the relative movement of a circuit and a magnetic field is defined as:
Fmag = BIl
By substituting Equations (8)–(10) into (11), the electromotive force can be rewritten as:
F m a g = B 2 l 2 R 0 + R L V g = B 2 l 2 R 0 + R L × r g r 2 r 1 r 3 y ˙
The electromotive force torque of the generator Tmag is proportional to the rotor radius and the electromotive force, which is:
T m a g = r g F m a g = B 2 l 2 R 0 + R L × r g 2 r 2 r 1 r 3 y ˙
The movement of the vibration system consists of the linear vibration of the oscillator and the rotational oscillatory motion of the power take-off system.
The rotational oscillatory motion equation of the generator is given by:
J 3 θ ¨ 3 + r 3 2 c 3 θ ˙ 3 + J g θ ¨ g + r g 2 c g θ ˙ g = T 3 T m a g
where Ji and Jg are respectively the rotational inertia of the ith wheel and the rotor, ci and cg are respectively the damping coefficients due to the frictional losses on the ith wheel and on the rotor, T3 is the torque on Gear 3 (supplied by Gear 2), θ ¨ i and θ ¨ g are respectively the angular acceleration of the ith wheel and the rotor.
The generator rotor and Gear 3 revolve around the same shaft. Thus:
θ ¨ 3 = θ ¨ g
Due to Equations (7) and (15), Equation (14) becomes:
( J 3 + J g ) θ ¨ 3 + ( r 3 2 c 3 + r g 2 c g ) θ ˙ 3 = T 3 T m a g
The rotational oscillatory motion equation of Gear 1 and Gear 2 is given by the following equation (not taking into account the rotational inertia and the damping coefficient of the swivel bearings):
J 1 θ ¨ 1 + r 1 2 c 1 θ ˙ 1 + J 2 θ ¨ 2 + r 2 2 c 2 θ ˙ 2 = T 1 T 2
where T1 is the torque supplied to Gear 1 induced by the linear motion of the prism in FIV, and T2 is the torque transmitted to Gear 2.
In the same manner, the Equation (17) can be simplified as:
( J 1 + J 2 ) θ ¨ 1 + ( r 1 2 c 1 + r 2 2 c 2 ) θ ˙ 1 = T 1 T 2
Assuming that there is no energy loss in Gear 2 and Gear 3, their power is coincident:
T 2 θ ˙ 2 = T 3 θ ˙ 3
Gear 2 is equal to Gear 3 in linear velocity due to the engagement:
r 2 θ ˙ 2 = r 3 θ ˙ 3
Then:
T 2 = θ ˙ 3 θ ˙ 2 T 3 = r 2 r 3 T 3
θ ¨ 1 = θ ¨ 2 = r 3 r 2 θ ¨ 3
Substituting Equations (21) and (22) into (16) yields:
T 2 = r 2 r 3 [ r 2 r 3 ( J 3 + J g ) θ ¨ 1 + r 2 r 3 ( r 3 2 c 3 + r g 2 c g ) θ ˙ 1 + T m a g ]
Substituting Equations (23) into (18) yields:
T 1 = [ J 1 + J 2 + ( r 2 r 3 ) 2 ( J 3 + J g ) ] θ ¨ 1 + [ r 1 2 c 1 + r 2 2 c 2 + ( r 2 r 3 ) 2 ( r 3 2 c 3 + r g 2 c g ) ] θ ˙ 1 + r 2 r 3 T m a g
The force exerted on Gear 1 by the rack is given by:
F 1 = T 1 / r 1
As was assumed in [9], when the cylinder is in FIV, its motion can be approximated by the following linear equation:
m o s c y ¨ + c s t r u c t u r e y ˙ + K y = F y
where mosc denotes the material mass of the vibration system including the oscillator, side struts, the connection structure, endplates and 1/3 tension springs [9,10], y is the displacement perpendicular to the incident flow and the cylinder axis, cstructure is the damping coefficient due to the frictional losses on the linear bearings, K is the system spring stiffness, Fy is the force exerted by the fluid on the body surface in the y-direction.
Considering the feedback force from Gear1 (equal to F1), the linear equation can be rewritten as:
m o s c y ¨ + c s t r u c t u r e y ˙ + K y = F y F 1
The angular acceleration of the prism can be expressed as:
y ¨ = r 1 θ ¨ 1
and its linear velocity is given by:
y ˙ = r 1 θ ˙ 1
Substituting the Equations (24), (25), (28) and (29) into (27) yields the translation-rotation equation of the vibration system, which is:
[ m o s c + J 1 + J 2 r 1 2 + ( r 2 r 1 r 3 ) 2 ( J 3 + J g ) ] y ¨ + [ c s t r u c t u r e + r 1 2 c 1 + r 2 2 c 2 r 1 2 + ( r 2 r 1 r 3 ) 2 ( r 3 2 c 3 + r g 2 c g ) ] y ˙ + r 2 r 1 r 3 T m a g + K y = F y
Based on Equation (13), Equation (30) can be rewritten as:
[ m o s c + J 1 + J 2 r 1 2 + ( r 2 r 1 r 3 ) 2 ( J 3 + J g ) ] y ¨ + [ c s t r u c t u r e + r 1 2 c 1 + r 2 2 c 2 r 1 2 + ( r 2 r 1 r 3 ) 2 ( r 3 2 c 3 + r g 2 c g ) + ( r g r 2 r 1 r 3 ) 2 B 2 l 2 R 0 + R L ] y ˙ + K y = F y
Equivalent mass due to the rotation of the gears and rotor is defined as:
m e q u = J 1 + J 2 r 1 2 + ( r 2 r 1 r 3 ) 2 ( J 3 + J g )
As shown in Equation (32), the equivalent mass is associated with the radius and the rotational inertia of the gears and rotor.
The total system damping coefficient ctotal can be expressed as:
c t o t a l = c s t r u c t u r e + c t r a + c g e n + c h a r n
The transmission damping coefficient ctra is due to friction in the gear system, the generator and bearings:
c t r a = r 1 2 c 1 + r 2 2 c 2 r 1 2 + ( r 2 r 1 r 3 ) 2 ( r 3 2 c 3 + r g 2 c g )
The generator damping coefficient cgen is due to the generator internal resistance R0. charn is the damping coefficient due to the external load resistance RL used to harness energy. Then:
c g e n + c h a r n = ( r g r 2 r 1 r 3 ) 2 B 2 l 2 R 0 + R L = λ 1 R 0 + R L
where λ is defined as the deceleration coefficient associated with the radius of the gears and rotor, which is:
λ = ( B l r g r 2 r 1 r 3 ) 2
The generator damping coefficient due to the generator internal resistance is a function of the load resistance. The equivalent mass mequ and the deceleration coefficient λ can be chosen to verify the translation-rotation equation indirectly, which will be shown in Section 3.
Thus, Equation (31) can be rewritten as:
( m o s c + m e q u ) y ¨ + ( c s t r u c t u r e + c t r a + c g e n + c h a r n ) y ˙ + K y = F y
As shown in Equation (37), the total oscillating mass of the vibration system Mosc includes the material mass mosc, and the equivalent mass mequ due to the rotation of the gears and rotor. Thus, the mass ratio of the vibration system can be defined as:
M * = M o s c m d
For a given permanent magnet generator, the parameters including the magnetic flux density B, the length of the wire loop L, the rotor radius rg and the generator internal resistance R0 are constants. The variation of the deceleration coefficient λ and the load resistance RL can change the total damping coefficient ctotal thus varying the total damping ratio ζ t o t a l = c t o t a l / 2 M o s c K , as revealed in Equation (35). However, to examine the effects of the system damping ratio ζtotal on the FIV and energy conversion of an equilateral triangle prism in water, the system stiffness and the total oscillating mass should remain unchanged when the ζtotal varies. Thus, the variation of the total damping ratio is implemented by adjusting the load resistance RL in the present study.

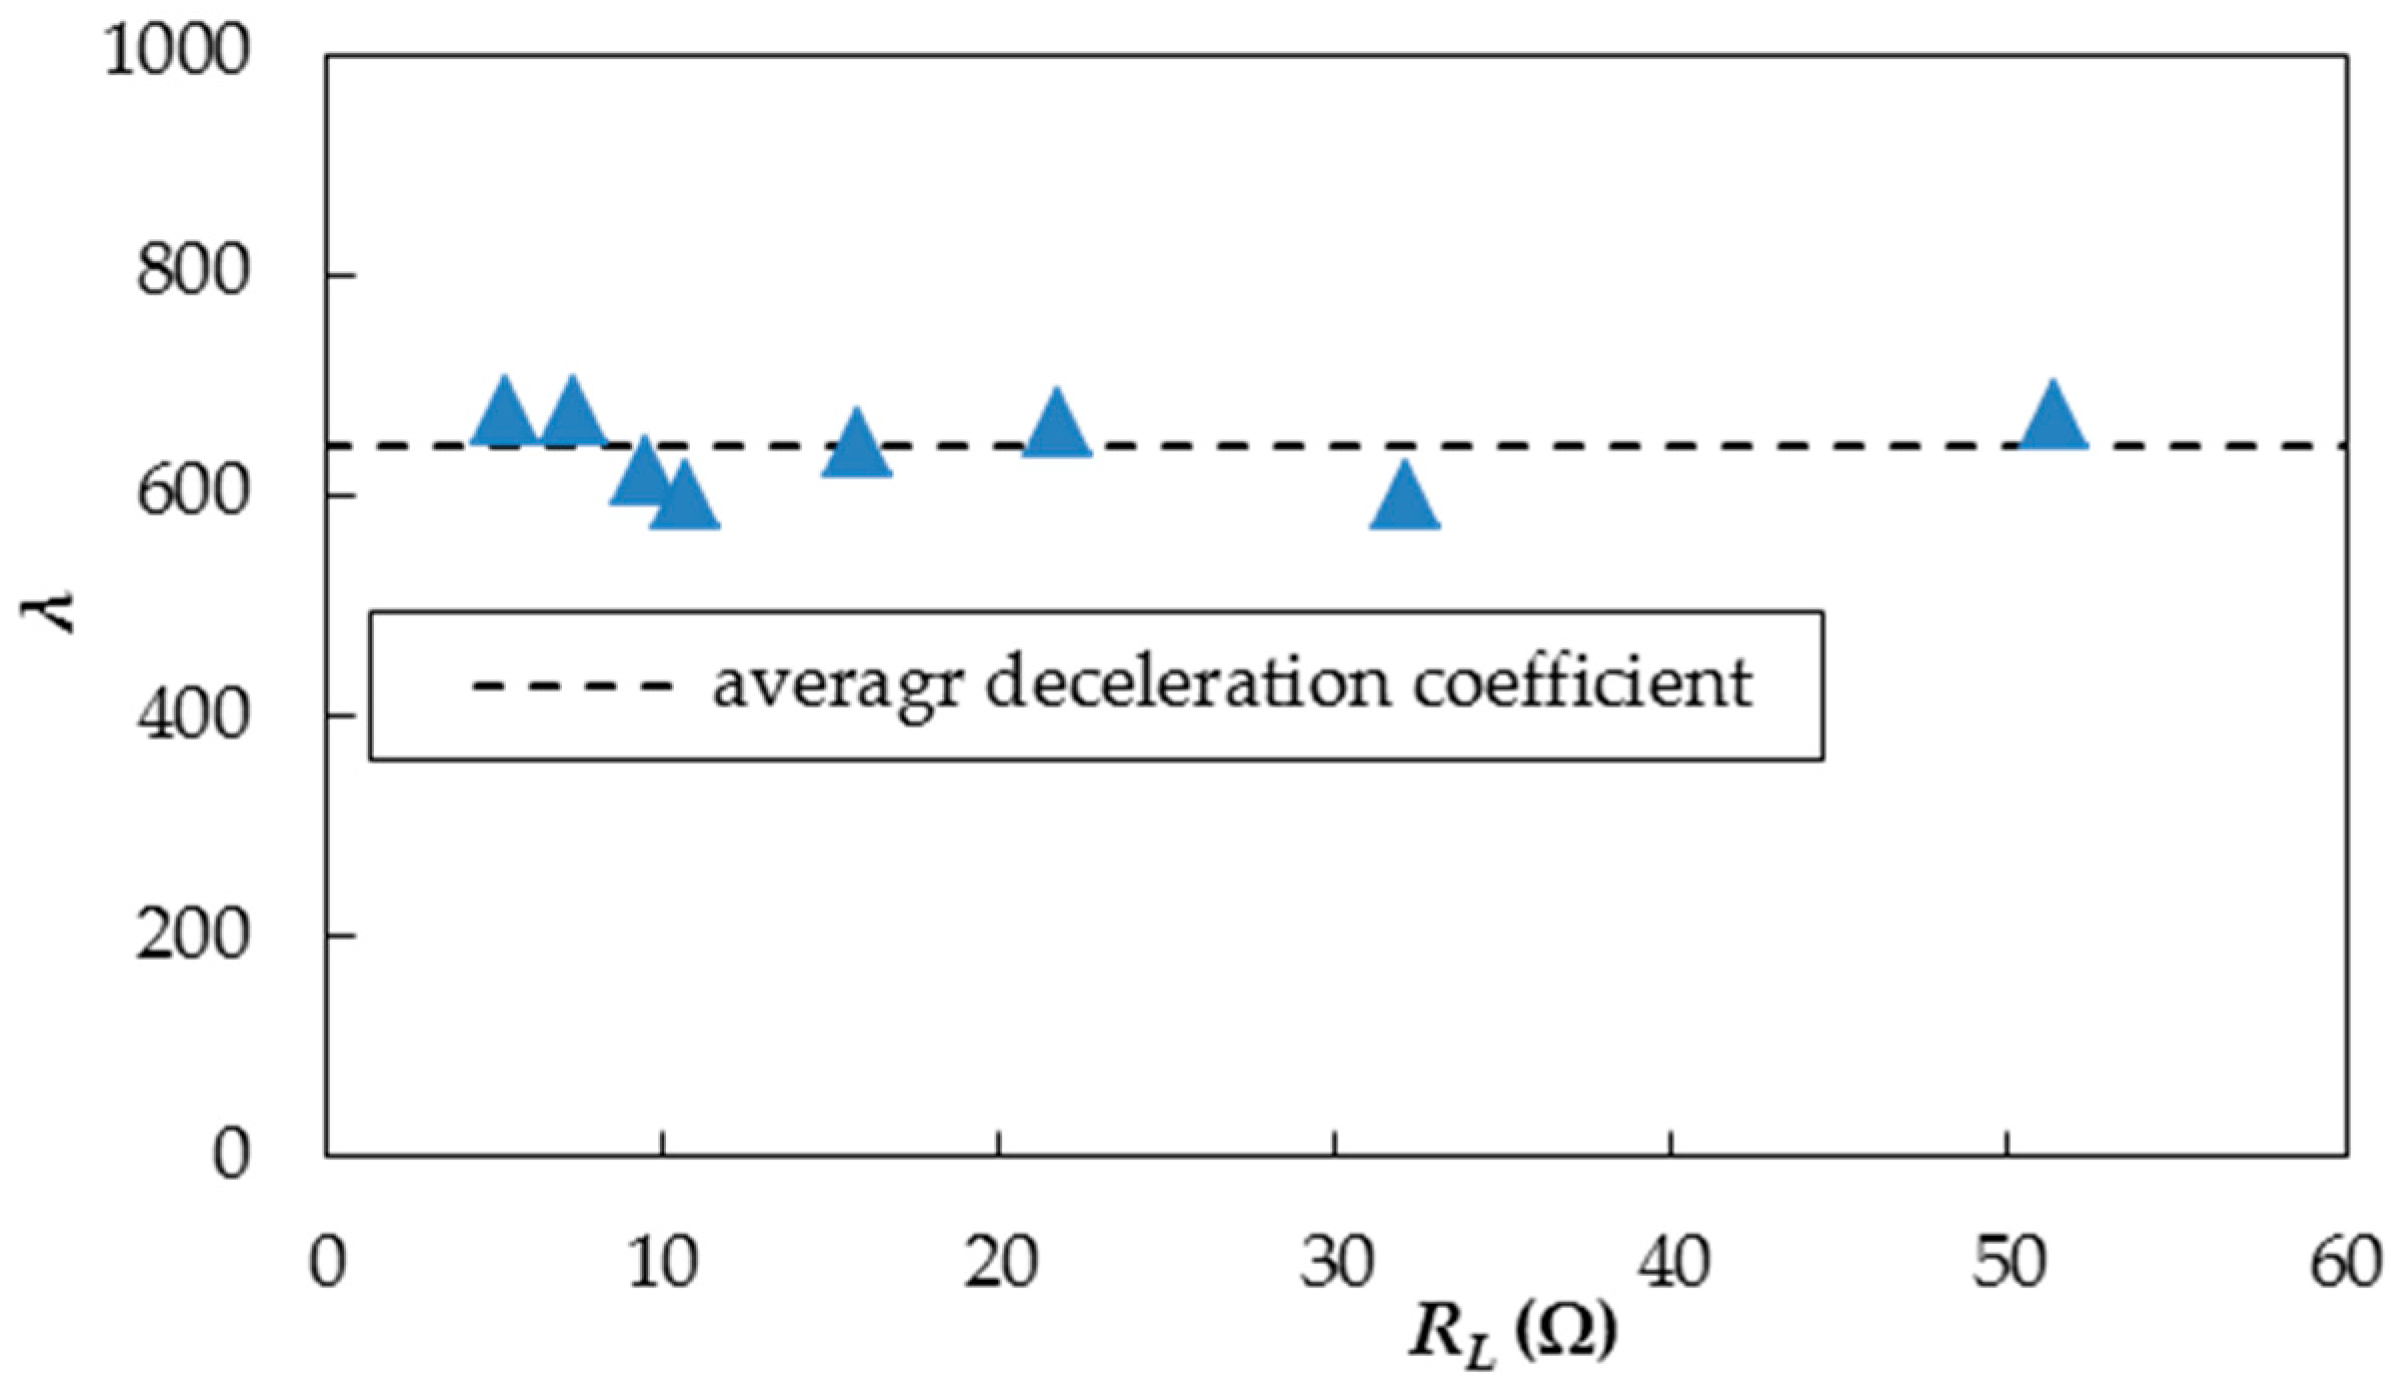
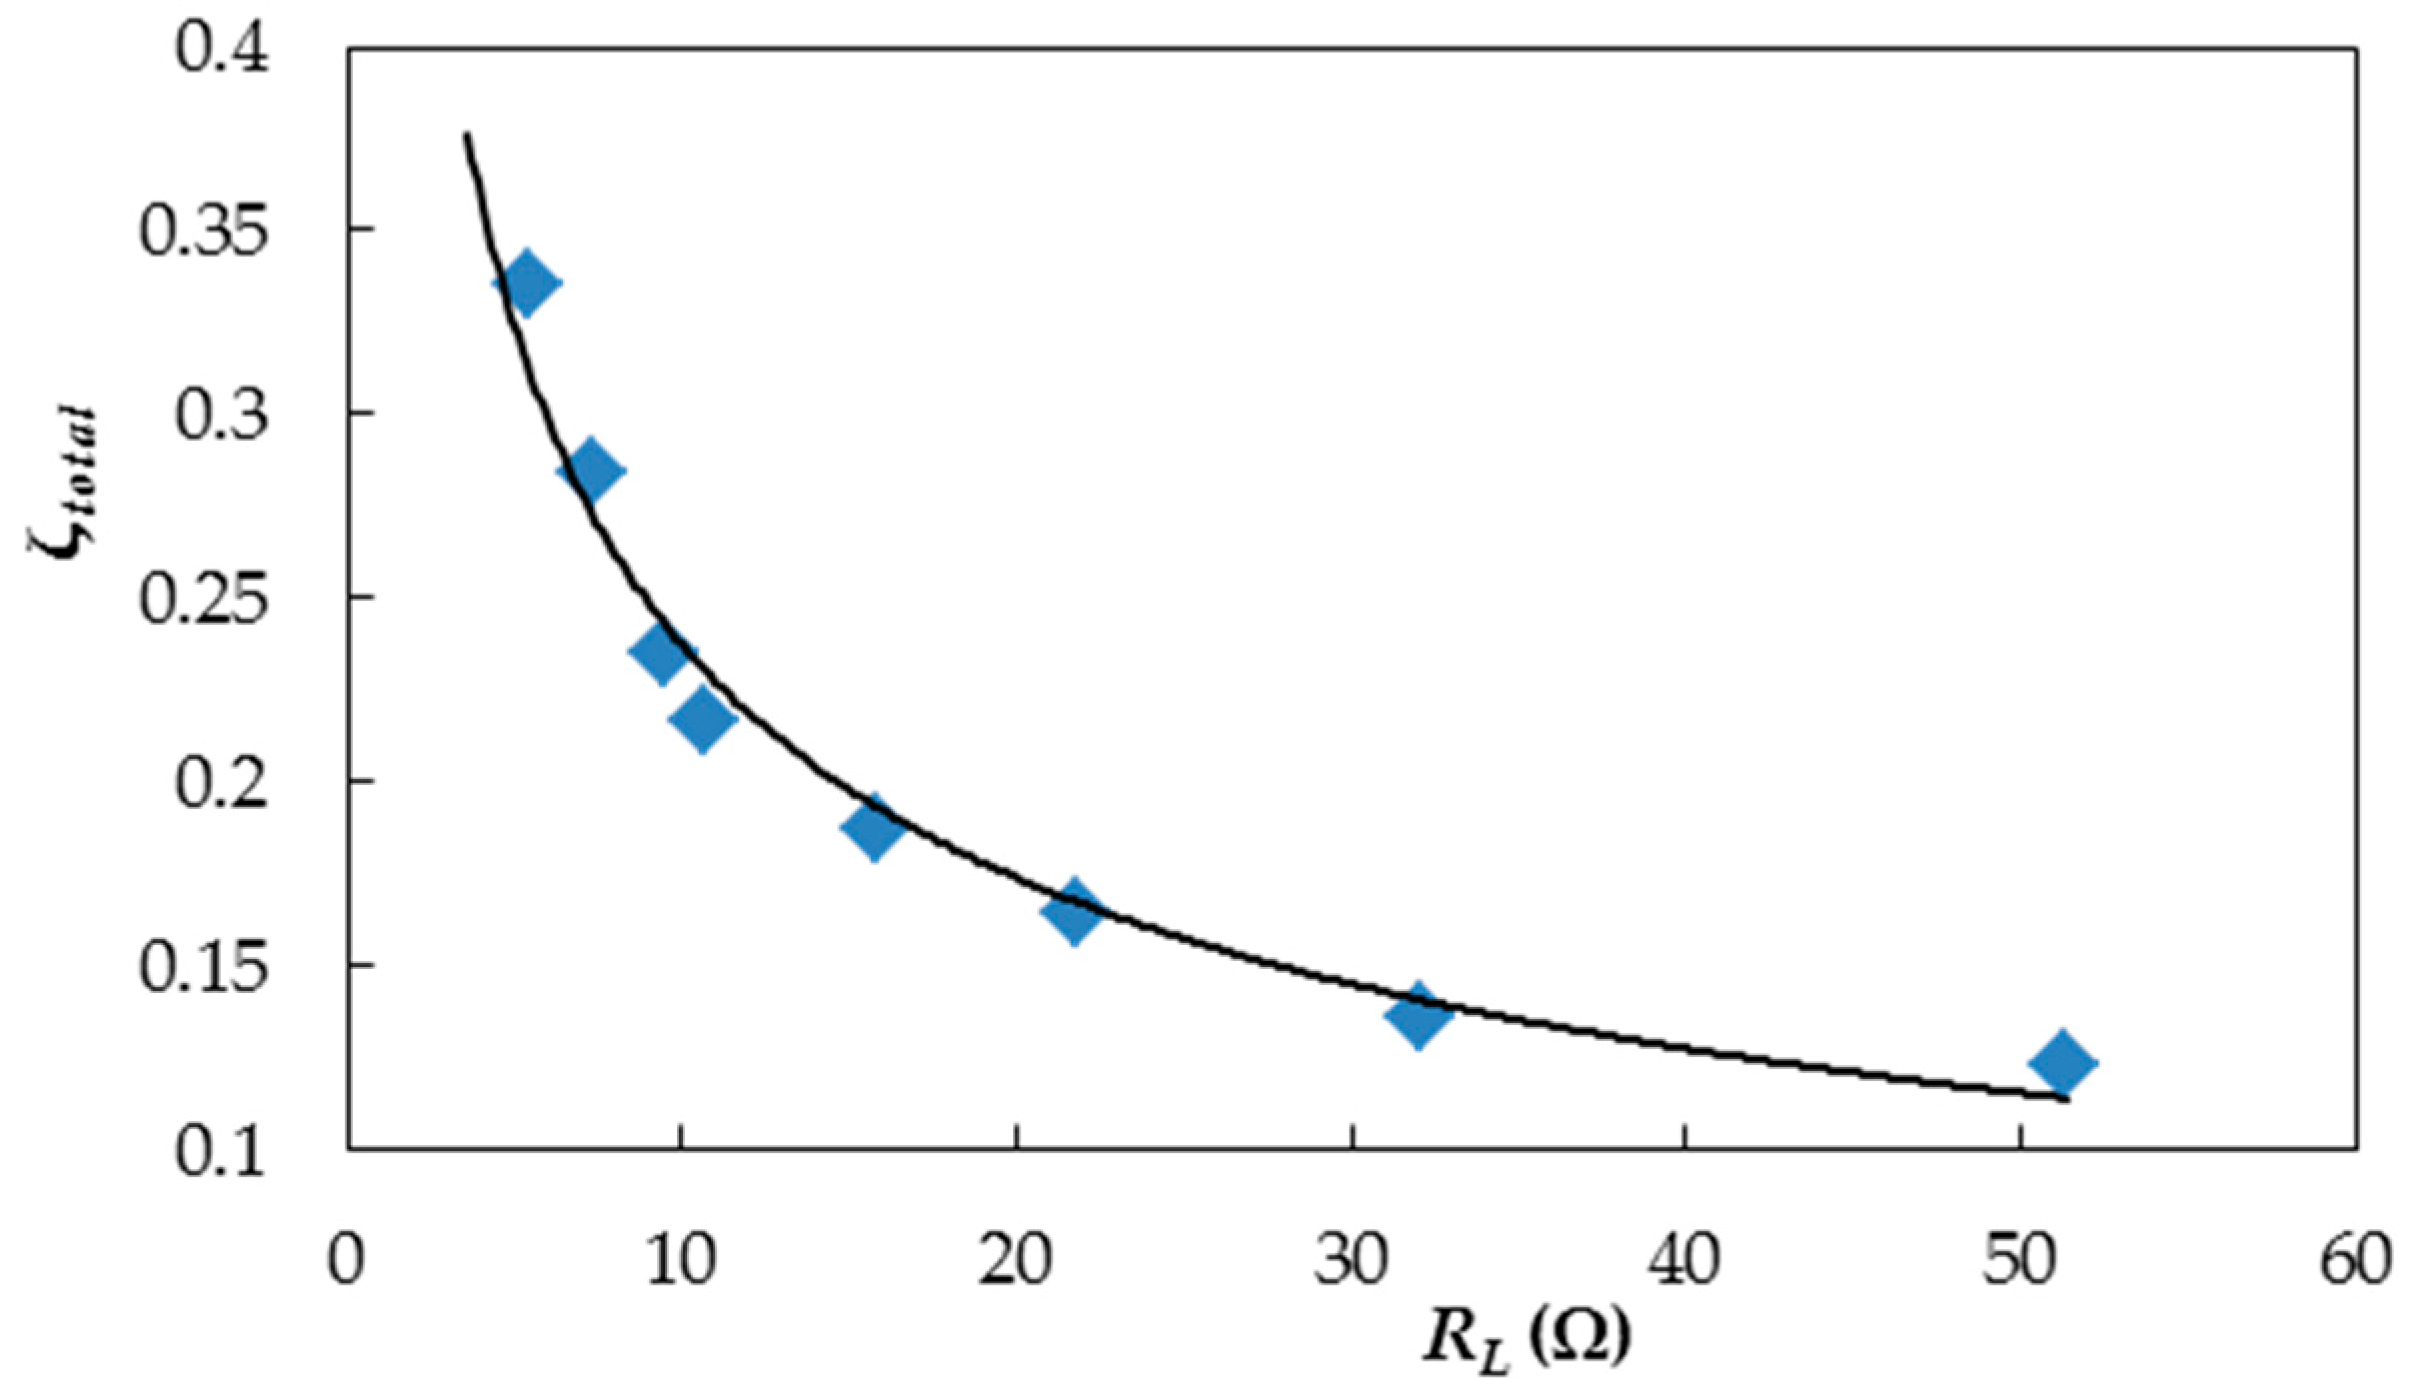
3. Free Decay Damping Experiment

The purpose of free decay damping experiments is to verify the translation-rotation equation deduced in the present investigation and to obtain the total system damping ratio and the natural frequency of the vibration system with different load resistance RL. The high-power resistors with different resistance are chosen in the present study, which are shown in Figure 4. The maximum and minimum resistance values of resistors are 50 Ω and 1 Ω, respectively. The variation of RL is conducted by the parallel and series connection of resistors. All the damping tests are performed at K = 1228 N/m.
The equivalent mass mequ and the deceleration coefficient λ can’t be obtained depending on Equations (32) and (36) because the generator used in the present research does not provide the rotor radius rg, the magnetic flux density B, and the length of the wire loop l. However, mequ and λ can be judged to be constants because, for a given vibration system with a permanent magnet generator, the parameters of the gears including ri and Ji as well as the generator parameters including B, l, Jg and rg are constants. Accordingly, mequ and λ calculated by the results of free decay damping test can be used to validate the translation-rotation equation.
Free decay damping experiments with different RL are conducted in air. RL ranges from 5.39 to 51.37 Ω. For each RL case, free decay tests are carried out four times, and the results are determined using a simple averaging method.
The damping ratio ζtotal can be determined using the logarithmic decrement method depending on the test results, which can be expressed as:
ζ t o t a l = ln η 2 π = 1 2 π ln ( A i A i + 1 )
where Ai is the amplitude of the ith peak.
The natural frequency of the vibration system is extracted using FFT for the time histories of the displacement of free decay experiment.
In addition, the natural frequency of the vibration system can be expressed as:
f n , a i r = 1 2 π K M o s c
The system damping ratio ζtotal is given by:
ζ t o t a l = c t o t a l 2 M o s c K
The free decay experiments conducted in air can determine the damping ratio of the vibration system ζtotal as well as the natural frequency of the vibration system in air fn,air. Substituting K and fn,air into Equation (40) can yield the total oscillating mass Mosc thus resulting in the equivalent mass mequ = Moscmosc. The system damping coefficient ctotal can be calculated by substituting ζtotal, Mosc and K into Equation (41). For the open circuit (O/C) case where the load resistance RL goes to infinity, the electrical losses due to the inner resistance are zero. Consequently, the damping tests performed in air for the open circuit case provides data to calculate the sum of cstructure due to the frictional losses on the linear bearings plus ctra due to friction in the gear system. The tests conducted for the closed circuit case provides data to calculate ctotal.
The measured value of the generator inner resistance R0 is 2.1 Ω. The equivalent mass mequ, the deceleration coefficient λ and the system damping ratio ζtotal versus the load resistance RL are plotted in Figure 5, Figure 6 and Figure 7, respectively. The experiment results are listed in Table 3.
As shown in Figure 5 and Figure 6, the equivalent mass mequ and the deceleration coefficient λ remain approximately unchanged as the load resistance RL ranges from 5.39 to 51.37 Ω. The maximum relative errors of mequ and λ are respectively 3.2% and 7% indicating the translation-rotation equation derived in the present investigation is reasonable.
As presented in Figure 7, the damping ratio of the vibration system ζtotal decreases with the increasing load resistance RL, which indicates that adjusting RL can change the system damping ratio while the system stiffness K and the total oscillating mass Mosc remain unchanged. This is of great importance for examining the effects of the damping ratio on the FIV and energy conversion of a cylinder on springs.
The average of the total oscillating mass listed in Table 3, Mavg,osc = 27.286 kg, is selected to calculate the total mass ratio of the vibration system, yielding M* = Mavg,osc/md = 6.36. Besides, the average of the nature frequency is adopted to obtain the reduced velocity and the response frequency ratio.

4. Results and Discussion

To examine the FIV characteristics and the energy conversion of an equilateral triangle cylinder on springs in water, a series of FIV experiments for the prism with nine sets of system damping ratios are carried out at K = 1228 N/m based on the power take-off system with the function of variable damping. All the experiments are performed at increasing the flow speed. The FIV response of the prism, which is influenced by extensive vibration system parameters, such as mass, stiffness and damping, has a large impact on the energy extraction. The present investigation focuses on the characteristics of the FIV of the prism at high damping ratio and on the effects of the damping ratio on the FIV and energy output. The system damping ratios ζtotal used in the FIV tests are listed in Table 3. In the present study, the reduced velocity Ur is introduced, which is defined as:
U r = U / ( f n , a i r D )
where U is the flow velocity. The reduced velocity Ur is often used as the x-axis on plots in investigations on the FIV of a circle cylinder because the expression of experimental results in dimensionless form help to reduce the number of parameters and therefore to collapse many test cases into the same plot.

4.1. Amplitude and Frequency Responses

The maximum amplitude ratio A* = A/D and the frequency ratio f* = fosc/fn,air versus reduced velocity Ur along with the corresponding fluid velocity U and the Reynolds number Re for all ζtotal cases are plotted in Figure 8a,b, respectively. The maximum amplitude ratio A* = A/D is the average of all the peaks of oscillation over 30 s, and the response frequency of the prism is extracted using FFT for the time histories of displacement. Note that dashed lines in Figure 8 denote prism response with hard excitation where an externally initial threshold amplitude is imposed.
Figure 8 shows that the maximum amplitude ratio A* is reduced with increasing ζtotal. This is expected as the mechanical energy in the vibration system, which is extracted from the hydrokinetic energy of the fluid flow, is dissipated more with higher ζtotal [15]. Besides, the galloping of the prism presents, in turn, the soft galloping (SG), the hard galloping 1 (HG1), and the hard galloping 2 (HG2) with increasing ζtotal. Soft galloping is defined as the self-initiated galloping, while hard galloping requires an externally imposed initial threshold amplitude [12]. The amplitude and frequency characteristics of the equilateral triangle prism for each ζtotal are summarized as follows:
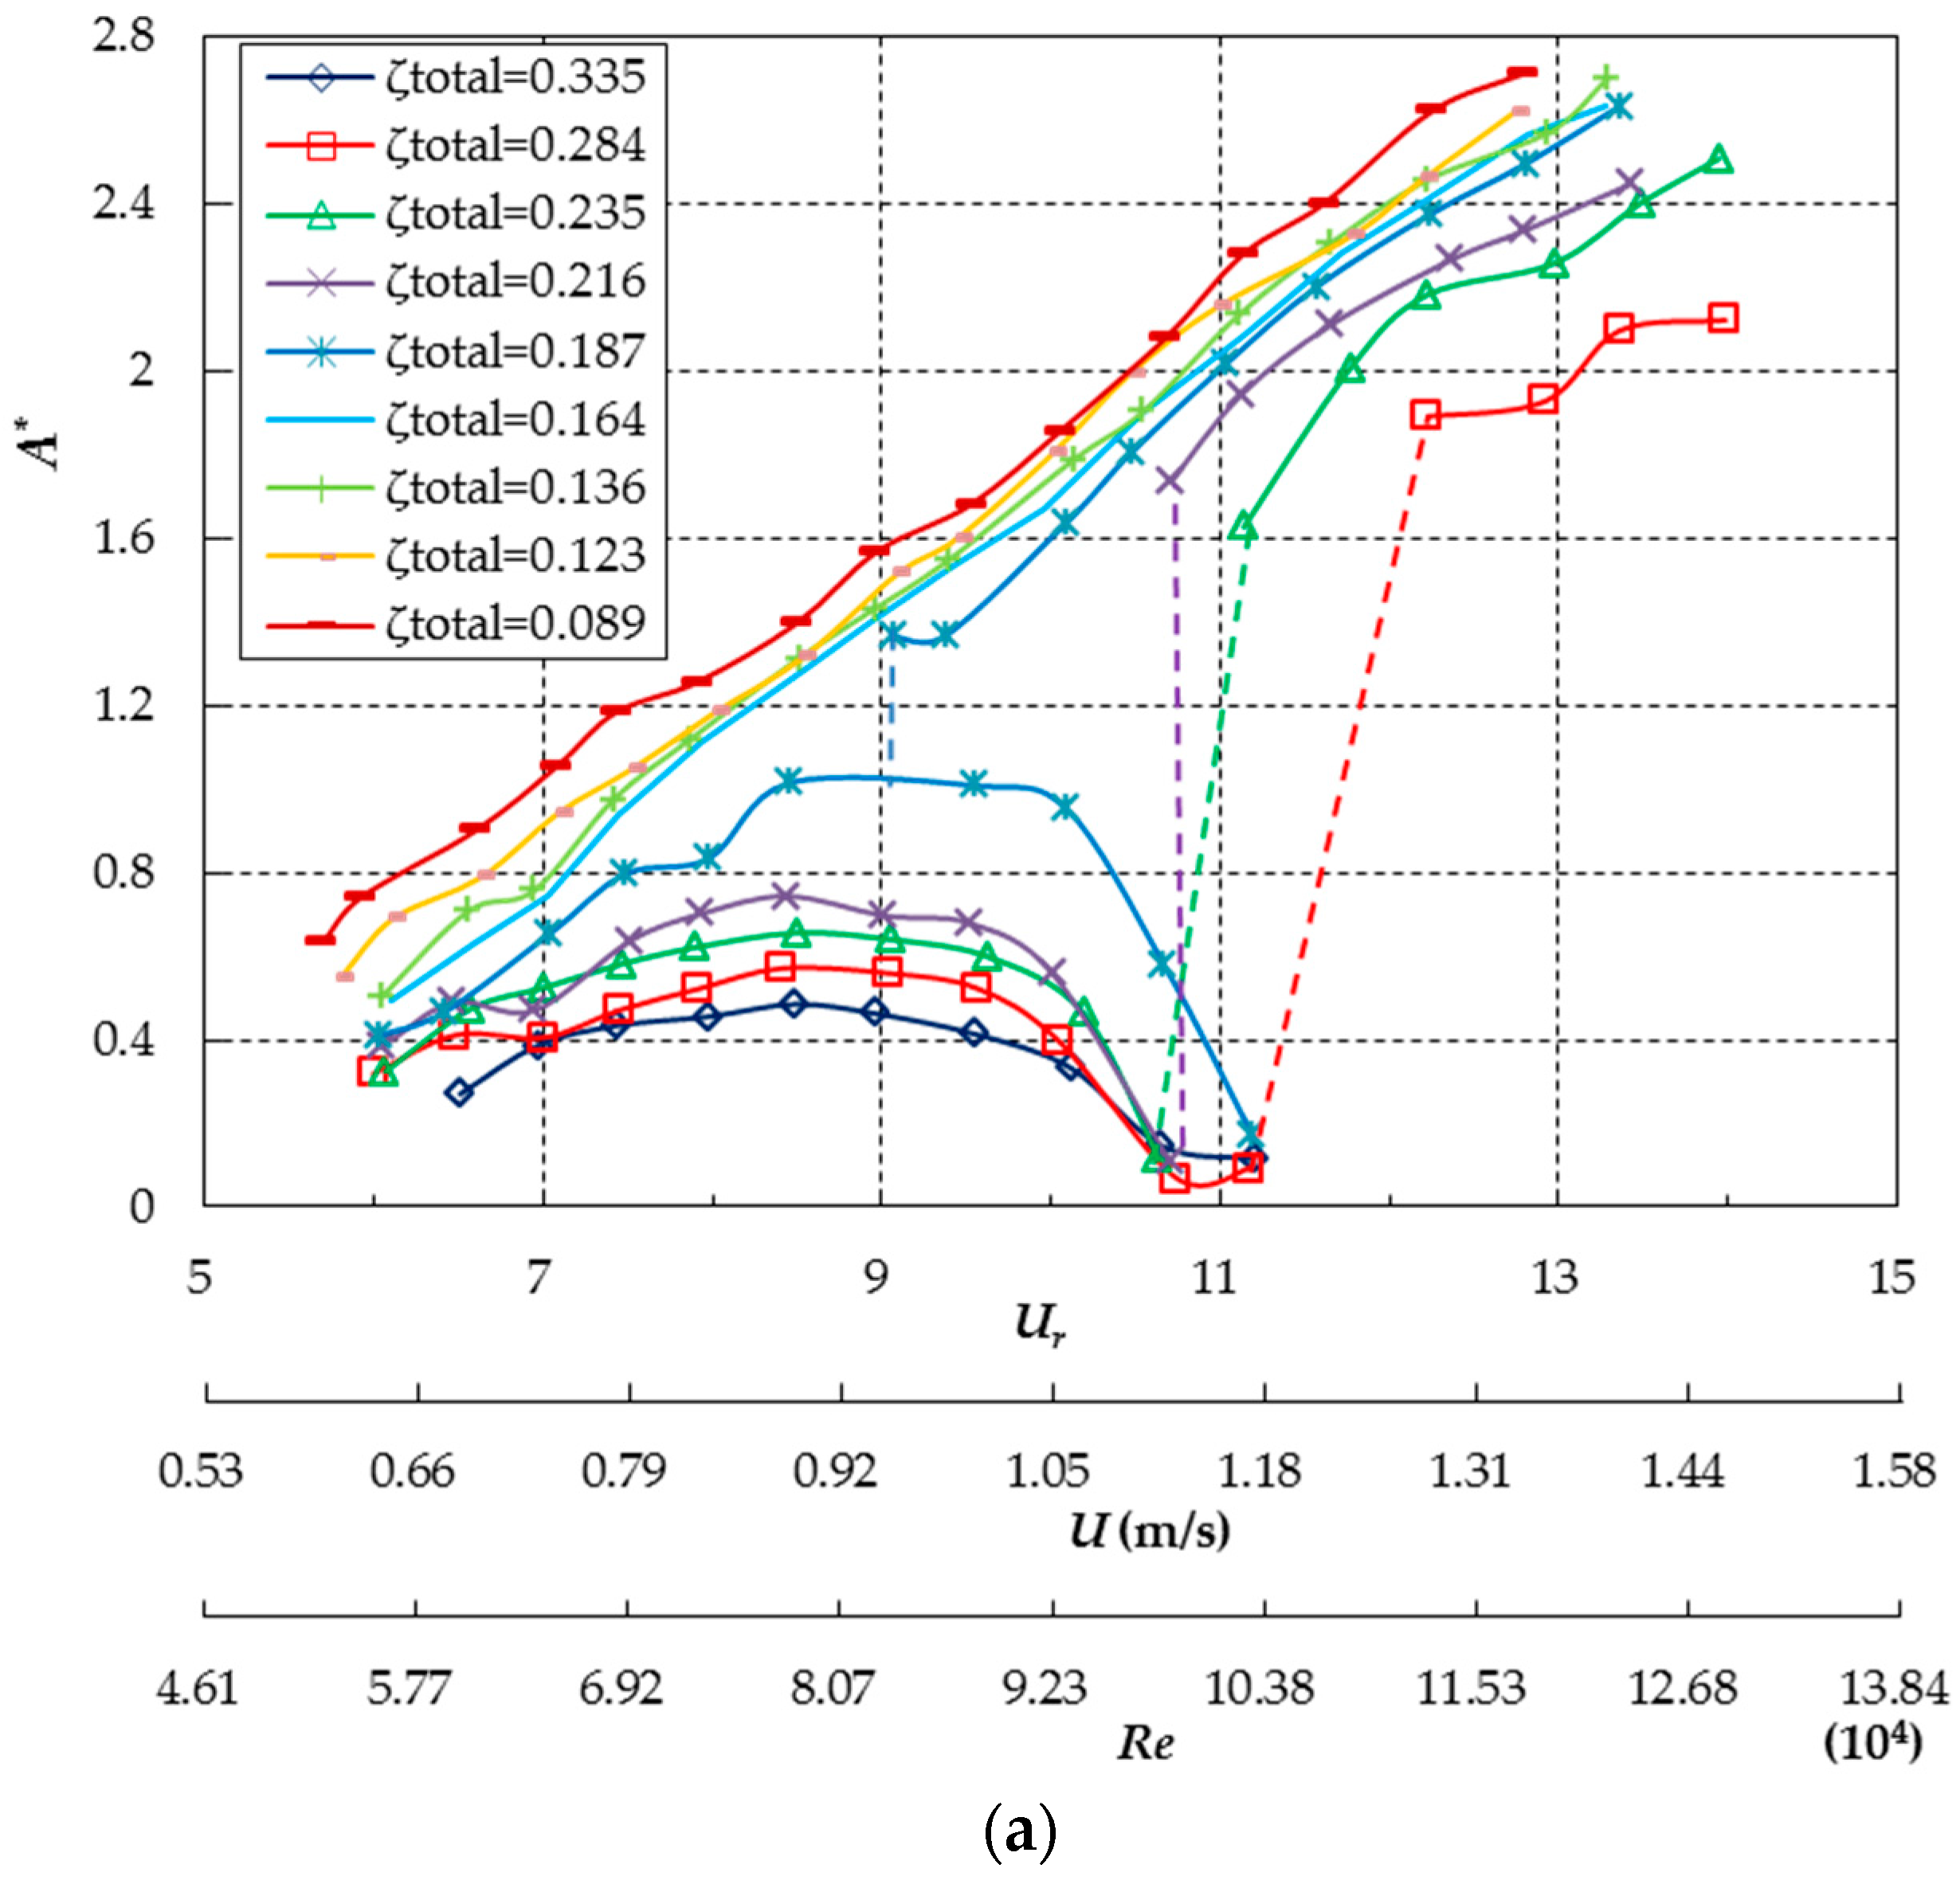
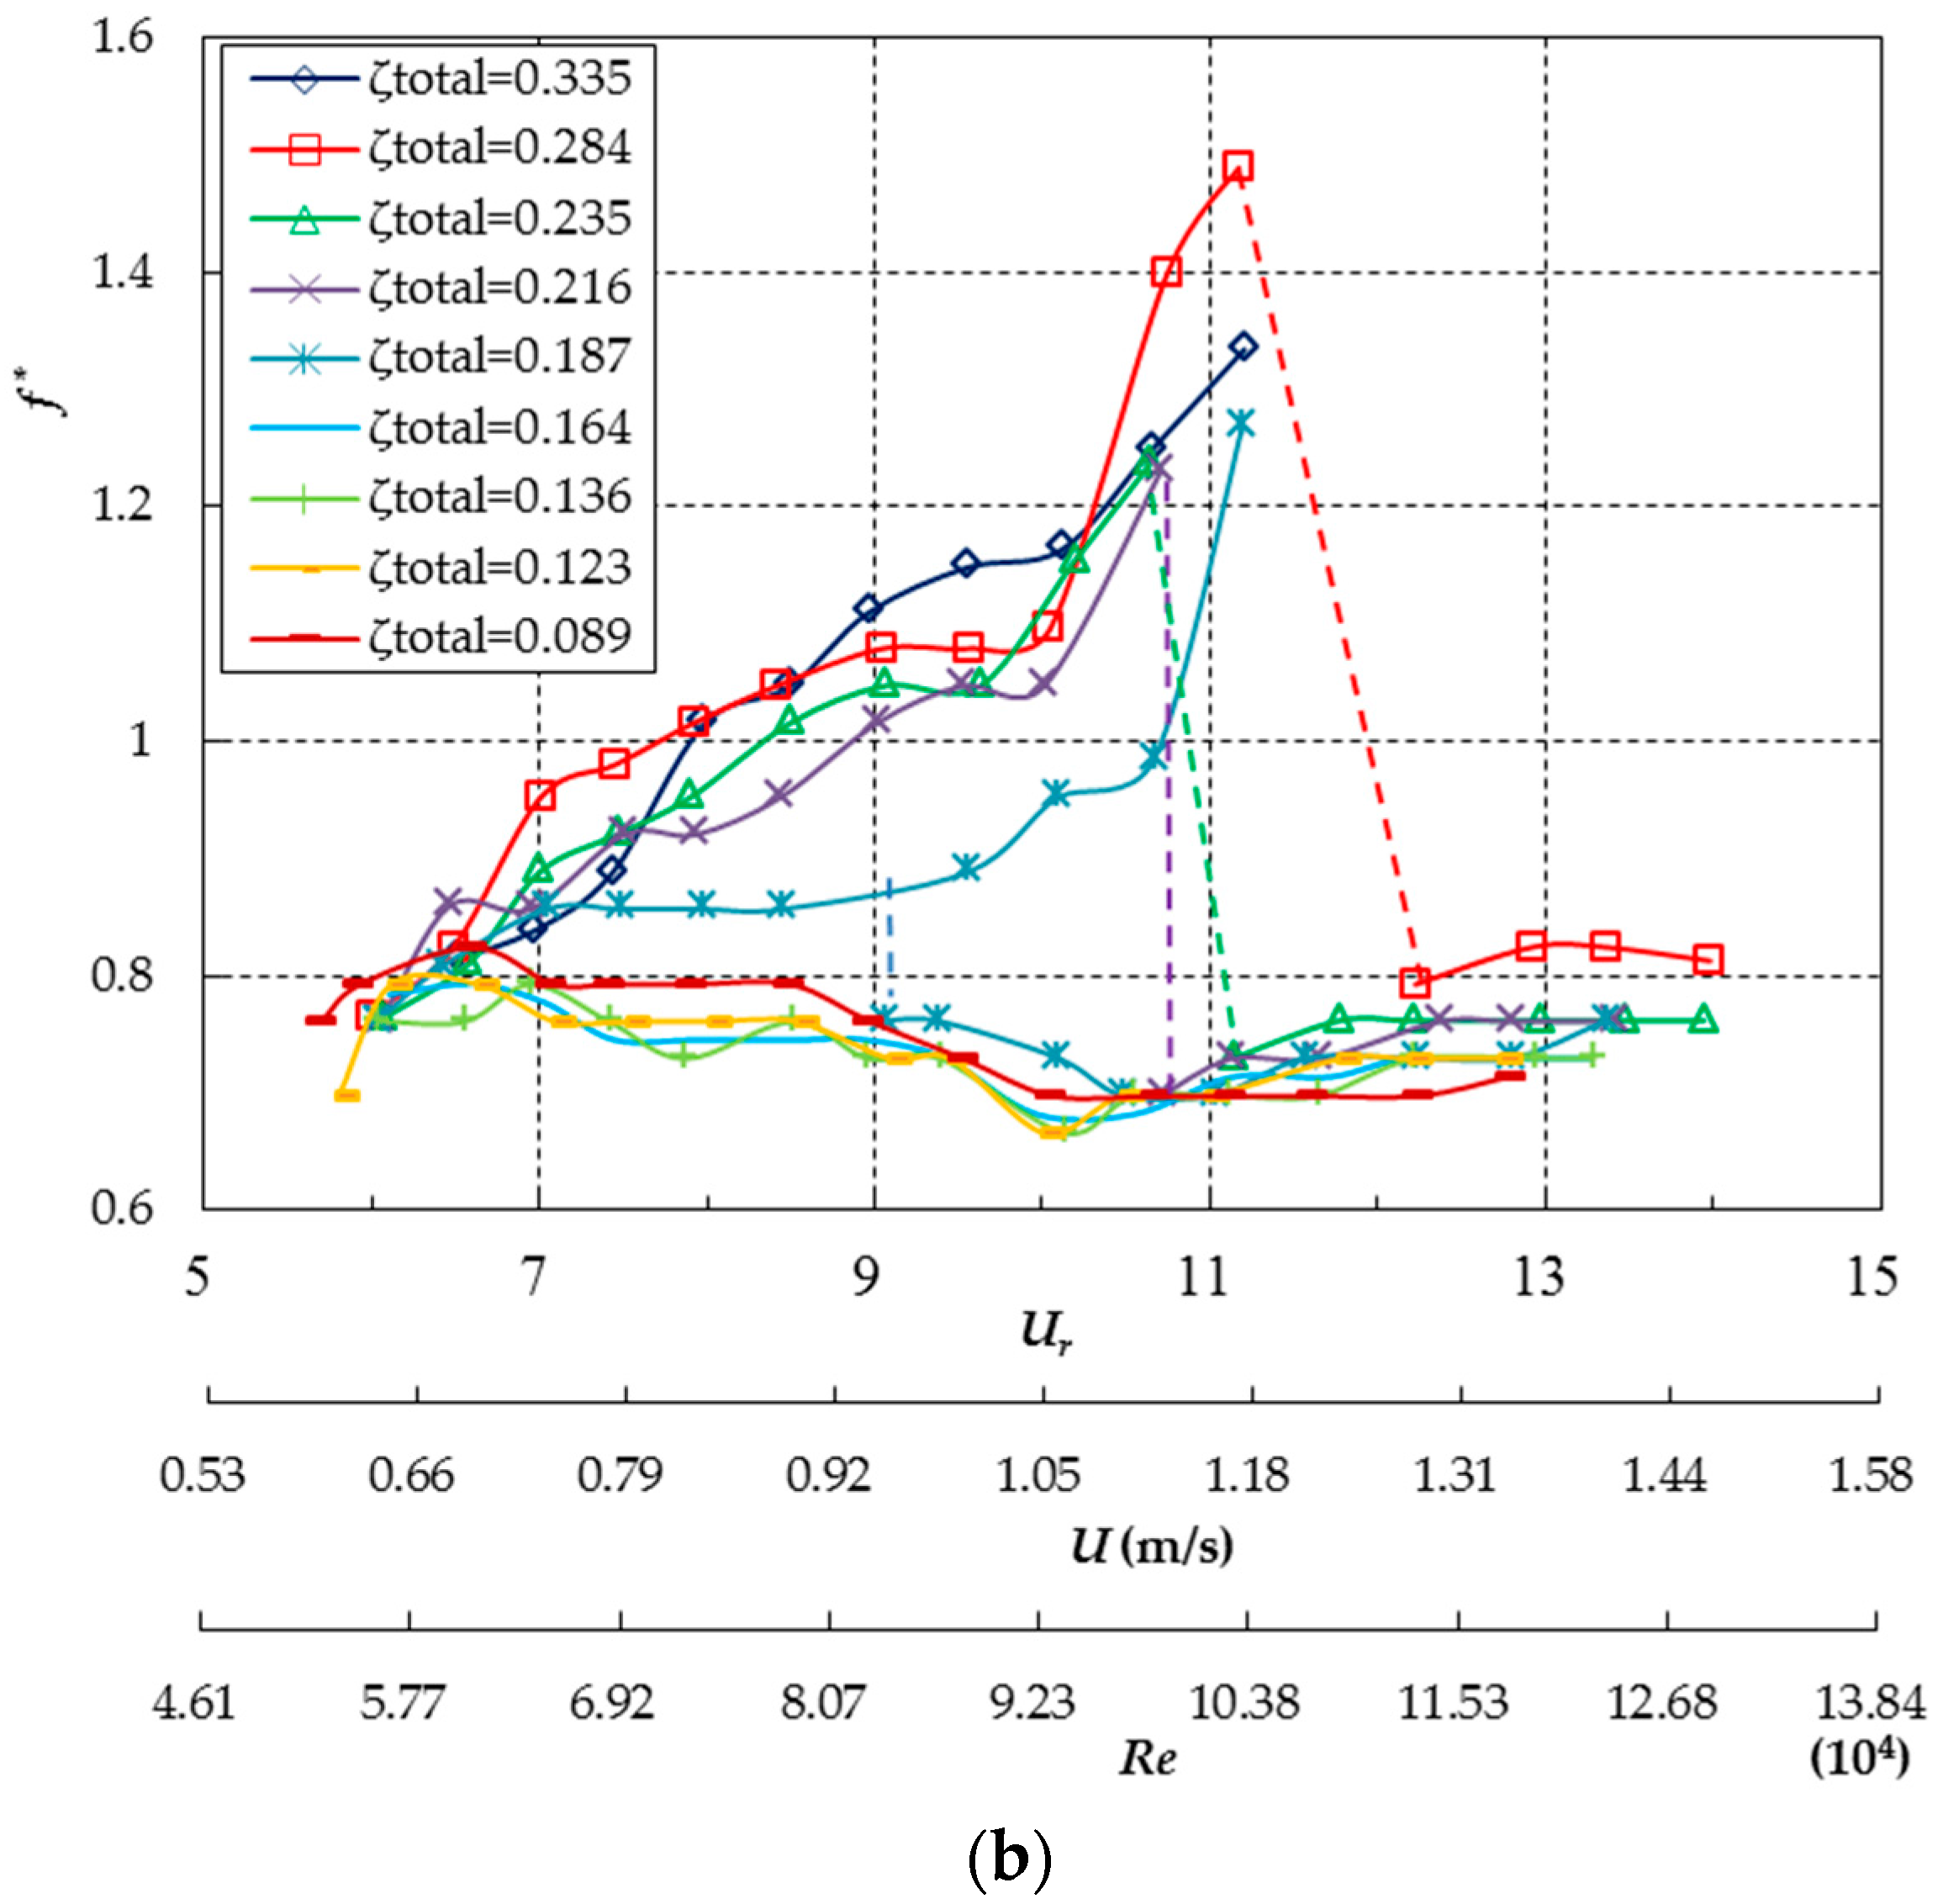
  • SG. For ζtotal ≤ 0.164, A* monotonically increases with increasing Ur, and f* is less than 1 throughout the test Ur range revealing that the oscillation frequency is lower than the natural frequency of the vibration system in air. The FIV of the prism can be divided into four regions based on the amplitude and frequency responses: the vortex induced vibration (VIV) initial branch, the VIV upper branch, the transition branch from VIV to galloping, and the galloping branch. The transition from VIV to galloping is self-initiated, indicating the prism experiences SG. This is probably due to the fact that the amplitude in the VIV upper branch is high enough to induce galloping. In the VIV initial branch, f* increases with increasing Ur accompanied with a low A*. When the prism enter into the VIV upper branch, f* firstly decreases and then levels off at approximately 0.729 to 0.793. The VIV of the prism is driven by the imposed lift on the body from vortex shedding [1]. In the transition branch from VIV to galloping, f* declines sharply due to the coexistence of the driving mechanisms of oscillatory lift due to vortex shedding and instability inducing oscillatory lift due to shear layer motion in this transition region [6,11,12,21,22], and A*continues to increase with increasing Ur. As the prism response is in galloping branch, f* levels off at low values, and A* still exhibits an increasing trend. The maximum A* reaches 2.71 at Ur = 12.80 for ζtotal = 0.089. Note that A* = 2.71 is the maximum value limited by the conditions in present experiments. In addition, the maximum A* = 2.71 for the equilateral triangular prism exceeds the maximum A* = 1.90 for a single circular cylinder reported by Raghavan and Bernitsas [32]. Galloping oscillation of the prism is mainly driven by lift instability, while the effect of vortex shedding on the motion in this region is negligible [6]. The reduced velocity Ur along with the corresponding fluid velocity U and Reynolds number Re for the onsets of the upper, lower and transition branches are listed in Table 4. The results show that higher ζtotal promotes the oscillation response mode to change at higher Ur, U and Re for ζtotal ≤ 0.164.
  • HG1. For the case ζtotal = 0.187, without a given threshold initial displacement, the prism can only experience VIV, which is consistent with the response of a smooth circular cylinder consisting of an initial branch followed by an upper branch and ending in desynchronization branch [32]. At reduced velocity in the range of 6.03 ≤ Ur ≤ 7.04, the amplitude ratio A* and the frequency ratio f* are small and increase rapidly with Ur indicating the oscillation response of the prism is in the VIV initial branch. For the reduced velocity Ur ranging from 7.04 to 10.09, A* displays a more gradually increase firstly and then levels off with Ur accompanied with an approximately constant in f*, which indicate the prism goes into the VIV upper branch. The VIV of the prism is suppressed significantly at Ur > 10.09 where A* declines rapidly with increasing Ur while f* continues to increase. The oscillation response of the prism is in the VIV desynchronization branch where f* is more than 1 indicating the response frequency of the prism is higher than the nature frequency of the vibration system in air. When the prism is given a threshold initial displacement of approximately 1.5D at Ur = 9.07, the prism enters into HG1 where the oscillation response jumps to the galloping branch from the VIV upper branch [12]. This threshold amplitude is given to the prism by manually pushing the prism. For an initial displacement of less than 1.5D, galloping was not initiated. In the HG1 branch, as shown in Figure 8, A* continues to increase with increasing Ur while f* remains around 0.75.
  • HG2. For the cases of 0.216 ≤ ζtotal ≤ 0.284, the prism only undergoes VIV without an externally imposed initial threshold amplitude. And the VIV characteristics are consistent with the case of ζtotal = 0.187 except that f* in VIV upper branch for the cases of 0.216 ≤ ζtotal ≤ 0.284 increase with increasing Ur while f* exhibits lock-in for the case of ζtotal = 0.187. After the VIV of the prism is strongly suppressed, a given threshold initial displacement of approximately 1.5D can excite the prism to gallop. The prism experiences HG2 because the VIV and galloping regions are separated by almost complete suppression [12]. In the HG2 branch, A* monotonically increases with increasing Ur while f* levels off into approximately 0.73~0.82. Besides, Figure 8 presents that the Ur where galloping is initiated increases as ζtotal increases in all galloping modes including SG, HG1 and HG2.
  • VIV. As ζtotal increases up to 0.335, only VIV is observed in the test velocity range (Ur = 15.22, U = 1.6 m/s). The response characteristics of A* and f* are consistent with those for the cases of 0.216 ≤ ζtotal ≤ 0.284 in the VIV modes.
In this section, an amplitude variation coefficient CVA is introduced to quantitatively describe vibration stationarity [33], which is defined as:
C V A = σ A A ¯ = 1 N i = 1 N ( A i A ¯ ) 2 A ¯
where σA denotes the standard deviation of peak amplitudes, A ¯ is the average of peak amplitudes, N is the number of peak amplitudes, and Ai is the amplitude of the ith peak.
Stationarity of the FIV of the prism is an important property that describes the prism dynamics. Besides, excellent vibration stationarity of FIV is beneficial for an oscillator to extract energy from a fluid flow. Vibration stationarity can be represented as the variation of peaks of the displacement time history in a certain period where the flow velocity is constant. The physical interpretation of CVA is that higher CVA signifies poorer vibration stationarity. The CVA versus the reduced velocity Ur, the fluid velocity U, and the Reynolds number Re for all ζtotal cases are presented in Figure 9.
As shown in Figure 9, the CVA versus the reduced velocity Ur for each ζtotal case is approximately coincident in VIV regions. In the VIV initial branch, the CVA is relatively high and decrease with increasing Ur, which indicate that the vibration stationarity of the prism in the VIV initial branch is poor and increasing Ur can improve the vibration stationarity. As the prism enters into the VIV upper branch, the CVA is lower and exhibits an approximately constant trend signifying the oscillation in the VIV upper branch is steady. The CVA in the VIV desynchronization branch is high indicating the poor vibration stationarity in this branch. When the prism response exceeds the VIV regions, there exists inconsistency in CVA versus Ur for different ζtotal. For ζtotal ≤ 0.164, the prism experiences SG where the transition from VIV to galloping is self-initiated and the VIV desynchronization branch is absent. The CVA in the transition branch from VIV to galloping firstly increases and then decreases rapidly with increasing Ur. This behavior indicates that the amplitude modulation in the transition branch is severe, and the modulation is a manifestation of the transition from VIV to galloping. The CVA levels off at low values in galloping branch indicating the prism maintains steady oscillation in fully developed galloping branch. For the cases of 0.187 ≤ ζtotal ≤ 0.284, the prism undergoes HG which is excited by an externally imposed initial threshold amplitude. The CVA levels off at low values when the prism response is in galloping branch signifying that the prism experience the FIV with excellent stationarity in galloping branch.

4.2. Energy Extraction

The FIV test results indicate that an equilateral triangle prism elastically mounted in a water flow can maintain a significant FIV response at high damping ratio over an extremely broad velocity range. Contrary to a smooth circular cylinder which experiences significant oscillation with limited oscillation amplitudes in a narrow range of flow velocity, the galloping of an equilateral triangle prism develops in an infinite range of flow velocity without a self-limited response beyond the critical flow velocity. This behavior is clearly beneficial for an oscillator to convert energy from a fluid flow. Besides, the approximately constant response frequency, along with the excellent vibration stationarity of the prism in galloping region can significantly improve the electricity quality.
This section presents the comparison of the energy conversion of the prism at different system damping ratios. According to the output voltage, the harnessed power and the energy conversion efficiency, which can describe the performance of energy extraction of an equilateral triangle prism directly, are calculated by the following equations. The instantaneous power extracted via the oscillating prism is given by:
P i = u i 2 R L
where ui denotes the instantaneous voltage measured by directly connecting the generator to the data acquisition system, and RL is the load resistance.
Correspondingly, the integrated power during an oscillation cycle of the prism is:
P o u t = 1 T 0 T P i d t = 1 T 0 T u i 2 R L d t
The energy conversion efficiency is defined as:
η o u t = P o u t P w = P o u t ( 0.5 ρ U 3 D L )
where Pw is the total power in the fluid. In the present research, the characteristic width of the prism is adopted to calculate the total fluid power for the purpose of comparing the energy conversion efficiencies for an equilateral triangle prism with the efficiencies for circular cylinders reported by the research group of Bernitsas [9,10,13] who have compared the VIVACE with other energy conversion device. In addition, for an oscillating prism, the projected area where the prism encounters the fluid is (2A + D)L, but this projected area would not completely represent the utilized fluid power. Because the fluid in this area does not encounter the oscillating prism for the whole oscillating period, it is the projected area of DL that always encounters the flowing fluid by the prism [6,9].
The time histories of the measured instantaneous voltage along with the corresponding frequency spectra for ζtotal = 0.284 at Ur = 12.23 (the onset of the galloping) and at Ur = 13.98 (the maximum reduced velocity) are presented in Figure 10 and Figure 11, respectively. As shown in Figure 10 and Figure 11, the peaks for the output voltage fluctuate in a tight range and the dominant frequency is obvious in galloping branch due to the excellent vibration stationarity and the steady vibration frequency, which indicate that the equilateral triangle prism can convert the hydrokinetic energy to high quality electric energy. In addition, the spectra in the galloping branch present small peaks (probably due to vortex shedding) at the second and third harmonic components of the output voltage frequency (oscillation frequency), which implies that the frequency of the vortex shedding is much higher than the oscillation dominant frequency of the prism.
Time histories of the instantaneous voltage ui over 30 s are used to obtain the averaged value of Pout. The integrated power Pout versus the reduced velocity Ur, the fluid velocity U, and the Reynolds number Re is presented in Figure 12, which shows that the prism can extract hydraulic energy for Ur > 5.80, corresponding to U > 0.610 m/s and Re > 5.36 × 10⁴. The integrated power Pout for each ζtotal case in VIV regions especially in the VIV initial branch and the VIV desynchronization branch is small due to the low amplitude and frequency responses. When the prism enters into galloping, Pout increases with increasing ζtotal until ζtotal increases up to 0.335 where the galloping of the prism is completely suppressed. The maximum Pout of 53.56 W is achieved at Ur = 13.98 (U = 1.470 m/s, Re = 1.28 × 10⁵) for the case of ζtotal = 0.284 in the present investigation. The harnessed power for ζtotal = 0.089 goes to zero due to RL of infinity for the open circuit case. Pout for other ζtotal cases are summarized as follows:
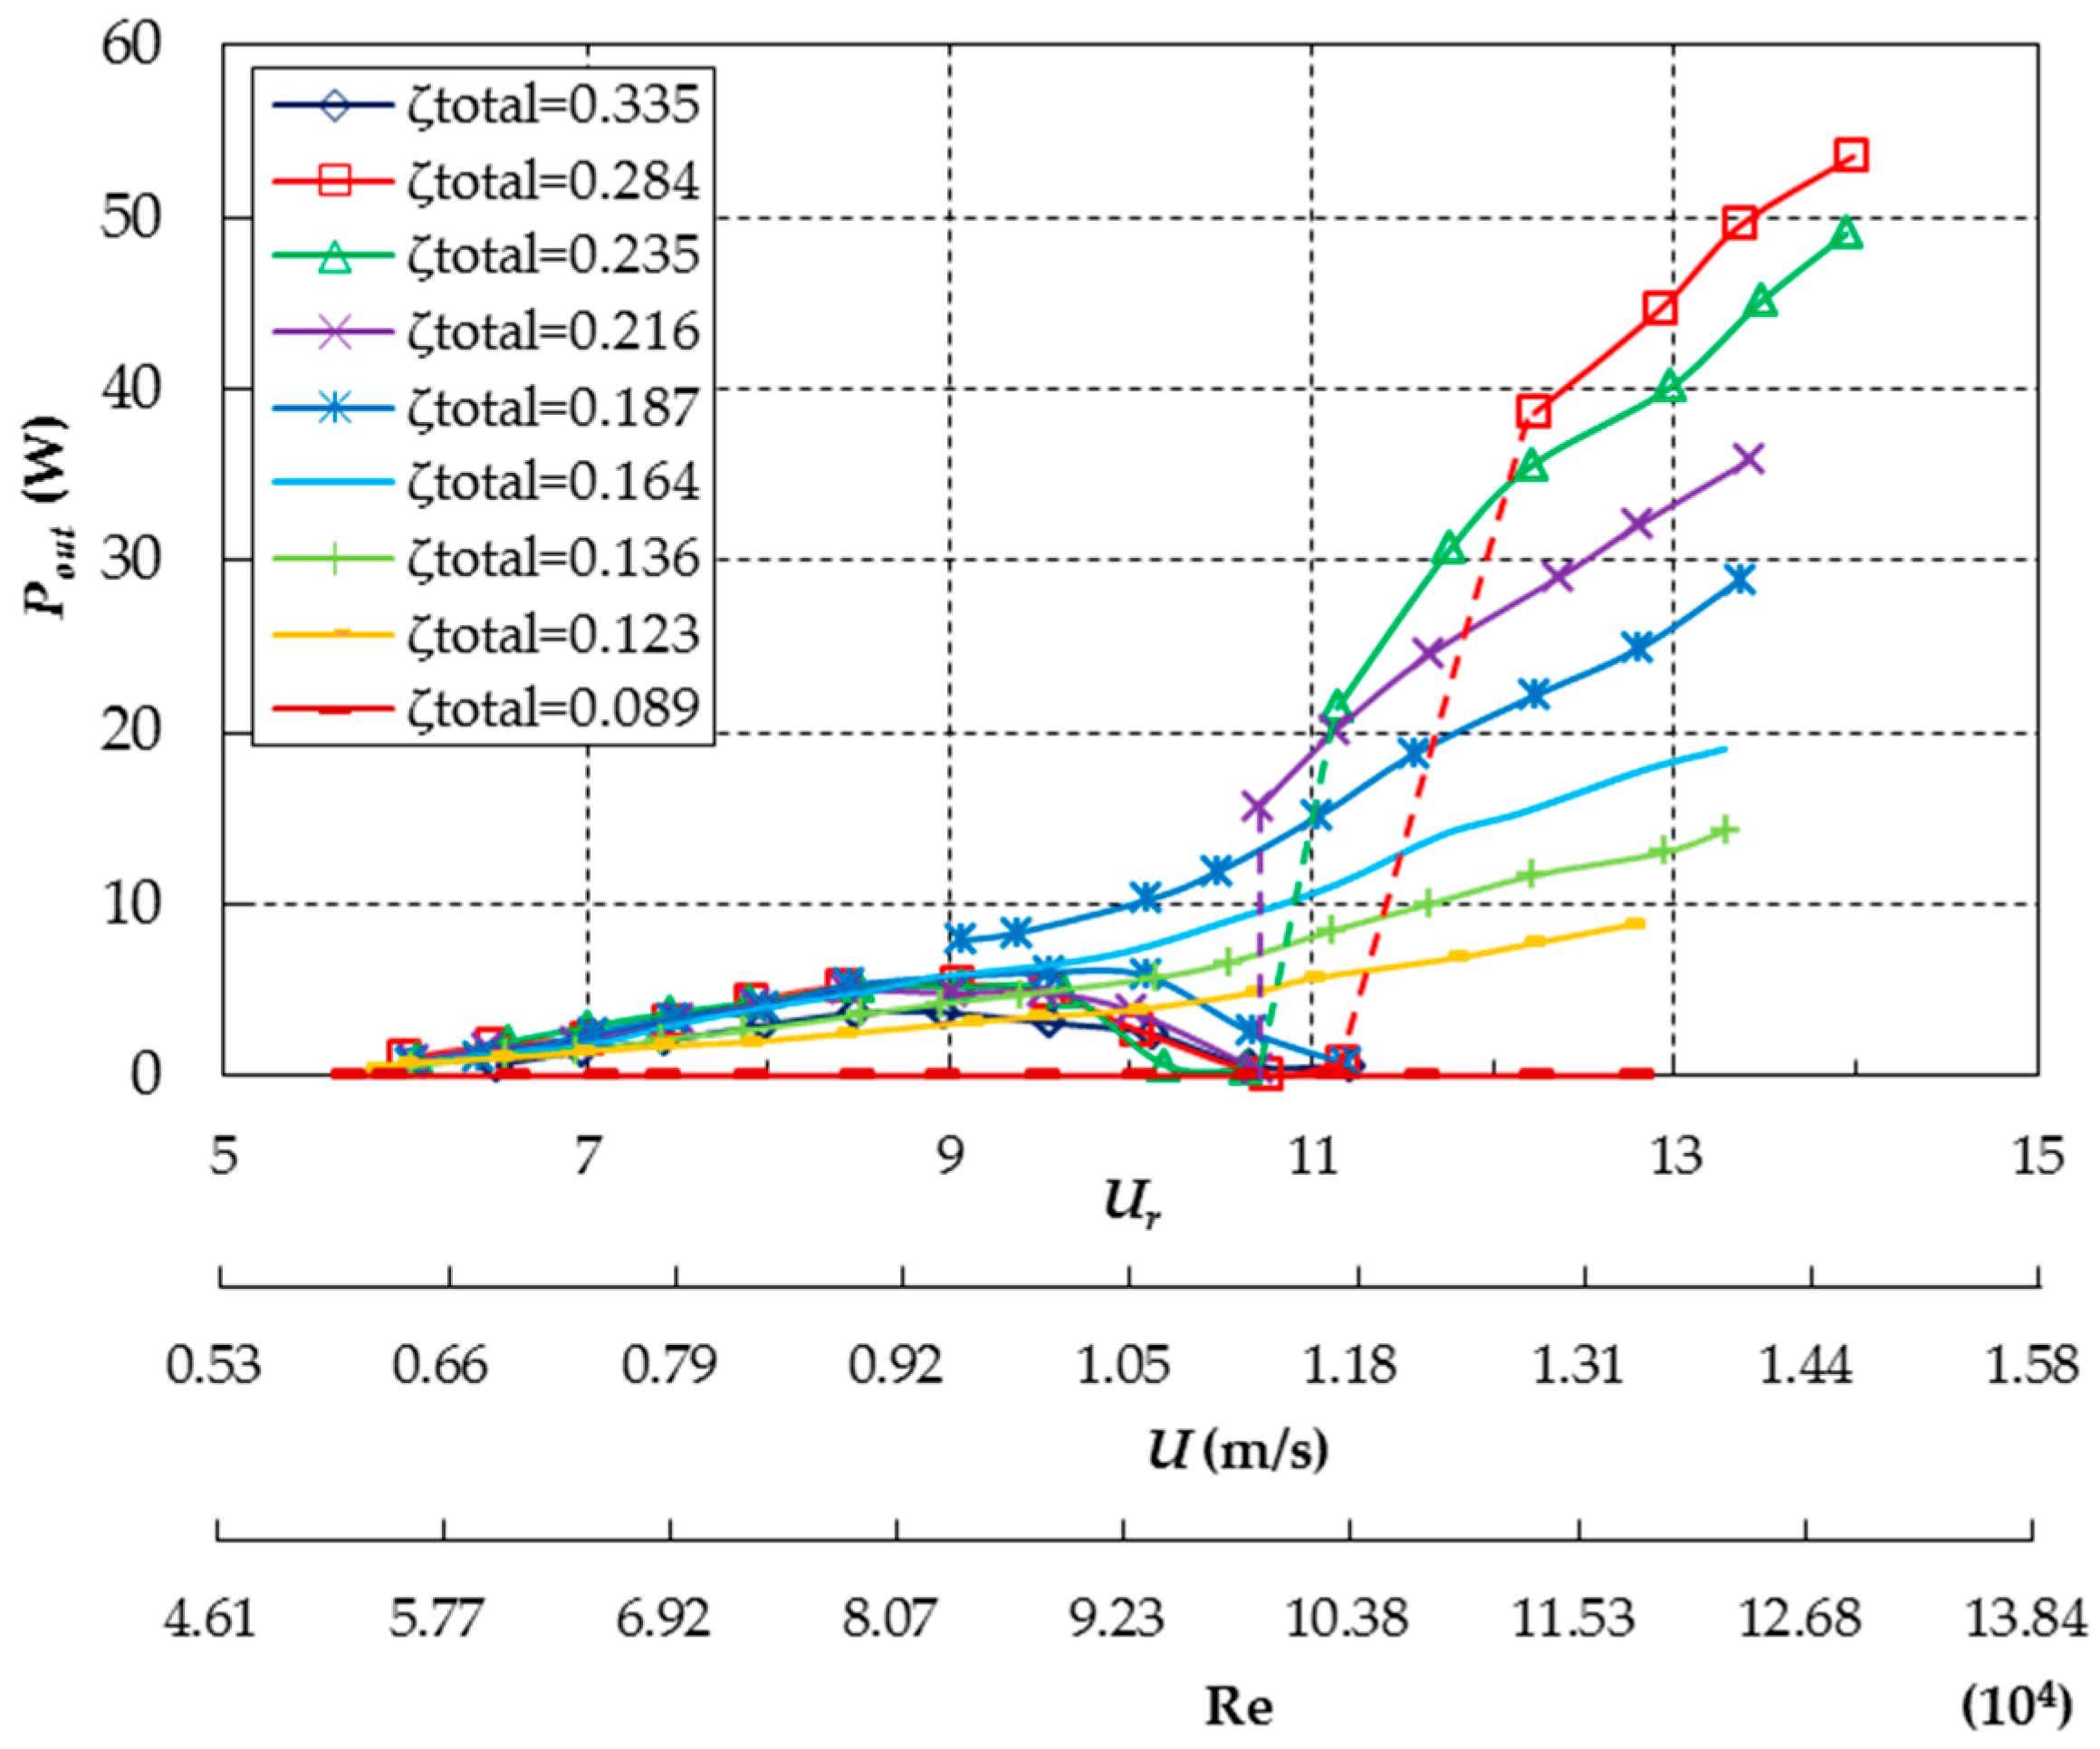
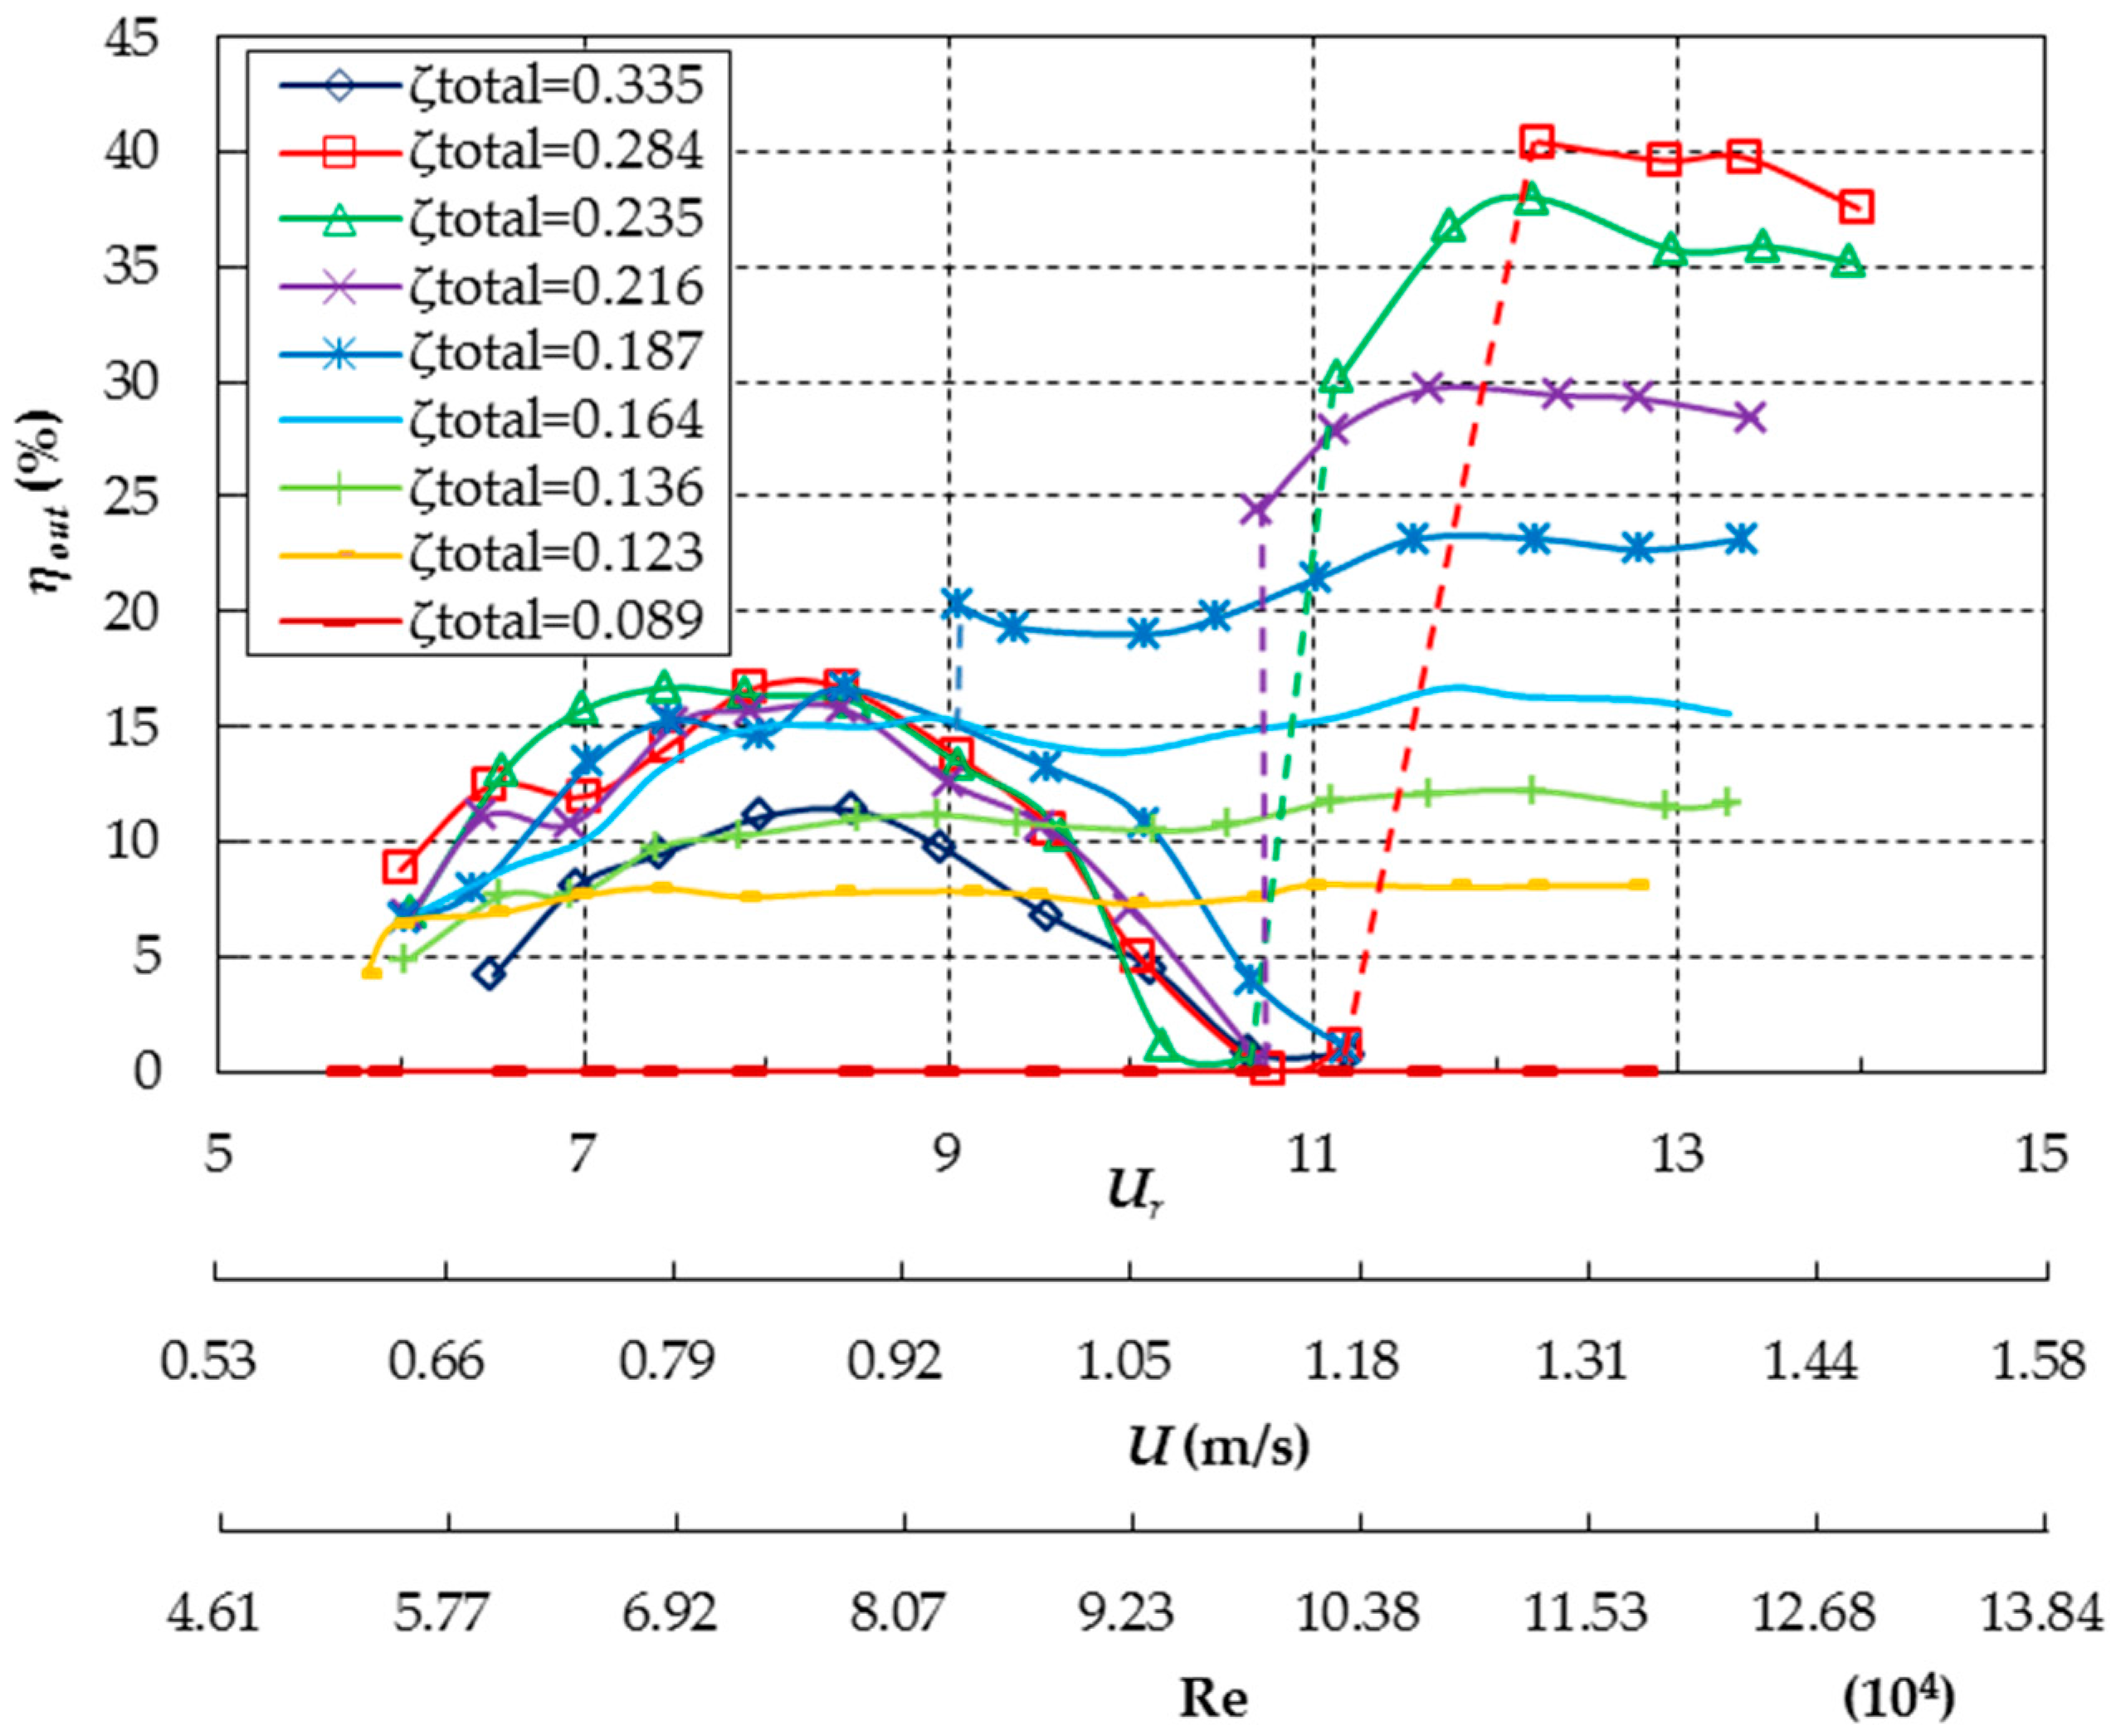
  • For 0.089 < ζtotal ≤ 0.164, the prism experiences SG where the transition from VIV to galloping is self-initiated and the VIV desynchronization branch is absent. Pout monotonically increases with Ur throughout the range of test water velocities thus yielding the peak Pout at the maxmum Ur. Besides, Pout increases with increasing ζtotal in all FIV branches.
  • For the case of 0.187 ≤ ζtotal ≤ 0.284, the prism undergoes HG excited by a given threshold initial displacement. Pout increases with increasing Ur in the VIV initial and upper branches while it is reduced with Ur when the prism goes in to the VIV desynchronization branch. Besides, higher ζtotal yields more harnessed power in the galloping branch.
  • As ζtotal increases up to 0.335, the prism can only experience VIV because the system damping ratio is high enough to prevent the prism from galloping. Pout versus Ur in the VIV regions is similar to that for the case of 0.187 ≤ ζtotal ≤ 0.284.
In order to evaluate the optimum system damping ratio ζtotal to extract hydrokinetic energy from the fluid via the FIV of an equilateral triangle prism, the energy conversion efficiencies ηout of the FIV for the prism with different ζtotal are calculated by Equation (46). The comparison of the energy conversion efficiency is plotted in Figure 13.
When the prism experiences SG for ζtotal in the range from 0.123 to 0.164, ηout increases with increasing ζtotal in all FIV branches. Besides, ηout increases rapidly with increasing Ur in the VIV regions and then approximately levels off in the transition and galloping branches. For the cases of 0.187 ≤ ζtotal ≤ 0.284 where the prism undergoes HG, consistent with Pout shown in Figure 12, the energy conversion efficiency ηout presents an increasing trend with Ur in the VIV initial and upper branches and a decreasing trend in the VIV desynchronization branch. ηout versus Ur in the VIV regions nearly collapse. However, when the prism goes into the HG, visible differences of ηout for the different ζtotal are exhibited, as shown in Figure 13. ηout in galloping zone, including SG and HG, increases with increasing ζtotal. The maximum ηout of 40.44% is achieved for the case of ζtotal = 0.284 at Ur = 12.23 (U = 1.285 m/s, Re = 1.12 × 10⁵) where the HG1 is initiated. The ηout of the prism exceeds the efficiencies of the smooth circular cylinder (ηout = 22%) [10] and the PTC circular cylinder (ηout = 28%) [13].
As expected, an optimal value of system damping ratio for extracting hydrokinetic energy exists, which allows maximum energy extracting while maintaining FIV under high damping. For the vibration system in the present investigation, the optimal system damping ratio is 0.284. According to the results of the harnessed power and the energy extraction efficiency, it can be concluded that the optimal system damping ratio for extracting energy is the maximum system damping ratio that the prism can overcome to experience stable galloping.

5. Conclusions

The flow induced vibration and energy extraction of an equilateral triangle prism elastically mounted in a water channel were studied experimentally at a mass ratio M* = 6.36 and system stiffness K = 1228 N/m for the system damping ratios varying from 0.089 to 0.335. A power take-off system with the function of variable damping was developed. In addition, the translation-rotation equation of the vibration system was deduced, which was verified by the free decay damping experiments. The responses of amplitude and frequency of the prism were discussed in the paper, along with the harnessed power and the energy conversion efficiency of the oscillating prism. The following conclusions can be drawn from the results presented in this paper:
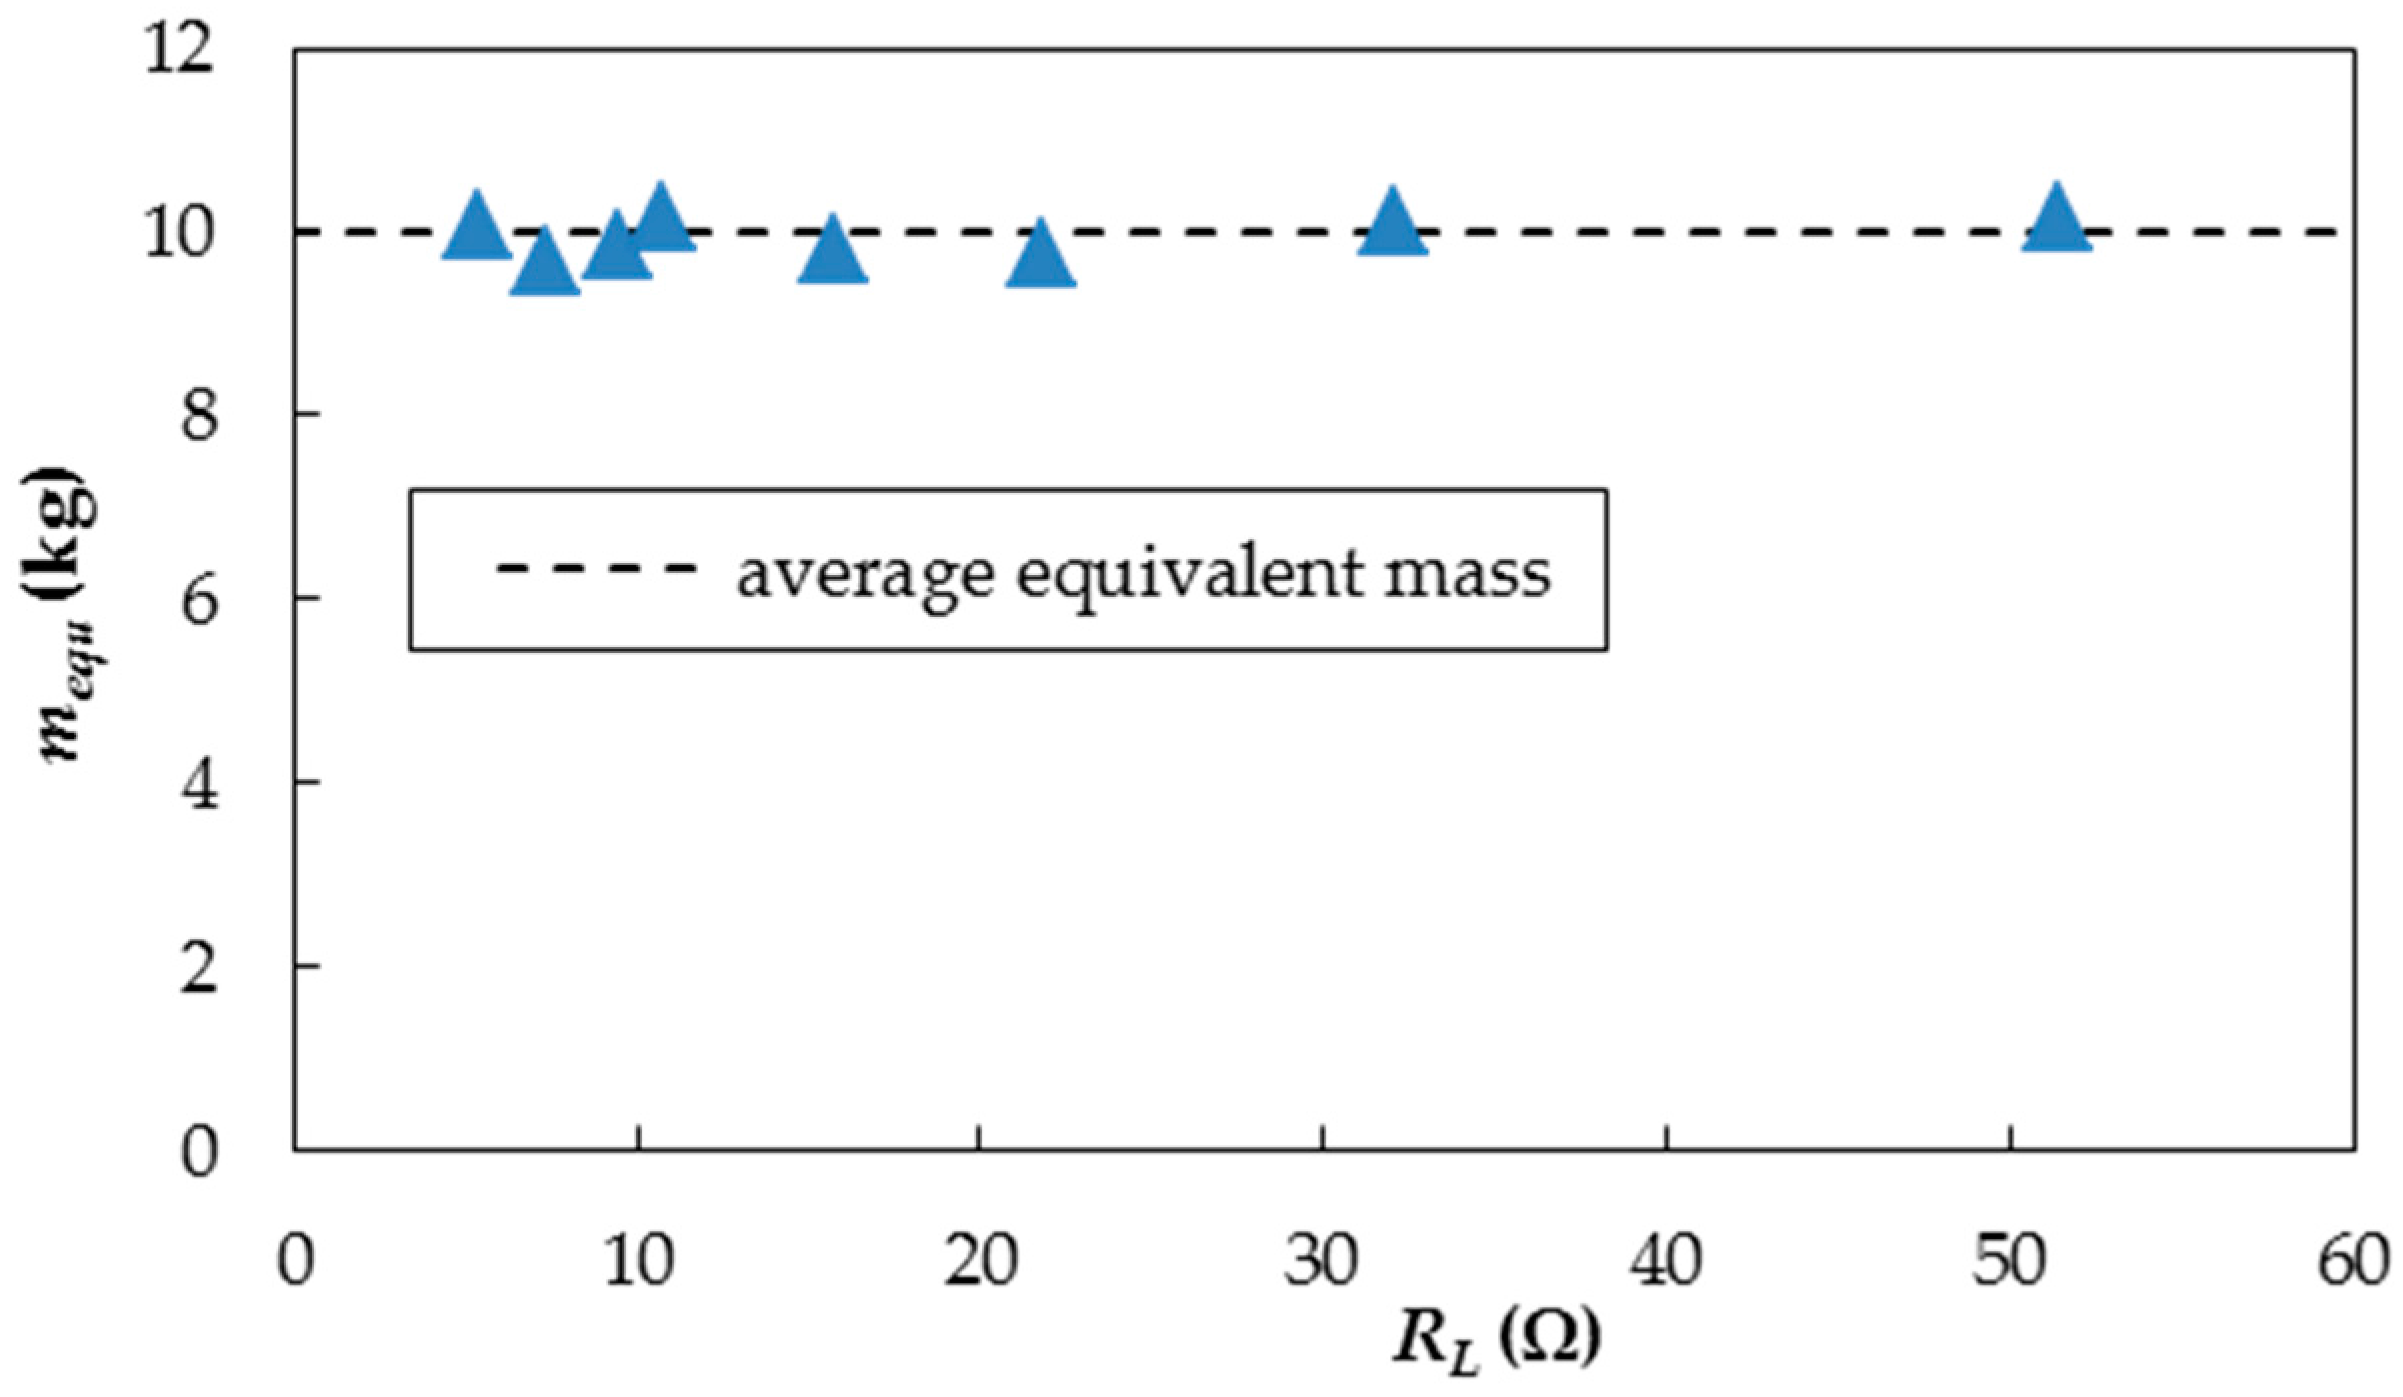
  • The total oscillating mass of the vibration system includes the material mass mosc, and the equivalent mass mequ due to the rotation of the gears and rotor. Increasing load resistance RL can result in a decrease in the system damping coefficient thus decreasing the system damping ratio when the system stiffness and the total oscillating mass remain unchanged.
  • The galloping of the prism presents, in turn, the soft galloping (SG), the hard galloping 1 (HG1) and the hard galloping 2 (HG2) with increasing ζtotal. For ζtotal ≤ 0.164, the prism experiences SG where the transition from VIV to galloping is self-initiated. The FIV of the prism can be divided into four regions: the VIV initial and upper branches, the transition branch from VIV to galloping, and the galloping branch. For the case of ζtotal = 0.187, the prism only experiences VIV without an externally imposed initial threshold amplitude. The response of the prism consists of an initial branch followed by an upper branch and ending in a desynchronization branch. When the prism is given a threshold initial displacement of approximately 1.5D at Ur = 9.07, the prism enters into HG1 from the VIV upper branch. For the cases of 0.216 ≤ ζtotal ≤ 0.284, after the VIV of the prism is strongly suppressed, a given threshold initial displacement of approximately 1.5D can excite the prism to HG2. Higher ζtotal promotes the galloping to start at higher Ur, U and Re. In addition, as ζtotal increases up to 0.335, only VIV is observed in the test velocity range. For all ζtotal cases, A* decreases with increasing ζtotal, and the maximum A* reaches 2.71 at Ur = 12.80 for ζtotal = 0.089.
  • The galloping characteristics of the equilateral triangle cylinder, including significant amplitude responses in an extremely large range of flow velocities, the excellent vibration stationarity, and steady vibration frequencies, are beneficial for improving energy conversion.
  • The prism can extract hydraulic energy for Ur > 5.80 (U > 0.610 m/s, Re > 5.36 × 10⁴). The harnessed power Pout and the energy conversion efficiency ηout increase with increasing ζsystem in the galloping zone. The maximum Pout and ηout reach 53.56 W and 40.44%, respectively. In addition, the ηout of the prism exceeds the efficiencies of the smooth circular cylinder and the PTC circular cylinder. The optimal system damping ratio for extracting energy is the maximum system damping ratio that the prism can overcome to experience stable galloping.

Acknowledgments

This work is supported by the National Key Research and Development Program of China (Grant No. 2016YFC0401905). All workers from the State Key Laboratory of Hydraulic Engineering Simulation and Safety of Tianjin University are acknowledged. The authors are also grateful for the assistance of the anonymous reviewers.

Author Contributions

Jun Zhang designed the experiments, analyzed the date and wrote the paper. Fang Liu handled the project and provided the helpful discussion. Jijian Lian made substantial contributions to conception and plan. Xiang Yan and Quanchao Ren preformed the experiments.

Conflicts of Interest

The authors declare no conflict of interest.

Abbreviations

The following abbreviations are used in this manuscript:
DSide length of the cross section
LLength of the prism
moscOscillating material mass
MoscTotal oscillating mass
mdDisplaced fluid mass
M*Mass ratio of the vibration system
KSystem spring stiffness
ζtotalTotal damping ratio
fn,airNatural frequency in air
UFluid velocity
UrReduced fluid velocity
AMaximum amplitude
A*Maximum amplitude ratio
foscResponse frequency
f*Frequency ratio
ViLinear velocity of Gear i
VgLinear velocity of the generator rotor
riRadius of Gear i
rgRadius of the generator rotor
ciDamping coefficient due to friction on Gear i
cgDamping coefficient due to friction on rotor
θ ˙ i Angular velocity of Gear i
θ ˙ g Angular velocity of the rotor
θ ¨ i Angular acceleration of the ith wheel
θ ¨ g Angular acceleration of the rotor
FyForce exerted by the fluid on the body
EInduced voltage of the generator
BMagnetic flux density
IInduced current
lLength of the wire cutting the a magnetic field
FmagElectromotive force
TmagElectromotive force torque
JiRotational inertia of the ith wheel
JgRotational inertia of the rotor
R0Generator inner resistance
RLload resistance
mequEquivalent mass
ctotalTotal system damping coefficient
cstructureFriction damping coefficient on bearings
ctraTransmission damping coefficient
cgenGenerator damping coefficient
charnDamping coefficient due to the load resistance
PoutOutput power
ηoutEnergy conversion efficiency

References

  1. Blevins, R.D. Flow-Induced Vibration, 3rd ed.; Van Nostrand Reinhold: New York, NY, USA, 1990. [Google Scholar]
  2. Williamson, C.H.K.; Govardhan, R. Vortex-induced vibrations. Annu. Rev. Fluid Mech. 2004, 36, 413–455. [Google Scholar] [CrossRef]
  3. Williamsona, C.H.K.; Govardhanb, R. A brief review of recent results in vortex-induced vibrations. J. Wind Eng. Ind. Aerodyn. 2008, 96, 713–735. [Google Scholar] [CrossRef]
  4. Parkinson, G.V.; Sullivan, P.P. Galloping response of towers. J. Wind Eng. Ind. Aerodyn. 1979, 4, 253–260. [Google Scholar] [CrossRef]
  5. Bokaian, A.R.; Geoola, F. Hydroelastic instabilities of square cylinders. J. Sound Vib. 1984, 92, 117–141. [Google Scholar] [CrossRef]
  6. Ding, L.; Zhang, L.; Wu, C.M. Flow induced motion and energy harvesting of bluff bodies with different cross sections. Energy Convers. Manag. 2015, 91, 416–426. [Google Scholar] [CrossRef]
  7. Xu, F.; Ou, J.; Xiao, Y. CFD Numerical Simulation of Flow-induced Vibration with Different Cross-section Cylinders. J. Eng. Mech. 2009, 26, 7–15. (In Chinese) [Google Scholar]
  8. Alonso, G.; Meseguer, J. A parametric study of the galloping stability of two dimensional triangular cross-section bodies. J. Wind Eng. Ind. Aerodyn. 2006, 94, 241–253. [Google Scholar] [CrossRef]
  9. Bernitsas, M.M.; Raghavan, K.; Ben-Simon, Y. Vivace (vortex induced vibration aquatic clean energy): A new concept in generation of clean and renewable energy from fluid flow. J. Offshore Mech. Arct. Eng. Trans. ASME 2008, 130, 619–637. [Google Scholar] [CrossRef]
  10. Bernitsas, M.M.; Ben-Simon, Y.; Raghavan, K. The VIVACE converter: Model tests at high damping and Reynolds number around 105. J. Offshore Mech. Arct. Eng. Trans. ASME 2009, 131, 403–410. [Google Scholar]
  11. Chang, C.C.; Kumar, R.A.; Bernitsas, M.M. VIV and galloping of single circular cylinder with surface roughness at 3.0 × 10⁴ ≤ Re ≤ 1.2 × 10⁵. Ocean Eng. 2011, 38, 1713–1732. [Google Scholar] [CrossRef]
  12. Park, H.; Kumar, R.A.; Bernitsas, M.M. Enhancement of flow-induced motion of rigid circular cylinder on springs by localized surface roughness at 3.0 × 10⁴ ≤ Re ≤ 1.2 × 10⁵. Ocean Eng. 2013, 72, 403–415. [Google Scholar] [CrossRef]
  13. Ding, L. Research on Flow Induced Motion of Multiple Circular Cylinders with Passive Turbulence Control. Ph.D. Thesis, Chongqing University, Chongqing, China, 2013. [Google Scholar]
  14. Kluger, J.M.; Moon, F.C.; Rand, R.H. Shape optimization of a blunt body Vibro-wind galloping oscillator. J. Fluid Struct. 2013, 40, 185–200. [Google Scholar] [CrossRef]
  15. Sorribes-Palmer, F.; Sanz-Andres, A. Optimization of energy extraction in transverse galloping. J. Fluid Struct. 2013, 4, 124–144. [Google Scholar] [CrossRef]
  16. Luo, S.C.; Chew, Y.T.; Ng, Y.T. Hysteresis phenomenon in the galloping oscillation of a square cylinder. J. Fluid Struct. 2003, 18, 103–118. [Google Scholar] [CrossRef]
  17. Ruecheweyh, H.; Hortmanns, M.; Schnakenberg, C. Vortex-excited vibrations and galloping of slender elements. J. Wind Eng. Ind. Aerodyn. 1996, 65, 347–352. [Google Scholar] [CrossRef]
  18. Hmon, P.; Santi, F.; Schnoerringer, B. Influence of free stream turbulence on the movement-induced vibrations of an elongated rectangular cylinder in cross flow. J. Wind Eng. Ind. Aerodyn. 2011, 89, 1383–1395. [Google Scholar] [CrossRef]
  19. Tamura, T.; Itoh, Y. Unstable aerodynamic phenomena of a rectangular cylinder with critical section. J. Wind Eng. Ind. Aerodyn. 1999, 83, 121–133. [Google Scholar] [CrossRef]
  20. Li, Q.S.; Fang, J.Q.; Geary, A.P. Evaluation of 2D coupled galloping oscillations of slender structures. Comput. Struct. 1998, 6, 513–523. [Google Scholar] [CrossRef]
  21. Nemes, A.; Zhao, J.; Lo Jacono, D.; Sheridan, J. The interaction between flow induced vibration mechanisms of a square cylinder with varying angles of attack. J. Fluid Mech. 2012, 710, 102–130. [Google Scholar] [CrossRef] [Green Version]
  22. Barrero-Gil, A.; Fernandez-Arroyo, P. Maximum vortex-induced vibrations of a square prism. Wind Struct. 2013, 16, 341–354. [Google Scholar] [CrossRef]
  23. Johansson, S.H.; Davidson, L.; Olsson, E. Numerical simulation of vortex shedding past triangular cylinders at high Reynolds number using a k-ε turbulence model. Int. J. Numer. Methods Fluid 1993, 16, 859–878. [Google Scholar] [CrossRef]
  24. Camarri, S.; Salvetti, M.V.; Buresti, G. Large-eddy simulation of the flow around a triangular prism with moderate aspect-ratio. J. Wind Eng. Ind. Aerodyn. 2006, 94, 309–322. [Google Scholar] [CrossRef]
  25. Iungo, G.V.; Buresti, G. Experimental investigation on the aerodynamic loads and wake flow features of low aspect-ratio triangular prisms at different wind directions. J. Fluid Struct. 2009, 25, 1119–1135. [Google Scholar] [CrossRef]
  26. Alonso, G.; Sanz-Lobera, A.; Meseguer, J. Hysteresis phenomena in transverse galloping of triangular cross-section bodies. J. Fluid Mech. 2012, 33, 243–251. [Google Scholar] [CrossRef] [Green Version]
  27. Alonso, G.; Meseguer, J.; Pérez-Grande, I. Galloping instabilities of two dimensional triangular cross-section bodies. Exp. Fluids 2005, 38, 789–795. [Google Scholar] [CrossRef]
  28. Alonso, G.; Meseguer, J.; Pérez-Grande, I. Galloping stability of triangular cross sectional bodies: A systematic approach. J. Wind Eng. Ind. Aerodyn. 2007, 95, 928–940. [Google Scholar] [CrossRef]
  29. Norberg, C. Fluctuating lift on a circular cylinder: Review and new measurements. J. Fluids Struct. 2003, 17, 57–96. [Google Scholar] [CrossRef]
  30. Szepessy, S.; Bearman, P.W. Aspect Ratio and End Plate Effects on Vortex Shedding From a Circular Cylinder. J. Fluid Mech. 1992, 234, 191–218. [Google Scholar] [CrossRef]
  31. Szepessy, S. On the Control of Circular Cylinder Flow by End Plates. Eur. J. Mech. B Fluids 1993, 12, 217–244. [Google Scholar]
  32. Raghavan, K.; Bernitsas, M.M. Experimental investigation of Reynolds number effect on vortex induced vibration of rigid circular cylinder on elastic supports. Ocean Eng. 2011, 38, 719–731. [Google Scholar] [CrossRef]
  33. Zhang, J.; Xu, G.B.; Liu, F. Experimental investigation on the flow induced vibration of an equilateral triangle prism in Water. Appl. Ocean Res. 2016, 61, 92–100. [Google Scholar] [CrossRef]
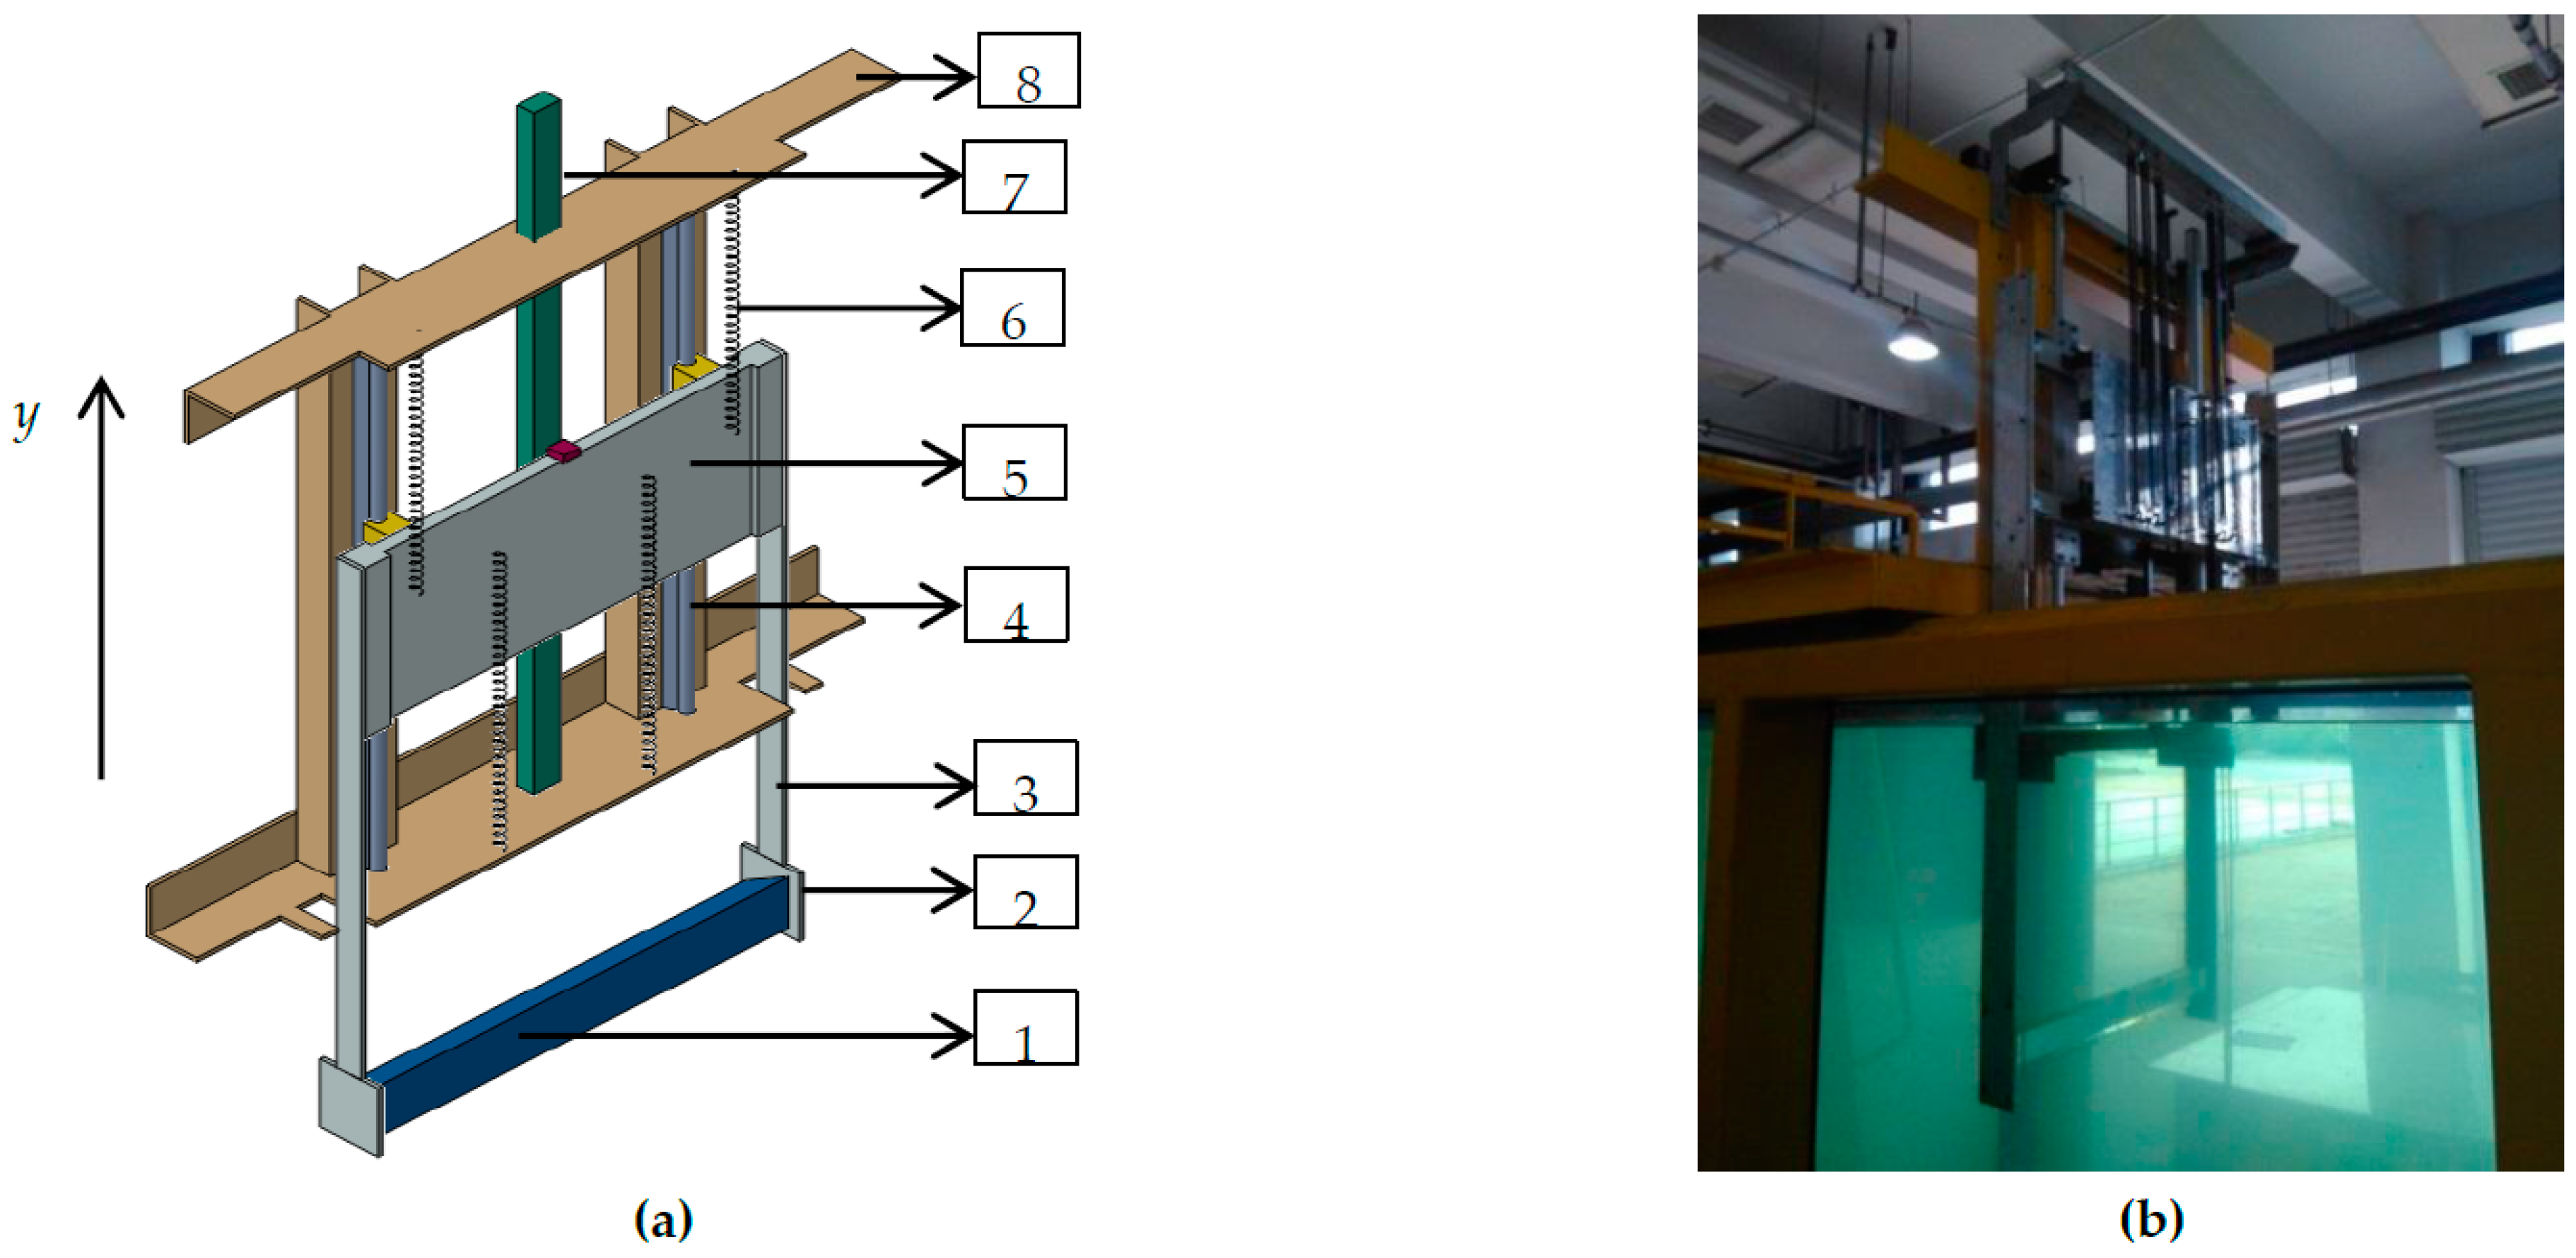
Figure 1. Vibration system with an equilateral triangle prism (a) Parts of vibration system; (b) Picture of vibration system.
Energies 09 00938 g001
Figure 2. Oscillator (a) Equilateral triangle prism; (b) Installation way of the equilateral triangle prism in the channel.
Energies 09 00938 g002
Figure 3. Power take-off system (a) Diagram of Power take-off system; (b) Mounting position.
Energies 09 00938 g003
Figure 4. High-power resistors with different resistance.
Energies 09 00938 g004
Figure 5. Equivalent mass mequ versus load resistance RL.
Energies 09 00938 g005
Figure 6. Deceleration coefficient λ versus load resistance RL.
Energies 09 00938 g006
Figure 7. Damping ratio of the vibration system ζtotal versus load resistance RL.
Energies 09 00938 g007
Figure 8. Amplitude and frequency (a) Amplitude ratio A* versus Ur, U and Re for different ζtotal; (b) Frequency ratio f* versus Ur, U and Re for different ζtotal; (Dashed lines denote hard excitation).
Energies 09 00938 g008aEnergies 09 00938 g008b
Figure 9. Amplitude variation coefficient CVA versus Ur, U and Re for different ζtotal.
Energies 09 00938 g009
Figure 10. Voltage time histories and frequency spectra for ζtotal = 0.284 at Ur = 12.23 (a) Instantaneous voltage; (b) Frequency spectrum.
Energies 09 00938 g010
Figure 11. Voltage time histories and frequency spectrum for ζtotal = 0.284 at Ur = 13.98 (a) Instantaneous voltage; (b) Frequency spectrum.
Energies 09 00938 g011
Figure 12. Harnessed power for different ζsystem (Dashed lines denote hard excitation).
Energies 09 00938 g012
Figure 13. Efficiencies of the energy conversion for different ζsystem (Dashed lines denote hard excitation).
Energies 09 00938 g013
Table 1. Main components of the vibration system.
Part No.Description
1Equilateral triangle prism
2Endplates
3Side strut used for connecting the prism and connection structure
4Linear bearings playing a role in limiting the system to vibration in the vertical direction
5Connection structure used for connecting side struts, linear bearings and a power take-off system
6Tension springs
7Displacement transducer
8Steel frame used for fixing linear bearings, tension springs, displacement transducer and generator
Table 2. Physical model parameters.
Side Length of the Cross Section DLength of the Prism LAspect Ratio of the Prism α = L/DDisplaced Fluid Mass mdOscillating Material Mass mosc
0.1 m0.9 m97.07 kg30.04 kg
Table 3. Free decay test results.
RL (Ω)ζtotalfn,air (Hz)ctotal (N·s·m−1)cgen + charn (N·s·m−1)Mosc (kg)
5.390.3351.042122.75990.35127.366
7.330.2841.049104.01271.60426.983
9.480.2351.04585.91553.50727.164
10.70.2161.04279.20046.79227.441
15.810.1871.05268.46436.05627.111
21.820.1641.05660.19927.79127.072
32.050.1361.05649.95917.55127.394
51.370.1231.05644.96012.55227.457
∞ (O/C)0.0891.05832.408027.583
Table 4. Ur, U and Re for onsets of the upper, lower and transition branches.
ζtotalOnset of VIV Upper BranchOnset of Transition BranchOnset of Galloping Branch
UrU (m/s)ReUrU (m/s)ReUrU (m/s)Re
0.0896.600.694609358.490.8937838610.061.05792786
0.1236.630.697612158.540.8977877610.471.10196643
0.1366.650.730641229.390.9878666210.541.10897295
0.1647.030.739648579.450.9908695611.131.170102709

