Article

Perturb and Observe Control for an Embedded Point Pivoted Absorber

1
Department of Electrical Engineering and Information Technology, University of Naples Federico II, Via Claudio 21, 80125 Naples, Italy
2
Department of Industrial Engineering, University of Naples Federico II, Via Claudio 21, 80125 Naples, Italy
*
Author to whom correspondence should be addressed.
Energies 2016, 9(11), 939; https://doi.org/10.3390/en9110939
Submission received: 1 August 2016 / Revised: 4 November 2016 / Accepted: 8 November 2016 / Published: 10 November 2016
(This article belongs to the Special Issue Numerical Modelling of Wave and Tidal Energy)

Abstract

:
Marine energy sources represent an attractive and inexhaustible reservoir able to contribute to the fulfillment of the world energy demand in accordance with climate/energy regulatory frameworks. Wave energy converter (WEC) integration into the main grid requires both the maximization of the harvested energy and the proper management of the generation variability. The present paper focuses on both these mentioned issues. More specifically, it presents an embedded point pivoted absorber (PPA) and its related control strategy aimed at maximizing the harvested energy. Experimental and numerical investigations have been carried out in a wave/towing tank facility in order to derive the design characteristics of the full-scale model and demonstrate the validity and effectiveness of the proposed control strategy.

1. Introduction

Nowadays, national energy policies are driven by several needs such as promoting the use of endogenous sources in order to limit the energy dependence from foreign countries and enhance the security of the energy supply, respecting the energy/environmental targets established in the international frameworks, and stimulating the global cost competitiveness [1]. Renewable energy sources (RES) are playing a primary role in worldwide energy demand fulfillment due both to the rapid exhaustion of the oil resources [2,3] and due to their “friendly” environmental impact. In particular, with reference to a highly distributed renewable energy generation system, a proper forecasting of the available RES power behavior can lead to a more efficient electrical transmission versus high power centralized systems [4,5,6]. Among the multitude of RES energy options, the ocean is considered one of the most energy-dense: it has been estimated that 0.1% of the energy in ocean waves is five times more than the whole world’s energy requirements [7]. Nevertheless, today its exploitation is very limited, whilst several conversion technologies are available for exploiting diversified energy forms such as tidal and marine energy, wave energy, and salinity energy [8].
Wave energy converters (WECs) can be classified according to different criteria such as the working principle (energy extraction principle), the water depth, the location (shoreline, near-shore, offshore), the size, and so on [9,10,11,12,13]. With respect to a working-principle based classification, three main WECs categories can be identified: oscillating water column, overtopping converters, and oscillating bodies. The electric energy generation in oscillating water column systems and overtopping converters is ensured by an electric generator. In oscillating water column systems the electric generator is moved by a turbine, which is driven in turn by the airflow ducted in a column by the incident waves. In overtopping converters, the electric generator is instead driven by a hydraulic turbine which converts the potential energy obtained by capturing the incident sea waves in a reservoir above the surrounding water surface.
Finally, in the oscillating bodies systems, the linear/tubular electric generators, or rotating generators with mechanical actuators (for example, ball screw actuators), convert the kinetic energy transmitted by the sea waves to oscillating floating or submerged bodies. Recently, different offshore wave generation devices have reached the full-scale demonstration stage and they are generally constituted by means of oscillating bodies, either floating or fully submerged. Practical examples are heaving mode point absorbers, which received great attention through many analytical studies as well as numerical and experimental investigations aimed at optimizing their shape and performances [14,15]. Pivoted type energy converters exploit both horizontal and vertical translations of the floating body [16,17,18]. In this regard, Wavestar and Seapower platform are examples of full-scale devices characterized by a hydraulic power take-off system using oil as the working fluid and requiring a complex control mechanism [19].
Two key issues have to be addressed for WEC integration into the main grid. The first issue is the maximization of the available energy, which can be pursued by deploying adequate control strategies for the electric generator. The second is the grid integration of the system, an aspect complicated by the oscillating mechanical power transferred to the electric generator. A promising solution for mitigating this effect and in doing so promote the WECs’ network integration is represented by energy storage systems (ESSs), able to compensate for the power fluctuations in highly variable RES [11,20,21,22].
Armed with such a vision, this paper is focused on the design/implementation of an embedded pivoted point absorber and its related maximum power point tracking (MPPT) control strategy. In particular, the paper proposes an innovative perturb and observe (P&O) algorithm [23], designed to maximize the harvested energy in a wide range of operating conditions. The effectiveness of the proposed system is strengthened by the envisioned pivoted point absorber, which guarantees a higher energy extraction rate when compared to the traditional heaving mode system. The electric energy conversion is performed by an AC brushless rotating generator, coupled with an electromechanical actuator based on a ball screwing system, characterized by a high-speed ratio in order to maximize the power density of the generator. Finally, the mitigation of the WEC power fluctuations, needed to ensure a quasi-constant grid injected power, can be performed by means of the supercapacitor based ESS presented in [24] by some of the authors of this work.
Starting from several experimental results obtained for a reduced scale prototype operating in a wave/towing tank facility (Section 3), some numerical investigations (Section 6) have been performed in order to validate the proposed P&O algorithm (Section 5). Finally, Section 7 provides conclusions and final remarks.
The obtained outcomes will permit the deployment of a 1:1 scale model in the near future.

2. The Proposed Wave Energy Converter
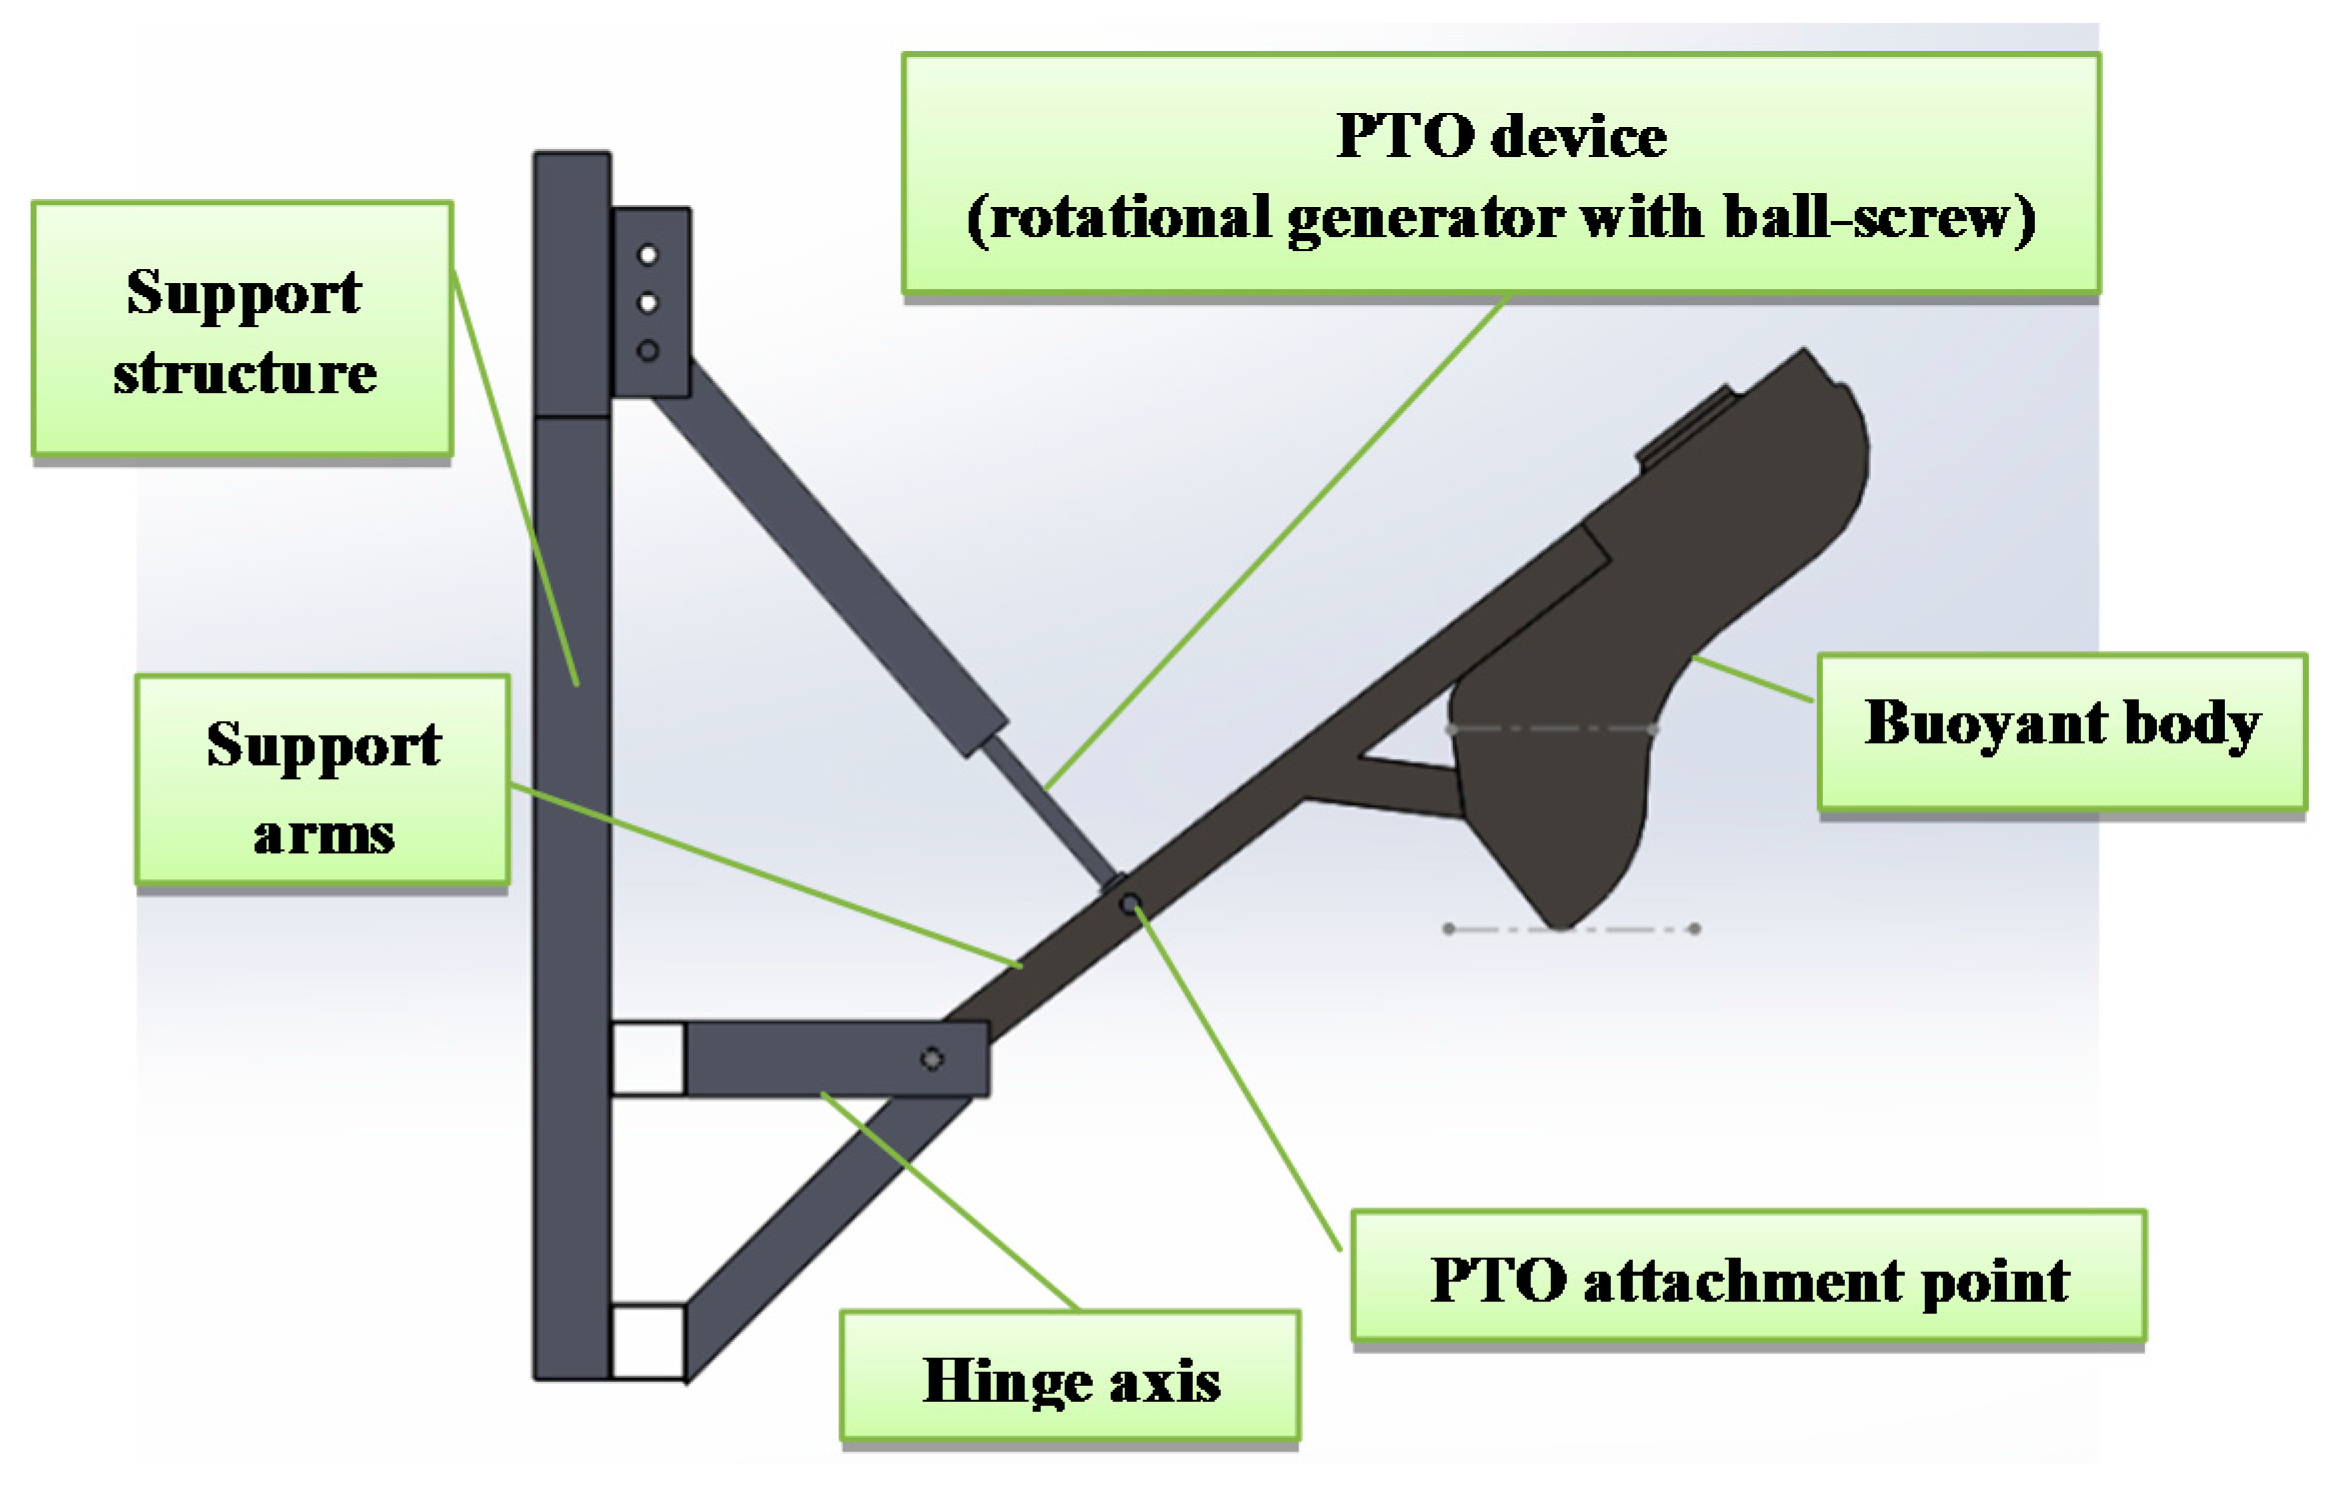
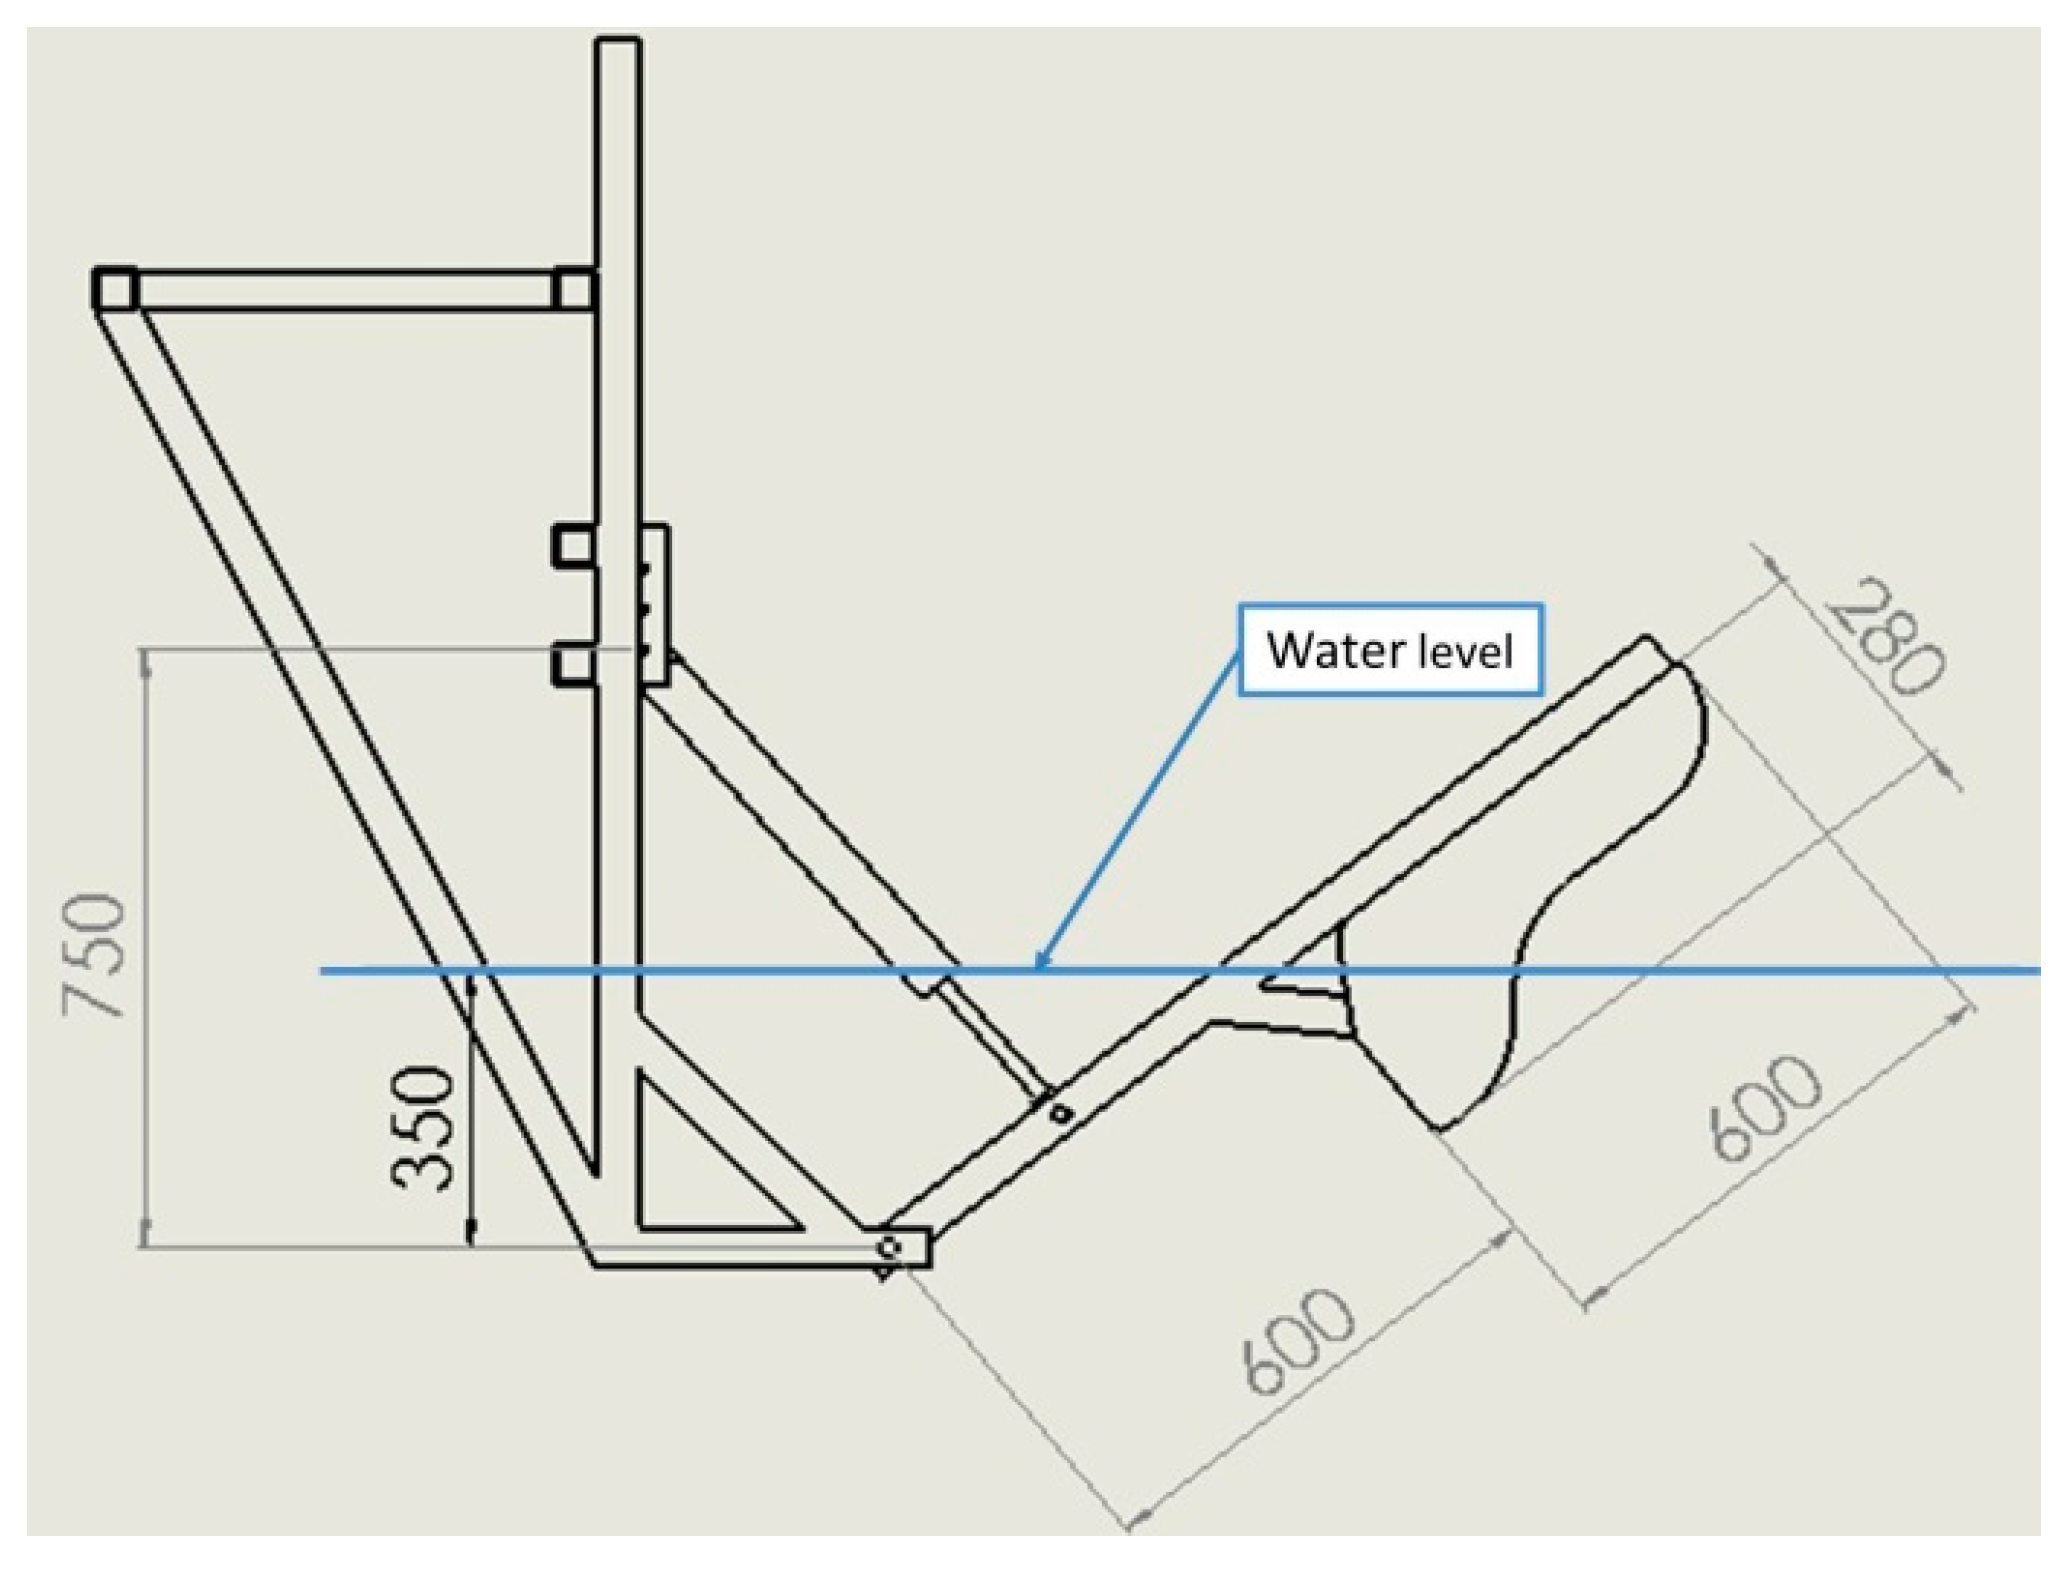
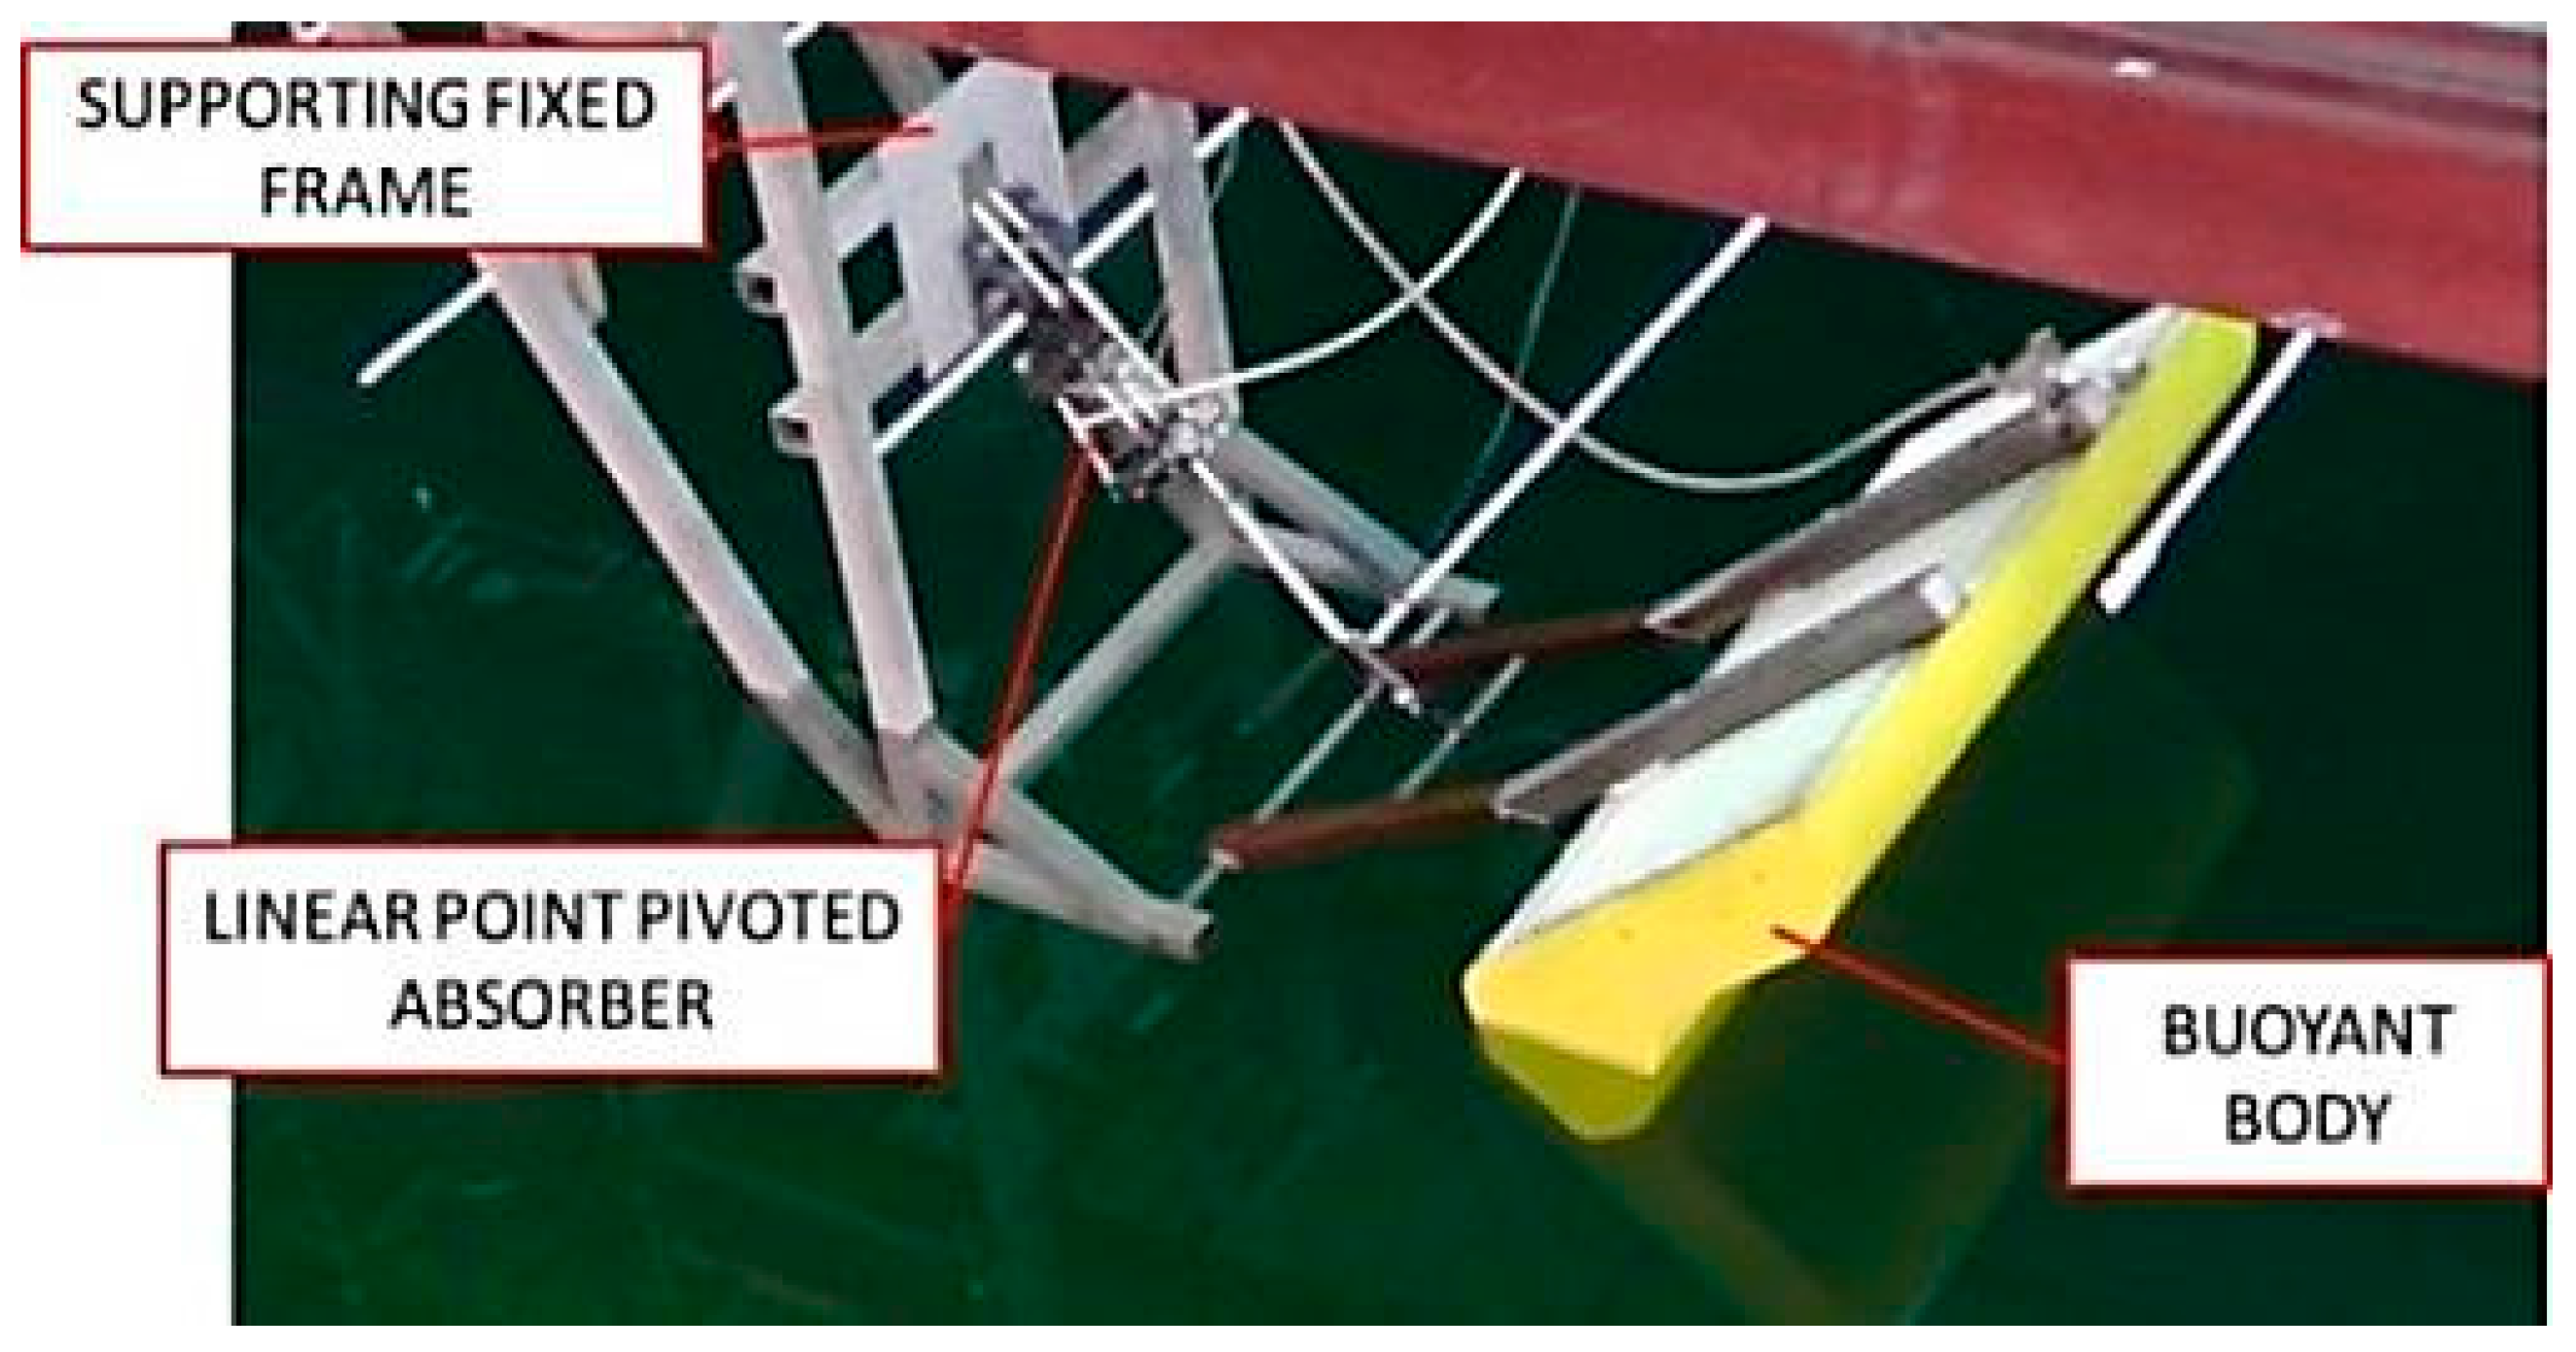
In this Section, each of the facilities upon which the proposed system is built are described.

2.1. The Power Buoy

The primary system configuration is shown in Figure 1: it deals with a floating body anchored to a fixed frame; two hinges allow rotation of the body with respect to the frame and to the power take off (PTO) device. The PTO is represented by a device able to convert the rotational oscillation of the buoy into electrical energy; a rotational generator with a ball-screw is chosen for this purpose. The action of the waves yields a rotational movement of the buoy around the submerged hinge, which the floating body is anchored to, by means of the support arms.
The main dimensions of the WEC scale model are reported in Table 1.
For sake of clarity, a pictorial representation of the latter has also been reported in Figure 2.

2.2. The Power Take Off

As hinted above, the PTO considered in this paper is a ball screw-based generator. This design assumption is driven by the fact that this technological solution, with respect to direct drive linear generators, is able to ensure a relative higher speed ratio and, hence, higher power density [25]. In this manner, a significant reduction of the generator size can be achieved, minimizing the space employed on the floating structure. The ball screw-based generator included in the WEC scale model has been preliminary designed via finite element method (FEM) simulations. The main electro-mechanical parameters are reported in Table 2.

2.3. The Measurement Apparatus

The system under test is equipped with a sensor network able to monitor the produced electric power, the wave elevation, and the buoy displacement. While the electric power measurements have been implemented by using Hall effect current/voltage transducers, the wave elevation measurement is obtained by means of ultrasonic probes. Finally, the buoyant body displacement around its equilibrium position is derived by a linear variable differential transformer (LVDT), which transduces the linear position of the system.
The collected data have been used to compare the experimental results with the ones derived by an accurate numerical model [26].

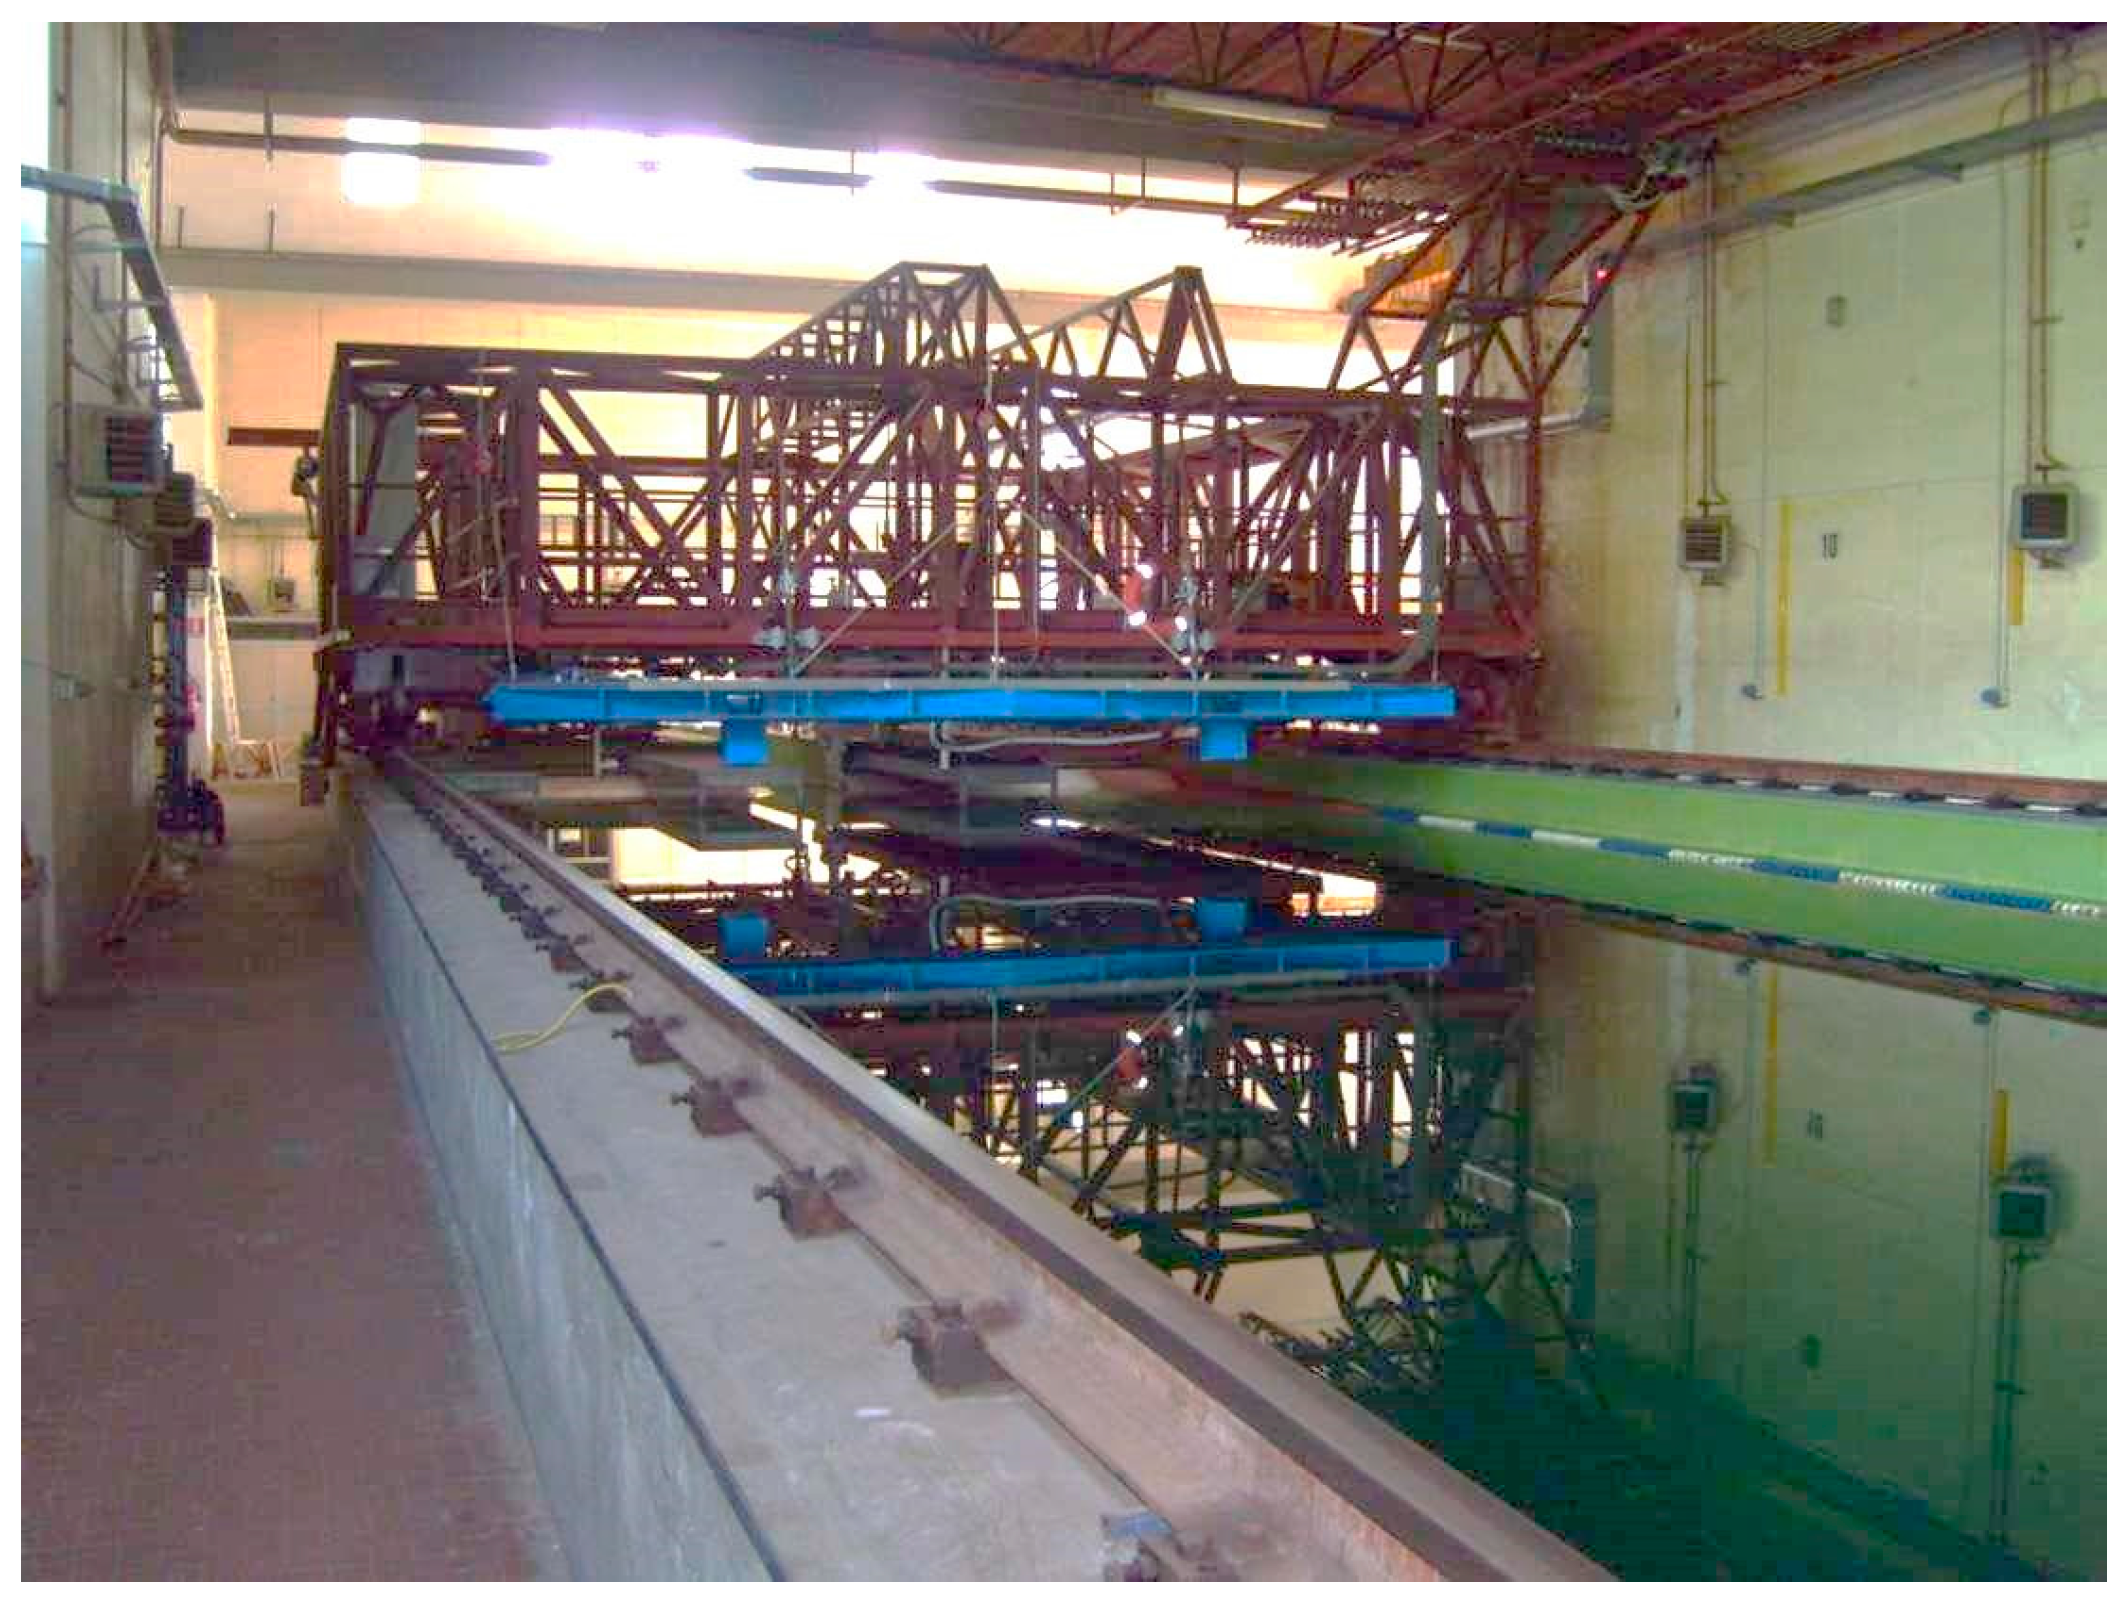
3. Experimental Test Bench

In the following Subsections, the experimental test bench and several prototype results based on a 1:2000 scale-model are shown.

3.1. Towing Tank

The experimental results reported in this section have been obtained in the towing tank of the Department of Industrial Engineering (Naval section) at the University of Naples Federico II. A picture of the towing tank is shown in Figure 3. The related overall dimensions of the basin are 120 m (length), 9 m (width), and 4.5 m (depth).
A wave generator produces waves with the required amplitude and frequency, thus emulating different sea conditions. The towing tank is equipped with a towing carriage, which is able to move along its length (Figure 3). The small-scale WEC prototype is rigidly anchored to the bridge, while a moving wall wave generator, installed at one end of the basin, is able to work in the operating frequency interval (0.35–1.2 Hz) with a maximum wave height value of 0.6 m.

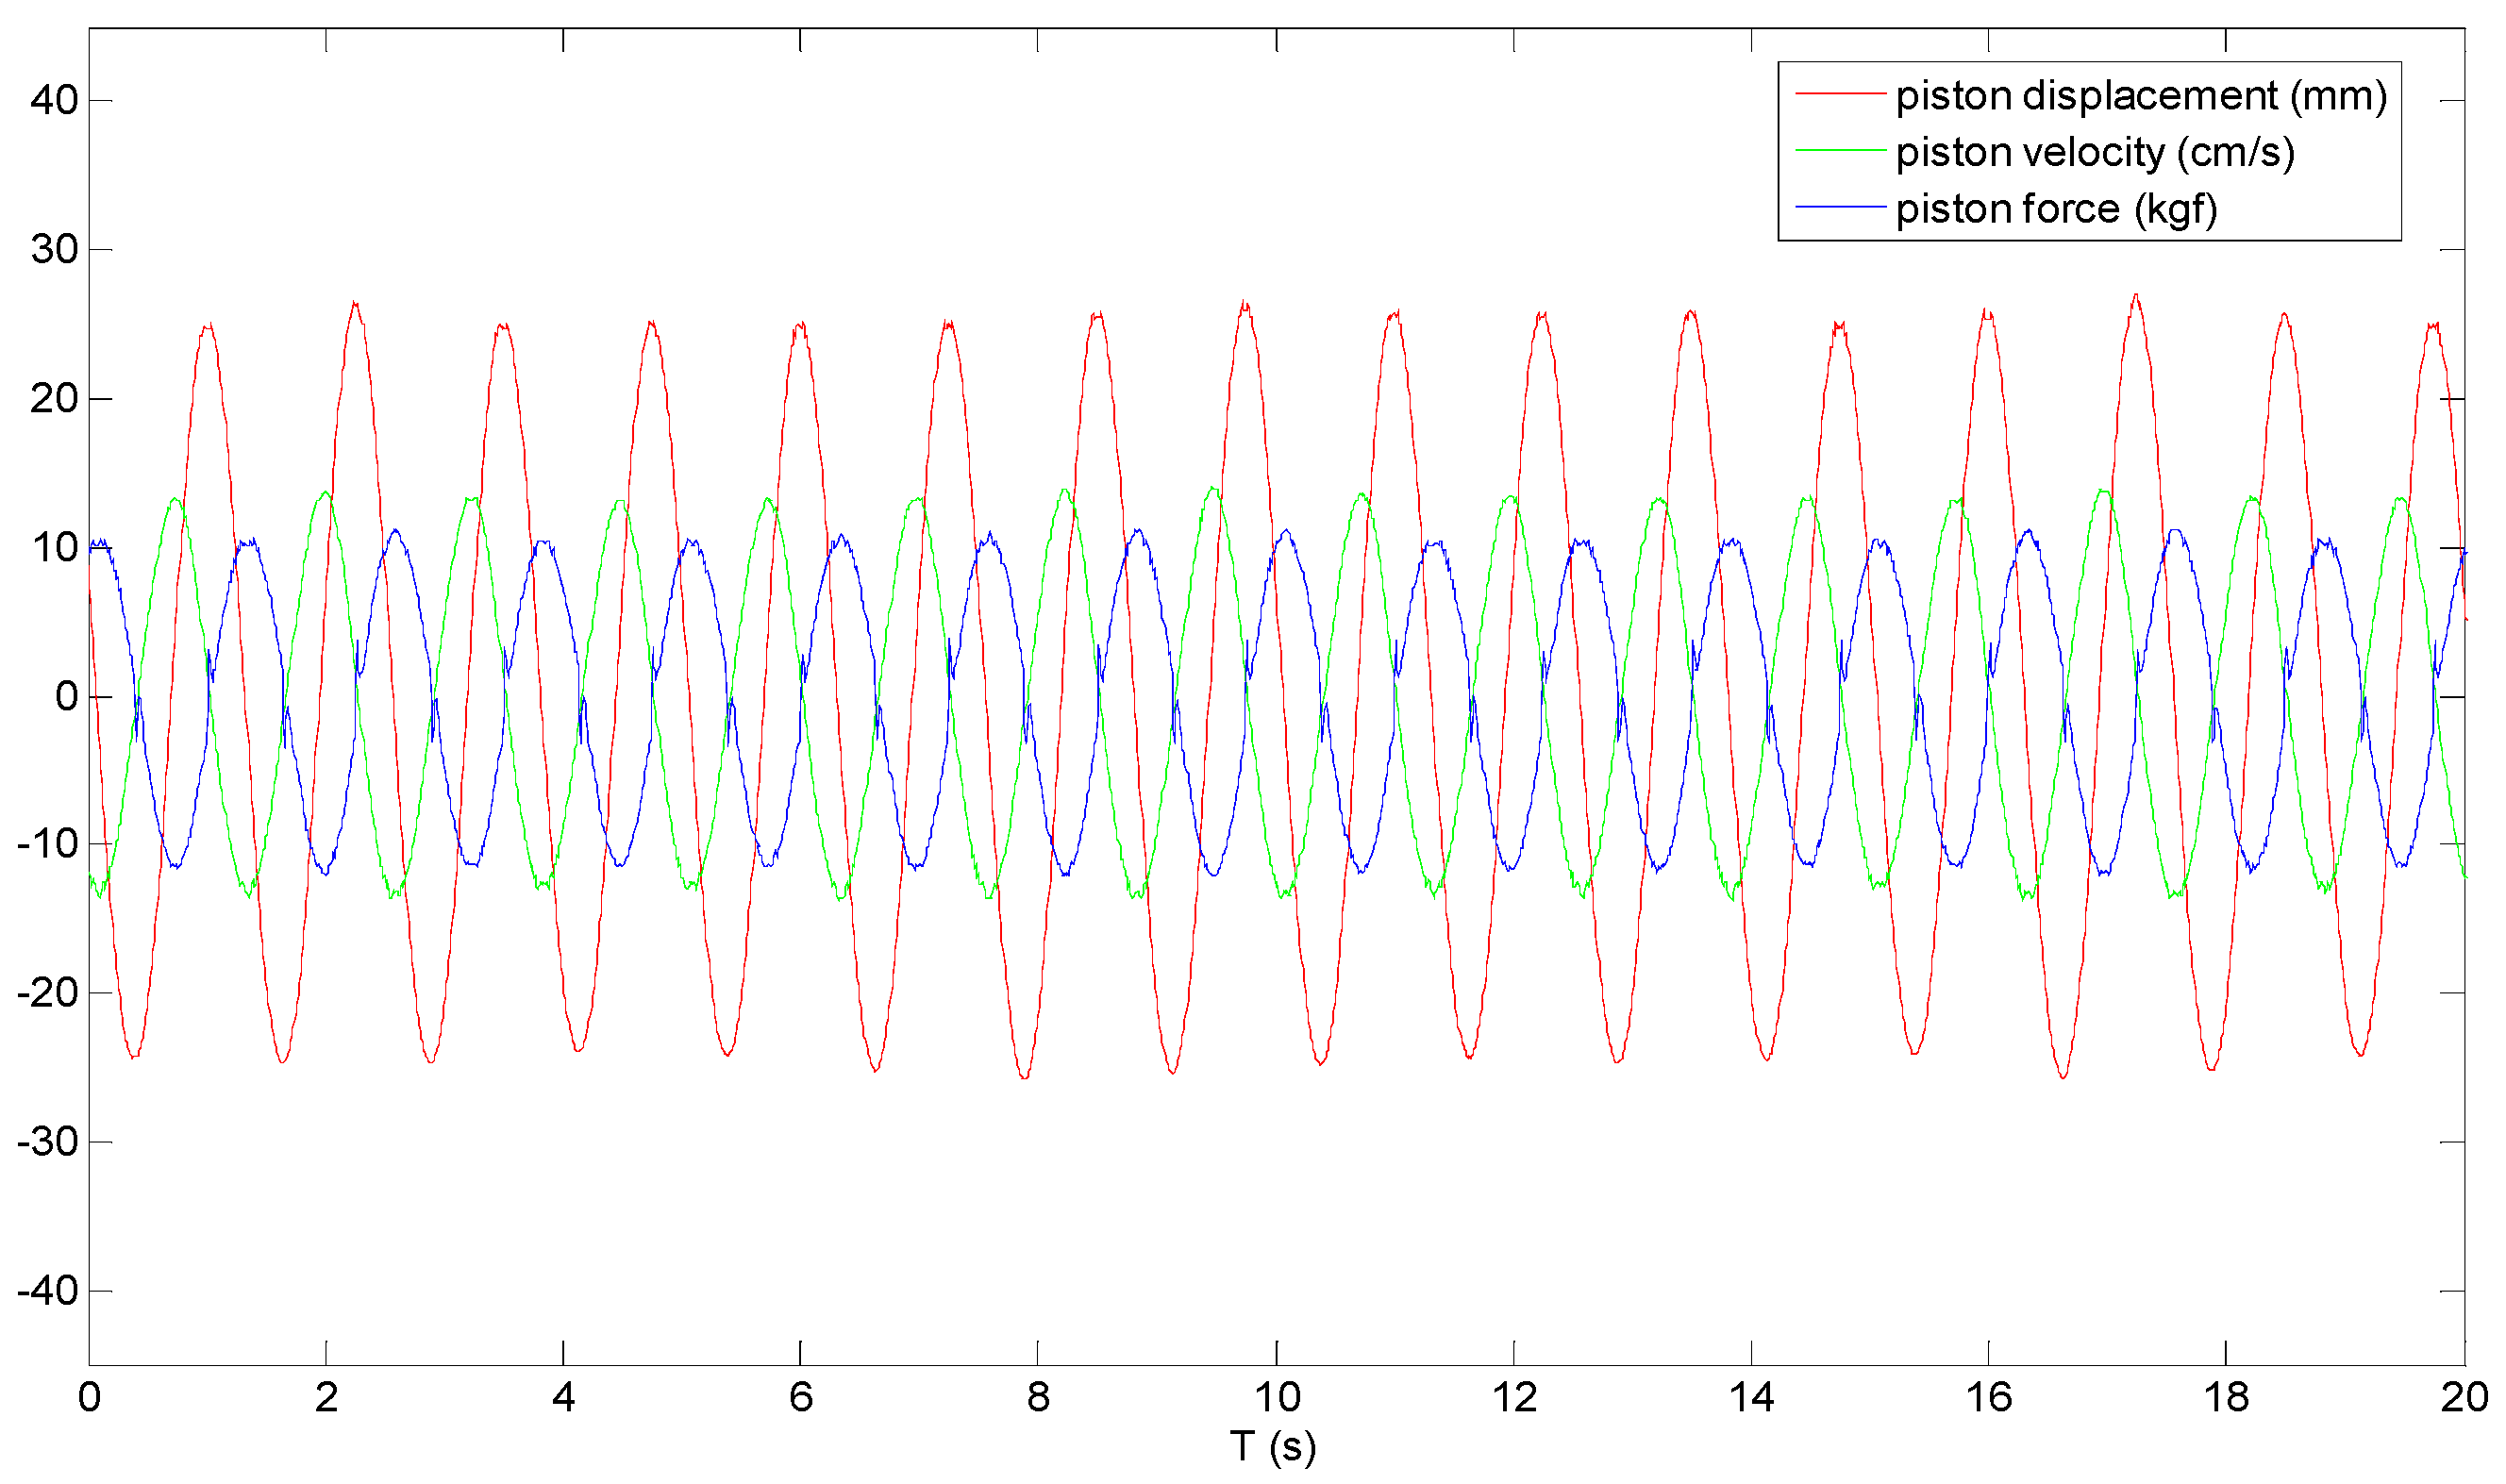
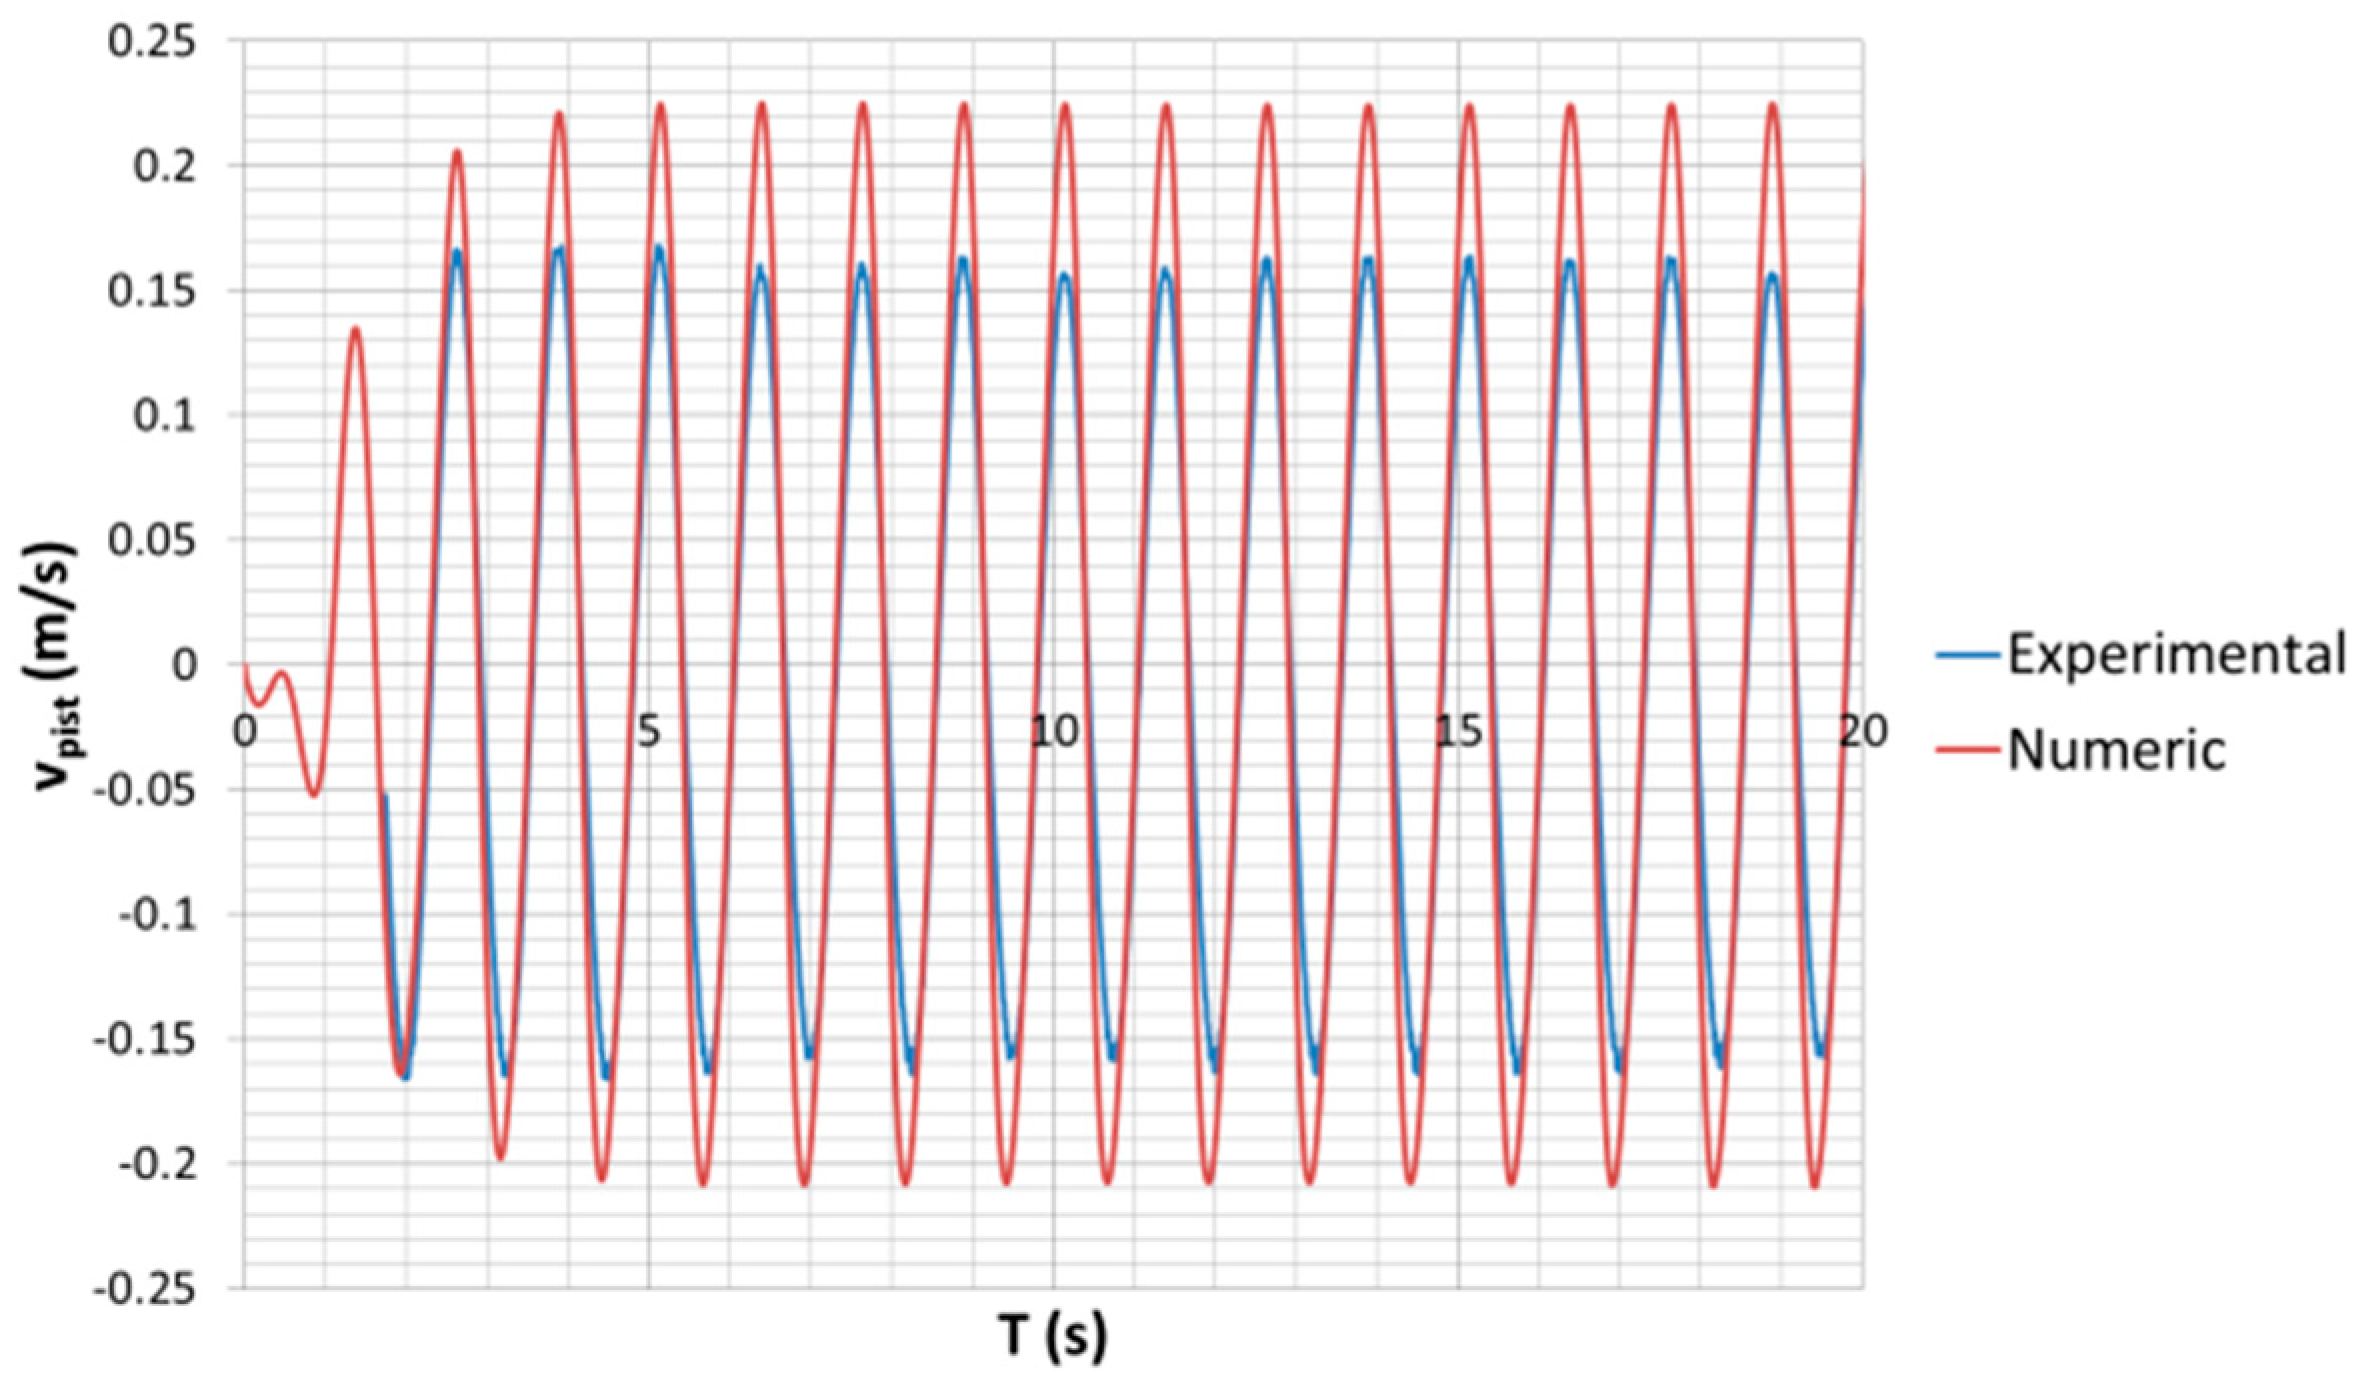
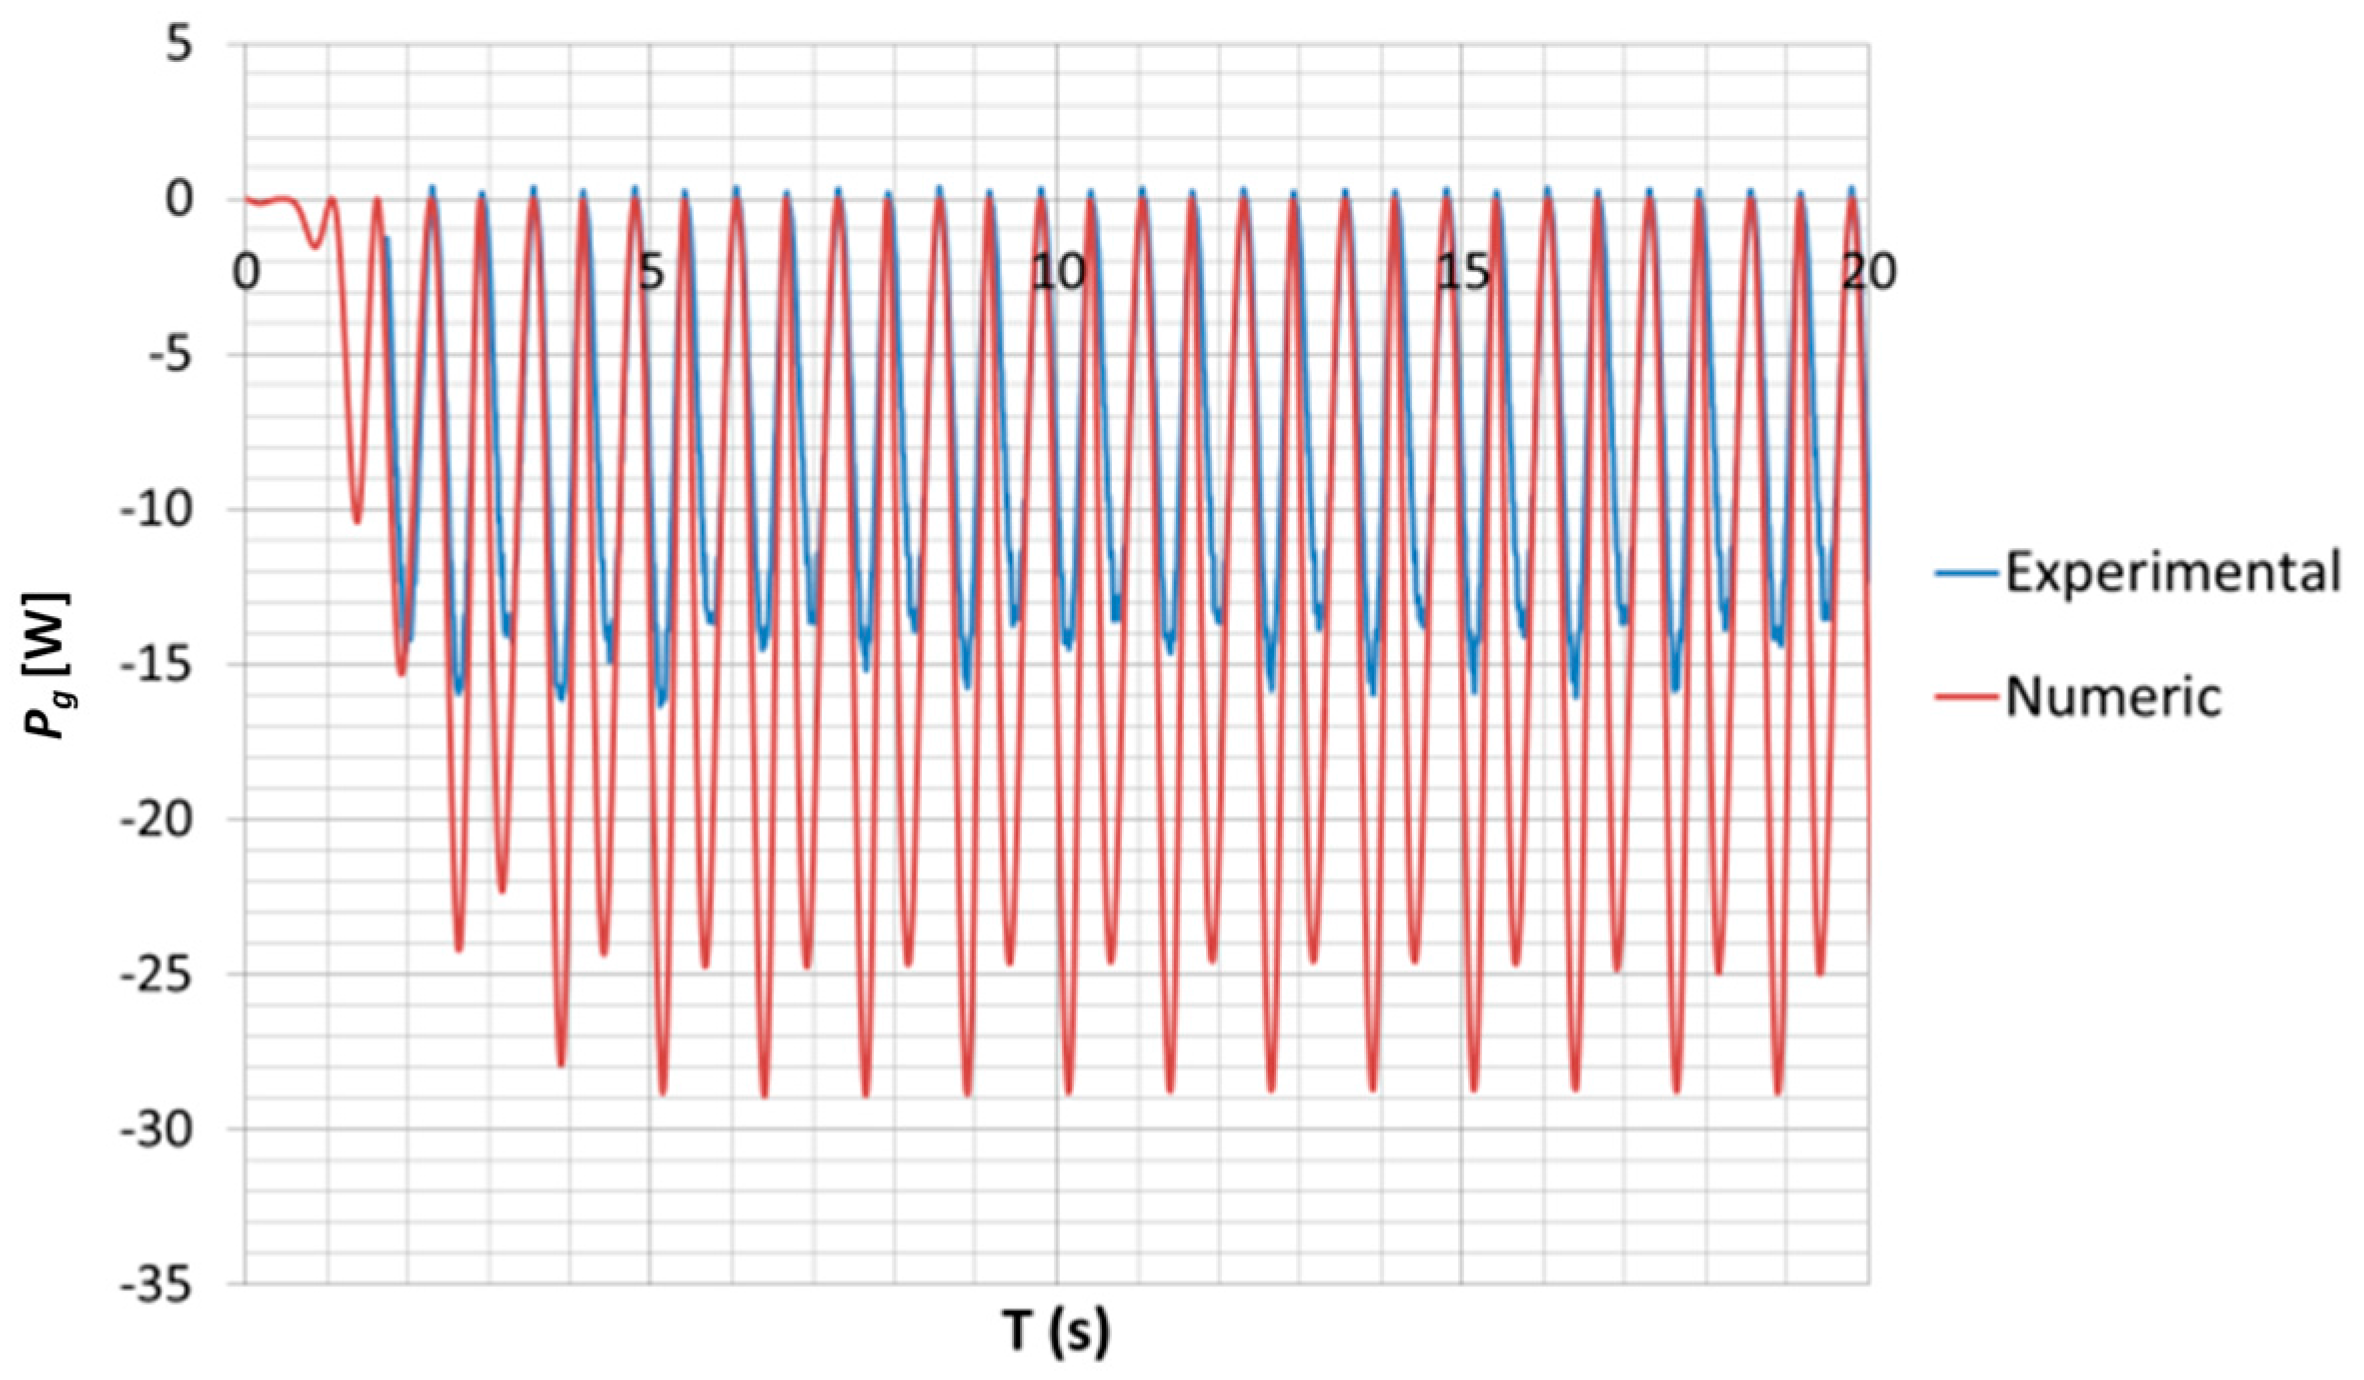
3.2. Experimental Results

The main aim of the towing tank tests was to analyse the response of the system prime mover under different operating conditions. In order to achieve such a task, a load cell and a potentiometer were mounted on the PTO piston. Speed is obtained by displacement differentiation of the potentiometer measurement signal.
In order to define the PTO behaviour, a suitable control law has to be chosen. During the tests, a purely active control law has been assumed, defining a linear relation between piston force and speed, according to the following equation:
F g = k P P A v P P A
Where Fg is the force acting on the PTO piston, v P P A is the piston deformation speed, and k P P A is an adjustable gain; the negative sign is related to the opposite direction of force and speed. The system response and power performance are significantly influenced by the value of the PTO force-speed gain. To impose the required force control law, a controlled pneumatic actuator acting as a damper is used. Force and speed signals are also used by the control system to determine the required force response. Power output has been estimated from the piston force and speed; such an estimation method has been used in consideration of the relatively low level of expected output power.
The system installed in the Naples towing tank is depicted in Figure 4 for one of the tested configurations (see [26] for a more detailed description of the test configurations).
During a test run, the time histories of piston force, displacement, and speed were recorded. A typical set of test results is reported in Figure 5.
Several tests have been performed under different operating conditions with different wave frequencies and amplitudes and for different values of the force-speed gain. A brief summary of the test output is reported in Figure 6 in terms of average power output for different frequency and gain values and for a 5 cm wave amplitude.
A peak in power output is observed in proximity of the system natural frequency (0.83 Hz), and in correspondence of an optimal piston force-speed gain value of ~540 Ns/m; the observed power peak value is around 8 W for an incident wave amplitude of 5 cm.
In order to obtain an adequate characterization of the wave energy source and simultaneously evaluate the maximum extractable power, it is necessary to know the energy spectrum in the real-sea “mixture” of waves. In particular, for real sea waves, the average stored energy per unit area of sea surface is:
E t = ρ g 0 S ( f )   d f = ρ g 16 H s 2   [ J / m 2 ]
where ρ = 1030 kg/m is the mass density of sea water, g = 9.81 m/s2 is the acceleration of gravity, and Hs is the significant wave height for the current sea state, which is traditionally defined as the average trough-to-crest height of the one third of the recorded waves with the highest heights. Et is equally subdivided between kinetic energy, as the result of the water motion, and potential energy, as the result of its position. The energy spectrum can be derived either by a classical Fourier analysis or, in the case of “fully developed wind sea”, by using the semi-empirical Pierson–Moskowitz spectrum approximation [8]. Once the wave energy has been characterized, Newton’s law on floating buoy can be formulated by considering the contribution of all of the forces acting on the WEC.
Overall, it is widely known that the maximum power extraction occurs when the buoy oscillates synchronously and in quadrature with the wave at the installation site, with a displacement proportional to the wave amplitude according to its wavelength. These optimal conditions can be followed either by a proper control strategy (i.e., latching control) or by specifically sizing the oscillating system in order to match its natural frequency and the expected wave frequency in the installation site. This last approach has been used for the considered system, i.e., no latching control is used while the proposed control strategy refers to an active control law for which the extraction gain is dynamically adjusted.
Moreover, it has to be highlighted that for a heaving point absorber only half of the stored energy wave can be taken. In this case, instead, the proposed WEC is able to extract from the wave not only the energy due to the vertical motion, but also an additional contribution, to be assessed, relative to the horizontal thrust. Indeed, as shown in Figure 6, for a fixed amplitude/frequency of a wave, equal to 5 cm and 0.8 Hz, respectively, the maximum power extractable by the proposed WEC is higher than the ideal amount a heaving mode WEC (50%) would extract from the incoming wave. Indeed, for the considered scale prototype, the power rate extraction has reached almost 65% of the ideal rate, equal to a 30% increment with respect to a heaving mode WEC. This result can be confirmed starting from the mean power of a sinusoidal wave:
P ¯ b = 1 8   ρ g A 2 v g
where A is the wave amplitude and vg is the wave group speed. In particular, at 0.8 Hz, with a wave amplitude of 0.05 m, the expected wave power density is 12 W/m versus about 7.8 W/m extracted by the proposed WEC.

3.3. Buoy Oscillation Response Numerical Model

A numerical model has also been developed for the solution of the wave-body interaction problem and the analysis of the system response. The model’s purpose is to give a better understanding of the floating body behavior and to compare different buoy shapes and solutions at a design stage. The model is based on a potential flow solver [26]. After an analysis of the hydrodynamic parameters in the frequency domain, the model provides a time domain solution of the floating body motion and allows for an estimation of the system mechanical output. The model also accounts for the chosen PTO force control law (proportional relation between piston force and speed) and for the geometric non-linearity in body motion.
A comparison of the numerical and experimental results is reported in Figure 7 and Figure 8, in terms of piston speed and mechanical power output, with reference to a wave amplitude of 5 cm and a frequency value of 0.8 Hz.
As can be seen, even if the power output is largely overestimated, the qualitative response of the system seems to be well represented, at least for the examined operating conditions. The difference between the simulated and experimental results may partially be explained as a consequence of the model assumption of potential flow, which completely neglects viscosity effects.
Although a discrepancy is observed between the numerical and experimental results, with the proper attention and the eventual use of suitable correction factors, the model may be considered acceptable in a design stage for comparing different system configurations and for parameter sizing.

4. Control Strategies for Maximization of the Energy Harvesting from Wave Energy Converter

As highlighted in the previous sections, the energy from marine waves offers great potential in the field of energy production from renewable sources. Different types of WECs are classified by their mechanical structure and by the function of the working principles. In this section, a brief overview of strategies for the electrical control of the WECs is presented. In particular, these strategies are used in order to obtain higher harvested energy from the employed WEC. Obviously, the control strategies are dependent on the type of implemented wave energy absorber (point pivoted absorber (PPA) or heaving point absorber), on the electric generator, on the topology of power converters and, eventually, on the ESS. Based on several different combinations, it is clear that a large variety of strategies can be employed.
Each of these strategies, although aiming to maximize the energy harvesting from the marine waves, have other additional features that are of interest in identifying the correct strategy regarding the proposed application. In particular, the WEC control strategy can be twofold: it is possible to make a “hydraulic” control and/or use “full electric control strategies”. In the latter case, the whole system control strategy can be arranged in different hierarchical layers. Indeed, the WEC control strategy computes the references for the electric generator control strategy, which in turns drives the power converter modulation.
Moreover, with reference to the power grid connected converter, a proper grid control strategy has to be formulated in order to minimize the power fluctuation. Different solutions have been previously proposed [27,28,29]. Some of the authors have proposed as a viable solution a grid control strategy with a supercapacitor-based ESS in [24]. Typically, the electric generator torque reference is processed by a direct torque control with space vector modulation (DTC-SVM), while the instantaneous grid active power is imposed by means of a direct power control with space vector modulation (DPC-SVM).
This paper proposes a P&O full electric control strategy for an embedded PPA.

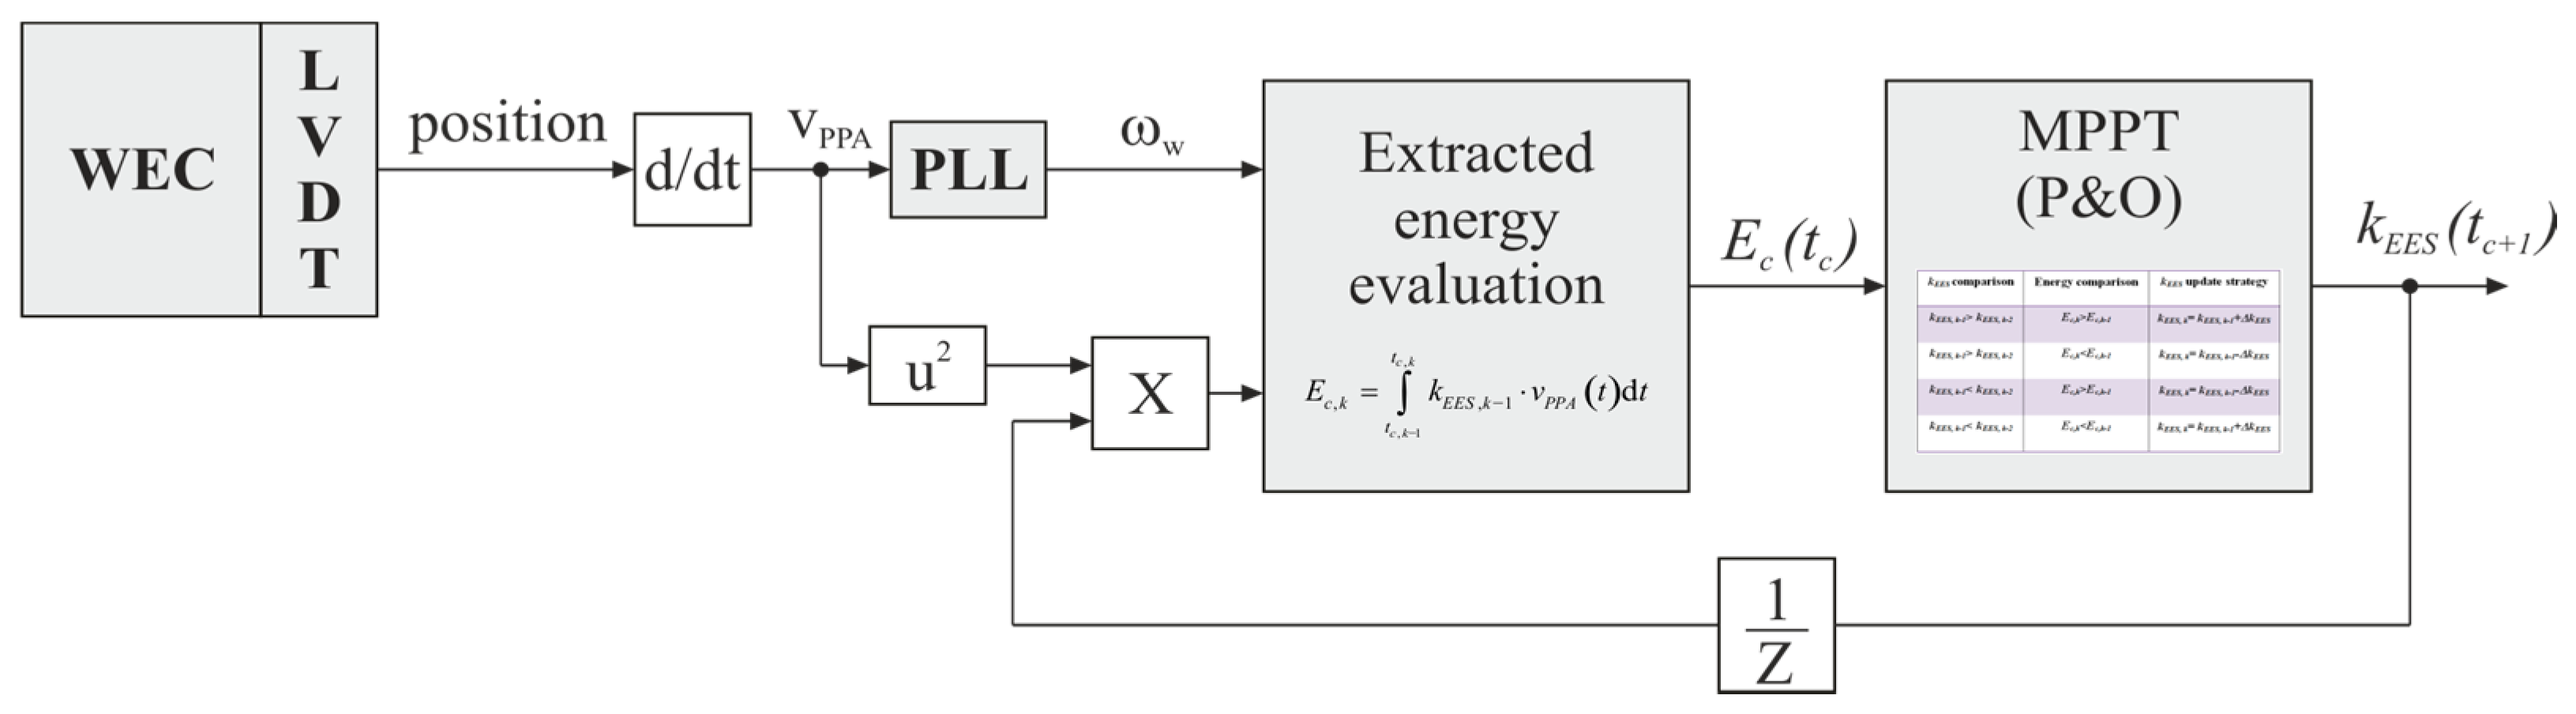
5. Proposed Control Strategy: Perturb and Observe

The full electric control strategy has the aim of extracting the maximum power from WEC regardless of the type of wave and its time variability. However, starting from a WEC already optimized for a wide frequency spectrum, no latching control is needed in the proposed application. Therefore, only one degree of freedom remains once an active control law for the PTO is formulated:
F g = k E E S ( t ) v P P A
where k E E S ( t ) is defined as wave energy extraction strength.
While v P P A can be estimated by the buoy position measurement, k E E S should be chosen in order to maximize the average power extracted by the WEC over a fixed time interval. The tracking of the optimal k E E S value can be implemented by a P&O strategy.
The P&O strategy aims to evaluate the wave energy extraction strength k E E S , kept constant in the “control strategy update time interval Tc”.
This time interval is linked to the wave period Tw, evaluated by means of a dq phase locked loop (PLL), the input of which is the estimated speed v P P A . In particular, Tc is chosen as:
T c = k W P T W
where kWP is an integer >1. kWP should be chosen in order to minimize the energy oscillations induced by frequency oscillations in the wave motion over the time interval Tc. Greater values of Tc optimize the behavior of the measured energy with respect to small perturbations while negatively affecting the control time response. Therefore, a trade-off value should be chosen.
The proposed control strategy evaluates in each control instant tc,k the energy extracted by the electric generator Ec,k over a moving window with width Tc:
E c , k = t c , k 1 t c , k k E E S , k 1 v P P A ( t ) d t
and computes the new value of the energy extraction strength k E E S , k to be applied in the interval ( t c , k , t c , k + 1 ) based on Table 3.
The wave energy extraction strength evaluation is then processed according to the following steps:
(1)
An initial value of k E E S is properly set based on the system size/power;
(2)
Afterwards, k E E S is updated in each control instant based on the proposed MPPT algorithm (see Table 3).
The strategy is then able to track the maximum power point by varying the energy extraction strength with step Δ k E E S . While large values of Δ k E E S would lead to a faster system response, they could also negatively perturb the energy measurement and thus affect the effectiveness of the P&O. Therefore, a compromise is needed in order to ensure an optimal overall performance and robustness.

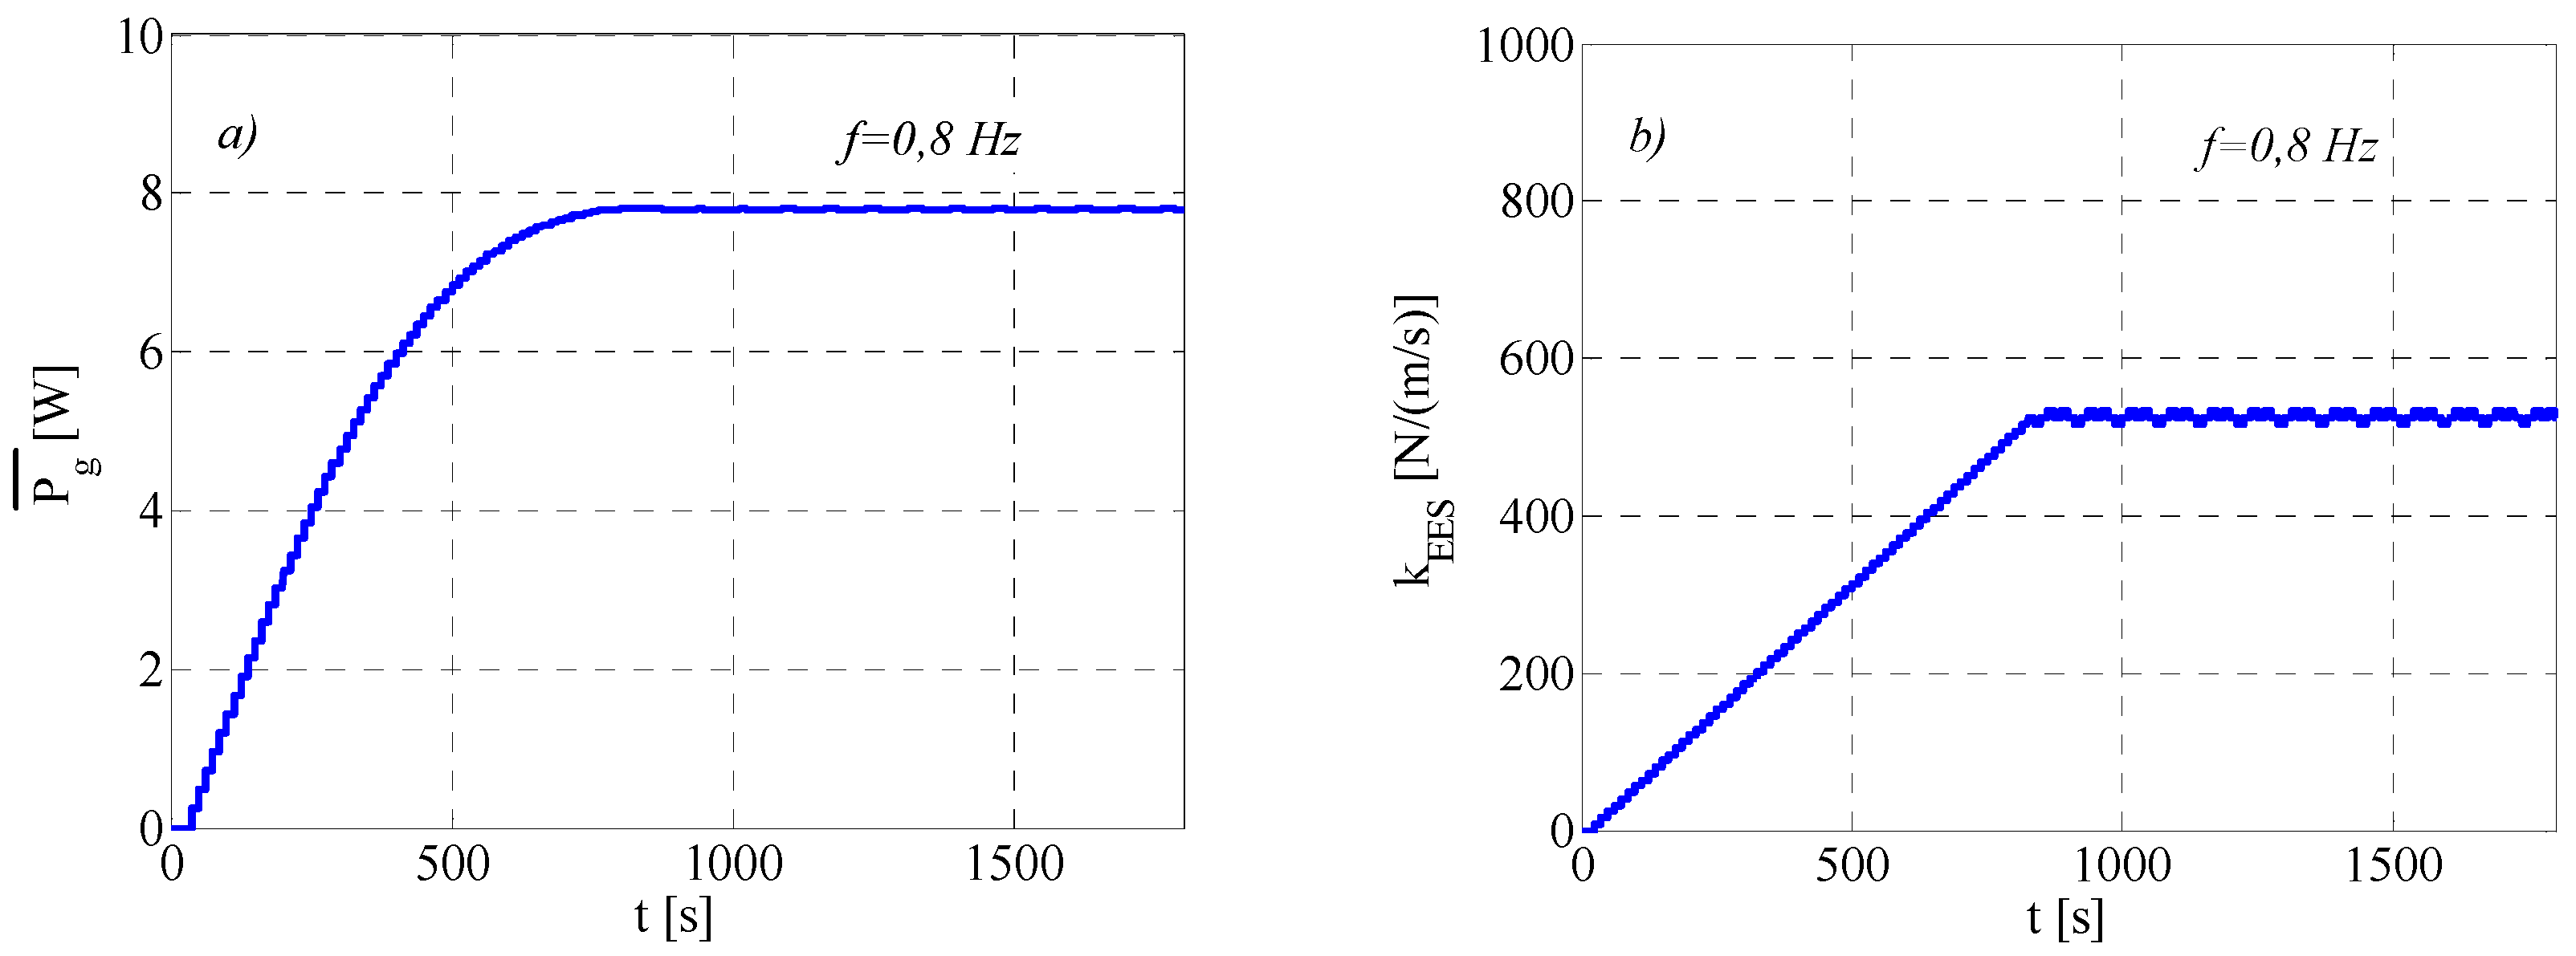
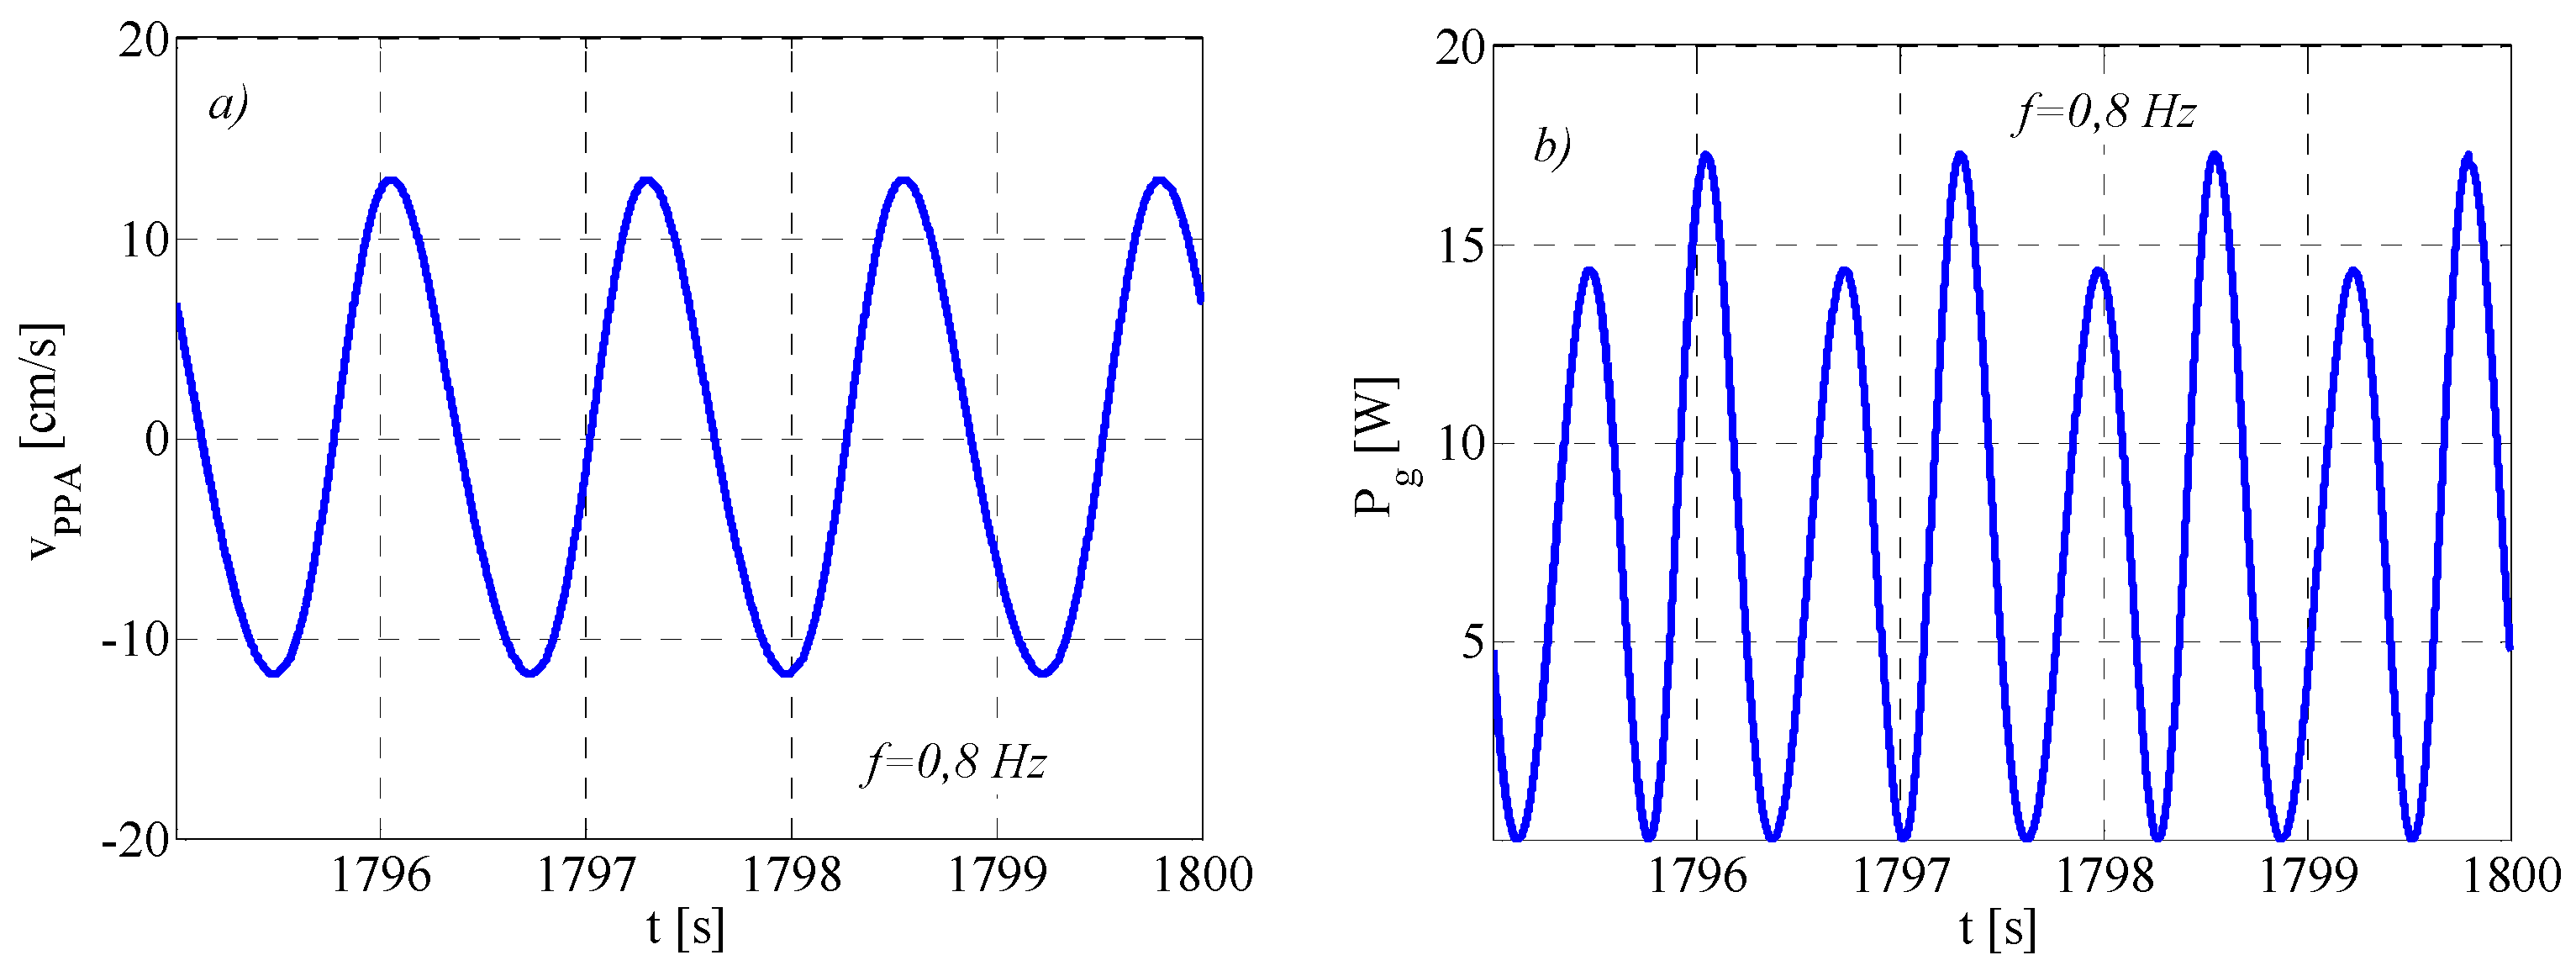
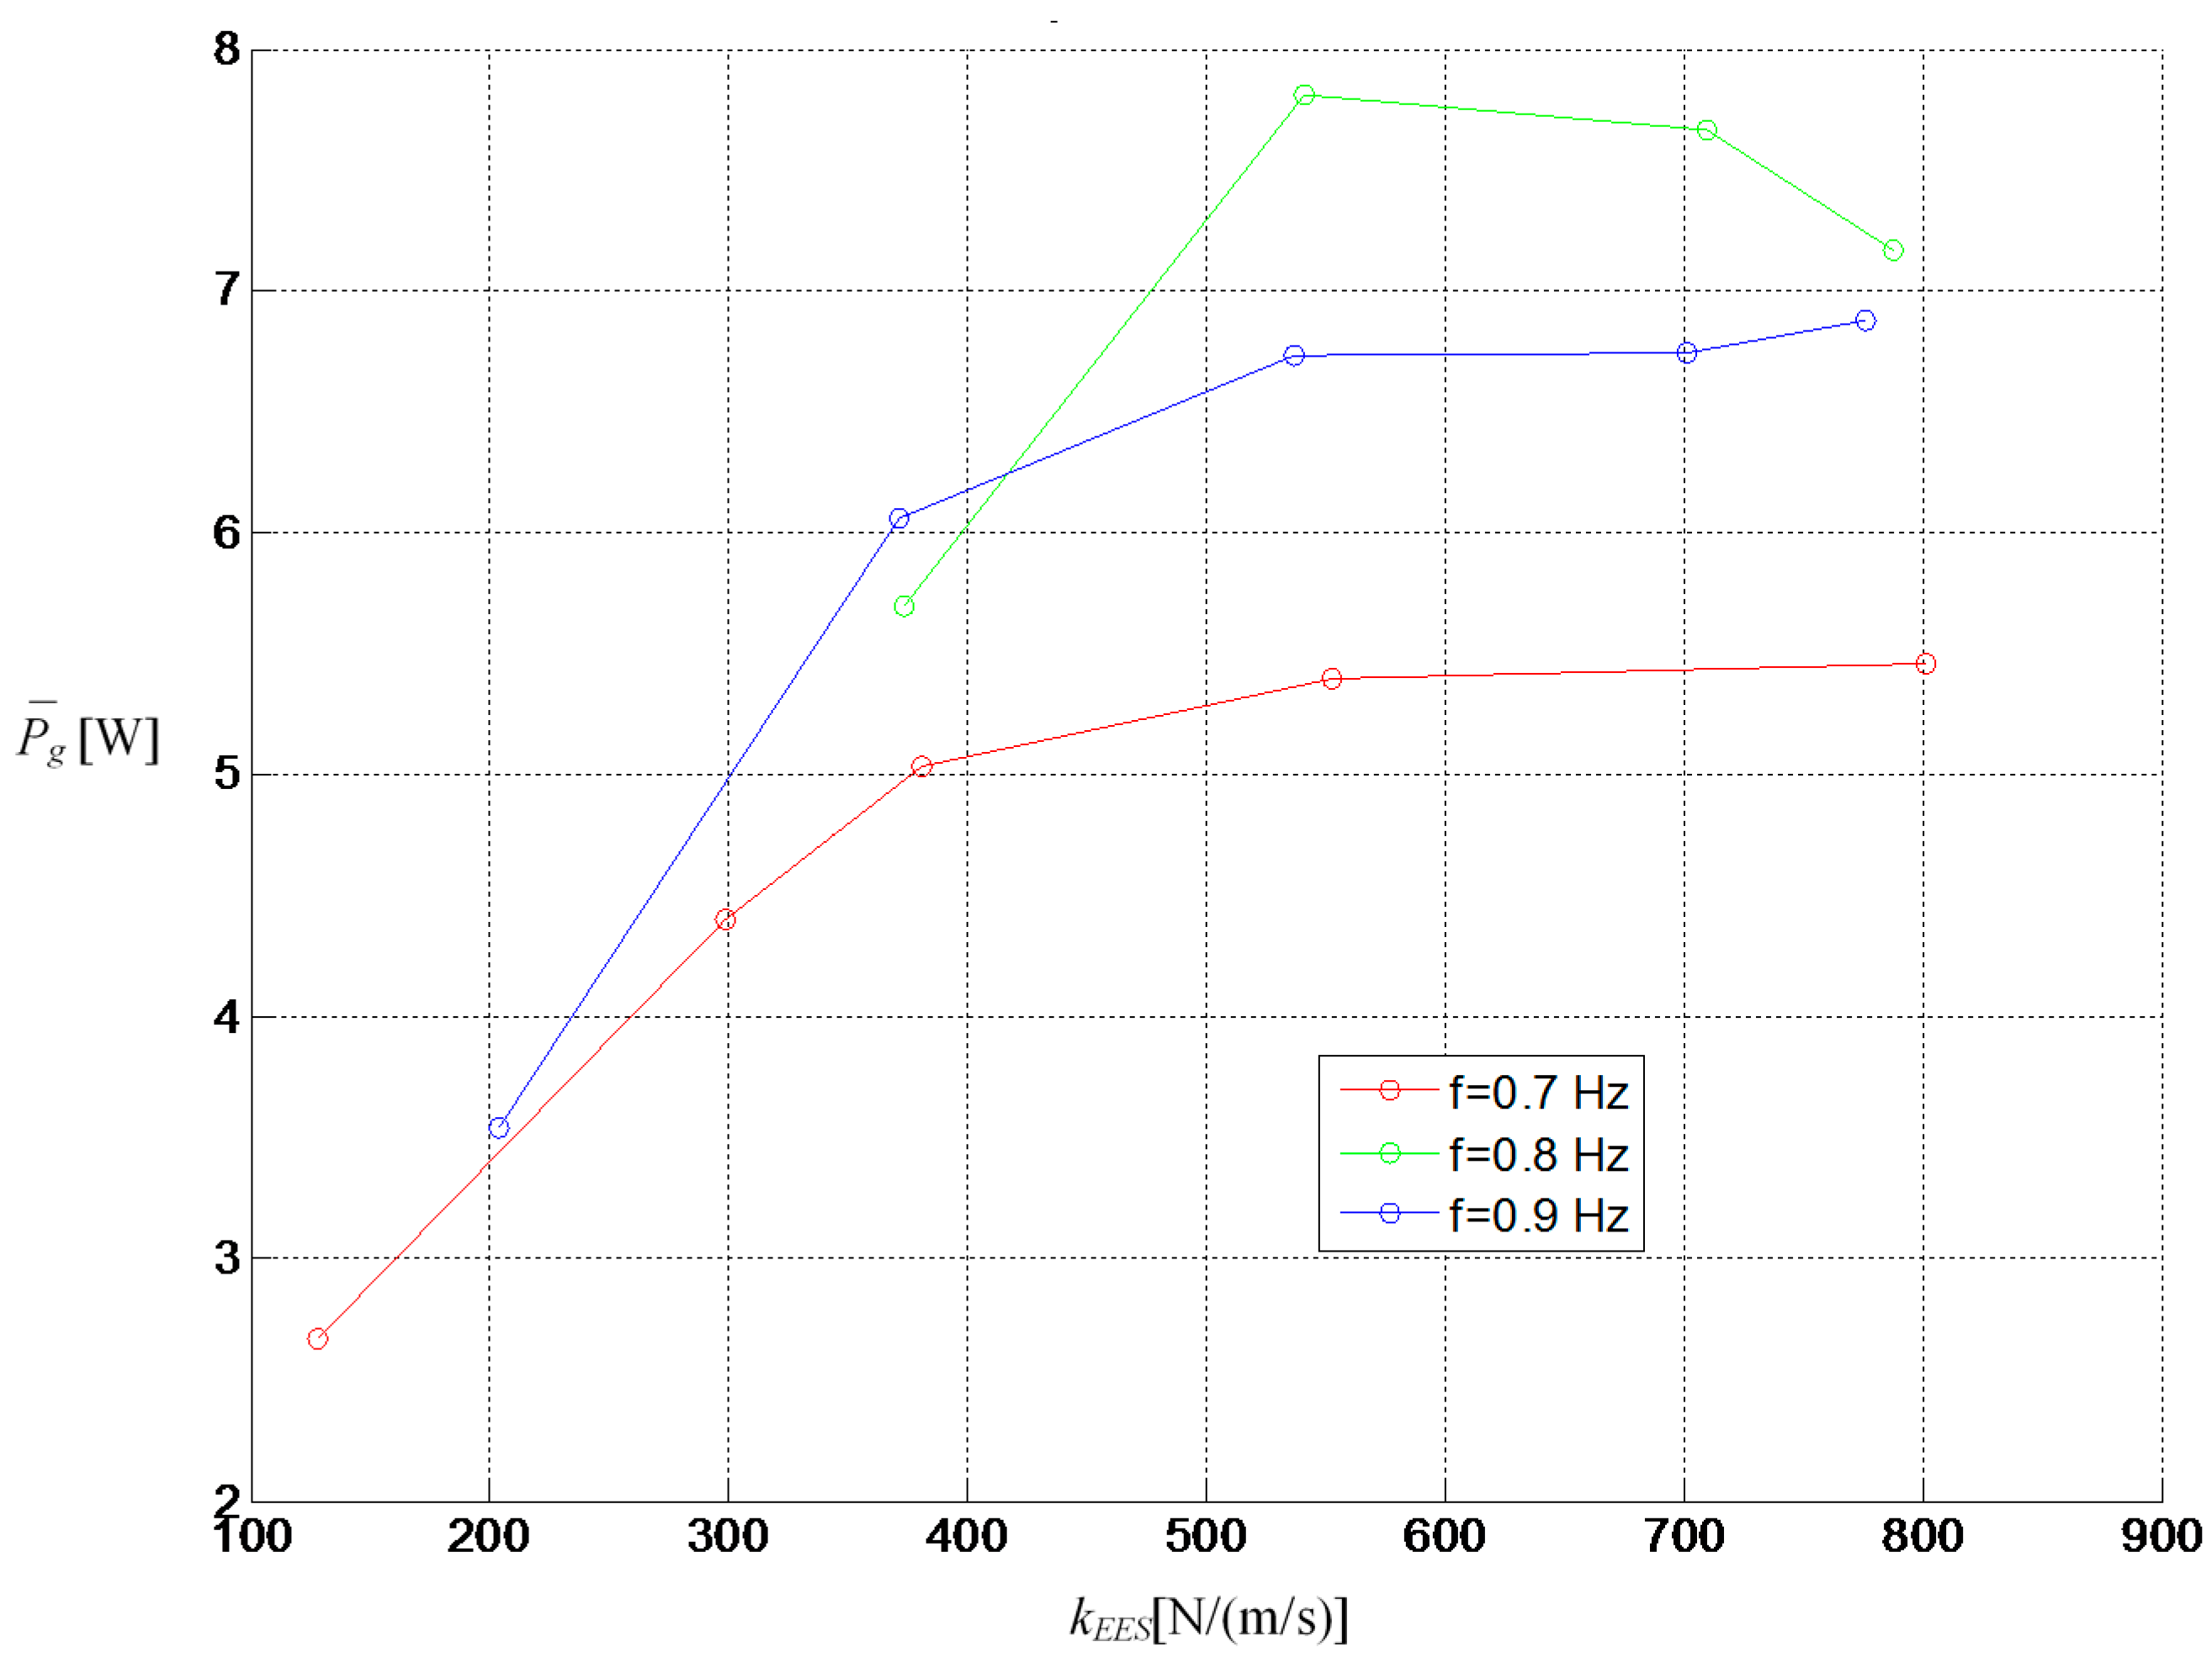
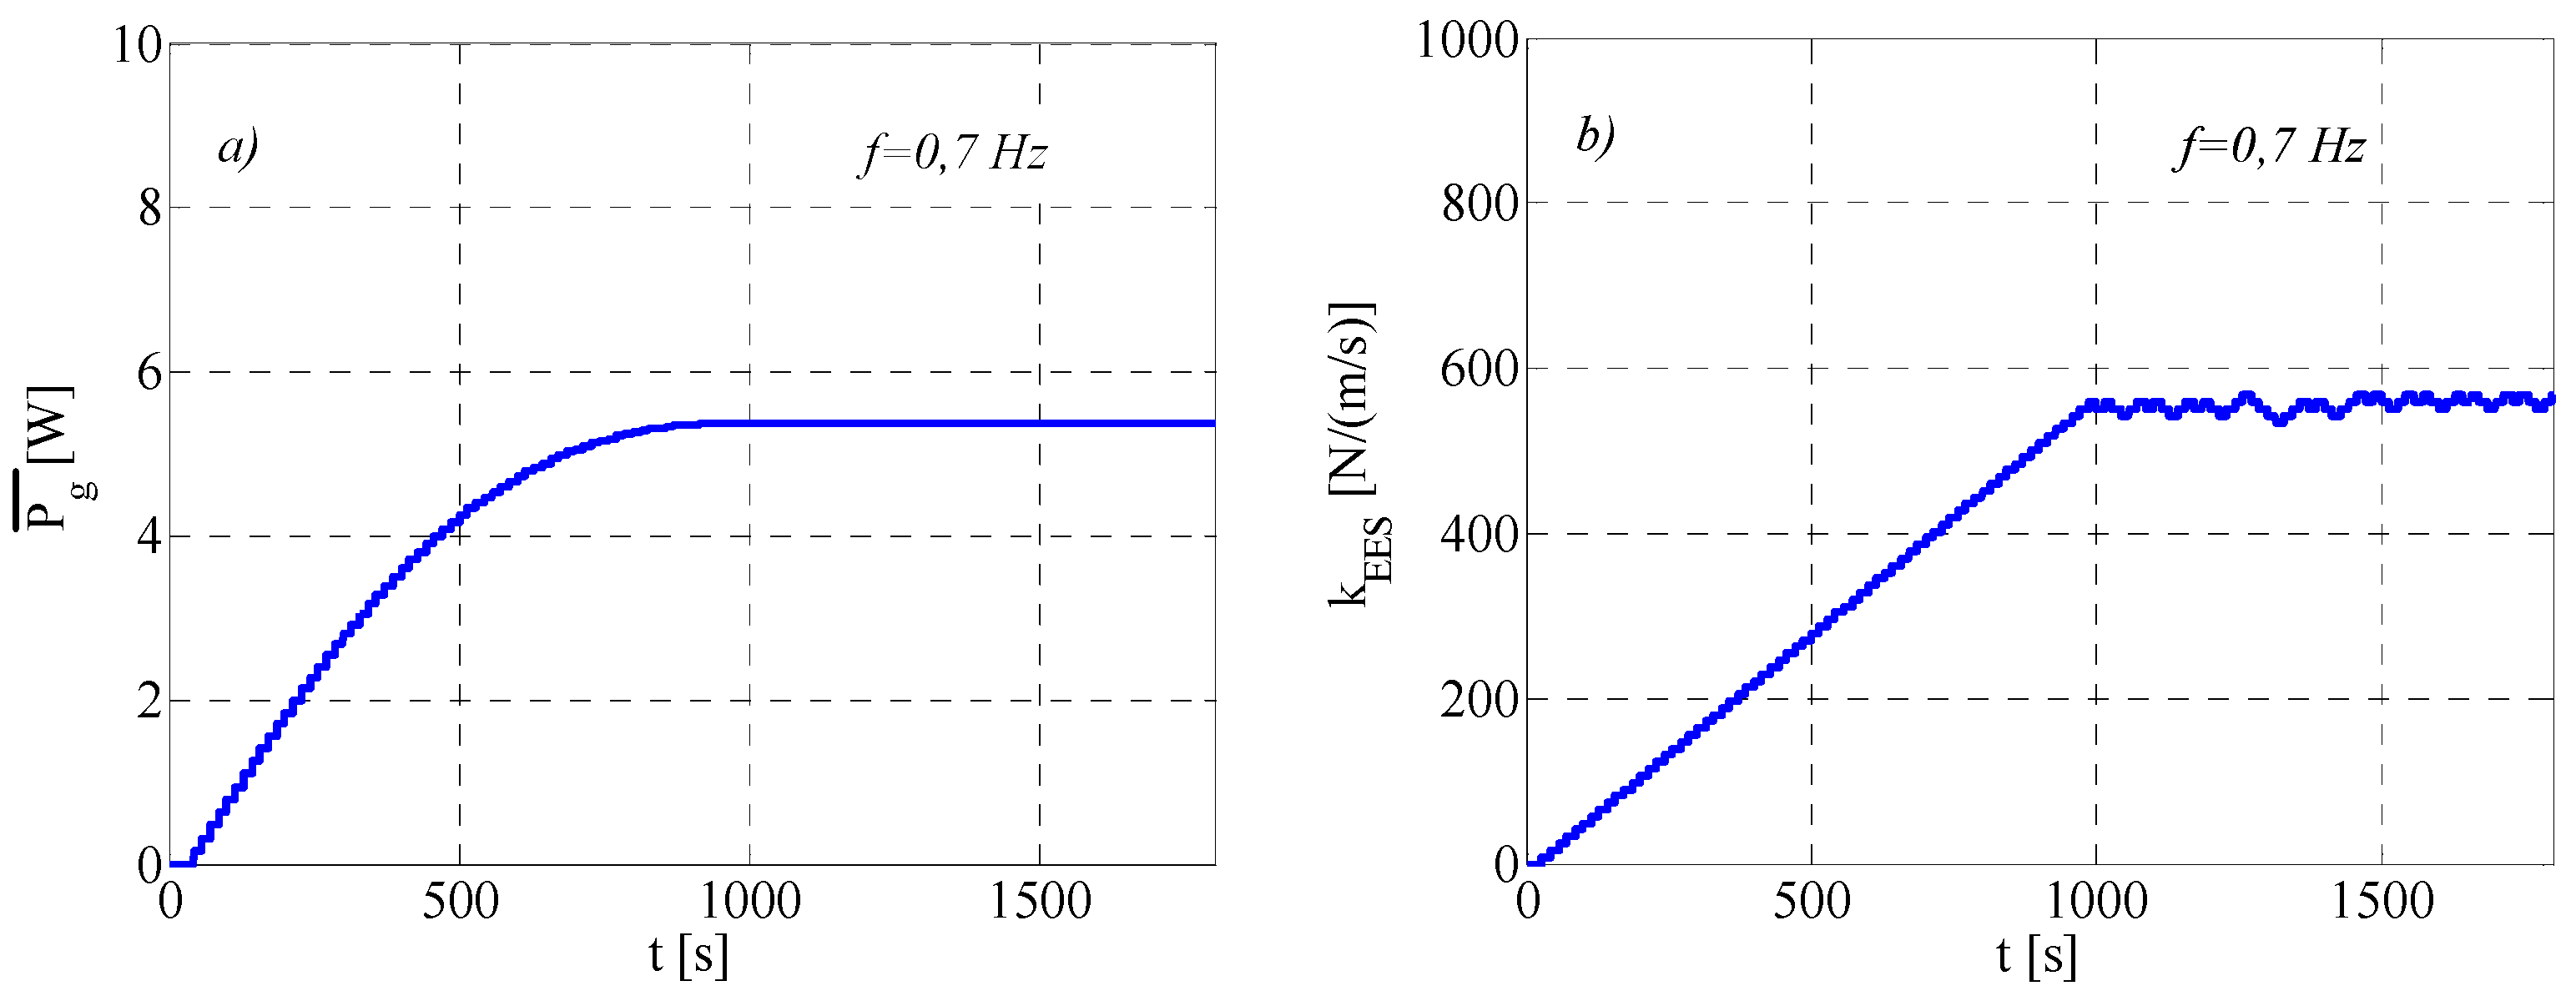
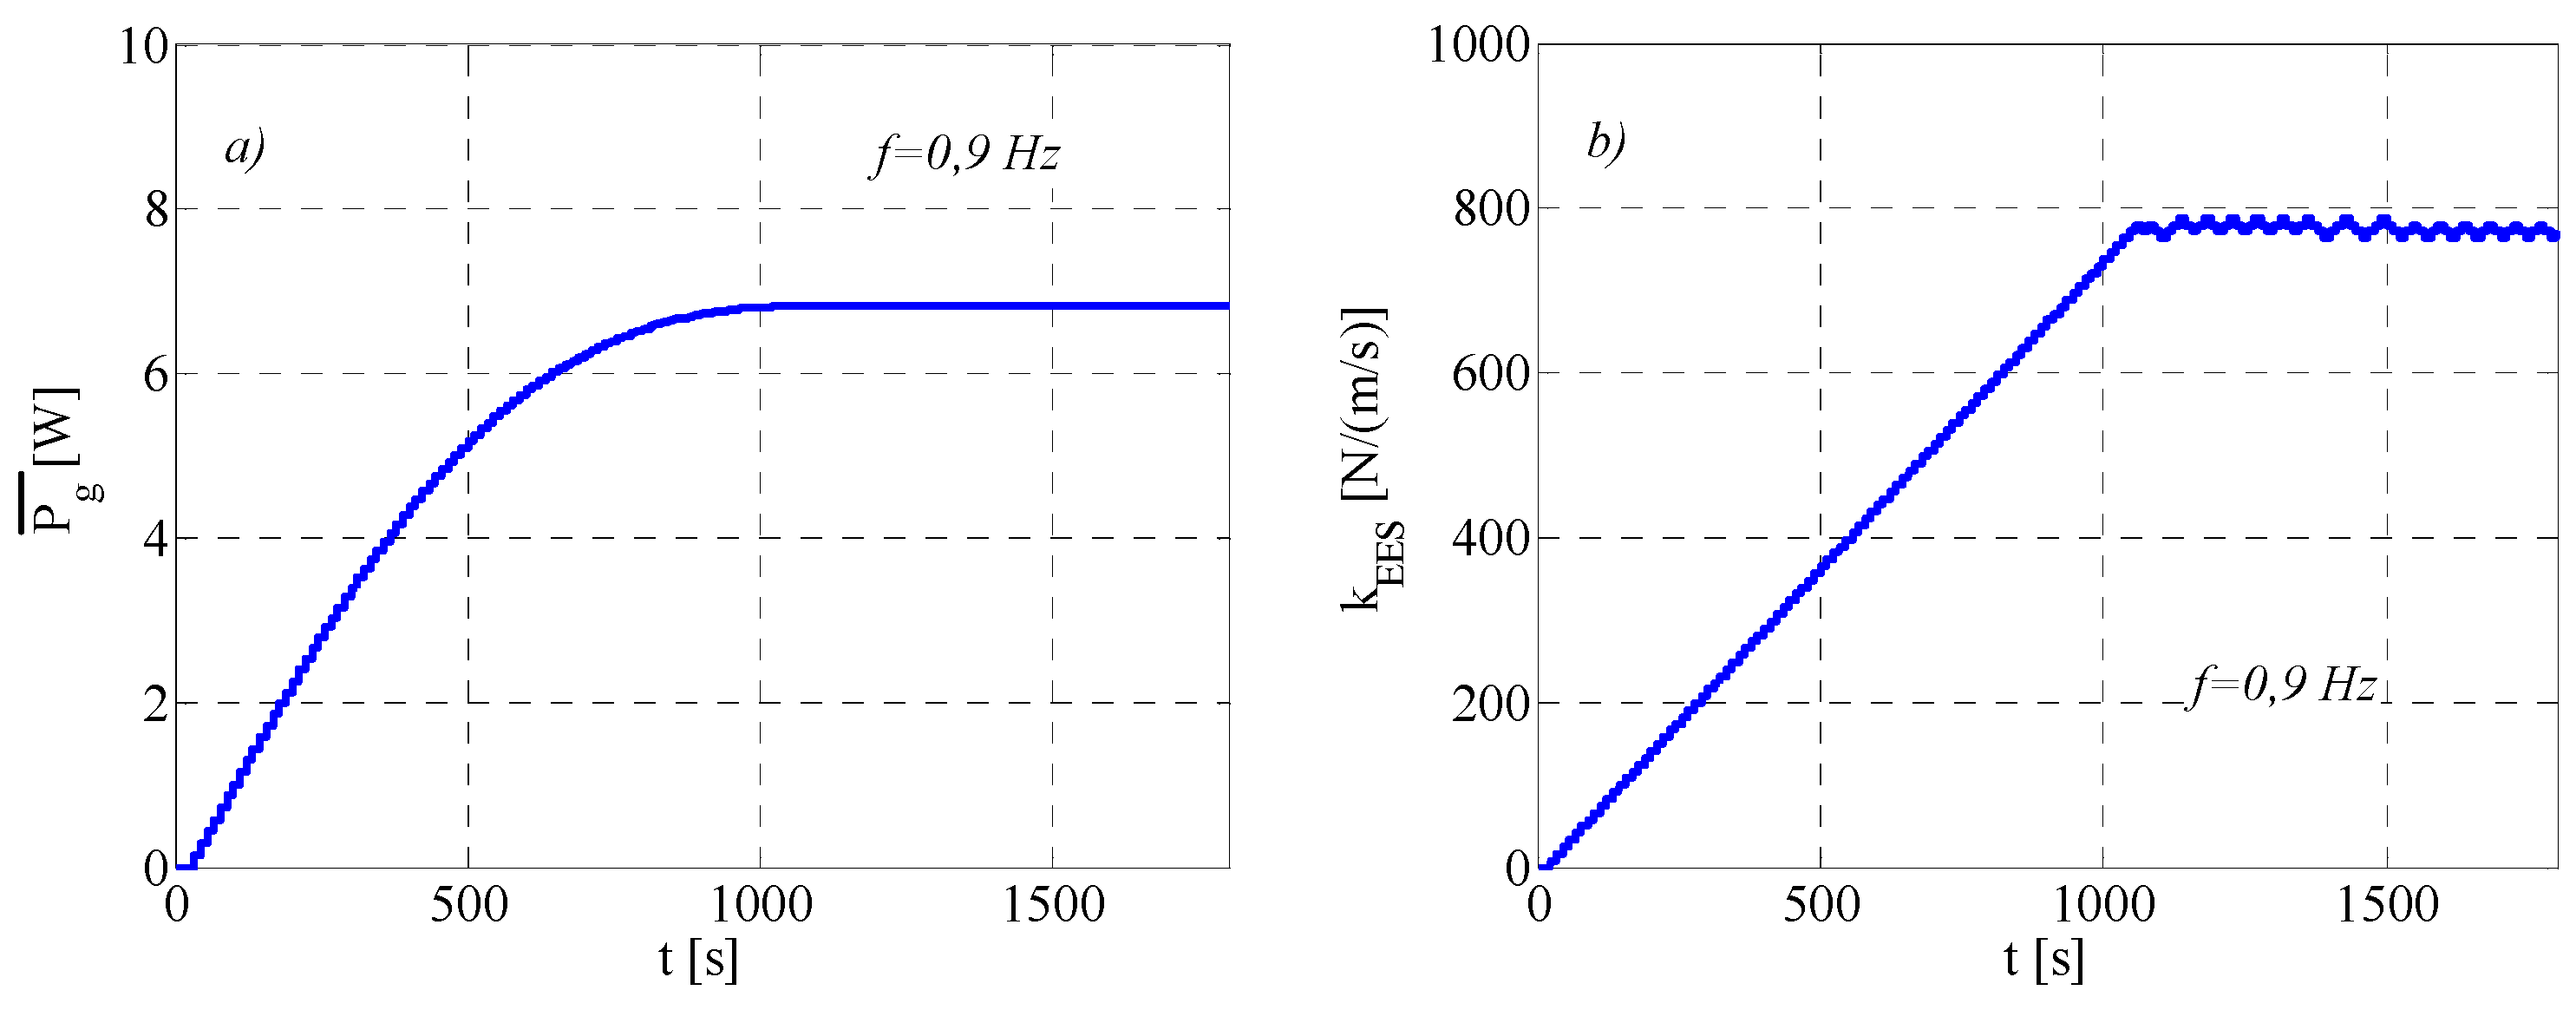
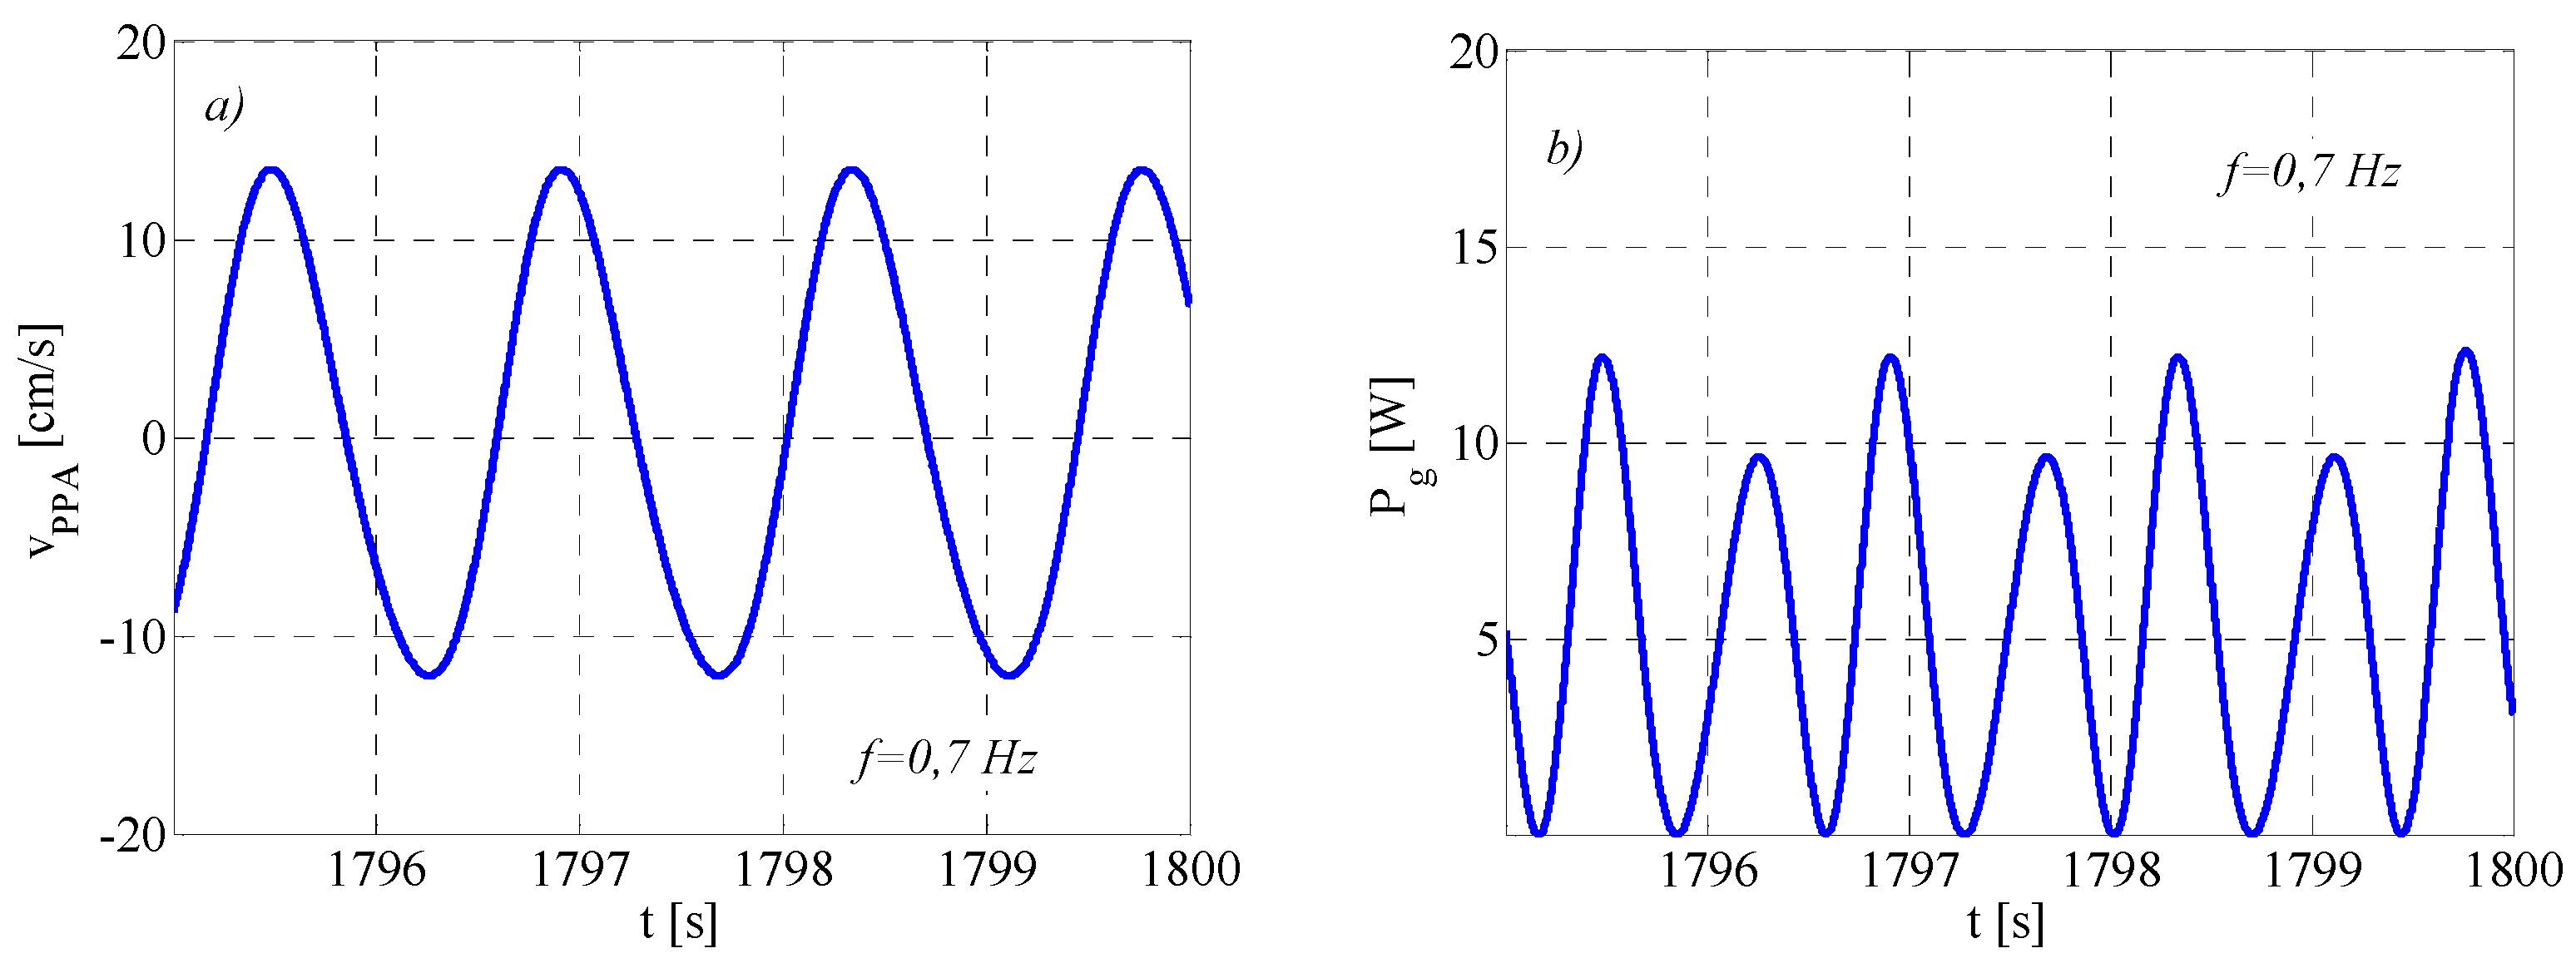
6. Numerical Results

In order to verify the effectiveness of the proposed P&O, some numerical analysis were carried out in the Matlab Simulink™ (MathWorks, Natick, MA, USA) environment. In particular, the P&O control strategy was tested for three values of the wave frequency: 0.7 Hz, 0.8 Hz, and 0.9 Hz. The wave amplitude was set to 5 cm, i.e., the test conditions reproduce the conditions reported in Section 3. The implemented control is shown in Figure 9, in which a block diagram synthetizes the P&O algorithm discussed in the previous section. It should be noted that the control law depends only on the measured WEC position.
Figure 10, Figure 11 and Figure 12 show the behaviors of the extracted average power P ¯ g and of the wave energy extraction strength kESS in the whole simulation interval, while Figure 13, Figure 14 and Figure 15 depict the steady state evolution corresponding to the maximum power point (MPP) of the piston speed v P P A and instantaneous generator power Pg. It can be noted that the maximum value of P ¯ g and the corresponding value of kESS agrees with the experimental results for all of the tested frequency values. Moreover, in steady state, while the kESS variation steps are evident, the average power extracted is practically constant, i.e., the induced power ripple by the proposed P&O is very small. In the worst-case scenario, with a fixed perturbation step, the control is able to track the MPP in less than 20 min. This result could be improved by adopting an adaptive perturbation step approach that could maintain excellent steady state performance while improving the transient response. Finally, the steady state results confirm the power ripple at twice the wave frequency. As expected, the power oscillations are asymmetrical in one period of the wave frequency. This behavior is confirmed by the waveform of the piston speed, which is not purely alternative.

7. Conclusions

In this work, an embedded PPA prototype has been tested in order to evaluate the increment of extracted power over a traditional heaving mode absorber. A FEM-based numerical model has been implemented in order to preliminarily evaluate the effectiveness of the proposed solution. A discordance between the numerical and experimental results has been found with respect to the extracted power. This difference is partially linked to the wave motion viscosity effect, which has been neglected in numerical analysis. Nevertheless, the experimental results, obtained at different wave frequency values, confirm the expected performance of the system, with an extracted power increase of about 30% with respect to the ideal heaving mode operation.
Finally, a P&O strategy has been proposed to be coupled with the PPA, that aims to track the maximum power extractable from the WEC during either transient or steady state conditions. The proposed technique is easy to be implemented, requires only one system status measurement (the WEC position), and is able to operate with good performance in a large range of operating conditions.
An evolution of this work could integrate an electrical storage system in order to filter out the WEC power oscillations, guaranteeing almost constant power flow to the grid. On the other hand, the P&O strategy could be updated by embedding a dynamic phase latch technique, to be implemented directly in a generalized control law.

Author Contributions

Andrea Del Pizzo and Marino Coppola studied the state of art and gave the main directions of abstract, introduction and conclusions. Gianluca Brando and Ivan Spina conceived the P&O algorithm and the relative numerical analysis. Adolfo Dannier and Domenico Pietro Coiro sized the experimental prototype and performed the tests in the towing tank. All the authors participated together to the writing phase of the article.

Conflicts of Interest

The authors declare no conflict of interest.

Abbreviations

A Wave amplitude
E c , k Energy extracted by the electric generator in the time interval ( t c , k 1 , t c , k )
E t Average stored energy per unit area of sea surface
f Wave frequency
F g The force acting on PTO piston
g Acceleration of gravity (9.81 m/s2)
H s Significant wave height
k E E S Wave energy extraction strength
k P P A Adjustable gain of the PTO
k W P The number of wave periods on which the time control interval is based
P ¯ b Mean power of the incident wave
P ¯ g Extracted average power from PTO
S ( f ) Wave energy spectrum
t c , k Generic control instant
T c Control strategy time interval
T W Wave period
v g Wave group speed
v P P A Piston speed
Δ k E E S Energy extraction strength step variation
ρMass density of sea water (1030 kg/m)

References

  1. European Commission. Communication from the Commission—Guidelines on State aid for Environmental Protection and Energy 2014–2020. Available online: http://eur-lex.europa.eu/legal-content/EN/TXT/?uri=CELEX%3A52014XC0628%2801%29 (accessed on 5 May 2016).
  2. Held, A.; Ragwitz, M.; Gephart, M.; de Visser, E. Design Features of Support Schemes for Renewable Electricity; Ecofys Consultancy: Utrecht, The Netherlands, 2014. [Google Scholar]
  3. Chiodo, E.; Lauria, D.; Pisani, C.; Villacci, D. Reliability aspects in wind farms design. In Proceedings of the International Symposium on Power Electronics, Electrical Drives, Automation and Motion (SPEEDAM 2012), Sorrento, Italy, 19–22 June 2012; pp. 577–581.
  4. Pisani, C.; Villacci, D.; Carlini, E.M.; Lauria, D. An integrated approach to improve the networks security in presence of high penetration of RES. In Proceedings of the International Symposium on Power Electronics, Electrical Drives, Automation and Motion (SPEEDAM 2014), Ischia, Italy, 20–22 June 2014.
  5. Low Carbon Technologies. Available online: https://ec.europa.eu/clima/policies/lowcarbon/index_en.htm (accessed on 11 May 2016).
  6. Chiodo, E.; Lauria, D.; Pisani, C.; Villacci, D. Wind farm production estimation under multivariate wind speed distribution. In Proceedings of the International Conference on Clean Electrical Power (ICCEP 2013), Alghero, Italy, 11–13 June 2013; pp. 745–750.
  7. Nathalie, R. Oceans of Energy: European Ocean Energy Roadmap 2010–2050; The International Conference on Ocean Energy (ICOE): Bilbao, Spain, 2010. [Google Scholar]
  8. Falnes, J. A review of wave-energy extraction. Mar. Struct. 2007, 20, 185–201. [Google Scholar] [CrossRef]
  9. Ross, D. Power from Sea Waves; Oxford University Press: Oxford, UK, 1995. [Google Scholar]
  10. Cruz, J. (Ed.) Ocean Wave Energy; Springer: Berlin, Germany, 2008.
  11. Mehrubeoglu, M.; McLauchlan, L.; Karayaka, B. Ocean Energy Conversion and Storage Prototypes for Wave, Current and Tidal Energy Generators. In Proceedings of the Green Technologies Conference (GreenTech), Corpus Christi, TX, USA, 3–4 April 2014.
  12. Carli, F.M.; Bonamano, S.; Marcelli, M.; Peviani, M.A. Existing Technologies for Marine Energy Production and Potentialities of Development along the Italian Coasts. In Proceedings of the Offshore Wind and Other Marine Renewable Energies in Mediterranean and European Seas (OWEMES), Brindisi, Italy, 21–23 May 2009.
  13. Antonio, F.D.O. Wave energy utilization: A review of the technologies. Renew. Sustain. Energy Rev. 2010, 14, 899–918. [Google Scholar]
  14. Vantorre, M.; Banasiak, R.; Verhoeven, R. Modelling of hydraulic performance and wave energy extraction by a point absorber in heave. Appl. Ocean Res. 2004, 26, 61–72. [Google Scholar] [CrossRef]
  15. Hager, R.; Fernandez, N.; Teng, M.H. Experimental study seeking optimal geometry of a heaving body for improved power absorption efficiency. In Proceedings of the 22nd International Offshore and Polar Engineering Conference (ISOPE-2012), Rhodes, Greece, 17–22 June 2012.
  16. Hardisty, J. Experiments with point absorbers for wave energy conversion. J. Mar. Eng. Technol. 2012, 11, 51–62. [Google Scholar]
  17. Zurkinden, A.S.; Ferri, F.; Beatty, S.; Kofoed, J.P.; Kramer, M.M. Non-linear numerical modelling and experimental testing of a point absorber wave energy converter. Ocean Eng. 2014, 78, 11–21. [Google Scholar] [CrossRef]
  18. Ionescu, D.; Ngwenya, B.S. Innovative design of a sea wave energy harnesser. In Proceedings of the International Conference on Renewable Energies and Power Quality (ICREPQ’14), Cordoba, Spain, 7–10 April 2014.
  19. Hansen, R.H.; Kramer, M.M.; Vidal, E. Discrete displacement hydraulic power take-off system for the Wavestar wave energy converter. Energies 2013, 6, 4001–4044. [Google Scholar] [CrossRef]
  20. Zhou, Z.; Benbouzid, M.; Charpentier, J.F.; Scuiller, F.; Tang, T. Energy Storage Technologies for Smoothing Power Fluctuations in Marine Current Turbines. In Proceedings of the International Symposium on Industrial Electronics, Hangzhou, China, 28–31 May 2012; pp. 1425–1430.
  21. Borgarino, B.; Multon, B.; Ahmed, H.B.; Aubry, J.; Bydlowski, P. Energy Storage System Sizing for Smoothing Power Generation of direct Wave Energy Converters. In Proceedings of the International Conference on Ocean Energy, Bilbao, Spain, 6–8 October 2010.
  22. Manchester, S.; Barzegar, B.; Swan, L.; Groulx, D. Energy storage requirements for in-stream tidal generation on a limited capacity electricity grid. Energy 2013, 61, 283–290. [Google Scholar] [CrossRef]
  23. Piegari, L.; Rizzo, R.; Spina, I.; Tricoli, P. Optimized adaptive perturb and observe maximum power point tracking control for photovoltaic generation. Energies 2015, 8, 3418–3436. [Google Scholar] [CrossRef]
  24. Brando, G.; Dannier, A.; del Pizzo, A.; di Noia, L.P.; Pisani, C. Grid connection of wave energy converter in heaving mode operation by supercapacitor storage technology. IET Renew. Power Gener. 2016, 10, 88–97. [Google Scholar] [CrossRef]
  25. Van Zyl, A.W.; Jeans, C.G.; Cruise, R.J.; Landy, C.F. Comparison of force-to-weight ratios between a single-sided linear synchronous motor and a tubular linear synchronous motor. In Proceedings of the IEEE International Electric Machines and Drives Conference (IEMDC ’99), Seattle, WA, USA, 9–12 May 1999.
  26. Coiro, D.P.; Troise, G.; Calise, G.; Bizzarrini, N. Wave energy conversion through a point pivoted absorber: Numerical and experimental tests on a scaled model. Renew. Energy 2016, 87, 317–325. [Google Scholar] [CrossRef]
  27. Sakr, A.H.; Anis, Y.H.; Metwalli, S.M. System frequency tuning for heaving buoy wave energy converters. In Proceedings of the 2015 IEEE International Conference on Advanced Intelligent Mechatronics (AIM), Pusan, Korea, 7–11 July 2015; pp. 1367–1372.
  28. Hazra, S.; Bhattacharya, S. Control of squirrel cage induction generator in an oscillating point absorber based wave energy conversion system. In Proceedings of the 2014 IEEE Applied Power Electronics Conference and Exposition (APEC 2014), Fort Worth, TX, USA, 16–20 March 2014; pp. 3174–3180.
  29. Sharaf, A.M.; El-Gammal, A.A. Optimal Variable Structure Self Regulating PSO-Controller for Stand-Alone Wave Energy Conversion Scheme. In Proceedings of the 2010 Fourth Asia International Conference on Mathematical/Analytical Modelling and Computer Simulation, Kota Kinabalu, Malaysia, 26–28 May 2010; pp. 438–443.
Figure 1. Schematic representation of the system. PTO: power take off.
Energies 09 00939 g001
Figure 2. Reduced scale prototype main dimensions.
Energies 09 00939 g002
Figure 3. Towing tank and towing carriage.
Energies 09 00939 g003
Figure 4. Scale model installed in the towing tank.
Energies 09 00939 g004
Figure 5. Test measured results for a wave frequency of 0.8 Hz and a wave amplitude of 5 cm.
Energies 09 00939 g005
Figure 6. Extracted average power P ¯ g vs. energy extraction strength kEES for different wave frequency values and for a 5 cm wave amplitude.
Energies 09 00939 g006
Figure 7. Numerical-experimental comparison for the hydrodynamic simulation model—piston speed.
Energies 09 00939 g007
Figure 8. Numerical-experimental comparison for the hydrodynamic simulation model—mechanical power output.
Energies 09 00939 g008
Figure 9. Maximum power point tracking (MPPT) control diagram. LVDT: linear variable differential transformer; PLL: phase locked loop; and P&O: perturb and observe.
Energies 09 00939 g009
Figure 10. Behavior in the whole simulation time window for f = 0.7 Hz of: (a) average extracted power; and (b) wave energy extraction strength.
Energies 09 00939 g010
Figure 11. Behavior in the whole simulation time window for f = 0.8 Hz of: (a) average extracted power; and (b) wave energy extraction strength.
Energies 09 00939 g011
Figure 12. Behavior in the whole simulation time window for f = 0.9 Hz of: (a) average extracted power; and (b) wave energy extraction strength.
Energies 09 00939 g012
Figure 13. Behavior in steady state conditions for f = 0.7 Hz of: (a) piston speed; and (b) instantaneous extracted power.
Energies 09 00939 g013
Figure 14. Behavior in steady state conditions for f = 0.8 Hz of: (a) piston speed; and (b) instantaneous extracted power.
Energies 09 00939 g014
Figure 15. Behavior in steady state conditions for f = 0.9 Hz of: (a) piston speed; and (b) instantaneous extracted power.
Energies 09 00939 g015
Table 1. Reduced scale prototype parameters. WEC: wave energy converter.
Main Dimensions of the WECDimensionUnit
Body height0.6m
Body width1.0m
Body weight (body + arms)32.5kg
Hinge moment of inertia (body + arms)21.65kg·m2
Draft0.2m
Body section at water level0.21m2
Immersed volume0.0325m3
Table 2. Ball screw brushless generator electro-mechanical characteristics.
AC Brushless with Ball-ScrewValueUnit
Power20kVA
Maximum Speed1200rpm
Maximum Frequency60Hz
Rated Voltage460V
Rated Current30A
Efficiency0.93-
Pole pairs3-
External Diameter0.28m
Magnetic stack length0.15m
Table 3. Update logic at each sampling interval for the wave energy extractor extraction strength.
kEES ComparisonEnergy ComparisonkEES Update Strategy
kEES,k−1 > kEES,k−2Ec,k > Ec,k−1kEES,k = kEES,k−1 + ΔkEES
kEES,k−1 > kEES,k−2Ec,k < Ec,k−1kEES,k = kEES,k−1 − ΔkEES
kEES,k−1 < kEES,k−2Ec,k > Ec,k−1kEES,k = kEES,k−1 − ΔkEES
kEES,k−1 < kEES,k−2Ec,k < Ec,k−1kEES,k = kEES,k−1 + ΔkEES

